


Languages
Pages
Legal

Cho, Liu i
AbstractThe Illinois Junior Academy of Science
CATEGORY Microbiology STATE REGION # __ 5
SCHOOL Illinois Math and Science Academy IJAS SCHOOL # 5048
CITY/ZIP Aurora 60506 SCHOOL PHONE (630) 907-5000
SPONSOR Ms. Marie Olszewski and Dr. Morris Kletzel
NAME OF SCIENTIST*Hyunjii (Justina) Cho GRADE 11
NAME OF SCIENTIST Jimmy Liu GRADE 11
* If this project is awarded a monetary prize, the check will be written in this scientist’s name, and it will be his/her responsibility to distribute the prize money equally among all participating scientists.
PROJECT TITLE: The Analysis of Cancer Cells Through Examination of Morphology, Gene Expression, and Effects of Dichloroacetate
Purpose: Cancer currently stands as one of the leading causes of death. Recent studies have shown that “stem cells are the source of at least some, and perhaps all, cancers.” (NYTIMES, 2006). With this fairly recent breakthrough in cancer research, we aimed to detect the differences in morphology, gene expression, and the response to DCA, if any, between normal and cancer stem cells.
Procedure: We removed the mononuclear cells or stem cells by creating a density gradient with Ficoll-Paque. Once we extracted the mononuclear cells, we made our cell cultures. To determine how much the cells proliferated, we performed a cell count; then, we checked the cell viability. Flow cytometry and occasional RT-PCR procedures were followed and several different concentrations of DCA diluted in RPMI were given to cell culture. Finally, we observed the differences between cancerous and normal cells. Conclusion: Our research has shown that the concentration of DCA has a negative correlation with the amount of viable cells, thus successfully eradicating cancer cells by promoting apoptosis. Further concurrent tests conducted with DCA involve non-cancerous cells; if DCA is shown to have no effect on normal cells, then cancer research will be transformed.
Cho, Liu ii
Safety SheetThe Illinois Junior Academy of Science
Directions: The student is asked to read this introduction carefully, fill out the bottom of this sheet, and sign it. The science teacher and/or advisor must sign in the indicated space.
SAFETY AND THE STUDENT: Experimentation or research may involve an element of risk or injury to the student and to others. Recognition of such hazards and provision for adequate control measures are joint responsibilities of the student and the sponsor. Some of the more common risks encountered in research are those of electrical shock, infection from pathogenic organisms, uncontrolled reactions of incompatible chemicals, eye injury from materials or procedures, and fire in apparatus or work area. Countering these hazards and others with suitable controls is an integral part of good scientific research.In the space below, list the principal hazards associated with your project, if any, and what specific measures you have used as safeguards. Be sure to read the entire section in the Policy and Procedure Manual of the Illinois Junior Academy of Science entitled "SAFETY GUIDELINES FOR EXPERIMENTATION" before completing this form.
Safety Hazards:Use of human bloodUse of Dichloroacetate
Safety Precautions:Universal Safety PrecautionsAlways wear a lab coat, gloves, and lab goggles.Since dichloroacetate is corrosive, it needs to be handled with care.We always work under the supervision of our mentor
SIGNED________________________________________________________________________Student Exhibitor(s)
SIGNED________________________________________________________________________Sponsor**As a sponsor, I assume all responsibilities related to this project.
Cho, Liu iii
Humans as Test Subjects EndorsementThe Illinois Junior Academy of Science
THESE RULES WILL BE STRICTLY ENFORCED FOR THE STATE SCIENCE EXPOSITION. NO REGION SHOULD SEND A PROJECT TO THE STATE EXPOSITION THAT DOES NOT MEET THESE REGULATIONS.Students and sponsors doing a human vertebrate project must complete this form. The signature of the student or students and the sponsor indicates that the project was done within these rules and regulations. Failure to comply with these rules will mean the disqualification of the project at the state level. This form must follow the safety sheet in the project paper.(1) Humans must not be subjected to treatments that are considered hazardous and that could result in undue stress, injury, or death to the subject.(2) No cultures involving humans (mouth, throat, skin, or otherwise) will be allowed. However, cultures obtained from reputable biological suppliers or research facilities are suitable for student use.(3) Quantities of food and non-alcoholic beverages are limited to normal serving amounts or less. Normal serving amounts must be substantiated with reliable documentation. This documentation must be attached to the Humans as Test Subjects Endorsement form. No project may use over-the-counter or prescription drugs or any other chemical agents in order to measure their effect on a person.(4) The only human blood that may be used is that which is either purchased or obtained from a blood bank, hospital, or laboratory. No blood may be drawn by any person or from any person specifically for a science project. This rule does not preclude a student making use of data collected from blood tests not made exclusively for a science project.(5) Projects that involve exercise and its effect on pulse, respiration rate, blood pressure, and so on are allowed provided the exercise is not carried to the extreme. Electrical stimulation is not permitted. A valid, normal physical examination must be on file for each test subject. Documentation of same must be attached to the Humans as Test Subjects Endorsement form.(6) Projects that involve learning, ESP, motivation, hearing, vision, and surveys require the Humans as Test Subjects form.In this space, briefly describe the use of humans in your project. Use the back of page if necessary.
The signatures of the student or students and sponsor below indicate that the project conforms to the above rules of the Illinois Junior Academy of Science.
_________________________________________ ________________________________(Sponsor) (Student)
_________________________________ _________________________________________(Date) (Student)This form MUST be displayed on the front of the exhibitor’s display board. It may be reduced to 4.25” x 5.5
The blood that is being used in our experiment comes from the Children’s Memorial Hospital. We also used K562, a cancer cell line, which has been cultured in the stem cell laboratory at the Children’s Memorial Hospital. Patient information is kept confidential.

Cho, Liu 1
The Analysis of Cancer Cells through Examination of Morphology, Gene Expression,
and Effects of Dichloroacetate
Hyunjii Cho and Jimmy Liu
Illinois Mathematics and Science Academy

Cho, Liu 2
Table of Contents
Abstract i
Safety Sheet ii
Endorsements iii
Title Page 1
Table of Contents 2
Acknowledgements 3
Purpose and Hypothesis 4
Review of Literature 5
Materials 10
Methods of Procedure 13
Results 17
Discussion 23
Conclusion 26
Reference 27

Cho, Liu 3
Acknowledgements
We would like to thank Ms. Marie Olszewski, Dr. Morris Kletzel, and Wei Huang
for their continual support, valuable advice, and expert guidance throughout our
experiment. Without their help, our project would not have been possible. Also, we
would like to thank Ms. Judith A. Scheppler for her dedication to the Student Inquiry and
Research program.

Cho, Liu 4
Purpose
Many scholarly journals are delving into the depths of stem cell research; experts
have reason to believe that it is through stem cells that the cure for cancer will eventually
be discovered. Past studies on cancer focused on shrinking tumors by destroying cancer
cells, yet disregarded the remaining stem cells that spurn more cancer cells. This
investigation focuses on elucidating the mechanisms through which cancer operates. We
will do utilize cell surface markers, compare gene expression, and examine the
morphology of the stem cells. The main focus of the experiment will be to test the
efficacy of a novel new cancer-target drug called dichloroacetate through various assays
and cultures of the human myeloid leukemia K562 cell line. We hope to provide a basis
for further investigation in the search for the cure to cancer.
Hypothesis
We hypothesized that DCA would have a positive effect in restoring normal
apoptosis, or programmed cell death, in cancer cells, and effectively prohibit cell
proliferation. We also hypothesized that DCA would leave normal cells unaffected.

Cho, Liu 5
Review of Literature
In today’s rapidly evolving scientific world, much advancement has been made in
the field of cancer research. Because cancer stands as one of the leading causes of death,
we thought it would be worthwhile to contribute to the elucidation of mechanisms of
cancer. This research covers a wide array of topics, including cancer cell lines, stem cells,
dichloroacetate, stem cell markers, flow-cytometry, and polymerase chain reactions
(PCR). Selected literature is both pertinent and applicable to the experiment.
Hematopoietic stem cells are isolated from the peripheral blood or bone marrow
and are capable of self-renewal and differentiation into specialized cells. Apoptosis,
programmed cell death, is necessary in order to prevent an excessive number of cells.
Normal apoptotic functions are not present in cancerous stem cells, allowing unlimited
cell regeneration. In healthy stem cell division, the cell regenerates itself and also creates
a progenitor cell. Although the progenitor cell cannot regenerate itself, it is capable of
dividing indefinitely into mature specialized cells (Lee & Herlyn, 2007). The progenitor
cell then matures and become a specialized cell.
Stem cells are characterized by both “self-renewal and their ability to produce
cells that differentiate” (Morrison & Kimble, 2006), called progenitor cells. Stem cells
divide using two strategies: Asymmetric and Symmetric stem-call divisions. In
asymmetric stem-cell division, stem cells divide to produce one identical daughter of
itself, and one daughter that is capable of differentiating. Through this process, stem cells
are unable to expand in number and thereby unable to produce stem-cell pools that are
needed for development and for cell regeneration after injury. Therefore, there must be
another method that stem cells utilize to maintain control of their numbers. “Symmetric

Cho, Liu 6
divisions are defined as the generation of daughter cells that are destined to acquire the
same fate.” (Morrison et al., 2006). Through symmetric division, stem cells are able to
divide into two stem cell daughter cells or two progenitor cells. Most stem cells are able
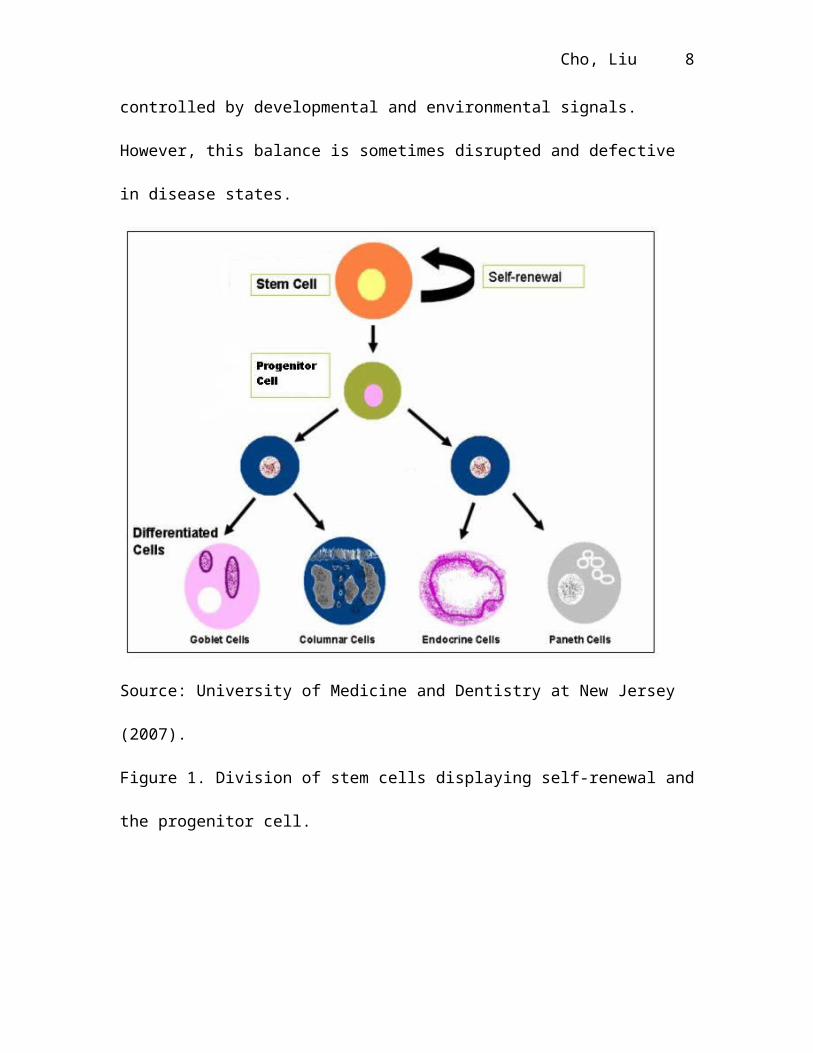
to divide both asymmetrically and symmetrically, and these two modes are controlled by
developmental and environmental signals. However, this balance is sometimes disrupted
and defective in disease states.
Source: University of Medicine and Dentistry at New Jersey (2007).
Figure 1. Division of stem cells displaying self-renewal and the progenitor cell.
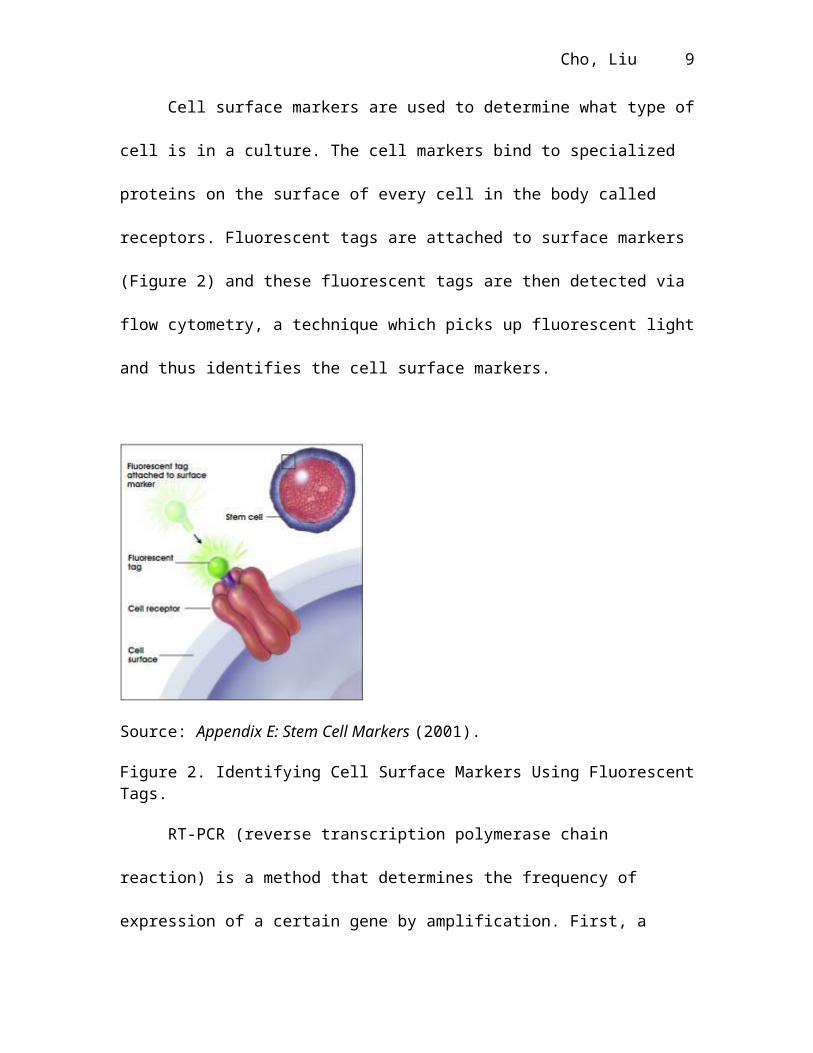
Cell surface markers are used to determine what type of cell is in a culture. The
cell markers bind to specialized proteins on the surface of every cell in the body called

Cho, Liu 7
receptors. Fluorescent tags are attached to surface markers (Figure 2) and these
fluorescent tags are then detected via flow cytometry, a technique which picks up
fluorescent light and thus identifies the cell surface markers.
Source: Appendix E: Stem Cell Markers (2001).
Figure 2. Identifying Cell Surface Markers Using Fluorescent Tags.
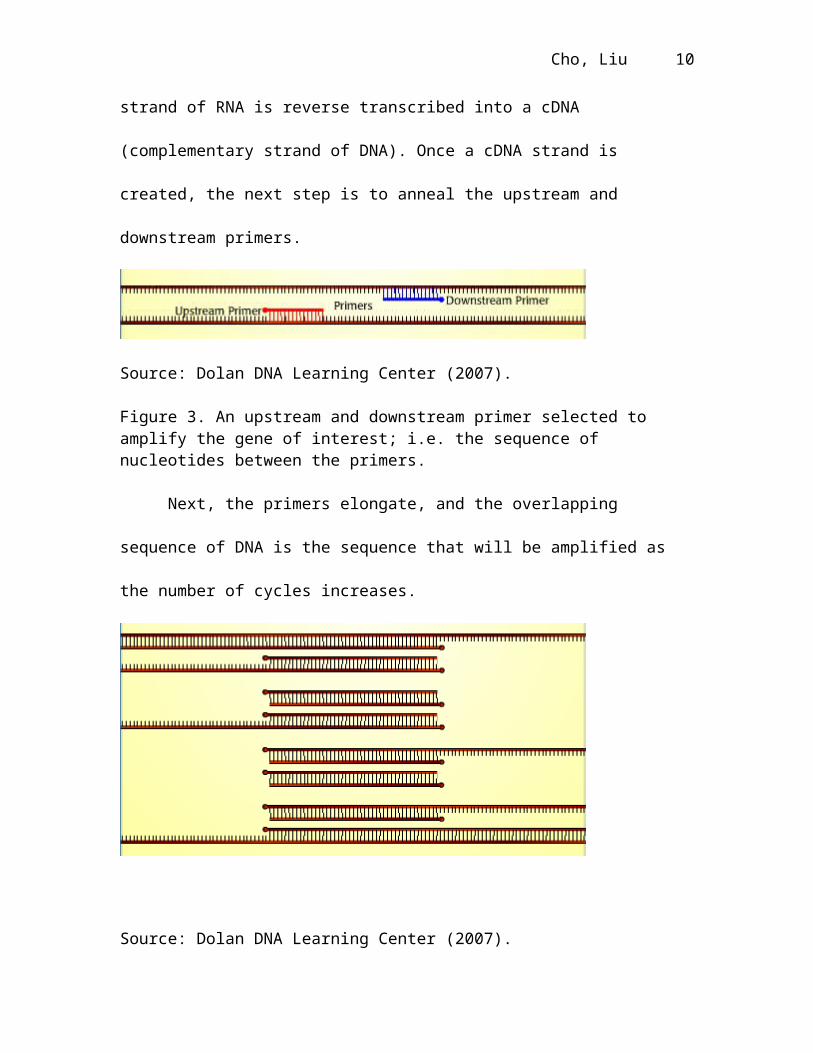
RT-PCR (reverse transcription polymerase chain reaction) is a method that
determines the frequency of expression of a certain gene by amplification. First, a strand
of RNA is reverse transcribed into a cDNA (complementary strand of DNA). Once a
cDNA strand is created, the next step is to anneal the upstream and downstream primers.
Source: Dolan DNA Learning Center (2007).
Figure 3. An upstream and downstream primer selected to amplify the gene of interest; i.e. the sequence of nucleotides between the primers.

Cho, Liu 8
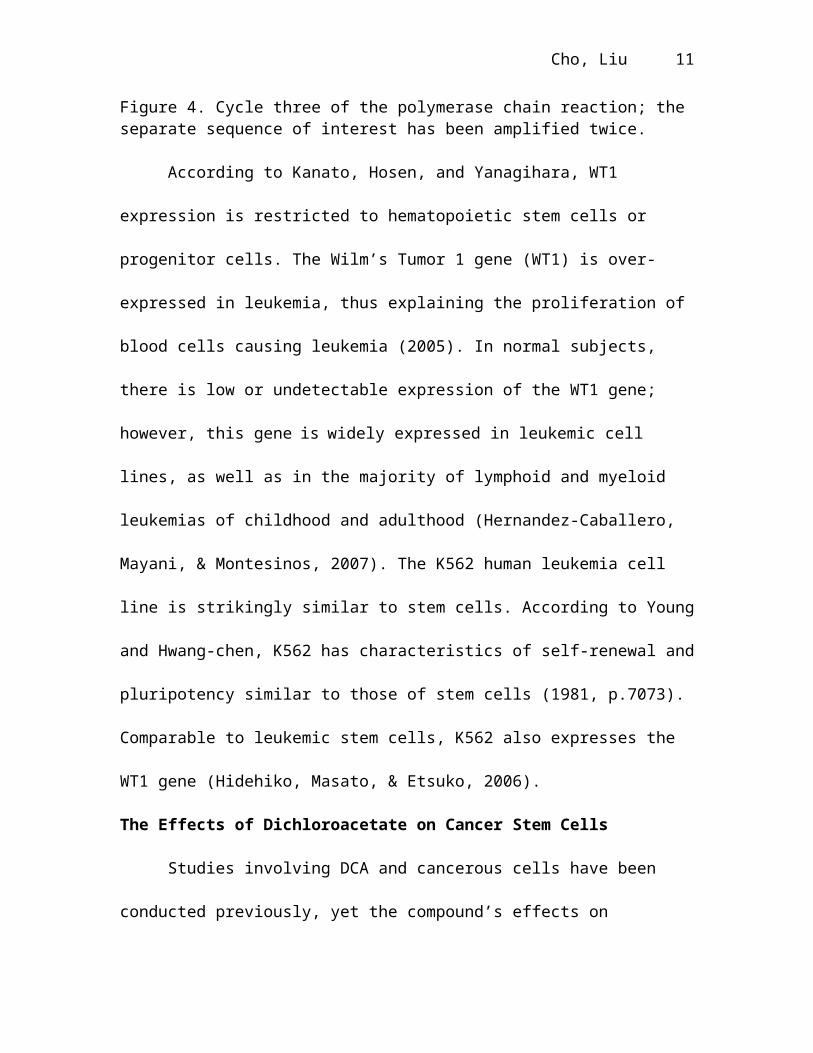
Next, the primers elongate, and the overlapping sequence of DNA is the sequence
that will be amplified as the number of cycles increases.
Source: Dolan DNA Learning Center (2007).
Figure 4. Cycle three of the polymerase chain reaction; the separate sequence of interest has been amplified twice.
According to Kanato, Hosen, and Yanagihara, WT1 expression is restricted to
hematopoietic stem cells or progenitor cells. The Wilm’s Tumor 1 gene (WT1) is over-
expressed in leukemia, thus explaining the proliferation of blood cells causing leukemia
(2005). In normal subjects, there is low or undetectable expression of the WT1 gene;
however, this gene is widely expressed in leukemic cell lines, as well as in the majority of
lymphoid and myeloid leukemias of childhood and adulthood (Hernandez-Caballero,
Mayani, & Montesinos, 2007). The K562 human leukemia cell line is strikingly similar to
stem cells. According to Young and Hwang-chen, K562 has characteristics of self-
renewal and pluripotency similar to those of stem cells (1981, p.7073). Comparable to
leukemic stem cells, K562 also expresses the WT1 gene (Hidehiko, Masato, & Etsuko,
2006).
The Effects of Dichloroacetate on Cancer Stem Cells
Cho, Liu 9
Studies involving DCA and cancerous cells have been conducted previously, yet
the compound’s effects on cancerous stem cells may prove to yield results that will aid in
the detection of differences between cancerous and healthy stem cells. Cancerous cells
are characterized by apoptosis resistance. Factors that promote the absence of apoptosis
include lowered expression of the K+ channel Kv1.5 and higher mitochondrial membrane
potential. DCA activates Kv channels in all cancer cells, but not normal cells. These
effects collectively restore apoptosis, which, in turn, should result in the death of cancer
cells and shrinkage of tumors (Bonnet, et al., 2007). In order to determine if DCA has the
same effects on undifferentiated cancerous stem cells as on differentiated cancerous
mature cells, we will conduct two experiments; each will have a control group (no DCA
applied), and several experimental groups (DCA applied in varying concentrations). We
will then perform a cell count and graph the growth over time. If DCA has the same
effects on stem cells as on mature cells (restore apoptosis in cancerous cells only, leaving
healthy cells unaffected), then the experimental group (with DCA) in the leukemic stem
cell experiment should experience a slower growth in cell number as time progresses. In
addition, the experimental group (with DCA) in the healthy stem cell experiment should
exhibit the same growth patterns as the control group, proving that DCA has no effect on
healthy stem cells ((Bonnet, et al., 2007). Does DCA have an innocuous effect on normal
cells and provide to be a promising solution to eradicating cancer cells?
Cho, Liu 10
Materials
Because multiple trials were conducted in order to ensure a large sample size and
therefore accurate results, the quantity of materials required is indefinite.
Isolating mononuclear cells by creating a density gradient
1L 1:2 Ratio, Ficoll-Paque to Blood
1L Phosphate-buffered Saline (PBS)
Test tubes
One (1) Centrifuge
Pipettes
Blood
Micropipettes (One of each: 1000μL, 100μL, 10μL)
Dichloroacetate (DCA)
1mL Dichloroacetate 99% concentration
1L RPMI tissue culture
Ten (10) 50mL large test tubes
Micropipettes (One of each: 1000μL, 100μL, 10μL)
Culturing Cells
1L RPMI Medium
Ten (10) Cell Plates with twenty-four (24) wells each
One (1) Incubator
Cho, Liu 11
5mL GMSF Cytokine
Pipettes
Cell Count
One (1) Cell-Dyn cell counter
Cells to count
Cell Viability
One (1) Hemacytometer
One (1) Microscope
10 mL Trypan Blue
One (1) Manual cell counter
Reverse Transcriptase Polymerase Chain Reaction
RNA Primers
Thermo-cycler
RNA Polymerase
Agarose Gel Electrophoresis
Flow Cytometry
Flow Cytometer
Reagents
Cho, Liu 12
Explanation of Materials and Apparatus.
Ficoll-Paque creates a density gradient.
Centrifuge is used to spin samples in test tubes in order to extract the accumulated pellet
of mononuclear cells.
GMSF Cytokine stimulates cell proliferation.
Cell Dyne cell counter is used by inserting the needle into the sample and pressing the
lever behind it.
Hemacytometer is used as a slide to view the cells treated with trypan blue under a
microscope for cell viability.
Trypan Blue permeates into dead cells; therefore it is used to discern dead and live cells.
Cho, Liu 13
Methods of Procedure
Isolating mononuclear cells by creating a density gradient
A. Take an initial cell count (Pre-dilution (purely blood))
a. Mix the sample well.
b. Put the needle into sample.
c. Initiate the Cell Dyne cell counter by pressing the pedal.
d. Wait for data
B. Create a density gradient
a. Add Ficoll-Paque to a test tube
i. Label the test tube.
ii. Avoid touching the Ficoll-Paque bottle in order to keep the sample
sterile.
b. Dilute the blood sample by adding a ratio of 1:1 of PBS:blood.
c. Mix well.
d. Add the diluted sample slowly to the Ficoll (1 Ficoll: 2 Blood)
e. Place the test tube in centrifuge
i. Balance with a similar weight test tube
ii. Run at 3000rpm for 10 minutes with no brake
f. Remove from the centrifuge. Separated cells should look like Figure 1.
Cho, Liu 14
Figure 1. Density gradient using Ficoll-paque.
C. Remove the mononuclear cells
a. Remove half of the plasma/PBS
b. Put the mononuclear cells into a new test tube
D. Wash cells
a. Fill the remainder of the test tube containing mononuclear cells with PBS
b. Mix well.
c. Place the test tube into centrifuge
d. Remove from centrifuge and pour out PBS/plasma. Cells should appear as
a pellet at the bottom (Figure 2).
Cho, Liu 15
Figure 2. Pellet at the bottom of a test tube formed from the accumulation of mononuclear cells.
E. Prepare to take a final cell count
a. Add 2mL of RPMI tissue culture to your pellet of cells.
b. Mix well to break up cell pellet.
c. Take cell count using the Cell Dyne machine.
Culturing Cells
Preparing to culture cells
A. Use bleach to disinfect the hood.
B. Calculate the amount of cells per well (1.0 x 10^6 cells)
C. Add RPMI to cells to fill cell well to 1mL
D. Pipette desired amount of cells to each well
E. Place in incubator
a. Add autoclaved deionized bottom tray of incubator
b. Add cupric sulfate to bottom tray of incubator

Cho, Liu 16
Cell Count
A. Obtain sample and operate the Cell Dyn 1700 machine
B. Place the needle of the Cell Dyn 1700 machine into the sample and press the lever
to activate the cell counter.
Cell Viability with Trypan Blue
A. Extract 10 µL of the cell sample and place it in small test tube
B. Add 20 µL of trypan blue to the cells and mix well
C. Extract 10 µL of mixture and pipette into hemocytometer, which should be
cleaned with alcohol pads
D. View the contents on the hemacytometer under a microscope.
E. Count the number of viable cells and the number of dead cells. (Dead cells are
permeated with trypan blue, while live cells contain no blue color and instead
emanate a glow)
DCA Concentration tests
A. Calculate the amount of DCA needed to make specific molar concentrations
B. Mix DCA with RPMI to make x Molar solution
C. Fill plate wells to 1mL.

Cho, Liu 17
Results
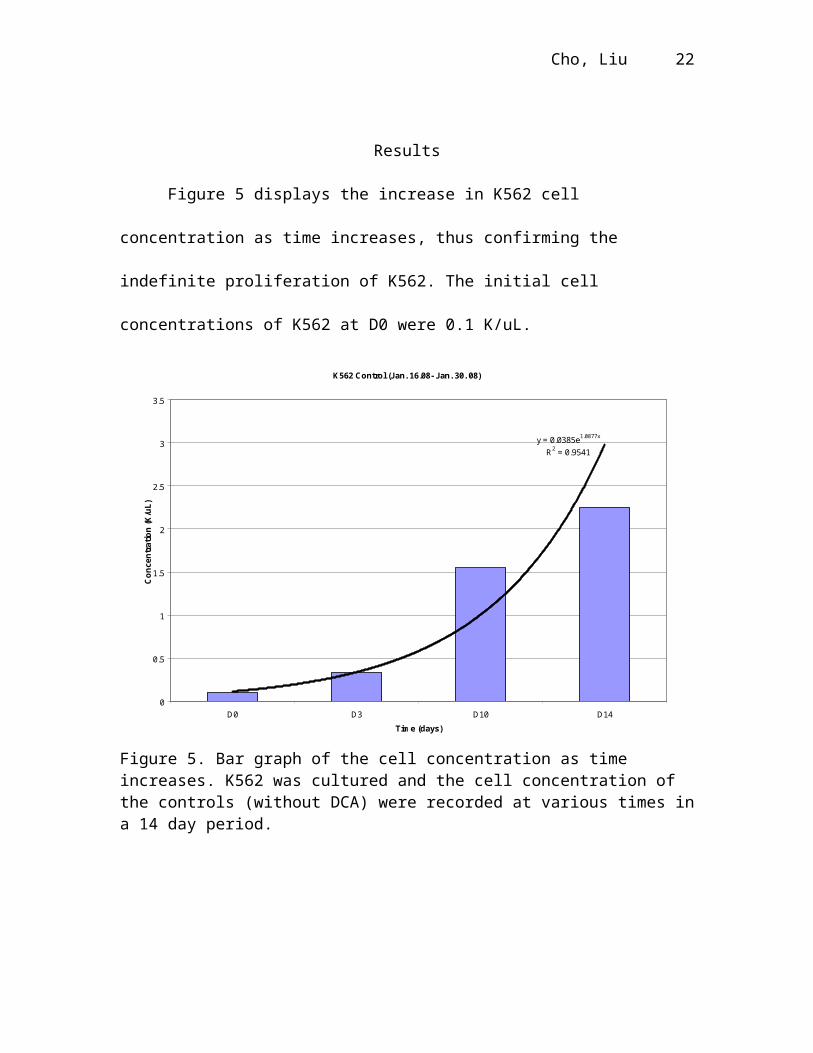
Figure 5 displays the increase in K562 cell concentration as time increases, thus
confirming the indefinite proliferation of K562. The initial cell concentrations of K562 at
D0 were 0.1 K/uL.
K562 Control (Jan. 16.08- Jan. 30. 08)
y = 0.0385e1.0877x
R2 = 0.9541
0
0.5
1
1.5
2
2.5
3
3.5
D0 D3 D10 D14
Time (days)
Co
nce
ntr
atio
n (
K/u
L)
Figure 5. Bar graph of the cell concentration as time increases. K562 was cultured and the cell concentration of the controls (without DCA) were recorded at various times in a 14 day period.
Cho, Liu 18
The graph in figure 6 displays a decrease in cell concentration of K562 as the DCA
concentration increases.
Figure 6. Protocol a: The effects of increasing DCA concentration on the cell concentration of K562. Cell concentration (K/uL) of K562 cell cultures with no DCA and cultures with 2.5 mM, 5mM, 10mM, and 20mM were observed after 168hrs after the addition of DCA.
The highest concetrations of DCA from protocol a were tested again in another
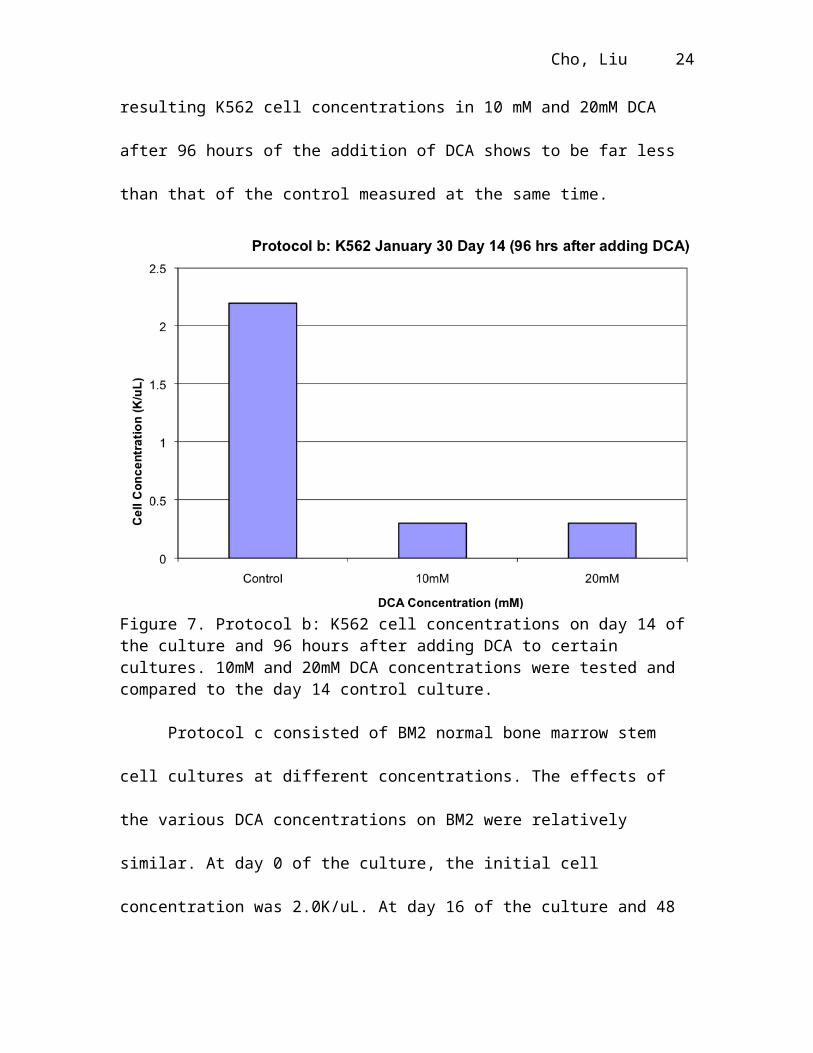
set of experiments, protocol b. The resulting K562 cell concentrations in 10 mM and
20mM DCA after 96 hours of the addition of DCA shows to be far less than that of the
control measured at the same time.

Cho, Liu 19
Figure 7. Protocol b: K562 cell concentrations on day 14 of the culture and 96 hours after adding DCA to certain cultures. 10mM and 20mM DCA concentrations were tested and compared to the day 14 control culture.
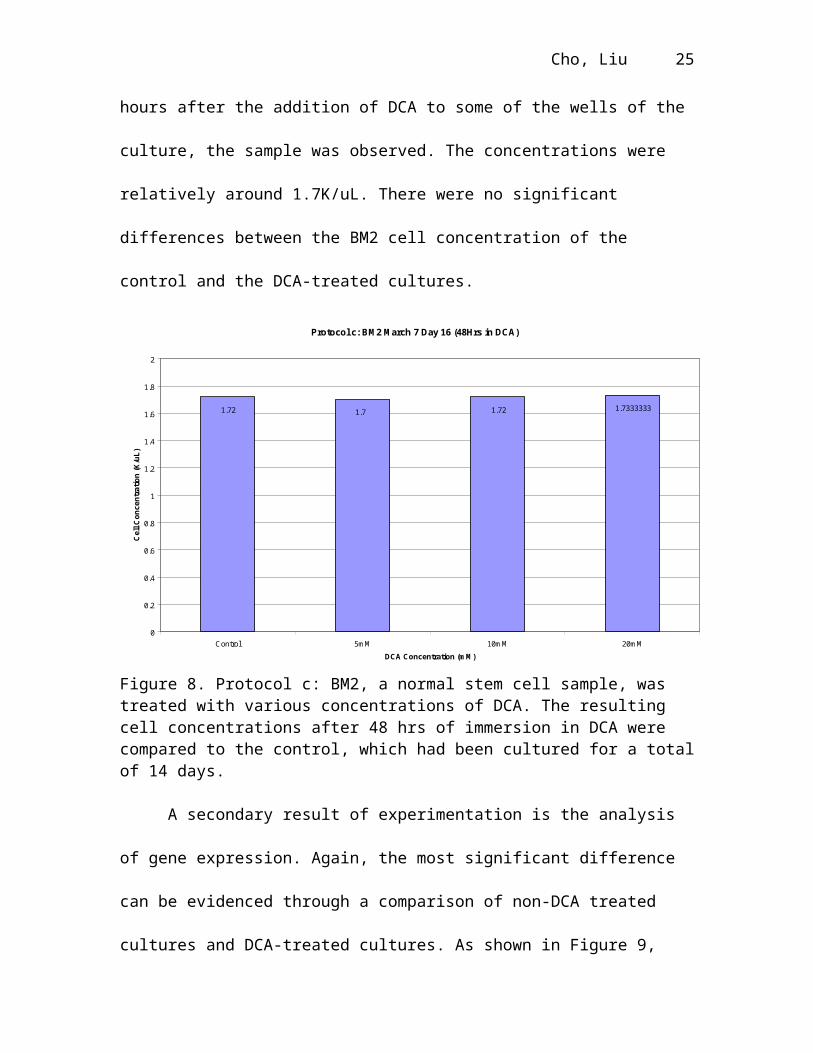
Protocol c consisted of BM2 normal bone marrow stem cell cultures at different
concentrations. The effects of the various DCA concentrations on BM2 were relatively
similar. At day 0 of the culture, the initial cell concentration was 2.0K/uL. At day 16 of
the culture and 48 hours after the addition of DCA to some of the wells of the culture, the
sample was observed. The concentrations were relatively around 1.7K/uL. There were no
significant differences between the BM2 cell concentration of the control and the DCA-
treated cultures.

Cho, Liu 20
Protocol c: BM2 March 7 Day 16 (48Hrs in DCA)
1.72 1.7 1.72 1.7333333
0
0.2
0.4
0.6
0.8
1
1.2
1.4
1.6
1.8
2
Control 5mM 10mM 20mM
DCA Concentration (mM)
Ce
ll C
on
ce
ntr
ati
on
(K
/uL
)
Figure 8. Protocol c: BM2, a normal stem cell sample, was treated with various concentrations of DCA. The resulting cell concentrations after 48 hrs of immersion in DCA were compared to the control, which had been cultured for a total of 14 days.
A secondary result of experimentation is the analysis of gene expression. Again,
the most significant difference can be evidenced through a comparison of non-DCA
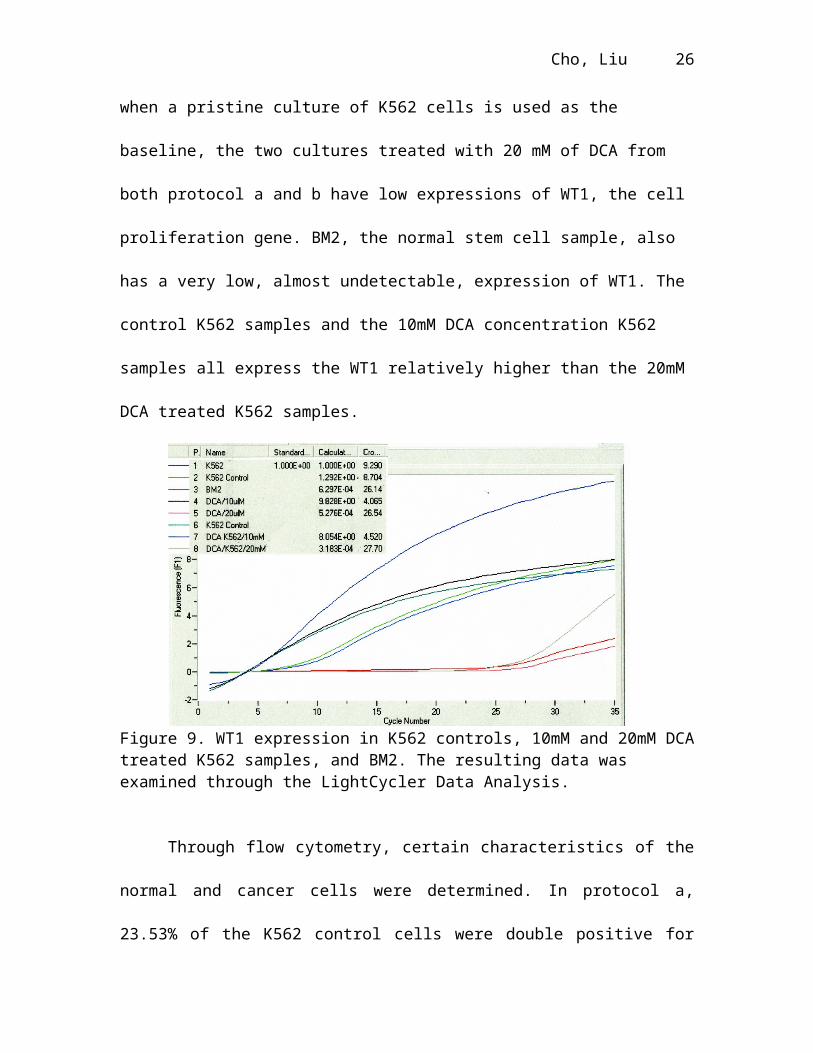
treated cultures and DCA-treated cultures. As shown in Figure 9, when a pristine culture
of K562 cells is used as the baseline, the two cultures treated with 20 mM of DCA from
both protocol a and b have low expressions of WT1, the cell proliferation gene. BM2, the
normal stem cell sample, also has a very low, almost undetectable, expression of WT1.
The control K562 samples and the 10mM DCA concentration K562 samples all express
the WT1 relatively higher than the 20mM DCA treated K562 samples.

Cho, Liu 21
Figure 9. WT1 expression in K562 controls, 10mM and 20mM DCA treated K562 samples, and BM2. The resulting data was examined through the LightCycler Data Analysis.
Through flow cytometry, certain characteristics of the normal and cancer cells
were determined. In protocol a, 23.53% of the K562 control cells were double positive
for CD123 and CD 34. CD123 is a cell surface marker for cells capable of proliferation,
while CD34 is a marker for hematopoietic stem cells. The percentage of cells that are
both positive steadily increases as the concentration increases. Table 1 shows the results
of flow cytometry detecting the markers of CD 123 and CD34 on the control K562, K562
treated with 10mM DCA, and K562 treated with 20 mM DCA.
Tabe 1. The percentage of cells that are both CD123 and CD34. Flow cytometry was performed to determine the types of cell surface markers on the cells.
Protocol a CD123+ and CD34+K562 control 28.53%10mM DCA treated 49.86%20mM DCA treated 48.95%
Flow cytometry was also performed on normal stem cells and only 1.50% of the cells
were both CD123 and CD34 positive.
Cho, Liu 22
Cho, Liu 23
Discussion
The results of this experimentation provide a foundation on which to continue
furthering studies in oncology. This research covers gene expression, analysis of DCA,
and morphology. Because obtaining stem cells was difficult, much of this experiment was
based on the K562 cell line. The K562 leukemia cell exhibit the WT1 gene, similarly to
leukemia stem cells and also has “properties of self-renewal and pluripotency similar to
those of the hematopoietic stem cell” (Young & Hwang-Chen, 1981).
In the first set of experiments (protocol a), various concentrations of DCA were
tested on cultures of K562 that initially began at concentrations of 0.1K/uL: K562 control
group (n=2), K562 group with 2.5mM (n=2), 5mM DCA (n=2), K562 group with 10mM
DCA (n=2), and 20mM DCA. The control group, which was not treated with DCA,
continued normal cell proliferation. The DCA-treated groups exhibited a decreased
concentration of cells (Figure 6), indicating decreased cell proliferation. 10 mM and 20
mM DCA concentrations were chosen for the second set of experiments (protocol B) on
K562 because they exhibited almost no increase in cell concentration. The initial cell
concentration was 0.1 K/uL, while the cell concentrations of K562 cells in 10mM and
20mM DCA for 168hrs only had 0.2 K/uL cell concentrations. This is not a significant
increase and can be accounted for by few trials, and human and machine (Cell Dyn 1700)
error. Protocol b confirmed that DCA may inhibit cell proliferation because it also
showed that cell concentrations did not increase significantly from the initial cell
concentration of 0.1 K/uL and they also did not proliferate as much as the control did
(Figure 7).
Cho, Liu 24
According to figure 8, DCA had no significant affect on the cell concentrations of
BM2. This shows that while DCA affects cancerous cells, it does not affect normal cells.
More tests will need to be performed on normal cells in the future, in order to wholly
support our conclusion. Due to the lack of normal bone marrow stem cells available, we
were not able to perform many tests on normal stem cells.
RT-PCR was performed on protocol a and protocol b. The expression of WT1 in
protocol a and b was measured through RT-PCR. In protocol a, the K562 group treated
with 10mM of DCA showed that the cells still expressed the Wilm’s tumor 1 gene
(WT1), which regulates cell proliferation. However, the cells in protocol a that were
treated with 20mM of DCA did not significantly exhibit the WT1 gene. The test was
repeated for protocol b and similar results were achieved. This shows that as the
concentration of DCA increases, the proliferation of cancer cells was inhibited.
Our findings in the morphology through analysis of stem cell markers contradict
the discoveries in WT1 expression. Through flow cytometry, we found that the
percentage of K562 cells that are both CD123 and CD 34 positive increases as the
concentration of DCA increases. This means that the percentage of K562 cells that are
capable of proliferating have a positive correlation with DCA concentrations. The stem
cell marker CD123 may be present on cells for more than just capability of proliferation;
therefore, the RT-PCR results would prove to be more reliable. Gene expression is more
specific in determining function than the stem cell markers. In order to understand why
the two assays disagree, one would have to investigate whether other factors cause the
presence of CD123 on cells.

Cho, Liu 25
The prospect of dichloroacetate as a novel, therapeutic cancer treatment is
realistic because it restores mitochondrial function, one of the fundamental pathways
unique to the progression of cancer. Additionally, as it has been used for many decades in
the treatment of metabolic diseases, it is known to be relatively non-toxic (Bonnet, et al.,
2007). The most significant property of dichloroacetate is that it has no effect on normal
cells (Bonnet, et al., 2007).
Cho, Liu 26
Conclusion
Our results corroborate our hypothesis that dichloroacetate would inhibit cell
proliferation and are highly indicative of the veracity of DCA as a cancer-targeting drug.
The 20 mM DCA concentration seemed to be most effective. In protocol a, after 168 hrs
in 20mM DCA, K562 showed little to no proliferation. Protocol b showed similar results.
This, however, does little to show the affects of DCA on normal stem cells. Thus, we
tested 10 and 20mM concentrations of DCA on BM2 and found that the cell
concentrations did not significantly change. As evidenced in protocols a and b, these
results suggest that DCA decreases cell proliferation in cancer cells as its concentration
increase.
In the future, more tests on normal stem cells and cancer stem cells will need to
be performed. Since this is an ongoing project, we will aim to establish a more solid
foundation for the effectiveness of DCA by testing the DCA on a mixed culture of
normal and cancer stem cells.
Because it was difficult to obtain a sufficient amount of cancer and normal stem
cells, it was difficult to compare normal and cancerous stem cells. We were unable to do
multiple trials of the effect of DCA on normal stem cells. However, we determined that
using DCA as a future treatment for cancer is possible.
Cho, Liu 27
References
(2007). Gene Almanac. Retrieved March 5, 2008, from Dolan DNA Learning Center
Web site: http://www.dnalc.org/ddnalc/resources/pcr.html
(2007). Graduate School of Biomedical Sciences. Retrieved March 5, 2008, from
University of Medicine and Dentistry of New Jersey Web site:
http://www.umdnj.edu/gsbsnweb/stemcell/scofthemonth/scofthemonth2/gut/1.jpg
Appendix E: Stem Cell Markers (2001, June 17). Retrieved September 26, 2007, from
http://stemcells.nih.gov/info/scireport/appendixe
Bonnet, S., Archer, S. L., Allalunis-Turner, J., & Haromy, A.(2007). A
mitochondria-K+ channel axis is suppressed in cancer and its normalization
promotes apoptosis and inhibits cancer growth. Cancer Cell, 11, 37-51.
Breems, D., Löwenberg, B. (2007). Acute Myeloid Leukemia and the Position of
Autologous Stem Cell Transplantation. Semin Hematol.. 44, 259-266.
Hernandez-Cabellero, E., Mayani, H., Monetsinos, J.J., Arenas, D., Salamanca, F., &
Penaloza R.(2007). In vitro leukemic cell differentiation and WT1 gene
expression. Leukemia Research. 31(3), 395-397.
Hidehiko, A., Masato, W., Etsuko, T., Chikako, N., Itsuro, K., & Nobuhiko, E. (2006).
WT1 tumor gene study using real-time quantitative polymerase chain reaction.
Journal of Analytical Bio-Science. 29(3), 261-266.
Jørgensen, H., Holyoake, T. (2007). Characterization of cancer stem cells in chronic
myeloid leukaemia. Biochem Soc Trans.. 35, 1347-51.
Kanato, K., Hosen N., Yanagihara, M., Nakagata, N., Shirakata, T., & Nakasawa T.
(2005). The Wilms’ tumor gene WT1 is a common marker of progenitor cells in
Cho, Liu 28
fetal liver. Biochemical and Biophysical Research Communications. 326 (4), 836-
843.
Lee, J. T., & Herlyn, M. (2007). Old disease, new culprit: Tumor stem
cells in cancer [Electronic version]. Journal of Cellular Physiology.
213(3), 603-609. from PubMed.
Zou, G. (2007). Cancer stem cells in leukemia, recent advances. Journal of Cellular
Physiology, 213(2), 440-444.
Leukemia and Lymphoma Society. (2007, June). Leukemia Facts and Statistics.
Leukemia, Lymphoma, Myeloma Facts 2007-2008. Retrieved September 26,
2007, from http://www.leukemia-lymphoma.org/all_page?item_id=9346&
viewmode=print
Morrison, S. J., & Kimble, J. (2006). Asymmetric and symmetric
stem-cell divisions in development and cancer. Nature, 441, 1068-1074.
National Center for Health Statistics. (2007, October 4). Fast Stats A to Z.
Retrieved October 8, 2007, from http://0-www.cdc.gov.mill1.sjlibrary.org/
nchs/fastats/deaths.htm
National Institutes of Health. (2001, June 17). Hematopoietic Stem Cells. Stem Cell
Information. Retrieved September 16, 2007, from http://stemcells.nih.gov/
info/scireport/chapter5.asp
Nicholas, W. (2006, February 21). Stem Cells May Be Key to Cancer.
Retrieved September 12, 2007, from
http://www.nytimes.com/2006/02/21/health/21canc.html?_r=1&oref=slogin

Cho, Liu 29
Rajasekhar, V., & Dalerba, P.(2007). Stem Cells, Cancer, and Context Dependence. Stem
Cells. [electronic version]
Reya, T., Morrison, S. J., Clarke, M. F., & Weissman, I. L. (2001).
Stem cells, cancer, and cancer stem cells [Electronic version].
Nature, 414, 105-111.
Ru, Y., & Zhao, S. (2007). Ultrastructural Characteristics of Bone Marrow in Patients
with Hematological Disease: A Study of 13 Cases.. Ultrastruct Pathol. 5, 327-
332.
Sales, K., Winslet, M., & Seifalian A. (2007). Stem Cells and Cancer: An Overview.
Stem Cell Rev. [electronic version]
Young, N.S., & Hwang-Chen, S.P. (1981). Anti-K562 cell monoclonal antibodies
recognize hematopoietic progenitors. Proc Natl Acad Sci U S A. 11, 7073-7077.
Top Related