


Languages
Pages
Legal


Design of Benchmark Imagery for Validating Facility Annotation Algorithms
Randy Roberts 1, Paul Pope 2, Raju Vatsavai 3, Ming Jiang1, Lloyd Arrowood4, Tim Trucano 5, Shaun Gleason3, Anil Cheriyadat3, Alex Sorokine3, Aggelos Katsaggelos7,
Thrasyvoulos Pappas7, Lucinda Gaines2, Lawrence Chilton 6, and Ian Burns 2
IEEE International Geoscience and Remote Sensing SymposiumVancouver, BC
25-29 July 2010
1 LLNL, 2 LANL, 3 ORNL, 4Y-12, 5 SNL, 6 PNNL, 7Northwestern University
LLNL-PRES-490191
Lawrence Livermore National Laboratory, PO Box 808, Livermore CA 94551-0808This work performed under the auspices of the U.S. Department of Energy by Lawrence Livermore National Laboratory under Contract DE-AC52-07NA27344.
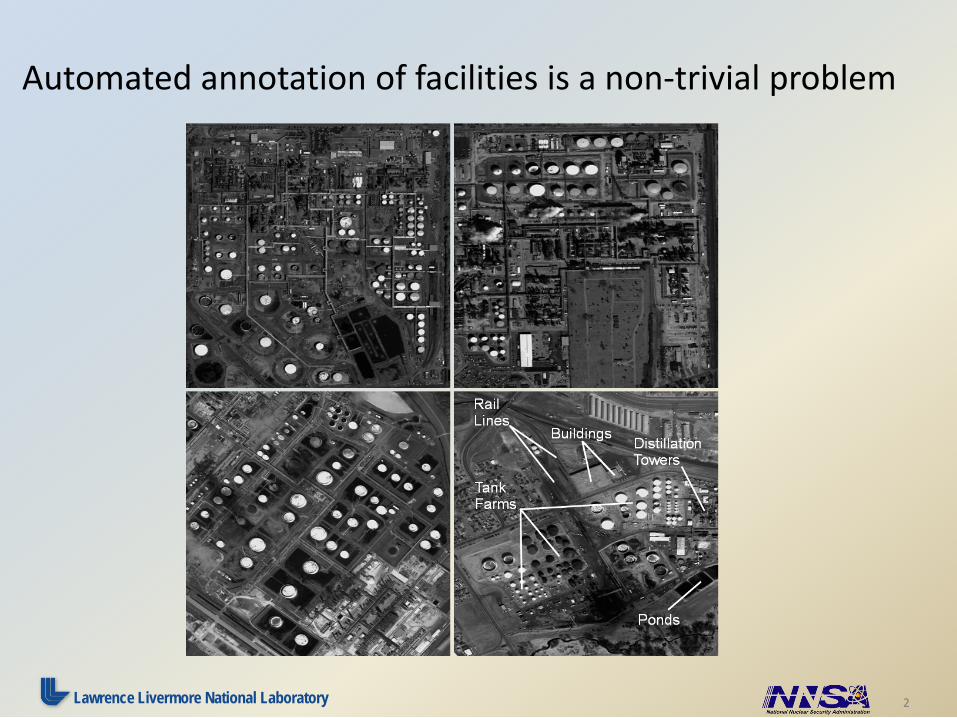
Automated annotation of facilities is a non-trivial problem
2Lawrence Livermore National Laboratory

Previous benchmarks for image annotation are not adequate for our purposes
3Lawrence Livermore National Laboratory
OIRDSPASCALCaltech 101
Good benchmark datasets drive algorithm research and development

Lots of factors in facility benchmark imagery
4Lawrence Livermore National Laboratory
Factor Levels (3 each) Intrinsic/Extrinsic
Facility Location Urban, Suburban, Rural Intrinsic
Facility Size Small, Medium, Large Intrinsic
Compactness Sparse, Moderate, Dense Intrinsic
Roof type Flat, Sloped, Multi-faceted Intrinsic
Building Size Small, Medium, Large Intrinsic
Time-of-Day Morning, Noon, Evening Extrinsic
Sensor View Angle Nadir, Low-Oblique, High-Oblique Extrinsic
Spatial Scale Small, Medium, Large Extrinsic
Visibility 5km, 10km, 20km Extrinsic
Cloud Cover Clear, Broken, Overcast Extrinsic
Season Summer, Fall, Winter Extrinsic
Climate Zone Tropical, Temperate, Arid Extrinsic
Number of Images for a Full Factorial-Design experiment (three images per combination) Nimages*(Levels)^Factors = 3*312 = 1,594,323 images

What objects and their spatial arrangements constitute a facility?
5Lawrence Livermore National Laboratory
The upper relationships indicate the types of industry
The lower relationships indicate parts (objects) that compose an industrial facility. They were derived in part by analysis of nouns in the paper:
“Industrial Components---A Photo Interpretation Key on Industry,” T. Chisnell and G. Cole, Photogrammetric Engineering, vol 24, March 1958
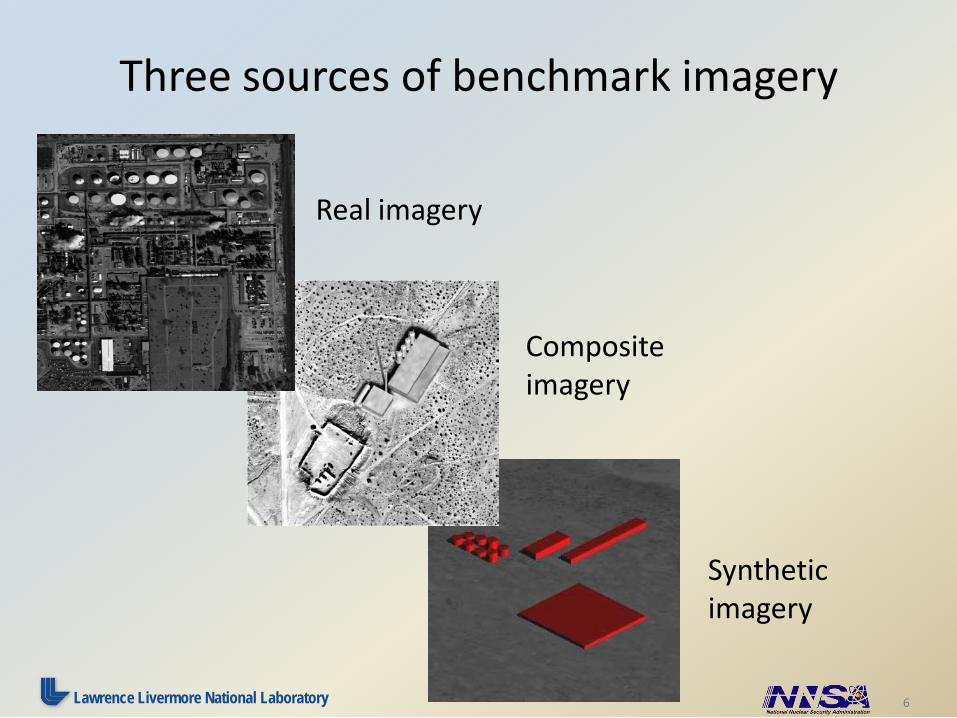
Three sources of benchmark imagery
Composite imagery
Synthetic imagery
Real imagery
6Lawrence Livermore National Laboratory

Real imagery, annotated by experts
7Lawrence Livermore National Laboratory
Controlled vocabulary for annotations developed from Chisnell and Cole
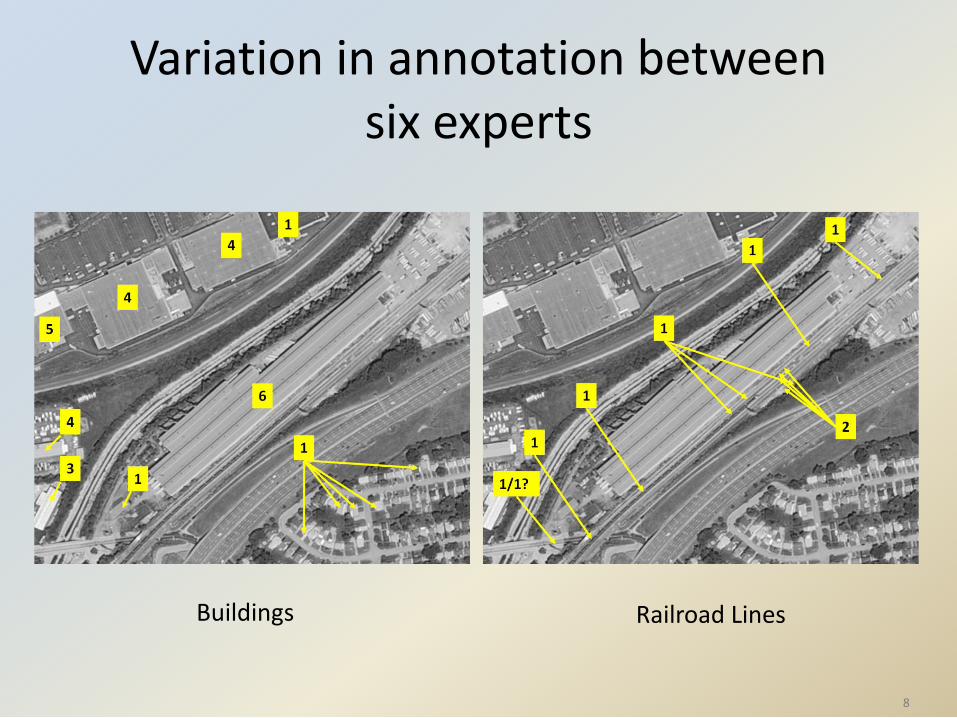
Variation in annotation between six experts
8
Buildings Railroad Lines

Composite Imagery
9Lawrence Livermore National Laboratory
3D facility model + shadow Blending model into sceneUSGS image

Synthetic Facilities
10Lawrence Livermore National Laboratory
“Synthesize a facility consisting of three buildings and a tank farm”
Several rendering engines available, so we’re focused on how to arrange objects into a realistic facility

What is the cost of creating these benchmarks?
11Lawrence Livermore National Laboratory
Real, annotated imagery
(7 experts) x (0.5 hr/image)
+ cost to reconcile variations in expert annotations
+ cost to acquire imagery
+ cost to license imagery
Composite imagery
Cost to build model
+ cost to composite into background
+ cost to acquire background imagery
+ cost to license background imagery
Synthetic imagery
Cost to build model
+ cost to acquire/generate supporting models (reflectance, illumination, atmosphere, etc)
+ cost to render

Future Research and Development
• Automated generation of synthetic facilities• Expressive, usable knowledge representation
for encoding relevant aspects of facilities • V&V methodology: How to perform robust,
comprehensive V&V using these benchmarks• What are the proper roles of real, composite
and synthetic benchmarks? • How good is good enough?
12

Three things to remember:• Design of benchmark imagery for geospatial algorithm V&V is
a difficult problem– Lots of factors ⇒ lots of benchmark imagery– Complexity of scene, and objects in scene– Geospatial extent of the imagery
• Knowledge representation (ontology) to codify the objects (and their geospatial relationships) in the facility/scene that are important to us
• Real, composite and synthetic imagery offer the potential to span the space of factors for comprehensive V&V. Each has their own cost/benefit for particular V&V tasks
The authors would like to acknowledge the support of the Simulations, Algorithms, and Modeling program at the Office of Nonproliferation and Verification Research & Development, National Nuclear Security Administration.
13Lawrence Livermore National Laboratory