


![The Hyundai Motor Company[1]](https://static.fdocuments.us/doc/165x107/577ce3b51a28abf1038ccead/the-hyundai-motor-company1.jpg)


Languages
Pages
Legal


Hyundai Motor CompanyQ3 2020 Business Results
Oct 26, 2020

Cautionary Statement with Respect to Forward-Looking Statements
1
In the presentation that follows and in related comments by Hyundai Motor’s management, our use of the
words “expect,” “anticipate,” “project,” “estimate,” “forecast,” “objective,” “plan,” “goal,” “outlook,”
“target,” “pursue” and similar expressions is intended to identify forward looking statements.
The financial data discussed herein are presented on a preliminary basis before the audit from our
Independent Auditor; final data will be included in HMC’s Independent auditor’s report. While these
statements represent our current judgment on what the future may hold, and we believe these judgments
are reasonable, actual results may differ materially due to numerous important factors. Such factors
include, among others, the following : changes in economic conditions, currency exchange rates or
political stability; shortages of fuel, labor strikes or work stoppages; market acceptance of the
corporation’s new products; significant changes in the competitive environment; changes in laws,
regulations and tax rates; and the ability of the corporation to achieve reductions in cost and employment
levels to realize production efficiencies and implement capital expenditures at levels and times planned by
management.
We do not intend or assume any obligation to update any forward-looking statement, which speaks only
as of the date on which it is made.
Sales Summary
Table of Contents
P. 4 ~ 5
P. 6 ~ 13Financial Summary
Appendix P. 14 ~ 18

Sales Summary
Global Wholesale P. 4
Sales Analysis P. 5
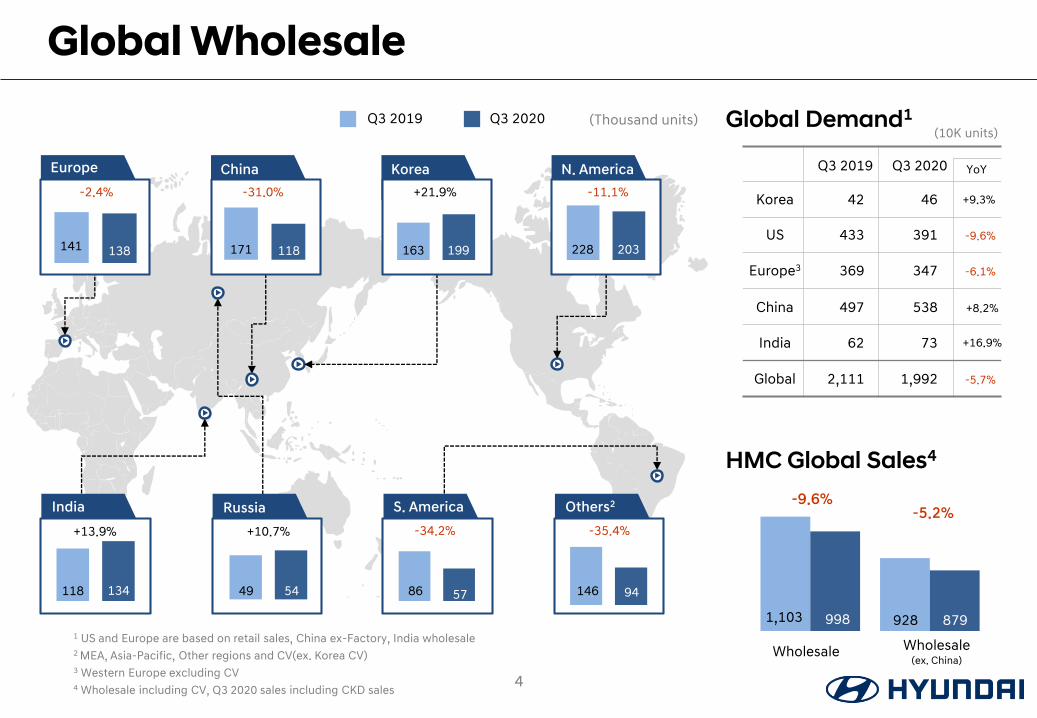
KoreaChina N. AmericaEurope
Q3 2019 Q3 2020
Wholesale Wholesale(ex. China)
RussiaIndia Others2S. America
Global Wholesale
HMC Global Sales4
4
199163118171
-31.0%
203228138141
-2.4% -11.1%
5449134118 941465786
-34.2% -35.4%
-9.6%
9981,103 879928
-5.2%
+21.9%
Global Demand1
Q3 2019 Q3 2020 YoY
+13.9% +10.7%
(Thousand units)(10K units)
Korea
US
Europe3
China
India
Global
1 US and Europe are based on retail sales, China ex-Factory, India wholesale2 MEA, Asia-Pacific, Other regions and CV(ex. Korea CV)3 Western Europe excluding CV4 Wholesale including CV, Q3 2020 sales including CKD sales
42 46 +9.3%
433 391 -9.6%
369 347 -6.1%
497 538 +8.2%
62 73
2,111 1,992 -5.7%
+16.9%

Sales Analysis
5
Key Growth Factors
Outlook
G80
∙ Continued sales growth of G80, Grandeur, and Palisade
in domestic market
→ Sales growth(YoY): G80 +214%, Grandeur +120%, Palisade +90%
→ Genesis sales account for 14.3% (YoY +6.8%p)
∙ Strong sales of SUVs in U.S. (Venue, Palisade)
→ Sales of Palisade grew 85% YoY
→ SUV sales accounts for 64% (YoY +9.3%p)
“Mix improvement with high-end vehicle sales in major markets”
➢ Uncertainty toward global demand recovery from possible
second wave of COVID19
➢ Genesis line-up expansion with the new G70 and GV70 in Q4
➢ New vehicle momentum continues with global launches of
new Elantra, Tucson, and the new Santa Fe
▪ Launched The New Tucson, a full change model
∙ Launched in Q3 in domestic market
→ 10,842 units of pre-order on 1st day (+528% than previous model)
∙ Global launches scheduled from Q4
→ ’20 Q4 in Europe and ’21 H1 in U.S.
▪Mix improvement to continue from strong sales of high-end vehicles in domestic and U.S. markets
Palisade
Tucson
34.6%
6.2%
40.1%
6.0%
Q3 2019 Q3 2020
1,103
9987.5%
8.2%
28.2%
7.7%
1.7%
41.9%
4.8%
6.1%
8.2%
21.4%
9.0%
3.2%
45.5%
6.6%
※ GV80 is included in Genesis, sales portion of SUV is 46.2% with GV80.
Sales by Segment(Thousand units)
A
B
C
D
SUV
Others
Genesis

Financial Summary
Financial Summary P. 7
Revenue by Divisions P. 8
Revenue Analysis P. 9
Operating Income Breakdown P. 10
Operating Income Analysis P. 11~12
Non-operating Income & Net Income P. 13
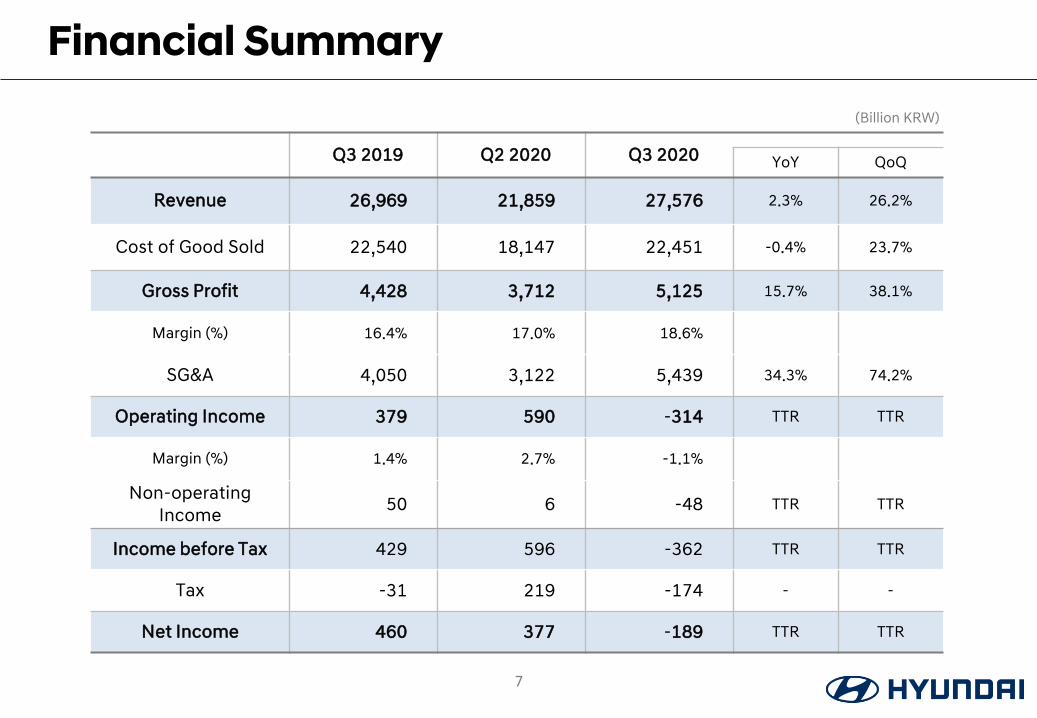
Q3 2019 Q2 2020 Q3 2020 YoY QoQ
Revenue 26,969 21,859 27,576 2.3% 26.2%
Cost of Good Sold 22,540 18,147 22,451 -0.4% 23.7%
Gross Profit 4,428 3,712 5,125 15.7% 38.1%
Margin (%) 16.4% 17.0% 18.6%
SG&A 4,050 3,122 5,439 34.3% 74.2%
Operating Income 379 590 -314 TTR TTR
Margin (%) 1.4% 2.7% -1.1%
Non-operating Income
50 6 -48 TTR TTR
Income before Tax 429 596 -362 TTR TTR
Tax -31 219 -174 - -
Net Income 460 377 -189 TTR TTR
Financial Summary
7
(Billion KRW)

Automotive
Revenue by Division
Finance Others
20,621 21,486
Q3 2019 Q3 2020
4,367 4,441
Q3 2019 Q3 2020
1,981
1,649
Q3 2019 Q3 2020
Vehicle mix improvement Residual values of vehicles improved Sales decreased from COVID-19
8
+74(+1.7%)
+865(+4.2%)
- 332(-16.8%)
(Billion KRW)

Revenue Analysis
Q3 2019 Q3 2020
26,969
27,576
-319
9
-1,601
+2,785
+607(+2.3%)
+307
-259
Volume
Product mix and etc.
F/X
Others
(Billion KRW)

21
19
27
73
228505
103
(911)
Q3 2019 Q3 2020
379
-314
70% 75% 80% 85%
Q3 2020
Q3 2019
Operating Income Breakdown
83.6%
81.4%
10
882 854
305 318
1,240
2,715 910
841
714
711
Q3 2019 Q3 2020
5,439
4,050
+1,389(+34.3%)
-692(TTR)
Operating Income by Division(Billion KRW)
COGS Ratio
SG&A
Automotive
Finance
Others
Adjustment
Salary
Marketing
Warranties
Research
Others 1
1Commission Fees, depreciation, etc.

Operating Income Analysis
11
Q3 2019 Q3 2020
379
-314
+143
-95
(TTR)
+778
+139
-230
+277
-1,562
Others*
-692
* Others: Including KRW 2.1tn of provision costs related to Theta II GDI and other engines
Finance Division
Cost
F/X
MixImprovement Volume
(Billion KRW)

Operating Income Analysis (Pro Forma)
12
Q3 2019 Q3 2020
1,0621
+759(+71.5%)
+139
1,8212
-110+277-95+778
+277
-230
1 Excluding expenses of KRW 600 bn related to settlement of Theta II GDI engine class action in Q3 2019
2 ’Excluding provision expenses of KRW 2.1 tn related to Theta II GDI and other engines in Q3 2020
Finance Division
CostOthers
F/X
Mix
Improvement Volume
(Billion KRW)
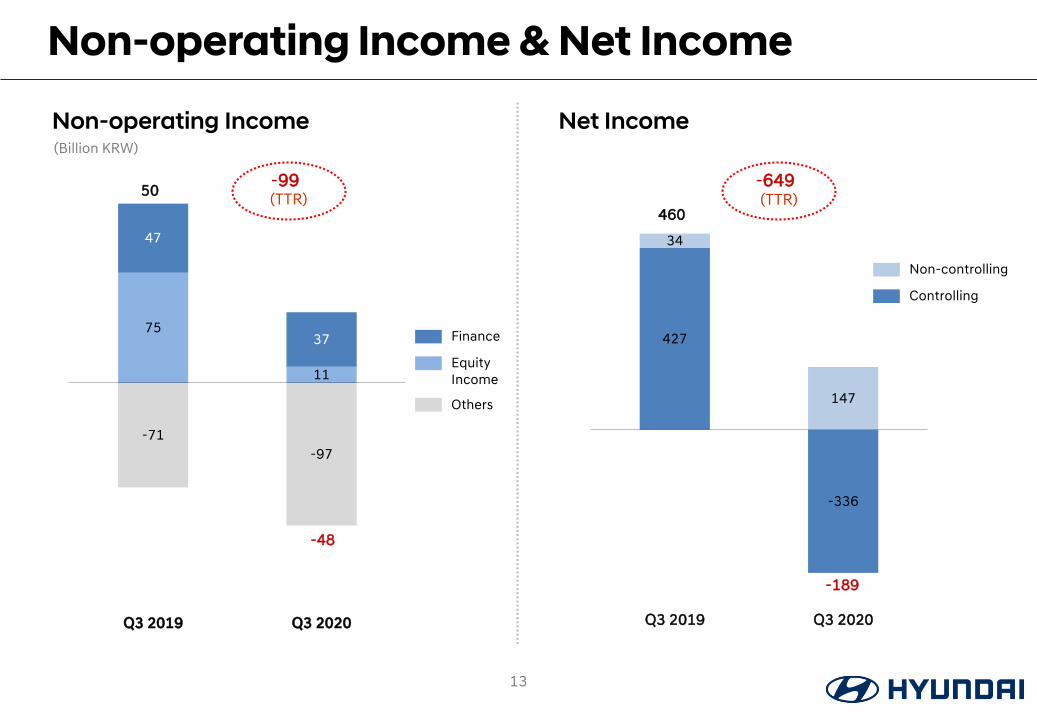
75
11
47
37
-71
-97
Q3 2019 Q3 2020
50
Non-operating Income & Net Income
427
-336
34
147
Q3 2019 Q3 2020
460
-189
13
-99 -649(TTR)
-48
(TTR)
Non-operating Income(Billion KRW)
Net Income
Finance
Equity Income
Others
Non-controlling
Controlling
Appendix
Retail Sales by Region P. 15
P. 16
P. 17
Statement of Income
P. 18
Statement of Financial Position
Statement of Cash Flows
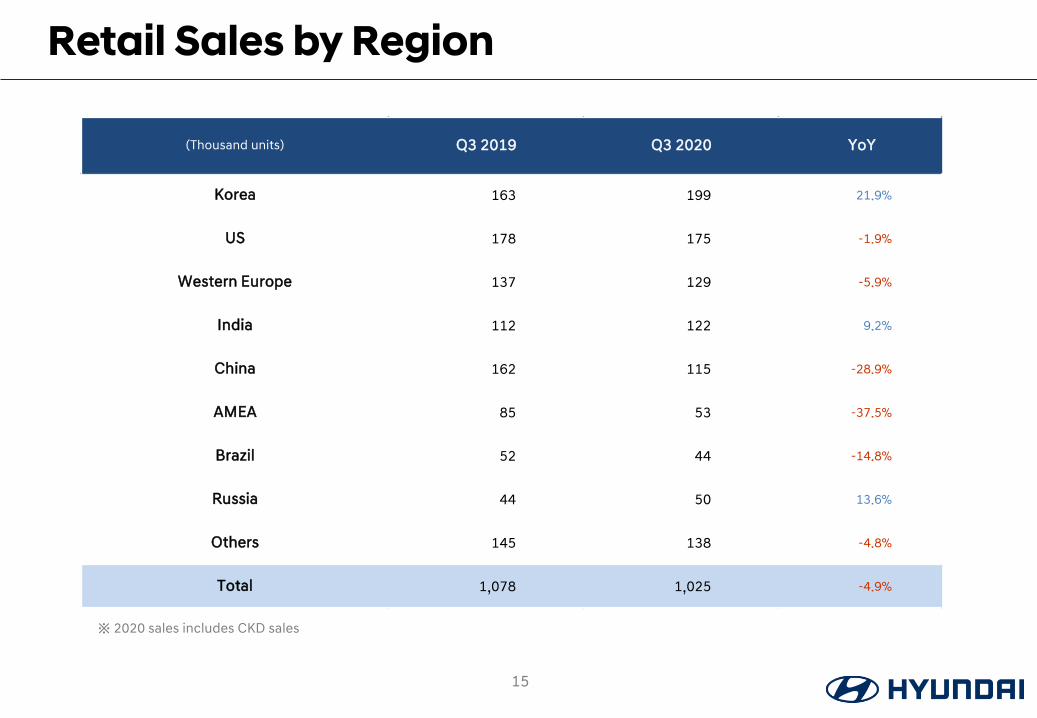
(Thousand units) Q3 2019 Q3 2020 YoY
Korea 163 199 21.9%
US 178 175 -1.9%
Western Europe 137 129 -5.9%
India 112 122 9.2%
China 162 115 -28.9%
AMEA 85 53 -37.5%
Brazil 52 44 -14.8%
Russia 44 50 13.6%
Others 145 138 -4.8%
Total 1,078 1,025 -4.9%
Retail Sales by Region
15
※ 2020 sales includes CKD sales
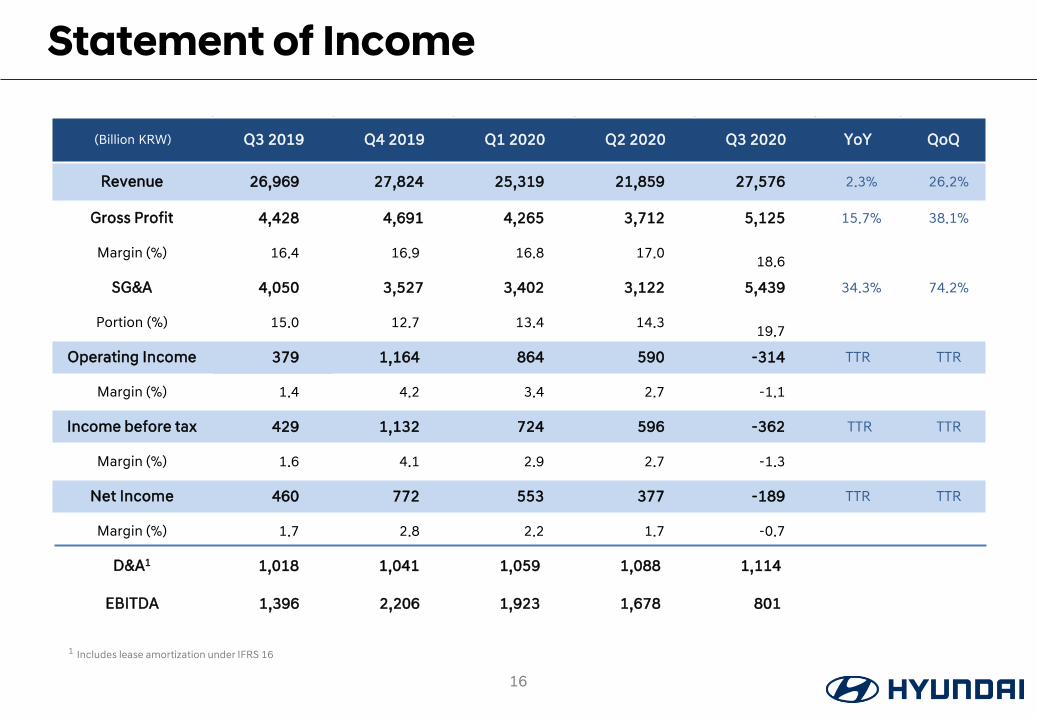
(Billion KRW) Q3 2019 Q4 2019 Q1 2020 Q2 2020 Q3 2020 YoY QoQ
Revenue 26,969 27,824 25,319 21,859 27,576 2.3% 26.2%
Gross Profit 4,428 4,691 4,265 3,712 5,125 15.7% 38.1%
Margin (%) 16.4 16.9 16.8 17.0 18.6
SG&A 4,050 3,527 3,402 3,122 5,439 34.3% 74.2%
Portion (%) 15.0 12.7 13.4 14.3 19.7
Operating Income 379 1,164 864 590 -314 TTR TTR
Margin (%) 1.4 4.2 3.4 2.7 -1.1
Income before tax 429 1,132 724 596 -362 TTR TTR
Margin (%) 1.6 4.1 2.9 2.7 -1.3
Net Income 460 772 553 377 -189 TTR TTR
Margin (%) 1.7 2.8 2.2 1.7 -0.7
D&A1 1,018 1,041 1,059 1,088 1,114
EBITDA 1,396 2,206 1,923 1,678 801
Statement of Income
16
1 Includes lease amortization under IFRS 16
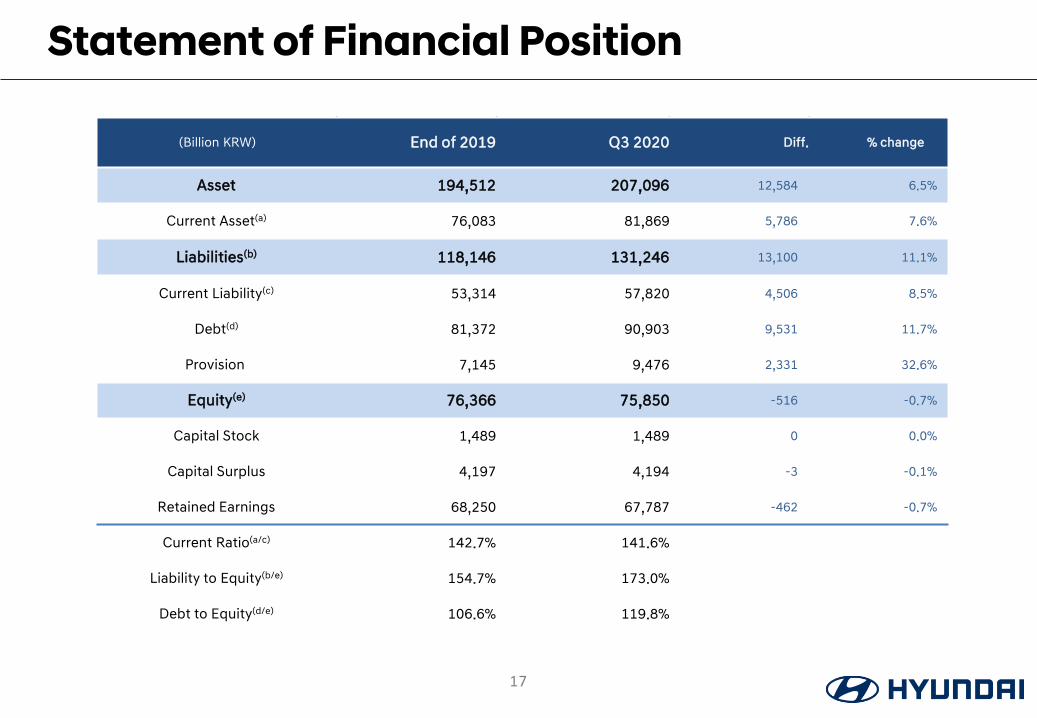
(Billion KRW) End of 2019 Q3 2020 Diff. % change
Asset 194,512 207,096 12,584 6.5%
Current Asset(a) 76,083 81,869 5,786 7.6%
Liabilities(b) 118,146 131,246 13,100 11.1%
Current Liability(c) 53,314 57,820 4,506 8.5%
Debt(d) 81,372 90,903 9,531 11.7%
Provision) 7,145 9,476 2,331 32.6%
Equity(e) 76,366 75,850 -516 -0.7%
Capital Stock 1,489 1,489 0 0.0%
Capital Surplus 4,197 4,194 -3 -0.1%
Retained Earnings 68,250 67,787 -462 -0.7%
Current Ratio(a/c) 142.7% 141.6%
Liability to Equity(b/e) 154.7% 173.0%
Debt to Equity(d/e) 106.6% 119.8%
Statement of Financial Position
17

(Billion KRW) Q3 2019 Q4 2019 Q1 2020 Q2 2020 Q3 2020
Beginning 9,492 9,209 8,682 10,374 10,884
Net Income 461 772 553 377 -189
Depreciation 646 665 663 676 703
Amortization 325 325 346 363 363
Acquisition of Tangible -862 -1,056 -1,128 -1,062 -1,030
Acquisition of Intangible -418 -669 -331 -397 -417
Dividends paid -263 - -4 -890 0
Others -172 -563 1,593 1,442 1,993
Ending 9,209 8,682 10,374 10,884 12,307
Statement of Cash Flows
18

Thank you
Top Related