


Languages
Pages
Legal

Hydrostatic Testing of In-Situ Pipelines&
Spike Testing
Colin Silla, PE, PMPSoutheast District Manager
6/27/18

Hydrotest Design and Support: StatisticsPiping and Test Heads
2
Overall: GTS has designed hydrotests for over 1,000miles of in-situ pipelines on over 500 projects. Pipeline diameters ranging from 2” to 42” on lines dating back to the 1920’s.

Agenda
• Hydrostatic Testing Overview
• Why Hydrotest – NPRM Synthesis/Update
• Essential Elements of a Hydrotest
• In-Situ Testing Considerations
• Spike Testing
• Why Include a Spike Test into your Hydrotest - NRPM
• Flaw Growth Over Time
• When is Spike Testing Appropriate
• Test Pressure Determination
• Lessons Learned
• Considerations for Value Add and Cost Savings
3

Why Hydrostatic Test –NPRM Synthesis
Revision to the code proposes to effectively eliminate the “grandfather” clause - used to establish MAOP on non-tested pre-1970 lines.
• Per GPAC March Meeting ~6,800 miles meet this criteria
Timeline to establish MAOP
• 15 Years from Effective Date of the Ruling
Methods for Determining and Establishing MAOP
1. Hydrostatic Test
2. Pressure Reduction commensurate with a test factor
3. Perform an Engineering Critical Assessment (fracture mechanics and material properties)
4. Pipe Replacement
5. Pressure Reduction for Lines <30% SMYS
6. Alternative Technology
4
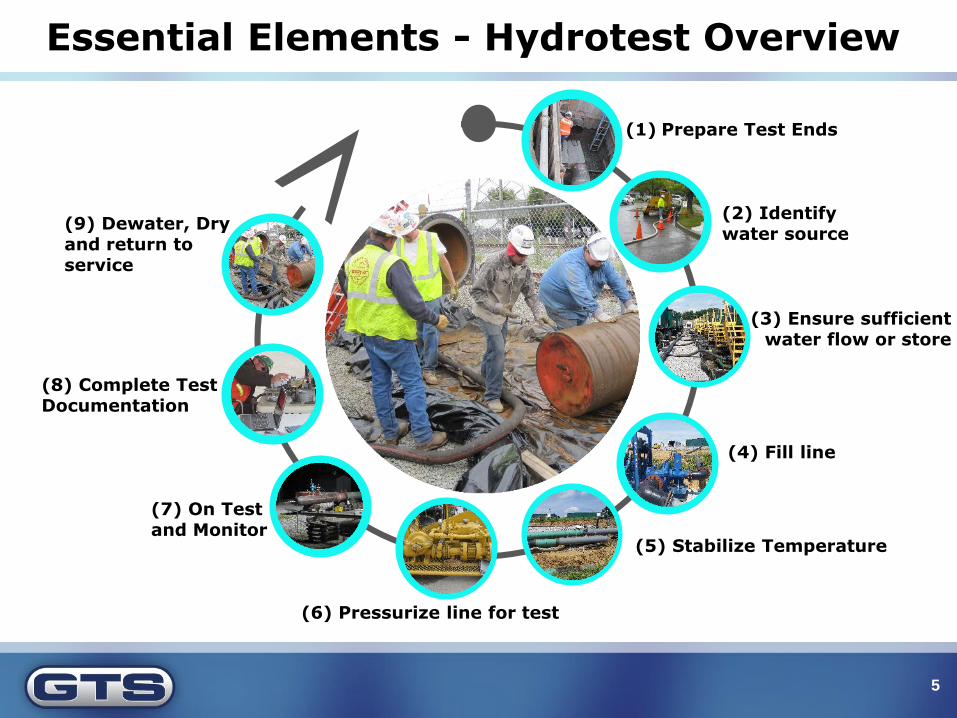
Essential Elements - Hydrotest Overview
5
(1) Prepare Test Ends
(2) Identify water source
(3) Ensure sufficient water flow or store
(4) Fill line
(5) Stabilize Temperature
(7) On Test and Monitor
(6) Pressurize line for test
(8) Complete Test Documentation
(9) Dewater, Dry and return to service
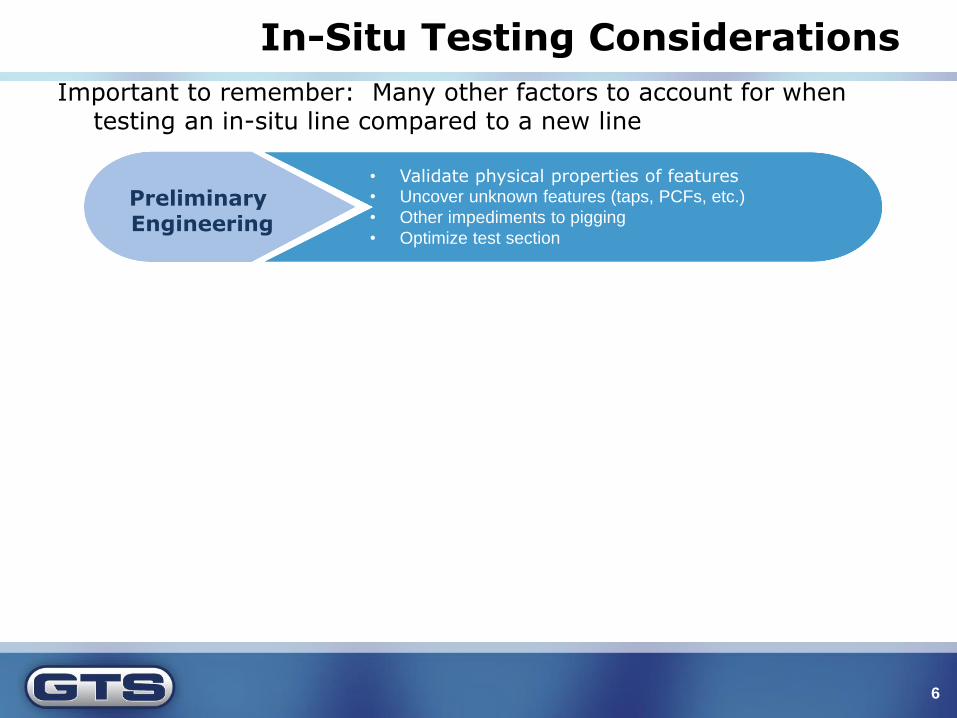
In-Situ Testing Considerations
Important to remember: Many other factors to account for when testing an in-situ line compared to a new line
6
Preliminary Engineering
• Validate physical properties of features• Uncover unknown features (taps, PCFs, etc.)
• Other impediments to pigging
• Optimize test section

In-Situ Testing Considerations
7

In-Situ Testing Considerations
8
Preliminary Engineering
Outage
Management
• Validate physical properties of features• Uncover unknown features (taps, PCFs, etc.)
• Other impediments to pigging
• Optimize test section
• Up to 2 Week outage compared to 1- 2 day outageo Services on the line being tested?o Radial feed line?

In-Situ Testing Considerations
9

In-Situ Testing Considerations
10
Preliminary Engineering
Outage
Management
• Validate physical properties of features• Uncover unknown features (taps, PCFs, etc.)
• Other impediments to pigging
• Optimize test section
• Up to 2 Week outage compared to 1- 2 day outageo Services on the line being tested?o Radial feed line?
Cleaning
• Possibilities of residual contaminants in operational lineso Protrusions and debris can hinder cleaning/clearingo You don’t always know what may be in your line!

In-Situ Testing Considerations
11
In-Situ Testing Considerations
12
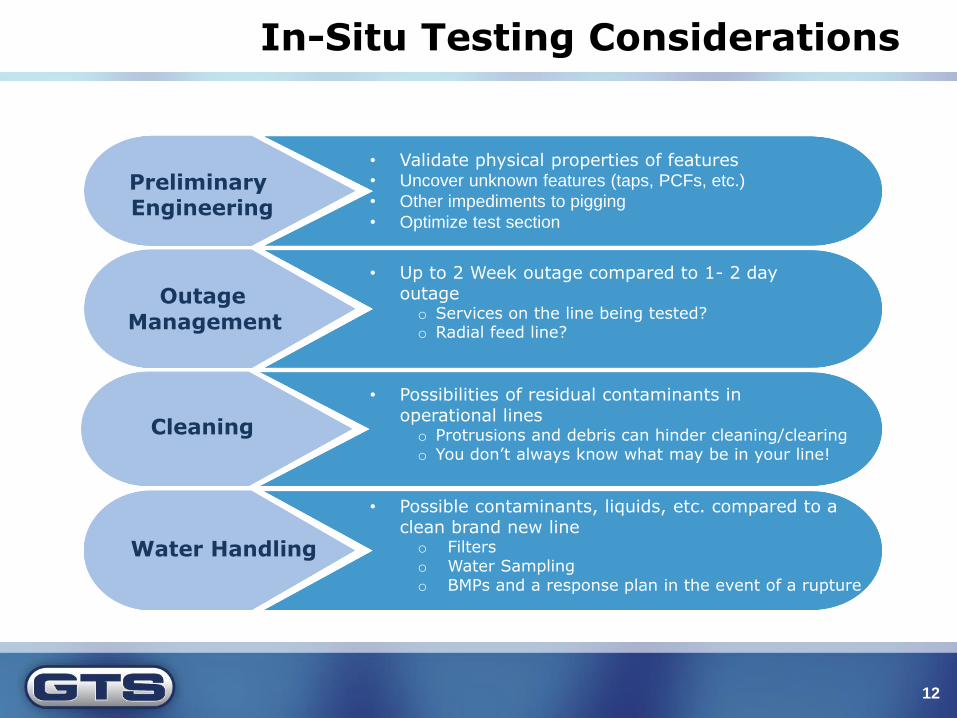
Preliminary Engineering
Outage
Management
Water Handling
• Validate physical properties of features• Uncover unknown features (taps, PCFs, etc.)
• Other impediments to pigging
• Optimize test section
• Possible contaminants, liquids, etc. compared to a clean brand new lineo Filterso Water Samplingo BMPs and a response plan in the event of a rupture
• Up to 2 Week outage compared to 1- 2 day outageo Services on the line being tested?o Radial feed line?
Cleaning
• Possibilities of residual contaminants in operational lineso Protrusions and debris can hinder cleaning/clearingo You don’t always know what may be in your line!

In-Situ Testing Considerations
13

Spike Testing

Why Spike Test?
15
1. Current GPAC stance is no Spike Test is required as part of a Hydrotest being used to establish MAOP
2. Rules out critical flaws including SCC and long seam defects.
3. Minimizing size of “just-surviving” flaws
4. Subsequent to Spike Hold period, relaxing the test pressure by 10% (minimum of 5% if 10% cannot be achieved due to test parameters) as research shows the reduction will generally stop or stabilizes crack growth and avoids continued subcritical crack growth

Sample Spike Test PvT Graph
16
300
350
400
450
500
550
600
650
700
750
800
850
900
950
1000
1050
1100
1150
0 50 100 150 200 250 300 350 400 450 500 550 600
Pre
ssu
re (
psi
g)
Time (min)
Test Pressure vs. Time
Min. Pressure
300
350
400
450
500
550
600
650
700
750
800
850
900
950
1000
1050
1100
1150
0 50 100 150 200 250 300 350 400 450 500 550 600
Pre
ssu
re (
psi
g)
Time (min)
Test Pressure vs. Time
Min. Pressure
100% SMYS (Weakest Segment)
911 psig
300
350
400
450
500
550
600
650
700
750
800
850
900
950
1000
1050
1100
1150
0 50 100 150 200 250 300 350 400 450 500 550 600
Pre
ssu
re (
psi
g)
Time (min)
Test Pressure vs. Time
Min. Pressure
100% SMYS (Weakest Segment)
Spike Pressure
911 psig
300
350
400
450
500
550
600
650
700
750
800
850
900
950
1000
1050
1100
1150
0 50 100 150 200 250 300 350 400 450 500 550 600
Pre
ssu
re (
psi
g)
Time (min)
Test Pressure vs. Time
Max Press. (post spike)
Min. Pressure
100% SMYS (Weakest Segment)
Spike Pressure
911 psig
Stabilization Period
On Test
1/2 Hour Spike Period
75% Min. Pressure

Flaw Growth Over Time
17
Sub Critical Flaw
Time
Pre
ssu
re
Operating PressureCycles
MAOP
1.25(TPM)
1.5(TPM)
100+ Years
200+ Years
Critical Flaw
Sub Critical Flaw

When is Spike Testing Appropriate?
Various Kiefner & Associates reports on hydrostatic testing identify variations of three (3) categories for the suitability of a spike test:
Spike testing is beneficial to:
• Rule out time dependent and manufacturing threats and can extend not only re-assessment interval but life of pipe
Spike testing is less necessary on:
• Newer pipe, and lines operating at lower SMYS (<40%)
Spike Testing can be inadvisable when:
• Exceeding mill test pressures or to extremes that would cause plastic deformation
• Test pressures do not allow for significant enough reduction in pressure so as to restrain sub critical flaw growth
18

Test Pressure Determination
19
Ratings of Fitting and Max Shell Test Pressure

Test Pressure Determination
20
Ratings of Fitting and Max Shell Test Pressure
Elevation Changes Causing Static Head
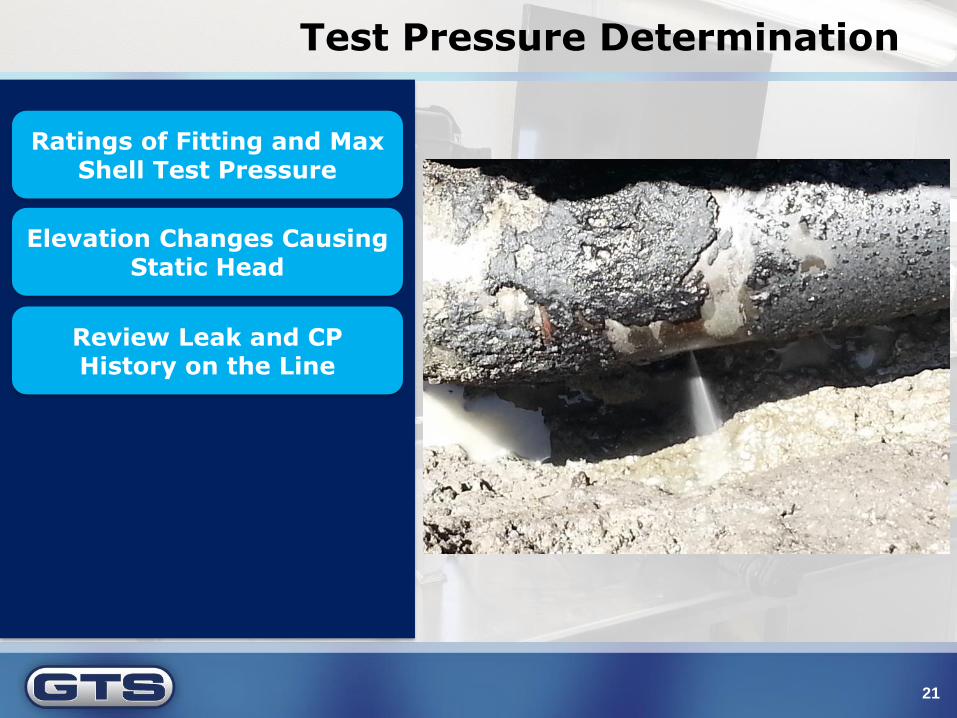
Test Pressure Determination
21
Ratings of Fitting and Max Shell Test Pressure
Elevation Changes Causing Static Head
Review Leak and CP History on the Line

Test Pressure Determination
22
Ratings of Fitting and Max Shell Test Pressure
Elevation Changes Causing Static Head
Review Leak and CP History on the Line
Mill Test Pressures and Documentation
Test Pressure Determination
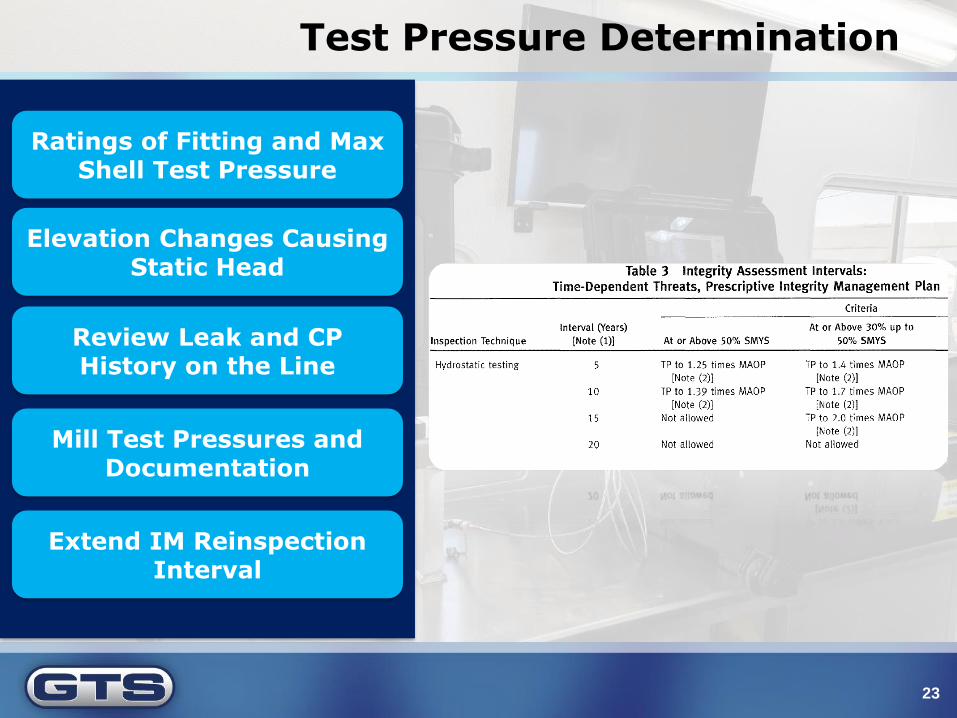
23
Ratings of Fitting and Max Shell Test Pressure
Elevation Changes Causing Static Head
Review Leak and CP History on the Line
Mill Test Pressures and Documentation
Extend IM Reinspection Interval
Test Pressure Considerations
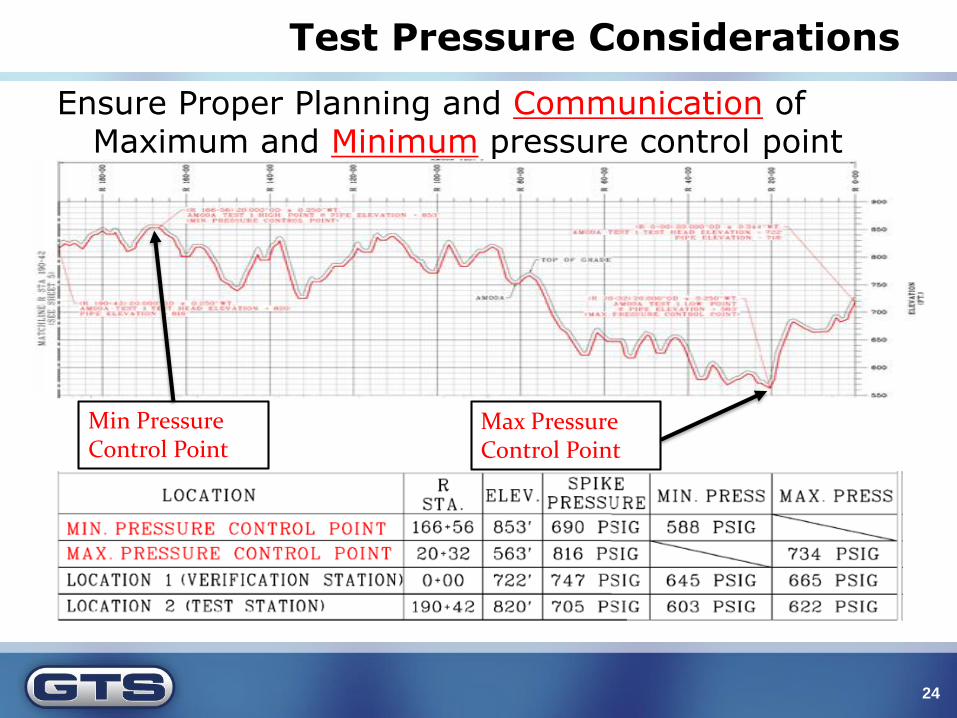
24
Ensure Proper Planning and Communication of Maximum and Minimum pressure control point
Min Pressure Control Point
Max Pressure Control Point

Considerations and Lessons Learned
Methods and considerations for a cost effective hydrotest or hydrotest program:
25
Planning Lessons Engineering Lessons Execution Lessons

Planning Lessons Learned
Geographical Grouping
• Careful consideration of your program should be made to cluster project sites:
• Environmental and Ministerial Permits
• Public Convenience
• Efficient Outage Management
• Reduce Mobilization and improves access
Test Splitting
• Review elevations particularly in long stretches of untested line
• Can “leap frog” or “daisy Chain” tests utilizing water from tests on adjacent portions of the line
26

Planning Lessons Learned
27

Engineering Lessons Learned
28
Proper pipeline asset knowledge is critical to the successful design of a hydrotest
• Comprehensive Pipeline Features List (PFL)
• Identifies all unpiggable features
• Provides pipeline specifications to determine test pressures
• Identifies underrated features

Engineering Lessons Learned
29
Engineering Lessons Learned
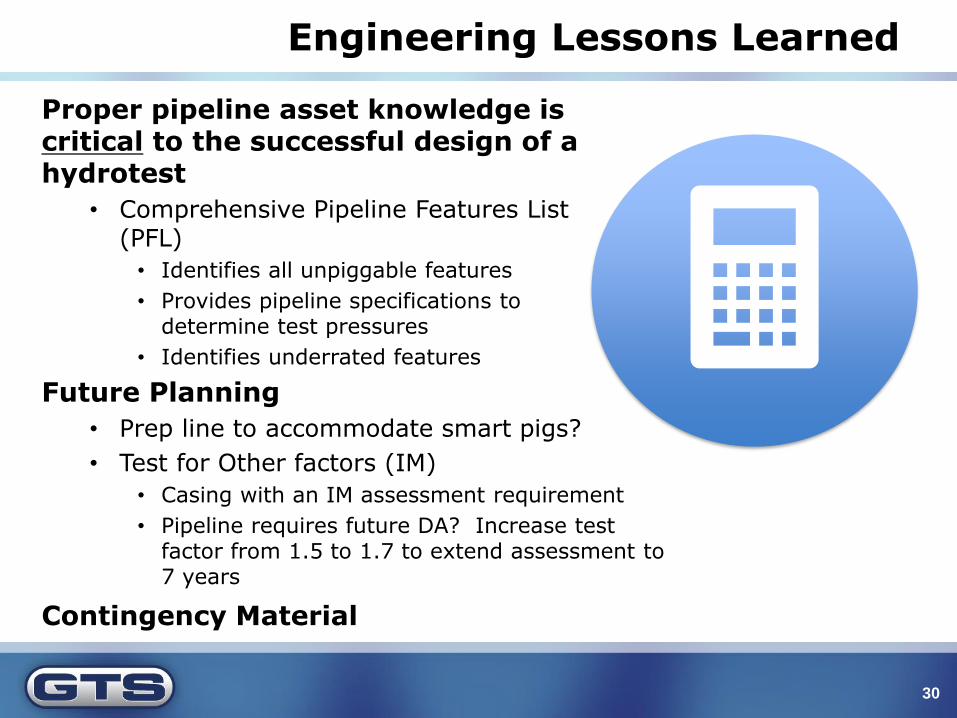
30
Proper pipeline asset knowledge is critical to the successful design of a hydrotest
• Comprehensive Pipeline Features List (PFL)
• Identifies all unpiggable features
• Provides pipeline specifications to determine test pressures
• Identifies underrated features
Future Planning
• Prep line to accommodate smart pigs?
• Test for Other factors (IM)
• Casing with an IM assessment requirement
• Pipeline requires future DA? Increase test factor from 1.5 to 1.7 to extend assessment to 7 years
Contingency Material

Engineering Lessons Learned
31

Execution Lessons Learned
32
Test Monitoring
• Test certification tool to monitor real time pressure fluctuations
• Will provide information on if pressure drop is on account of a leak or temperature change
Leak Contingency Planning
• Prepare and identify most likely locations for leaks
• Seam Type, pipe vintage, low points
• Have an isolation plan
• Have BMP Equipment on standby during test

Questions?
33
Colin Silla, PE, [email protected] x106
GTS will be providing Part II of a webinar series with additional
hydrotest information on TBD
Additional Information

Appendix
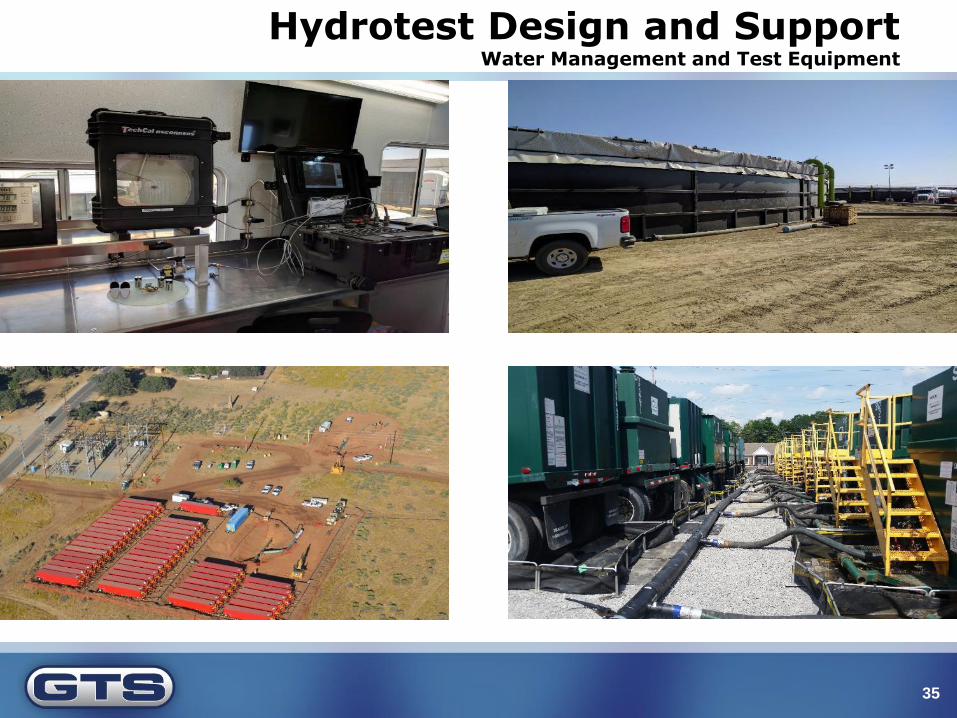
Hydrotest Design and SupportWater Management and Test Equipment
35

Test Steps
• Temperature Stabilization
• Pre-Test Leak Identification
• Monitor Fill pump pressure
• 1 Hr P Stabilization @ 75% Min TP
• Spike Test for 30 min (max) Hold Period - 7.5 Hrs
• De-pressure and Dewater
36
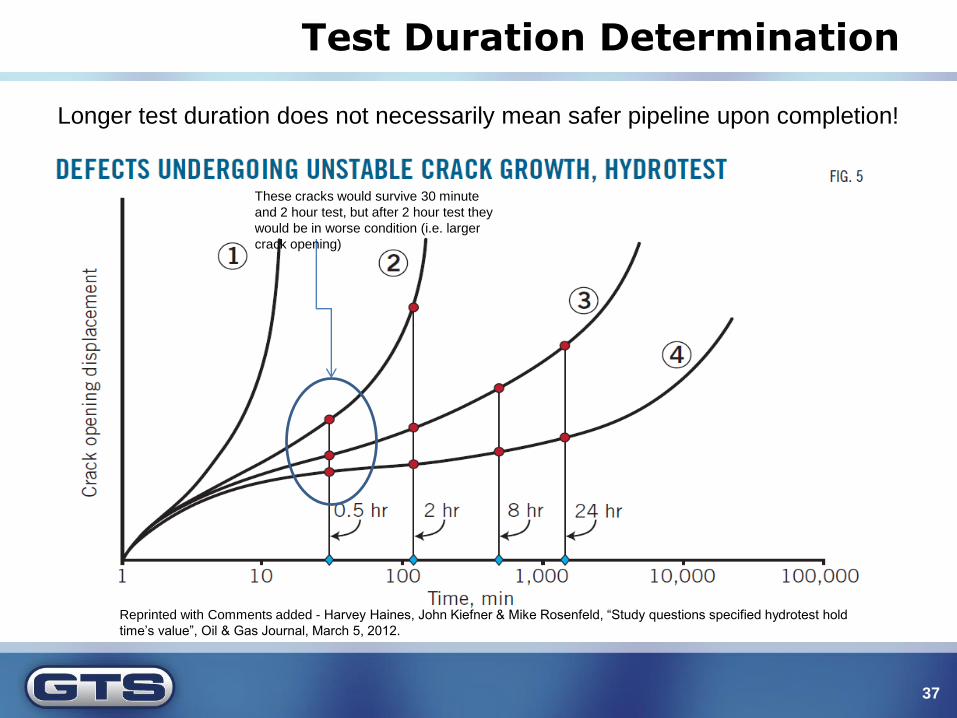
Test Duration Determination
37
Longer test duration does not necessarily mean safer pipeline upon completion!
These cracks would survive 30 minute
and 2 hour test, but after 2 hour test they
would be in worse condition (i.e. larger
crack opening)
Reprinted with Comments added - Harvey Haines, John Kiefner & Mike Rosenfeld, “Study questions specified hydrotest hold
time’s value”, Oil & Gas Journal, March 5, 2012.
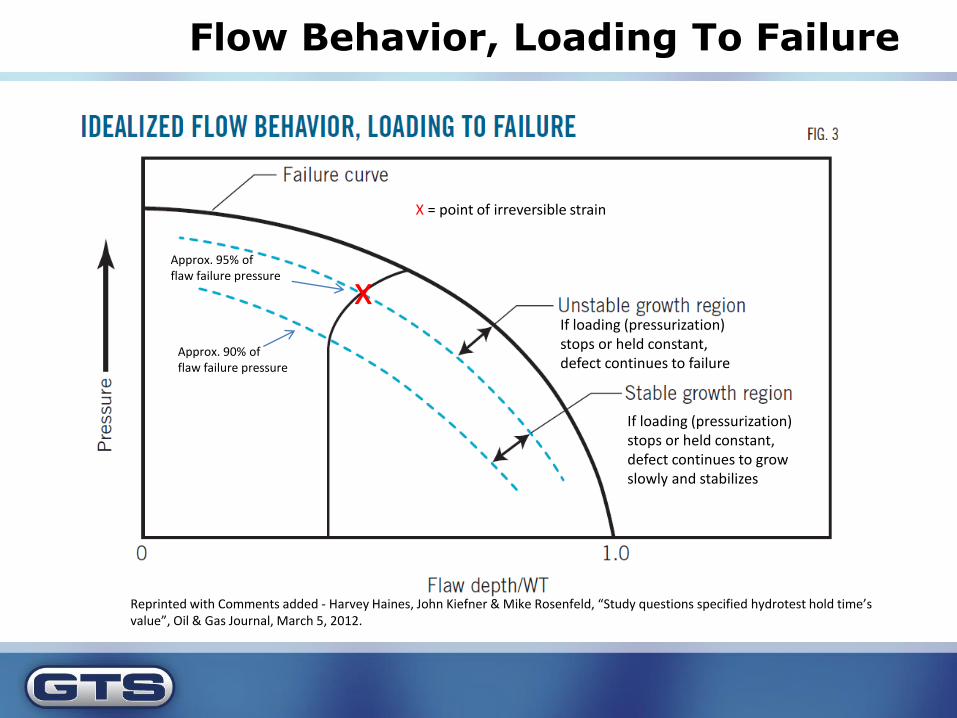
Approx. 90% offlaw failure pressure
Approx. 95% offlaw failure pressure
x
X = point of irreversible strain
Reprinted with Comments added - Harvey Haines, John Kiefner & Mike Rosenfeld, “Study questions specified hydrotest hold time’s value”, Oil & Gas Journal, March 5, 2012.
If loading (pressurization) stops or held constant, defect continues to failure
If loading (pressurization) stops or held constant, defect continues to grow slowly and stabilizes
Flow Behavior, Loading To Failure

Defects Held at a Stress Near Failure
39
Flaw growth from pressure cycling near the failure stress level, from PRC/AGA NG-18 Report No. 111,Kiefner, J.F., Maxey, W.A., and Eiber, R.J., “A study of the Causes of Failure of Defects That Have Survived a Prior Hydrostatic Test”, 11-3-80
Note: Loading Consisted of:
1st cycle – 0 to 1330 psig, 30 sec hold
2nd cycle – 0 to 1330 psig, 30 sec hold
3rd cycle – 0 to 1230 psig, failure

Diameter
Wall Thickness
Grade, psi
MAOP, psig
Test Pressure, psig
Ratio of Test Pressure to MAOP
Minimum Time to Failure, years
30” 0.375” 52,000 400 790 (60.77%)
1.975 438
30” 0.375” 52,000 400 680 (52.31%) 1.7 221
30” 0.375” 52,000 400 600 (50.00%)
1.5 126
30” 0.375” 52,000 400 500 (level
below minimum allowed)
1.25 46.3
30” 0.375” 52,000 400 440 (level
below minimum allowed)
1.1 21.4
40
Effects of Test-Pressure-to-MAOP Ratio on Times to Failure Caused by Pressure-Cycle-Induced Fatigue Crack Growth of an Initial Flaw (for a Class 3 Segment)

Diameter
Wall Thickness
Grade, psi
MAOP, psig
Test Pressure, psig
Ratio of Test Pressure to MAOP
Minimum Time to Failure, years
30” 0.375” 52,000 890 1237 (95.2%) 1.39 216
30” 0.375” 52,000 890 1113 (85.6%) 1.25 110
30” 0.375” 52,000 890 979 (75.3%) 1.1 (not
allowed in a test with water)
43
41
Effects of Test-Pressure-to-MAOP Ratio on Times to Failure Caused by Pressure-Cycle-Induced Fatigue Crack Growth of an Initial Flaw (for a Class 1 Segment)
Lower test ratio provides longer minimum time to failure because testing to higher % of SMYS
Top Related