


Languages
Pages
Legal

International Journal of Science and Research (IJSR) ISSN (Online): 2319-7064
Index Copernicus Value (2013): 6.14 | Impact Factor (2014): 5.611
Volume 4 Issue 11, November 2015
www.ijsr.net Licensed Under Creative Commons Attribution CC BY
Hybrid Model of Ultrasonic Transducer for better
Medical Imaging
Apurva Y. Gandole1, Y. B. Gandole
2
2Adarsha Science J. B. Arts and Birla Commerce Mahavidyalaya Dhamangaon Rly-444709
Abstract: Recently, ultrasound becomes prominent in several applications especially in medical field to improve the health services
either for diagnostic. The emergence of ultrasound applications raises the need of reliable transducer to comply with that purpose. As
polymer material being popular in medical ultrasound, there are chances to combine it with former piezoelectric ceramic material in
designing diagnostic transducer to get hybrid characteristics required for multi-frequency application. In this work, SPICE model of
ceramic-polymer piezoelectric has been described. With signal conditioner circuit, complete analog system for ultrasound has also been
developed.
Keywords: Ultrasonic, Transducer, Medical imaging, Modeling.
1. Introduction
Recently, ultrasound becomes prominent in several
applications especially in medical field to improve the health
services either for diagnostic or therapy purpose. For many
years, ultrasound has provided clinicians with an affordable
and effective imaging tool for applications ranging from
cardiology to obstetrics. Development of microbubble
contrast agents over the past several decades has enabled
ultrasound to distinguish between blood flow and
surrounding tissue. Fundamentally, ultrasound images are
visual representations of the interaction between sound
waves and the medium of wave propagation. In ultrasound
imaging, an acoustic pulse is transmitted into the field using
a transducer capable of producing a temporally short
mechanical wave in response to a voltage applied to the
transducer. As the incident wave travels into tissue, some of
the wave’s energy is reflected back toward the transducer by
scatterers in the tissue having different acoustic properties
than the background medium. These backscattered acoustic
waves are received by the same transducer, which converts
mechanical waves into time-varying voltages. These signals
are then amplified, digitized, and processed into an image by
the ultrasound imaging system. In the most common mode of
operation, called “B-mode” ultrasound, grayscale images are
formed in which pixel values are proportional to the
brightness of scattered acoustic waves. In other system
modes, B-mode images are overlaid with colorized maps of
blood velocity or integrated energy from moving scatterers.
An ultrasonic transducer employed for both transmitting
ultrasonic acoustic energy into an immersion medium and for
detecting acoustic energy reflected from an object under
examination is provided, the transducer having a hybrid
transmitter and receiver in which a ceramic piezoelectric
material is used to construct a first piezoelectric element for
transmitting the acoustic energy, and a polymer piezoelectric
material is used to fabricate a second piezoelectric element
for receiving the reflected acoustic energy. The hybrid
ultrasonic transducer provides improved performance over
prior transducers using only a single ceramic piezoelectric
element, in that the good transmitting properties of the
ceramic are preserved, while the better receiving properties
of the polymer piezoelectric are used to improve the
sensitivity of the transducer. The polymer piezoelectric has
the further advantage of providing a closer match of acoustic
impedance to the immersion fluid used in the evaluation of
objects. A simulation of transducer’s model is useful in order
to verify the preliminary design. Hence, SPICE
implementation of hybrid multi-frequency transducer has
been developed in this paper.
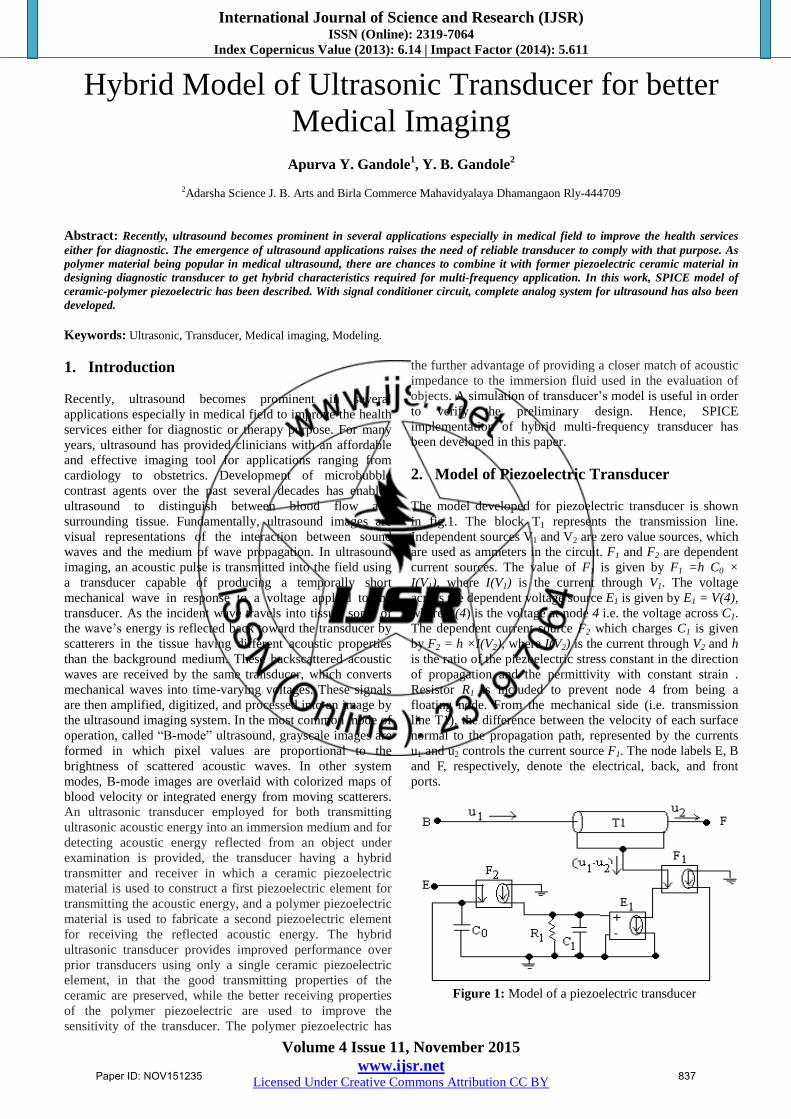
2. Model of Piezoelectric Transducer
The model developed for piezoelectric transducer is shown
in fig.1. The block T1 represents the transmission line.
Independent sources V1 and V2 are zero value sources, which
are used as ammeters in the circuit. F1 and F2 are dependent
current sources. The value of F1 is given by F1 =h C0 ×
I(V1), where I(V1) is the current through V1. The voltage
across the dependent voltage source E1 is given by E1 = V(4),
where V(4) is the voltage at node 4 i.e. the voltage across C1.
The dependent current source F2 which charges C1 is given
by F2 = h ×I(V2), where I(V2) is the current through V2 and h
is the ratio of the piezoelectric stress constant in the direction
of propagation and the permittivity with constant strain .
Resistor R1 is included to prevent node 4 from being a
floating node. From the mechanical side (i.e. transmission
line T1), the difference between the velocity of each surface
normal to the propagation path, represented by the currents
u1 and u2 controls the current source F1. The node labels E, B
and F, respectively, denote the electrical, back, and front
ports.
Figure 1: Model of a piezoelectric transducer
Paper ID: NOV151235 837
International Journal of Science and Research (IJSR) ISSN (Online): 2319-7064
Index Copernicus Value (2013): 6.14 | Impact Factor (2014): 5.611
Volume 4 Issue 11, November 2015
www.ijsr.net Licensed Under Creative Commons Attribution CC BY
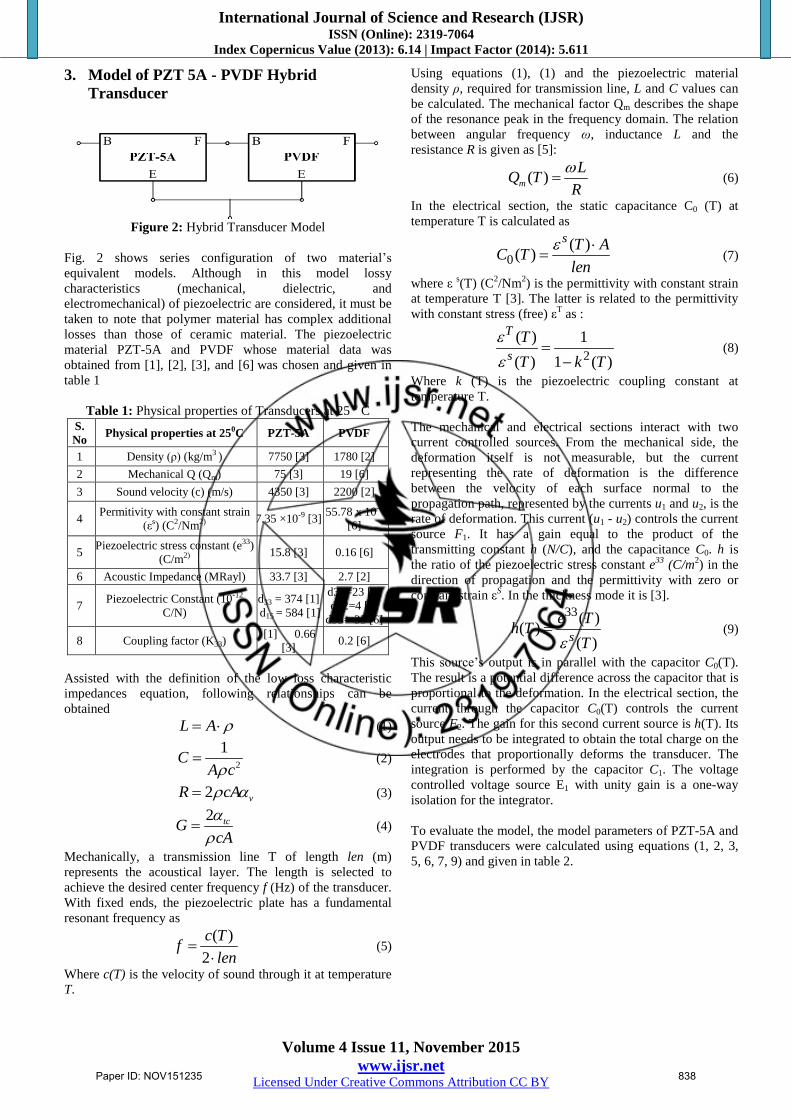
3. Model of PZT 5A - PVDF Hybrid
Transducer
Figure 2: Hybrid Transducer Model
Fig. 2 shows series configuration of two material’s
equivalent models. Although in this model lossy
characteristics (mechanical, dielectric, and
electromechanical) of piezoelectric are considered, it must be
taken to note that polymer material has complex additional
losses than those of ceramic material. The piezoelectric
material PZT-5A and PVDF whose material data was
obtained from [1], [2], [3], and [6] was chosen and given in
table 1
Table 1: Physical properties of Transducers at 25 o C
S.
No Physical properties at 250C PZT-5A PVDF
1 Density (ρ) (kg/m3 ) 7750 [3] 1780 [2]
2 Mechanical Q (Qm) 75 [3] 19 [6]
3 Sound velocity (c) (m/s) 4350 [3] 2200 [2]
4 Permitivity with constant strain
(εs) (C2/Nm2) 7.35 ×10⁻⁹ [3]
55.78 x 10⁻⁹
[6]
5 Piezoelectric stress constant (e33)
(C/m2) 15.8 [3] 0.16 [6]
6 Acoustic Impedance (MRayl) 33.7 [3] 2.7 [2]
7 Piezoelectric Constant (10-12
C/N)
d33 = 374 [1]
d15 = 584 [1]
d31=23 [6]
d32=4 [6]
d33=-33 [6]
8 Coupling factor (K33) [1] 0.66
[3] 0.2 [6]
Assisted with the definition of the low loss characteristic
impedances equation, following relationships can be
obtained
L A (1)
2
1C
A c
(2)
2 vR cA (3)
2 tcGcA
(4)
Mechanically, a transmission line T of length len (m)
represents the acoustical layer. The length is selected to
achieve the desired center frequency f (Hz) of the transducer.
With fixed ends, the piezoelectric plate has a fundamental
resonant frequency as
( )
2
c Tf
len
(5)
Where c(T) is the velocity of sound through it at temperature
T.
Using equations (1), (1) and the piezoelectric material
density ρ, required for transmission line, L and C values can
be calculated. The mechanical factor Qm describes the shape
of the resonance peak in the frequency domain. The relation
between angular frequency ω, inductance L and the
resistance R is given as [5]:
( )m
LQ T
R
(6)
In the electrical section, the static capacitance C0 (T) at
temperature T is calculated as
0( )
( )s T A
C Tlen
(7)
where ε s(T) (C
2/Nm
2) is the permittivity with constant strain
at temperature T [3]. The latter is related to the permittivity
with constant stress (free) εT as :
2
( ) 1
( ) 1 ( )
T
s
T
T k T
(8)
Where k (T) is the piezoelectric coupling constant at
temperature T.
The mechanical and electrical sections interact with two
current controlled sources. From the mechanical side, the
deformation itself is not measurable, but the current
representing the rate of deformation is the difference
between the velocity of each surface normal to the
propagation path, represented by the currents u1 and u2, is the
rate of deformation. This current (u1 - u2) controls the current
source F1. It has a gain equal to the product of the
transmitting constant h (N/C), and the capacitance C0. h is
the ratio of the piezoelectric stress constant e33
(C/m2) in the
direction of propagation and the permittivity with zero or
constant strain εS. In the thickness mode it is [3].
33( )( )
( )s
e Th T
T (9)
This source’s output is in parallel with the capacitor C0(T).
The result is a potential difference across the capacitor that is
proportional to the deformation. In the electrical section, the
current through the capacitor C0(T) controls the current
source F2. The gain for this second current source is h(T). Its
output needs to be integrated to obtain the total charge on the
electrodes that proportionally deforms the transducer. The
integration is performed by the capacitor C1. The voltage
controlled voltage source E1 with unity gain is a one-way
isolation for the integrator.
To evaluate the model, the model parameters of PZT-5A and
PVDF transducers were calculated using equations (1, 2, 3,
5, 6, 7, 9) and given in table 2.
Paper ID: NOV151235 838
International Journal of Science and Research (IJSR) ISSN (Online): 2319-7064
Index Copernicus Value (2013): 6.14 | Impact Factor (2014): 5.611
Volume 4 Issue 11, November 2015
www.ijsr.net Licensed Under Creative Commons Attribution CC BY
Table 2: Model parameters of Transducers
S.No. Model parameters PZT-5A PVDF
Physical parameters
1 Diameter (mm) 12.7 12.5
2 Cross sectional area (A) (m2) 0.0001267 0.0001227
3 Center frequency (MHz) 5MHz 5MHz
Equivalent lossy transmission line
parameters
( Mechanical section)
4 C 53.8nF 945.8nF
5 R 411kΩ 361.18 kΩ
6 L 981mH 218 mH
7 G 0 0
8 len 435μm 220 μm
Electrical section parameter
9 Static capacitance C0 2.14nF 31.14nF
Controlled sources parameter
10 Transmitting constant (h) (N/C) 2.15× 10⁹ 2.87 x 10⁶
11 Current source gain ( F2 ) 2.15× 10⁹ 2.87 x 10⁶
12 Dependant current source gain
(F1 )
4.60 0.09
13 Voltage control voltage source
gain (E1)
1 1
14 R1 1 KΩ 1 KΩ
15 C1 1F 1F
4. Simulation Setup for Ultrasonic System
The analogous simulation schematic setup is described in
figure 3, with the transducer sub circuit shown in figure 1. In
this schematic an ultrasonic probe with acoustic matching
layer is symbolized by the two three-port blocks X1 and X2,
which involve established PSPICE piezoelectric model. The
measuring cell is modeled using lossy transmission line.
Figure 3: Simulation setup Schematic for ultrasonic test
system.
5. Result and Discussion
Transient analysis of the transducer model was done with the
configuration shown in figure 4. An oscillation was observed
after excitation of the piezoelectric crystal. The received
signal was compared in the time domain. (Fig. 5, 6, 7)
Figure 4: Simulation setup for analysis of transient behavior
of transducers.
Certain polymer characteristic losses are neglected to
simplify the preliminary design at this stage. Fig. 6 shows the
transient response of series configuration model.
Figure 5: Transient response of PZT-5A piezoelectric
Transducer.
Figure 6: Transient response of PVDF Transducer
Figure 7: Transient response of ceramic-polymer
piezoelectric transducer (PZT-5A+PVDF) for multi-
frequency ultrasonic system
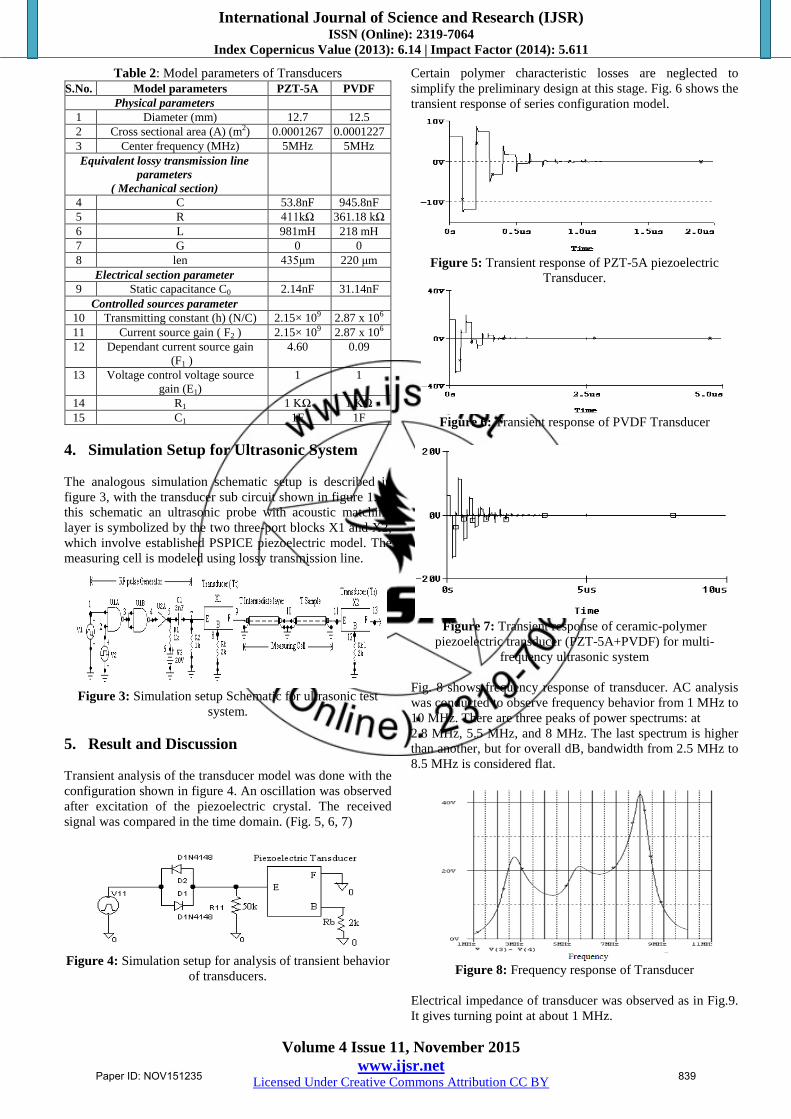
Fig. 8 shows frequency response of transducer. AC analysis
was conducted to observe frequency behavior from 1 MHz to
10 MHz. There are three peaks of power spectrums: at
2.8 MHz, 5.5 MHz, and 8 MHz. The last spectrum is higher
than another, but for overall dB, bandwidth from 2.5 MHz to
8.5 MHz is considered flat.
Figure 8: Frequency response of Transducer
Electrical impedance of transducer was observed as in Fig.9.
It gives turning point at about 1 MHz.
Paper ID: NOV151235 839
International Journal of Science and Research (IJSR) ISSN (Online): 2319-7064
Index Copernicus Value (2013): 6.14 | Impact Factor (2014): 5.611
Volume 4 Issue 11, November 2015
www.ijsr.net Licensed Under Creative Commons Attribution CC BY
Figure 9: Electrical Impedance of Transducer
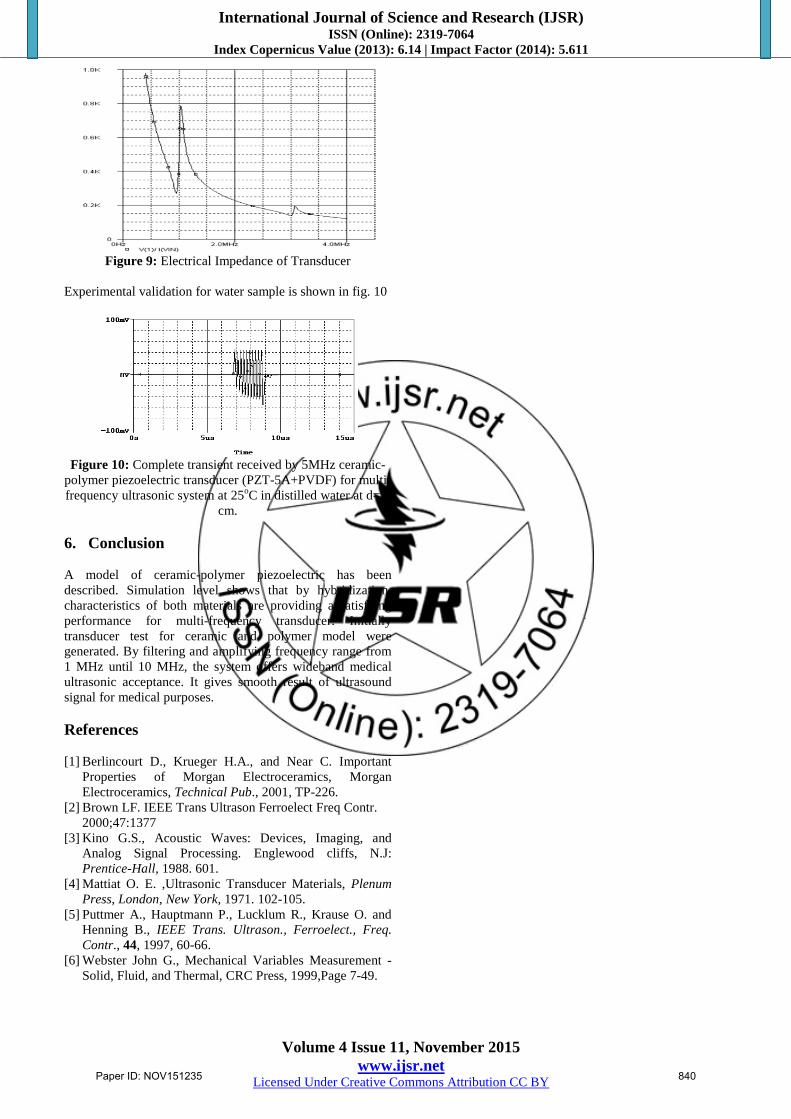
Experimental validation for water sample is shown in fig. 10
Figure 10: Complete transient received by 5MHz ceramic-
polymer piezoelectric transducer (PZT-5A+PVDF) for multi-
frequency ultrasonic system at 25oC in distilled water at d= 1
cm.
6. Conclusion
A model of ceramic-polymer piezoelectric has been
described. Simulation level shows that by hybridization,
characteristics of both materials are providing a satisfying
performance for multi-frequency transducer. Initially
transducer test for ceramic and polymer model were
generated. By filtering and amplifying frequency range from
1 MHz until 10 MHz, the system offers wideband medical
ultrasonic acceptance. It gives smooth result of ultrasound
signal for medical purposes.
References
[1] Berlincourt D., Krueger H.A., and Near C. Important
Properties of Morgan Electroceramics, Morgan
Electroceramics, Technical Pub., 2001, TP-226.
[2] Brown LF. IEEE Trans Ultrason Ferroelect Freq Contr.
2000;47:1377
[3] Kino G.S., Acoustic Waves: Devices, Imaging, and
Analog Signal Processing. Englewood cliffs, N.J:
Prentice-Hall, 1988. 601.
[4] Mattiat O. E. ,Ultrasonic Transducer Materials, Plenum
Press, London, New York, 1971. 102-105.
[5] Puttmer A., Hauptmann P., Lucklum R., Krause O. and
Henning B., IEEE Trans. Ultrason., Ferroelect., Freq.
Contr., 44, 1997, 60-66.
[6] Webster John G., Mechanical Variables Measurement -
Solid, Fluid, and Thermal, CRC Press, 1999,Page 7-49.
Paper ID: NOV151235 840
Top Related