


Languages
Pages
Legal

8/3/2019 Hunter Fanney
http://slidepdf.com/reader/full/hunter-fanney 1/19
International Standards for Renewable Energy Sources
A. Hunter Fanney
National Institute of Standards and Technology
November 12, 2007
8/3/2019 Hunter Fanney
http://slidepdf.com/reader/full/hunter-fanney 2/19
Presentation Overview
• The Need for Renewable Energy
• The Case for Renewable Energy Standards
• Early Attempts/Challenges (U.S. Perspective)
• A Success Story in Renewable Energy Standards
• A Current Testing Challenge –PV Module Ratings
8/3/2019 Hunter Fanney
http://slidepdf.com/reader/full/hunter-fanney 3/19
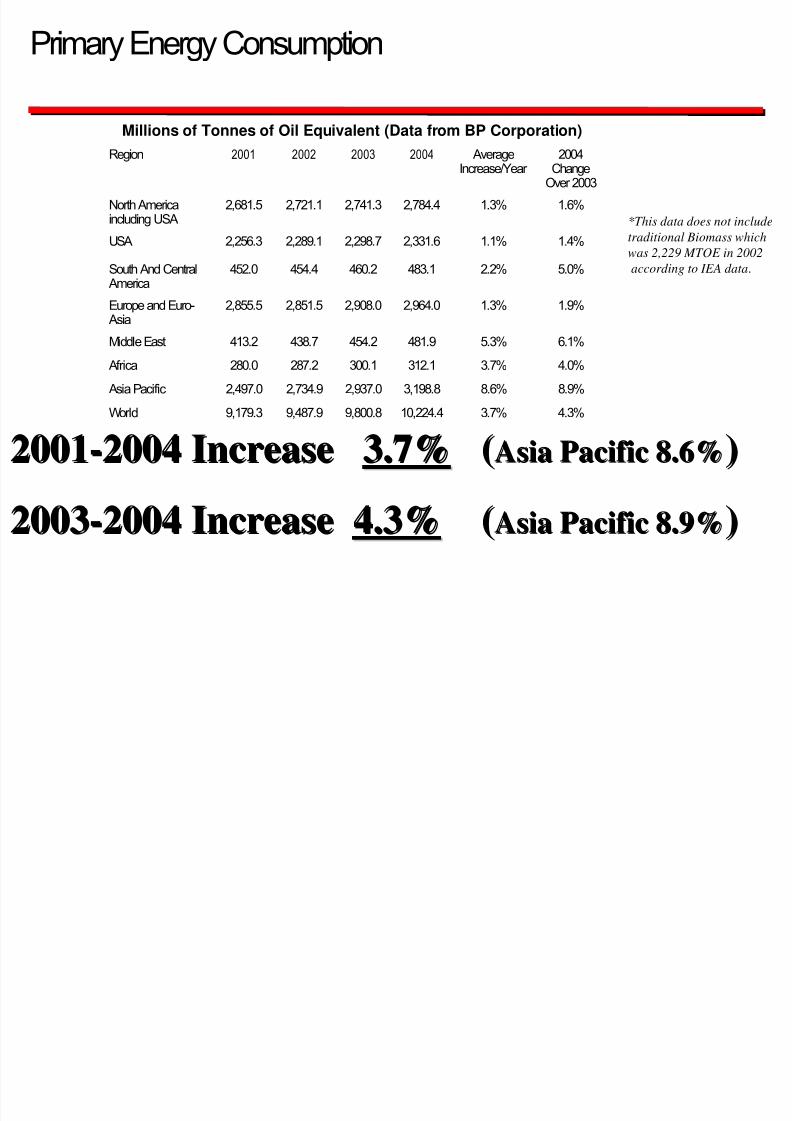
Primary Energy Consumption
Region 2001 2002 2003 2004 AverageIncrease/Year
2004Change
Over 2003
North Americaincluding USA 2,681.5 2,721.1 2,741.3 2,784.4 1.3% 1.6%
USA 2,256.3 2,289.1 2,298.7 2,331.6 1.1% 1.4%
South And CentralAmerica
452.0 454.4 460.2 483.1 2.2% 5.0%
Europe and Euro-Asia 2,855.5 2,851.5 2,908.0 2,964.0 1.3% 1.9%
Middle East 413.2 438.7 454.2 481.9 5.3% 6.1%
Africa 280.0 287.2 300.1 312.1 3.7% 4.0%
Asia Pacific 2,497.0 2,734.9 2,937.0 3,198.8 8.6% 8.9%
World 9,179.3 9,487.9 9,800.8 10,224.4 3.7% 4.3%
Millions of Tonnes of Oil Equivalent (Data from BP Corporation)
*This data does not include
traditional Biomass which
was 2,229 MTOE in 2002
according to IEA data.
20012001--2004 Increase2004 Increase 3.7%3.7% ((Asia Pacific 8.6%Asia Pacific 8.6%))
20032003--2004 Increase2004 Increase 4.3%4.3% ((Asia Pacific 8.9%Asia Pacific 8.9%))

8/3/2019 Hunter Fanney
http://slidepdf.com/reader/full/hunter-fanney 4/19
The Need for Renewable Energy
Future Energy Projections
Average annual growth rate of 2%(low estimate)
will result in primary energy demand
• doubling by 2037
• tripling by 2057

8/3/2019 Hunter Fanney
http://slidepdf.com/reader/full/hunter-fanney 5/19
The Need for Renewable Energy
Oil Reserves – 41 YearsNatural Gas – 40 Years
Coal – 164 Years
Projected Depletion of Current Fuels
2003 Fuel Shares in World Total Primary Energy Supply
Oil, 34.40%
Nuclear, 6.50%Coal, 24.40%
Natural Gas,
21.20%
Other renewables,
0.50%
Combustible
Renewables and
Waste, 10.60%
Hydro, 2.20%
Renewables,
13.30%
IEA Renewables Information (2005).
(Geothermal, Wind, Solar, Tide)

8/3/2019 Hunter Fanney
http://slidepdf.com/reader/full/hunter-fanney 6/19
Renewable Energy
Direct and Indirect Forms of Solar Energy
Renewable Resources will have to provide at
least 50% of the world’s energy by 2050
Renewable Resources will have to provide atRenewable Resources will have to provide at
least 50% of the worldleast 50% of the world’’s energy by 2050s energy by 2050
8/3/2019 Hunter Fanney
http://slidepdf.com/reader/full/hunter-fanney 7/19
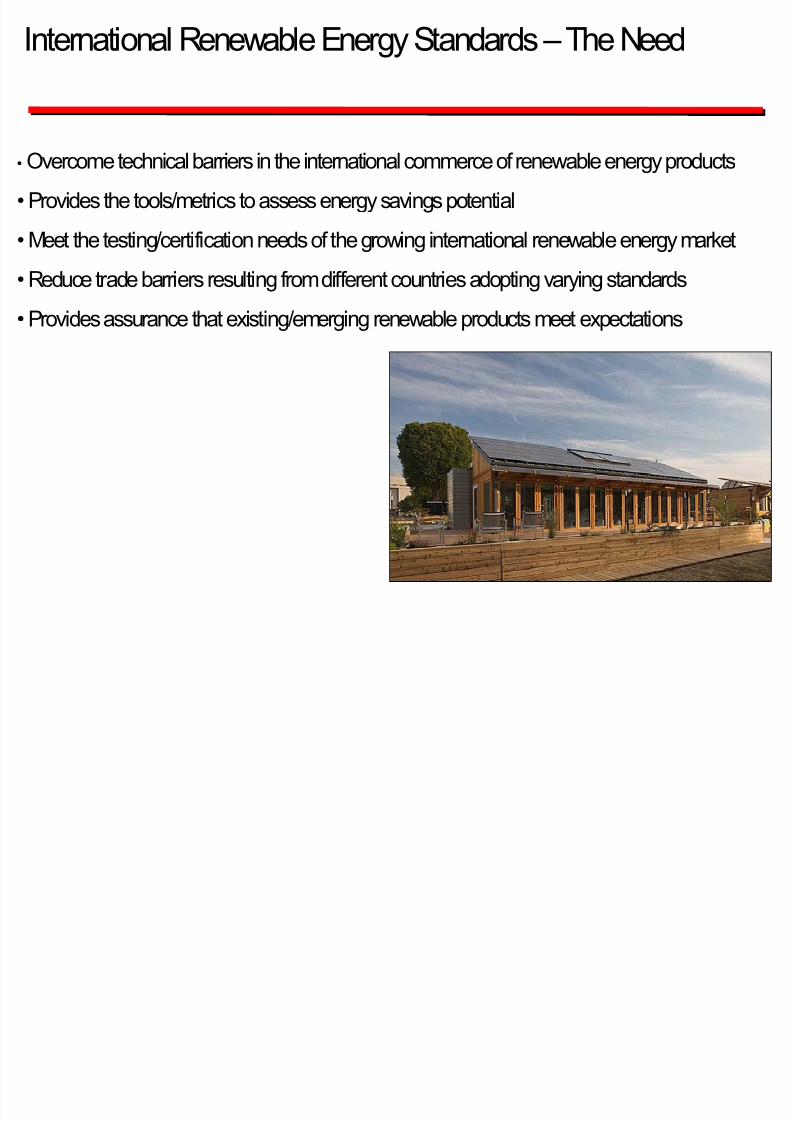
International Renewable Energy Standards –The Need
• Overcome technical barriers in the international commerce of renewable energy products
• Provides the tools/metrics to assess energy savings potential• Meet the testing/certification needs of the growing international renewable energy market
• Reduce trade barriers resulting from different countries adopting varying standards
• Provides assurance that existing/emerging renewable products meet expectations
8/3/2019 Hunter Fanney
http://slidepdf.com/reader/full/hunter-fanney 8/19
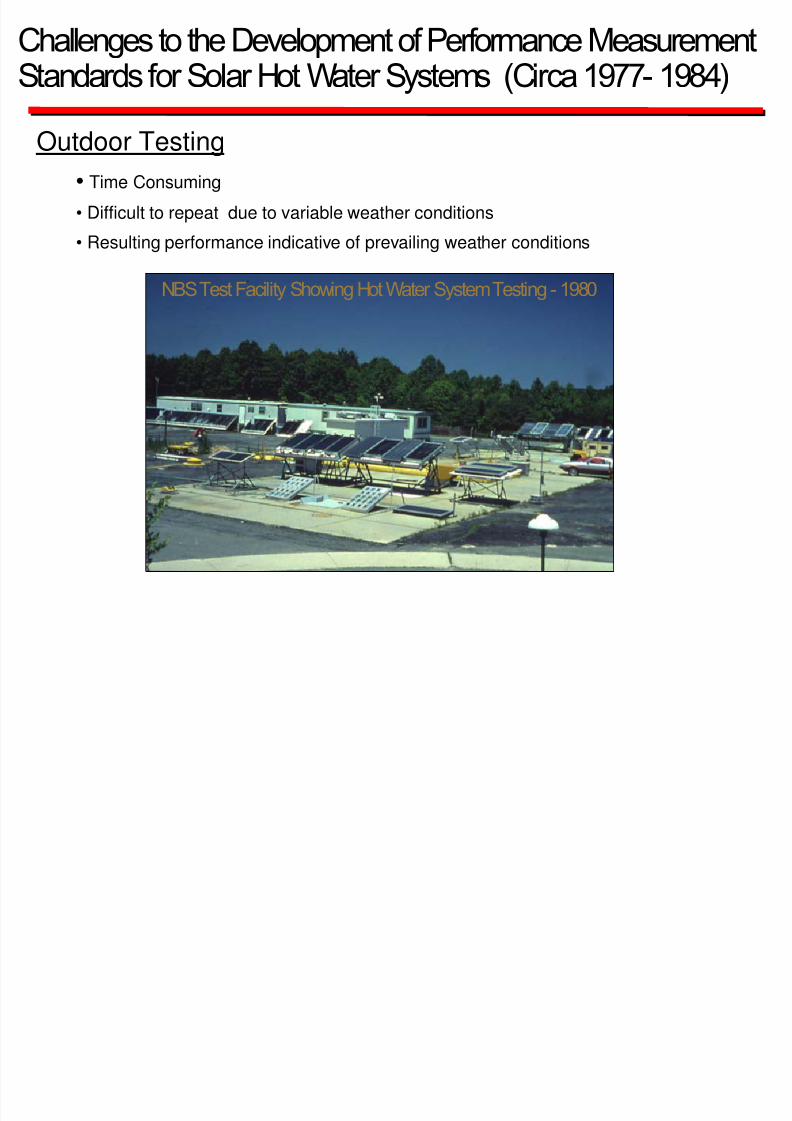
Challenges to the Development of Performance MeasurementStandards for Solar Hot Water Systems (Circa 1977- 1984)
Outdoor Testing
• Time Consuming
• Difficult to repeat due to variable weather conditions
• Resulting performance indicative of prevailing weather conditions
NBS Test Facility Showing Hot Water System Testing - 1980

8/3/2019 Hunter Fanney
http://slidepdf.com/reader/full/hunter-fanney 9/19
Challenges to the Development of Performance MeasurementStandards for Solar Hot Water Systems –(Circa 1977-1984)
Indoor Testing Using Solar Simulator• Expensive
• Applicable to all system types• Resulting performance indicative of simulated conditions
• Lacked ability to predict annual performance
Refrigerant Charged Solar Hot Water System Evaluated Outdoors at NBS and Indoors at National Solar Test Facility in Canada
8/3/2019 Hunter Fanney
http://slidepdf.com/reader/full/hunter-fanney 10/19
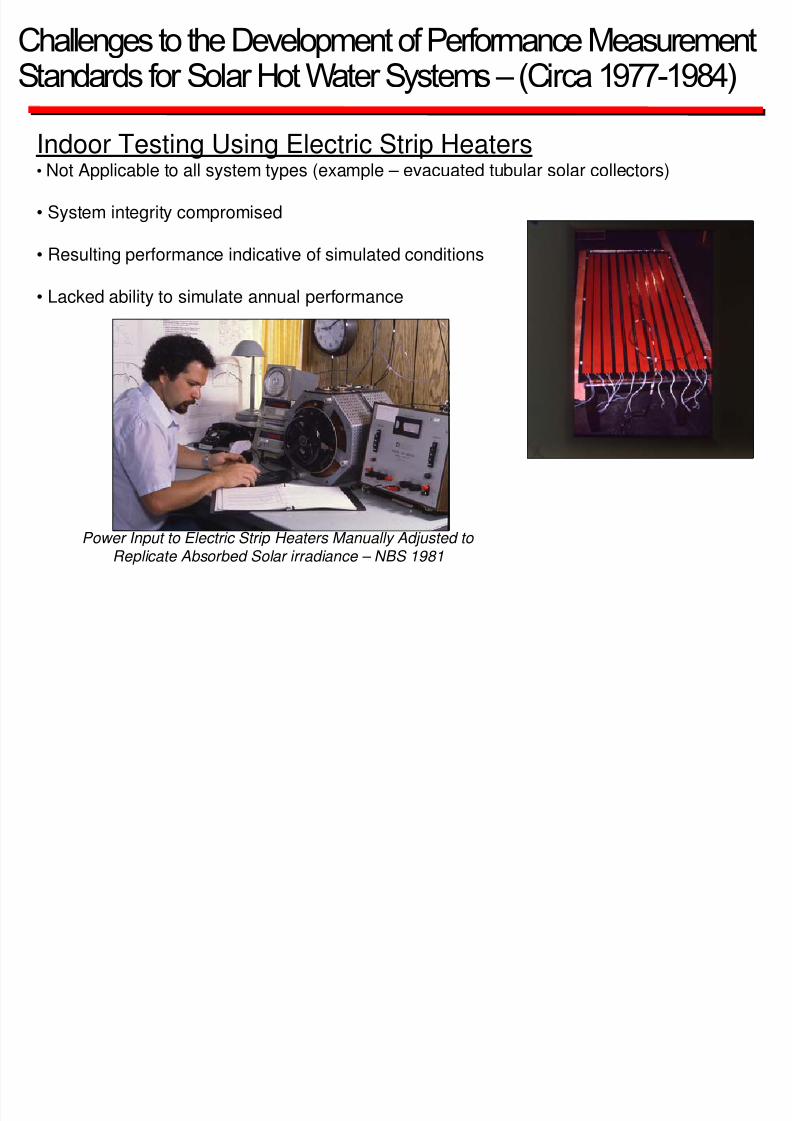
Challenges to the Development of Performance MeasurementStandards for Solar Hot Water Systems –(Circa 1977-1984)
Power Input to Electric Strip Heaters Manually Adjusted to Replicate Absorbed Solar irradiance – NBS 1981
Indoor Testing Using Electric Strip Heaters• Not Applicable to all system types (example – evacuated tubular solar collectors)
• System integrity compromised
• Resulting performance indicative of simulated conditions
• Lacked ability to simulate annual performance

8/3/2019 Hunter Fanney
http://slidepdf.com/reader/full/hunter-fanney 11/19
Challenges to the Development of Performance MeasurementStandards for Solar Hot Water Systems –(Circa 1977-1984)
Power Input to Conventional Heat Source Adjusted Such That Combination of Heat Source and Non-irradiated Collector Array Replicated Thermal Output of
Irradiated Solar Collector Array
Indoor Testing Using Non irradiated Collectors + Heat Source
• Not applicable to all system types (thermosyphon and integratedcollector storage)
• Resulting performance indicative of simulated conditions• Lacked ability to simulate annual performance
Electric Conventional Heat Source andVacuum Insulated Enclosure

8/3/2019 Hunter Fanney
http://slidepdf.com/reader/full/hunter-fanney 12/19
A Success Story In Renewable Energy Standards
Testing and Rating Methods for Solar Hot Water Systems
Performance Test Methods
• Five ISO Standards produced
•ISO 9459-1,-2,-3,-4,-5
• European National Standards
•EN 12976-2, ENV 129777-2
• U.S. Standards
• ASHRAE 95, SRCC TM-1/OG300
Certification Bodies
• Solar Keymark(Europe)
• SRCC (US)
8/3/2019 Hunter Fanney
http://slidepdf.com/reader/full/hunter-fanney 13/19
A Success Story In Renewable Energy Standards
Testing and Rating Methods for Solar Hot Water Systems
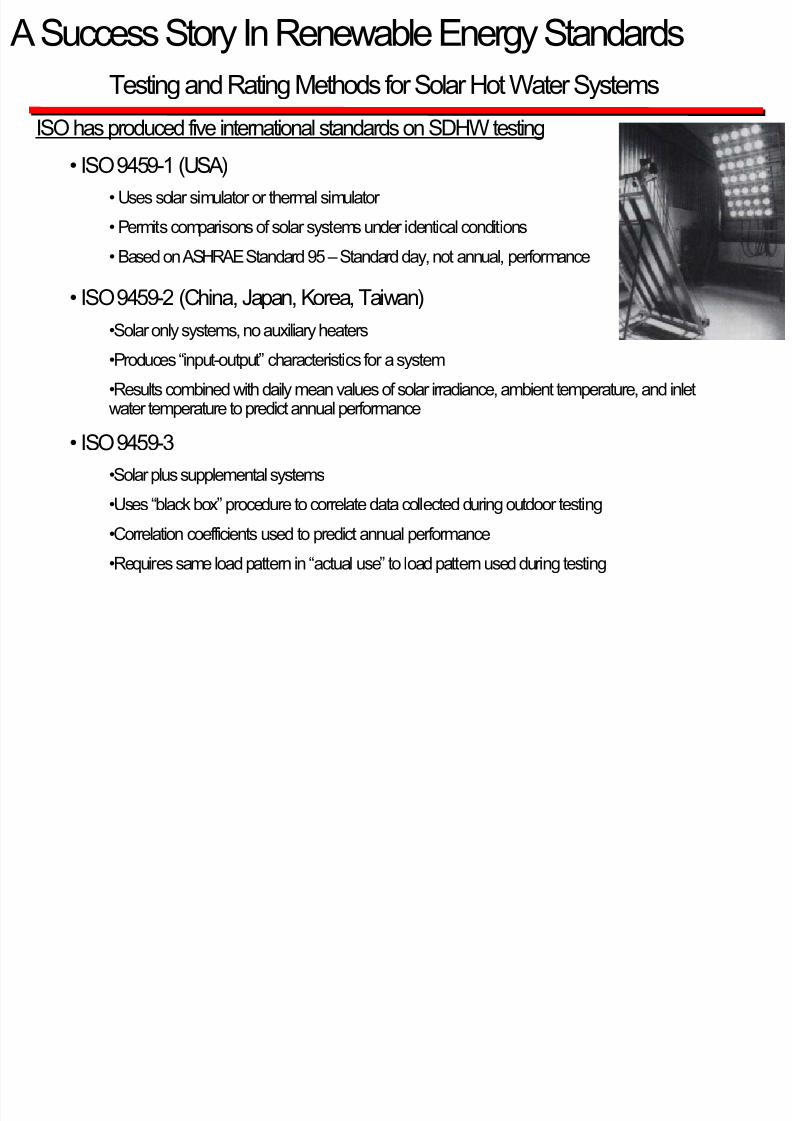
ISO has produced five international standards on SDHW testing
• ISO 9459-1 (USA)
• Uses solar simulator or thermal simulator
• Permits comparisons of solar systems under identical conditions
• Based on ASHRAE Standard 95 –Standard day, not annual, performance
• ISO 9459-2 (China, Japan, Korea, Taiwan)
•Solar only systems, no auxiliary heaters
•Produces “input-output” characteristics for a system
•Results combined with daily mean values of solar irradiance, ambient temperature, and inlet
water temperature to predict annual performance• ISO 9459-3
•Solar plus supplemental systems
•Uses “black box” procedure to correlate data collected during outdoor testing
•Correlation coefficients used to predict annual performance
•Requires same load pattern in “actual use” to load pattern used during testing
8/3/2019 Hunter Fanney
http://slidepdf.com/reader/full/hunter-fanney 14/19
A Success Story In Renewable Energy Standards
Testing and Rating Methods for Solar Hot Water Systems
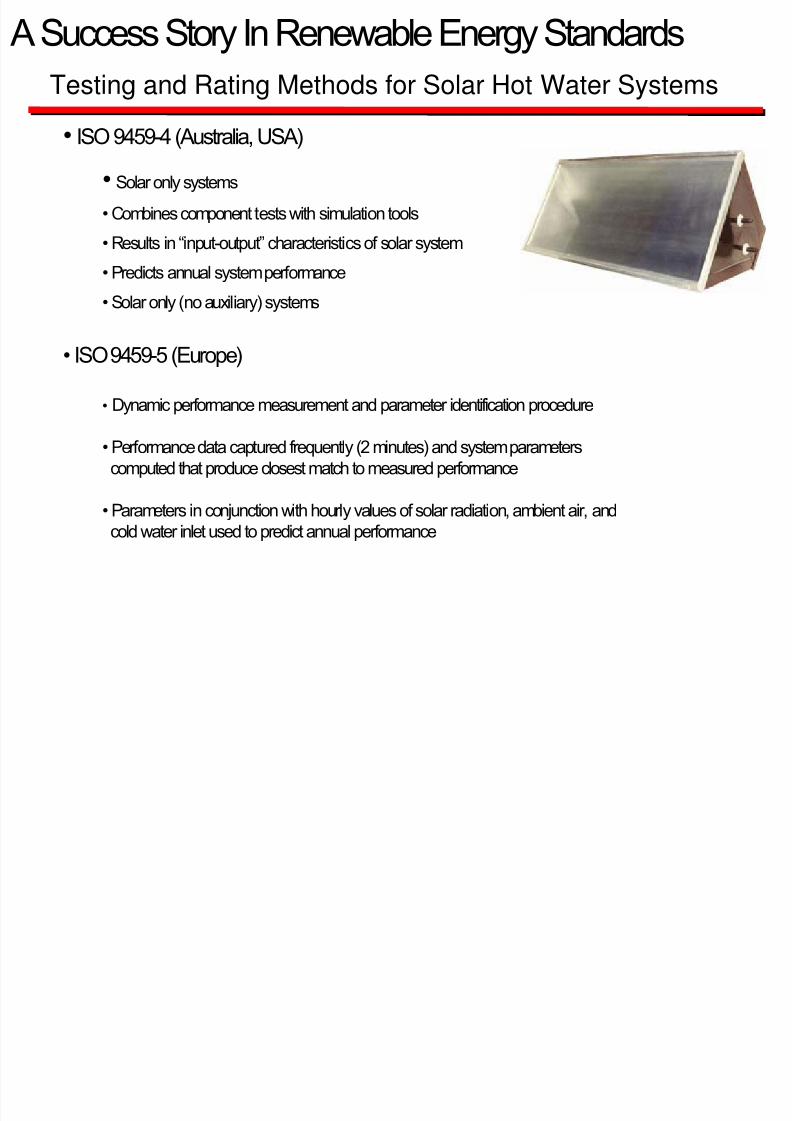
• ISO 9459-4 (Australia, USA)
• Solar only systems
• Combines component tests with simulation tools
• Results in “input-output” characteristics of solar system
• Predicts annual system performance
• Solar only (no auxiliary) systems
• ISO 9459-5 (Europe)
• Dynamic performance measurement and parameter identification procedure
• Performance data captured frequently (2 minutes) and system parameterscomputed that produce closest match to measured performance
• Parameters in conjunction with hourly values of solar radiation, ambient air, andcold water inlet used to predict annual performance

8/3/2019 Hunter Fanney
http://slidepdf.com/reader/full/hunter-fanney 15/19
Current Challenge in Renewable Energy Testing/StandardsPV Module Power Rating
• Photovoltaic Modules Compete on Dollars Per Watt
•Examples:
•$4.31 per watt at SRC for MulticrystallineModule (05/17/07)•$3.00 per watt at SRC for Thin Film Module (05/17/07)
• Module rating uncertainty can result in significant loss/gain of revenue
•Example –5 percent uncertainty in module power rating
• 5 kW System (typical residential) - Over/under payment $1250
• 100 kW Commercial Installation – Over/under payment $25,000
35 42 48 54 58 61 72 83 89 127 153 202287
401560
750
1256
1815
2536
0
500
1000
1500
2000
2500
3000
M W
1988 1989 1990 1991 1992 1993 1994 1995 1996 1997 1998 1999 2000 2001 2002 2003 2004 2005 2006
Year
Annual Production of Photovoltaics
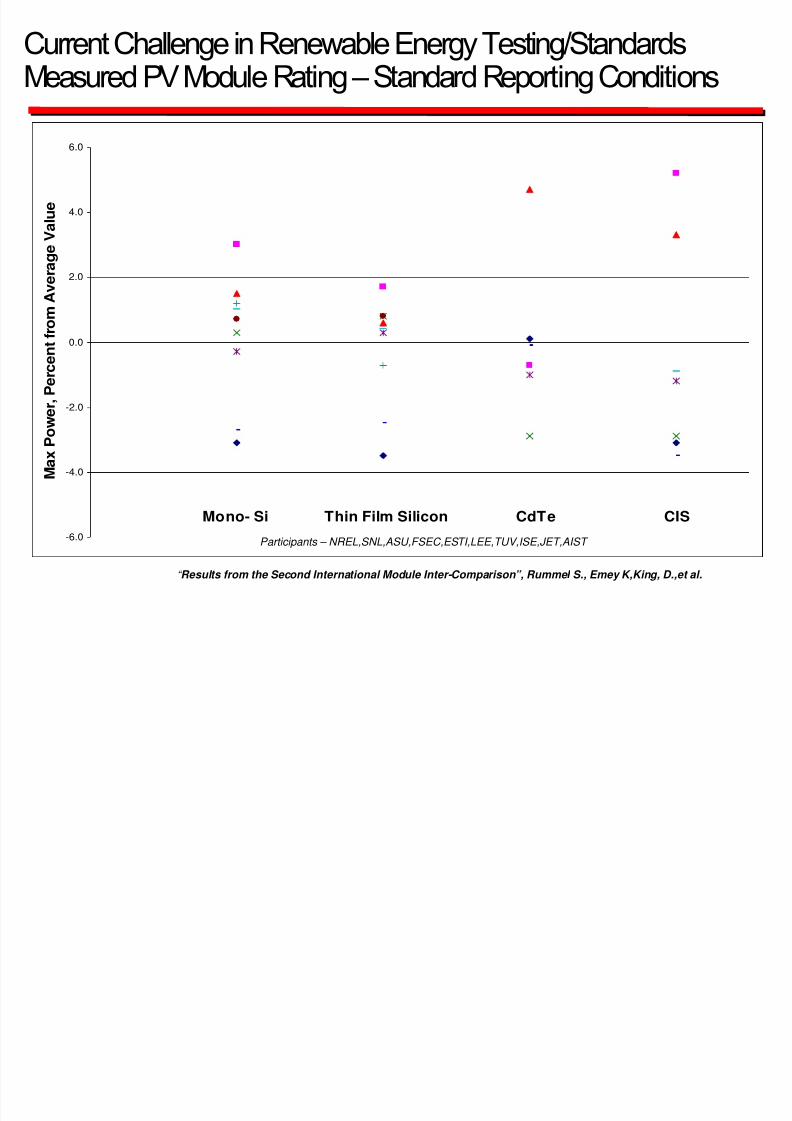
• Significant Uncertainty (+/- 6%) Present in Photovoltaic Power Rating
8/3/2019 Hunter Fanney
http://slidepdf.com/reader/full/hunter-fanney 16/19
Current Challenge in Renewable Energy Testing/StandardsMeasured PV Module Rating –Standard Reporting Conditions
Mono- Si Thin Film Silicon CdTe CIS-6.0
-4.0
-2.0
0.0
2.0
4.0
6.0
M a x P o w e r , P e r c e n t f r o m
A v e r a g e V a l u e
Participants – NREL,SNL,ASU,FSEC,ESTI,LEE,TUV,ISE,JET,AIST
“ Results from the Second International Module Inter-Comparison”, Rummel S., Emey K,King, D.,et al.
C t Ch ll i R bl E T ti /St d d

8/3/2019 Hunter Fanney
http://slidepdf.com/reader/full/hunter-fanney 17/19
Current Challenge in Renewable Energy Testing/StandardsMeasured PV Module Rating
• Limited Windows of Opportunity
• Clear Sky Conditions• Low Wind Velocity Conditions
• Outdoor Variable Conditions• Solar Irradiance
• Solar Spectrum• Wind Velocity/Direction
• Cell Temperature
• Requires Translation from PerformanceMeasurements under Outdoor Conditions toStandard Reporting Conditions
• Significant Uncertainty in Solar Radiometric
Measurements
Standard reporting conditionsSolar Irradiance 1000 W/m2
Module Temperature 25 CIncident Angle – 0 DegreesSolar Spectrum – ASTM E892/IEC 904-3
NIST’s Outdoor Solar Test Facility
Outdoor Testing Challenges
8/3/2019 Hunter Fanney
http://slidepdf.com/reader/full/hunter-fanney 18/19
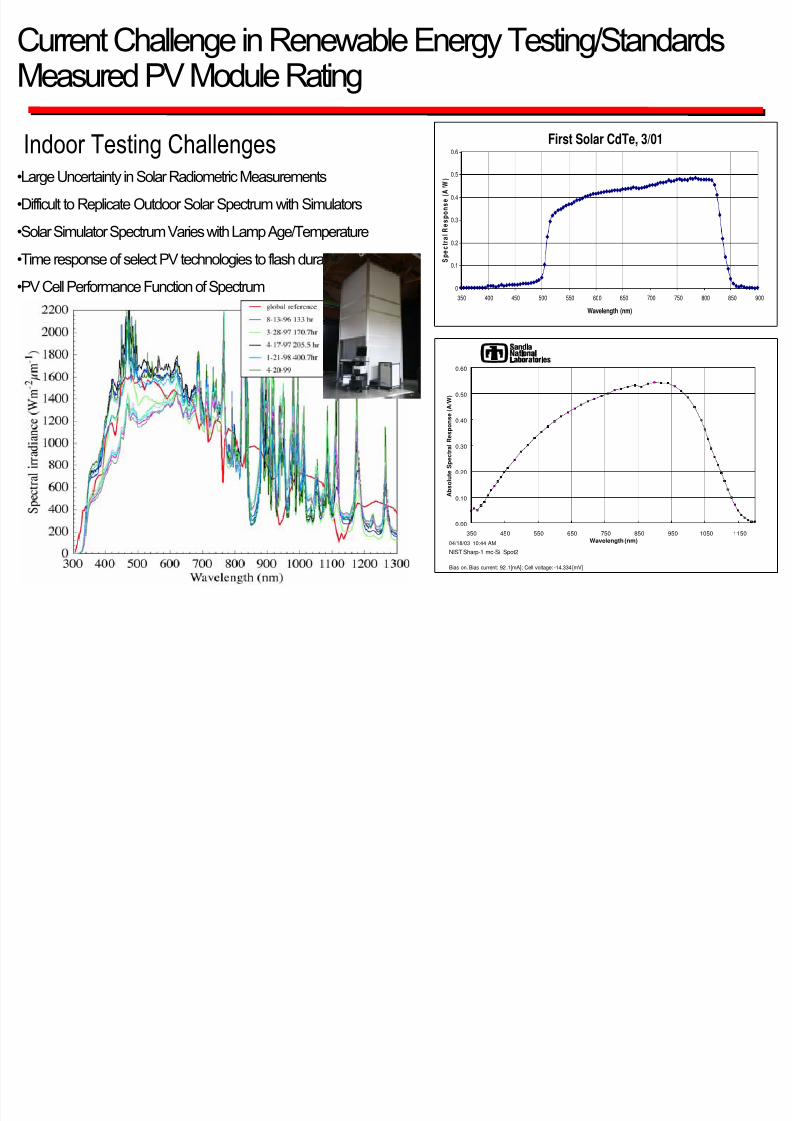
Current Challenge in Renewable Energy Testing/StandardsMeasured PV Module Rating
First Solar CdTe, 3/01
0
0.1
0.2
0.3
0.4
0.5
0.6
350 400 450 500 550 600 650 700 750 800 850 900
Wavelength (nm)
S p e c t r a l R e s p o n s e ( A / W )
“If NIST could improve the methods used to rate PV modules it could have a dramatic impact on the PV industry” - Juris Kalejs, RWE Schott Solar,Vice Presidentof Research
•Large Uncertainty in Solar Radiometric Measurements
•Difficult to Replicate Outdoor Solar Spectrum with Simulators•Solar Simulator Spectrum Varies with Lamp Age/Temperature
•Time response of select PV technologies to flash durations
•PV Cell Performance Function of Spectrum
Indoor Testing Challenges
0.00
0.10
0.20
0.30
0.40
0.50
0.60
350 450 550 650 750 850 950 1050 1150
Wavelength (nm)
A b s o l u t e S p e c t r a l R e s p o n s e ( A / W )
04/18/03 10:44 AM
NIST Sharp-1 mc-Si Spot2
Bias on. Bias current: 92 .1[mA]; Cell voltage: -14.334[mV]
8/3/2019 Hunter Fanney
http://slidepdf.com/reader/full/hunter-fanney 19/19
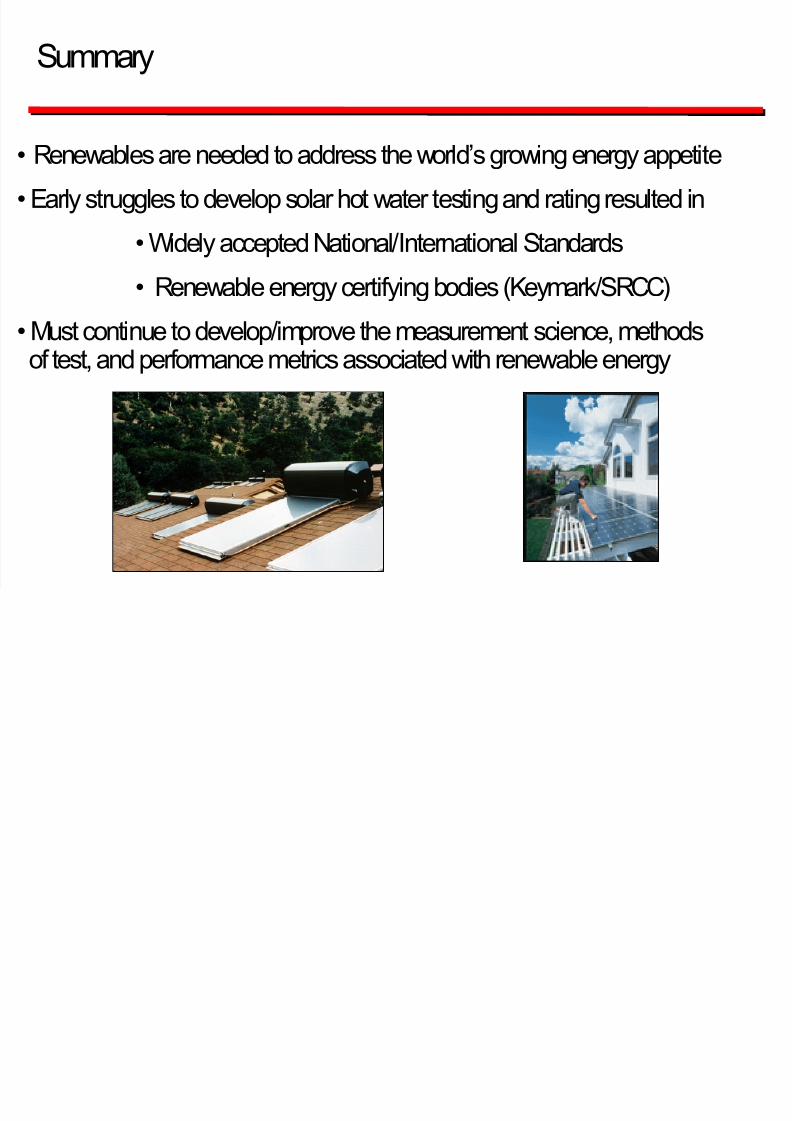
Summary
• Renewablesare needed to address the world’s growing energy appetite
• Early struggles to develop solar hot water testing and rating resulted in• Widely accepted National/International Standards
• Renewable energy certifying bodies (Keymark/SRCC)
• Must continue to develop/improve the measurement science, methodsof test, and performance metrics associated with renewable energy