


Languages
Pages
Legal

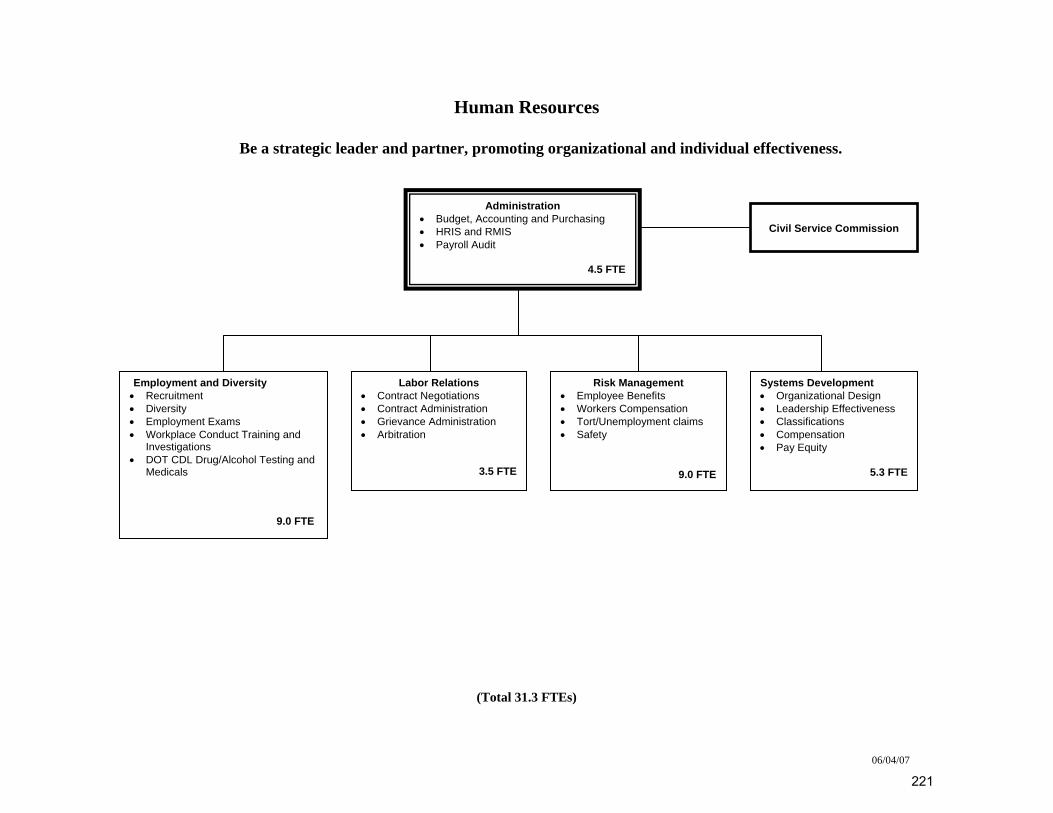
Human Resources
Be a strategic leader and partner, promoting organizational and individual effectiveness.
Administration • Budget, Accounting and Purchasing
Civil Service Commission • HRIS and RMIS • Payroll Audit
4.5 FTE
Employment and Diversity Labor Relations Risk Management Systems Development • Employee Benefits
(Total 31.3 FTEs)
• Workers Compensation • Tort/Unemployment claims • Safety
9.0 FTE
• Recruitment • Contract Negotiations • Organizational Design • Diversity • Contract Administration • Leadership Effectiveness • Employment Exams • Grievance Administration • Classifications • Workplace Conduct Training and
Investigations • Arbitration • Compensation
• Pay Equity • DOT CDL Drug/Alcohol Testing and
Medicals 3.5 FTE
5.3 FTE
9.0 FTE
06/04/07
221
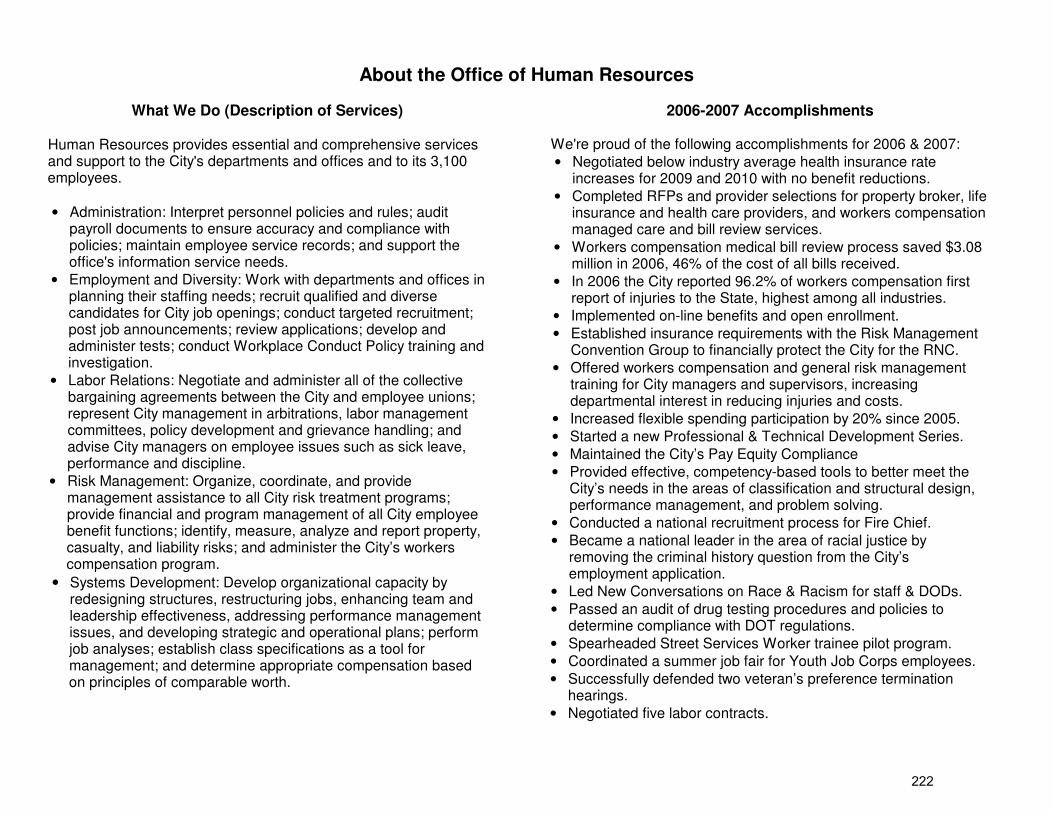
About the Office of Human Resources
What We Do (Description of Services)
Human Resources provides essential and comprehensive services and support to the City's departments and offices and to its 3,100 employees. • Administration: Interpret personnel policies and rules; audit
payroll documents to ensure accuracy and compliance with policies; maintain employee service records; and support the office's information service needs.
• Employment and Diversity: Work with departments and offices in planning their staffing needs; recruit qualified and diverse candidates for City job openings; conduct targeted recruitment; post job announcements; review applications; develop and administer tests; conduct Workplace Conduct Policy training and investigation.
• Labor Relations: Negotiate and administer all of the collective bargaining agreements between the City and employee unions; represent City management in arbitrations, labor management committees, policy development and grievance handling; and advise City managers on employee issues such as sick leave, performance and discipline.
• Risk Management: Organize, coordinate, and provide management assistance to all City risk treatment programs; provide financial and program management of all City employee benefit functions; identify, measure, analyze and report property, casualty, and liability risks; and administer the City’s workers compensation program.
• Systems Development: Develop organizational capacity by redesigning structures, restructuring jobs, enhancing team and leadership effectiveness, addressing performance management issues, and developing strategic and operational plans; perform job analyses; establish class specifications as a tool for management; and determine appropriate compensation based on principles of comparable worth.
2006-2007 Accomplishments
We're proud of the following accomplishments for 2006 & 2007: • Negotiated below industry average health insurance rate
increases for 2009 and 2010 with no benefit reductions. • Completed RFPs and provider selections for property broker, life
insurance and health care providers, and workers compensation managed care and bill review services.
• Workers compensation medical bill review process saved $3.08 million in 2006, 46% of the cost of all bills received.
• In 2006 the City reported 96.2% of workers compensation first report of injuries to the State, highest among all industries.
• Implemented on-line benefits and open enrollment. • Established insurance requirements with the Risk Management
Convention Group to financially protect the City for the RNC. • Offered workers compensation and general risk management
training for City managers and supervisors, increasing departmental interest in reducing injuries and costs.
• Increased flexible spending participation by 20% since 2005. • Started a new Professional & Technical Development Series. • Maintained the City’s Pay Equity Compliance • Provided effective, competency-based tools to better meet the
City’s needs in the areas of classification and structural design, performance management, and problem solving.
• Conducted a national recruitment process for Fire Chief. • Became a national leader in the area of racial justice by
removing the criminal history question from the City’s employment application.
• Led New Conversations on Race & Racism for staff & DODs. • Passed an audit of drug testing procedures and policies to
determine compliance with DOT regulations. • Spearheaded Street Services Worker trainee pilot program. • Coordinated a summer job fair for Youth Job Corps employees. • Successfully defended two veteran’s preference termination
hearings. • Negotiated five labor contracts.
222
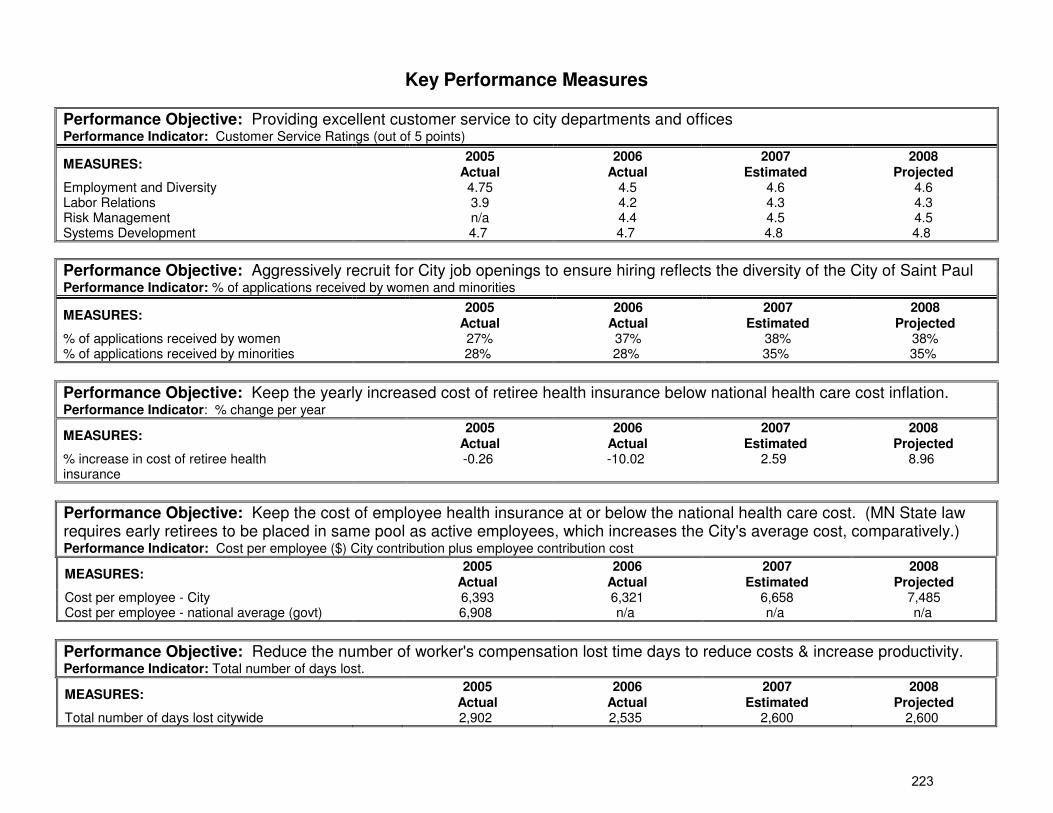
Key Performance Measures
Performance Objective: Providing excellent customer service to city departments and offices Performance Indicator: Customer Service Ratings (out of 5 points)
MEASURES: 2005 Actual
2006 Actual
2007 Estimated
2008 Projected
Employment and Diversity 4.75 4.5 4.6 4.6 Labor Relations 3.9 4.2 4.3 4.3 Risk Management n/a 4.4 4.5 4.5 Systems Development 4.7 4.7 4.8 4.8
Performance Objective: Aggressively recruit for City job openings to ensure hiring reflects the diversity of the City of Saint Paul Performance Indicator: % of applications received by women and minorities
MEASURES: 2005 Actual
2006 Actual
2007 Estimated
2008 Projected
% of applications received by women 27% 37% 38% 38% % of applications received by minorities 28% 28% 35% 35%
Performance Objective: Keep the yearly increased cost of retiree health insurance below national health care cost inflation. Performance Indicator: % change per year
MEASURES: 2005 Actual
2006 Actual
2007 Estimated
2008 Projected
% increase in cost of retiree health insurance
-0.26 -10.02 2.59 8.96
Performance Objective: Keep the cost of employee health insurance at or below the national health care cost. (MN State law requires early retirees to be placed in same pool as active employees, which increases the City's average cost, comparatively.) Performance Indicator: Cost per employee ($) City contribution plus employee contribution cost
MEASURES: 2005 Actual
2006 Actual
2007 Estimated
2008 Projected
Cost per employee - City 6,393 6,321 6,658 7,485 Cost per employee - national average (govt) 6,908 n/a n/a n/a
Performance Objective: Reduce the number of worker's compensation lost time days to reduce costs & increase productivity. Performance Indicator: Total number of days lost.
MEASURES: 2005 Actual
2006 Actual
2007 Estimated
2008 Projected
Total number of days lost citywide 2,902 2,535 2,600 2,600
223
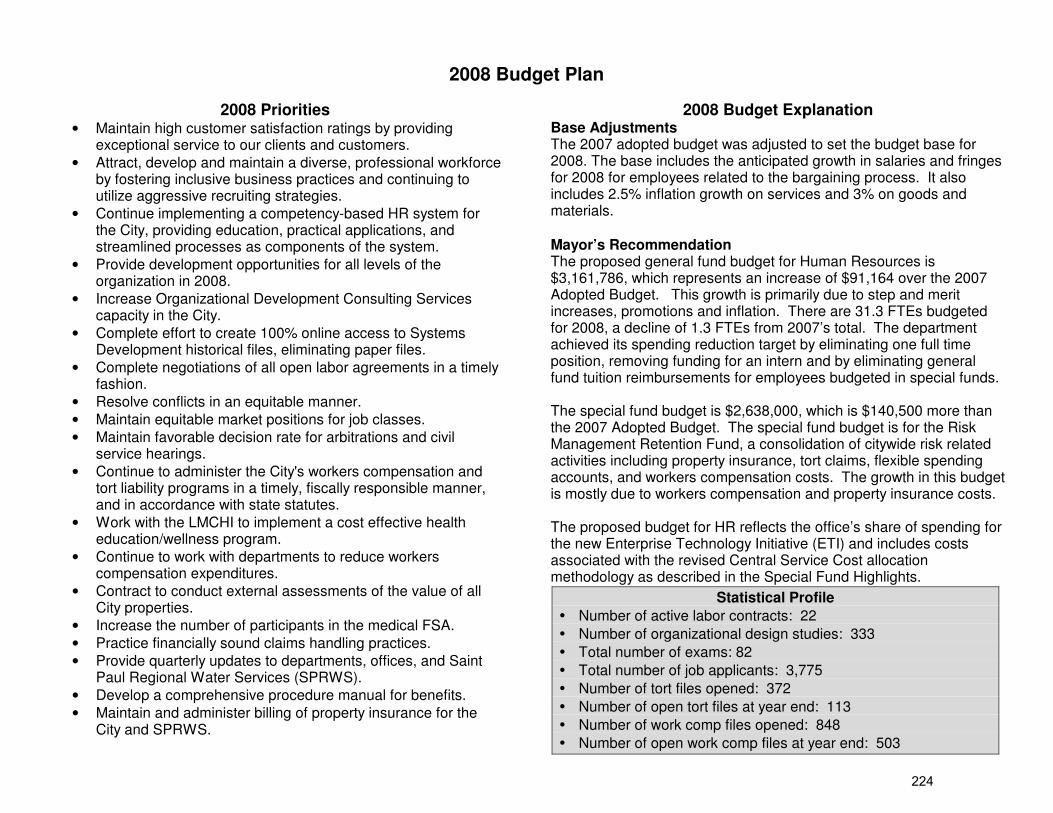
2008 Budget Plan
2008 Priorities • Maintain high customer satisfaction ratings by providing
exceptional service to our clients and customers. • Attract, develop and maintain a diverse, professional workforce
by fostering inclusive business practices and continuing to utilize aggressive recruiting strategies.
• Continue implementing a competency-based HR system for the City, providing education, practical applications, and streamlined processes as components of the system.
• Provide development opportunities for all levels of the organization in 2008.
• Increase Organizational Development Consulting Services capacity in the City.
• Complete effort to create 100% online access to Systems Development historical files, eliminating paper files.
• Complete negotiations of all open labor agreements in a timely fashion.
• Resolve conflicts in an equitable manner. • Maintain equitable market positions for job classes. • Maintain favorable decision rate for arbitrations and civil
service hearings. • Continue to administer the City's workers compensation and
tort liability programs in a timely, fiscally responsible manner, and in accordance with state statutes.
• Work with the LMCHI to implement a cost effective health education/wellness program.
• Continue to work with departments to reduce workers compensation expenditures.
• Contract to conduct external assessments of the value of all City properties.
• Increase the number of participants in the medical FSA. • Practice financially sound claims handling practices. • Provide quarterly updates to departments, offices, and Saint
Paul Regional Water Services (SPRWS). • Develop a comprehensive procedure manual for benefits. • Maintain and administer billing of property insurance for the
City and SPRWS.
2008 Budget Explanation Base Adjustments The 2007 adopted budget was adjusted to set the budget base for 2008. The base includes the anticipated growth in salaries and fringes for 2008 for employees related to the bargaining process. It also includes 2.5% inflation growth on services and 3% on goods and materials. Mayor’s Recommendation The proposed general fund budget for Human Resources is $3,161,786, which represents an increase of $91,164 over the 2007 Adopted Budget. This growth is primarily due to step and merit increases, promotions and inflation. There are 31.3 FTEs budgeted for 2008, a decline of 1.3 FTEs from 2007’s total. The department achieved its spending reduction target by eliminating one full time position, removing funding for an intern and by eliminating general fund tuition reimbursements for employees budgeted in special funds. The special fund budget is $2,638,000, which is $140,500 more than the 2007 Adopted Budget. The special fund budget is for the Risk Management Retention Fund, a consolidation of citywide risk related activities including property insurance, tort claims, flexible spending accounts, and workers compensation costs. The growth in this budget is mostly due to workers compensation and property insurance costs. The proposed budget for HR reflects the office’s share of spending for the new Enterprise Technology Initiative (ETI) and includes costs associated with the revised Central Service Cost allocation methodology as described in the Special Fund Highlights.
Statistical Profile • Number of active labor contracts: 22 • Number of organizational design studies: 333 • Total number of exams: 82 • Total number of job applicants: 3,775 • Number of tort files opened: 372 • Number of open tort files at year end: 113 • Number of work comp files opened: 848 • Number of open work comp files at year end: 503
224
2008 Budget Plan (Continued) 2008 Budget Explanation (continued) Council Actions The City Council adopted the Office of Human Resources budget and recommendations as proposed by the Mayor and approved the following changes:
• Accepted technical changes to the special fund budget, which revise spending estimates for property insurance and tort claims.
• Accepted technical changes to the special fund budget, which increase property insurance revenue estimates and reduce the use of fund balance as a revenue source.
The 2008 adopted budget is $3,161,786 for the general fund and $2,348,000 in special funds. The adopted budget includes 31.3 general fund FTEs and no special fund FTEs.
225

Spending Reports 227
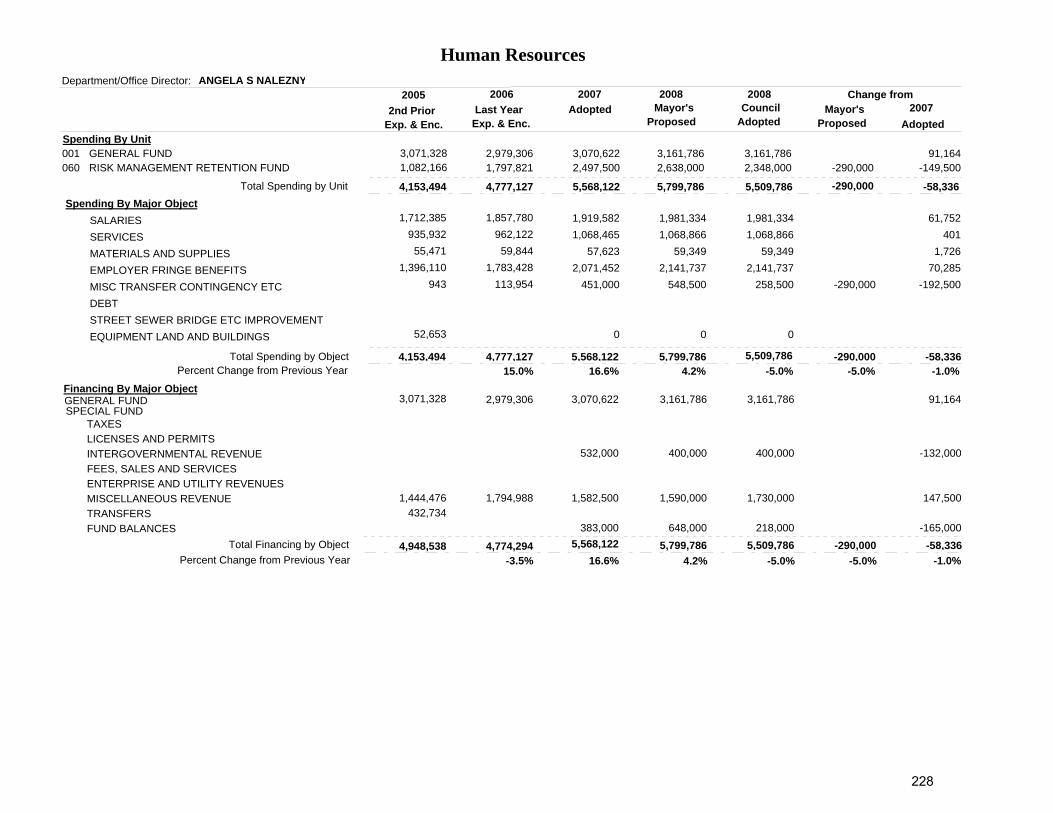
4,153,494 4,777,127 5,568,122 5,799,786 -58,336
3,071,328 1,082,166
2,979,3061,797,821
2nd PriorExp. & Enc.
3,070,6222,497,500
Last YearExp. & Enc.
3,161,7862,638,000
Adopted
91,164-149,500
Change from
GENERAL FUNDRISK MANAGEMENT RETENTION FUND
001060
Adopted
4,153,494 4,777,127 5,568,122 5,799,786 -58,336
1,712,385 935,932 55,471
1,396,110 943
52,653
1,857,780 962,122 59,844
1,783,428 113,954
1,919,5821,068,465
57,6232,071,452
451,000
0
1,981,3341,068,866
59,3492,141,737
548,500
0
61,752401
1,72670,285
-192,500
SALARIESSERVICESMATERIALS AND SUPPLIESEMPLOYER FRINGE BENEFITSMISC TRANSFER CONTINGENCY ETCDEBTSTREET SEWER BRIDGE ETC IMPROVEMENTEQUIPMENT LAND AND BUILDINGS
Spending By Major Object
4,948,538 4,774,294 5,568,122 5,799,786 -58,336
1,444,476 432,734
1,794,988
532,000
1,582,500
383,000
400,000
1,590,000
648,000
-132,000
147,500
-165,000
TAXESLICENSES AND PERMITSINTERGOVERNMENTAL REVENUEFEES, SALES AND SERVICESENTERPRISE AND UTILITY REVENUESMISCELLANEOUS REVENUETRANSFERSFUND BALANCES
Financing By Major Object
Department/Office Director:2005 2006 2007 2008
2007
Spending By Unit
15.0% 16.6% 4.2% -1.0%
-3.5% 16.6% 4.2% -1.0%
Human ResourcesANGELA S NALEZNY
GENERAL FUNDSPECIAL FUND
3,071,328 2,979,306 3,070,622 3,161,786 91,164
Total Spending by Unit
Total Spending by Object
Total Financing by Object
Percent Change from Previous Year
Percent Change from Previous Year
3,161,7862,348,000 -290,000
1,981,3341,068,866
59,3492,141,737
258,500
0
-290,000
-290,000-5.0% -5.0%
3,161,786
400,000
1,730,000
218,000-290,000
-5.0% -5.0%
2008Mayor's
ProposedCouncil
AdoptedMayor's
Proposed
-290,0005,509,786
5,509,786
5,509,786
228
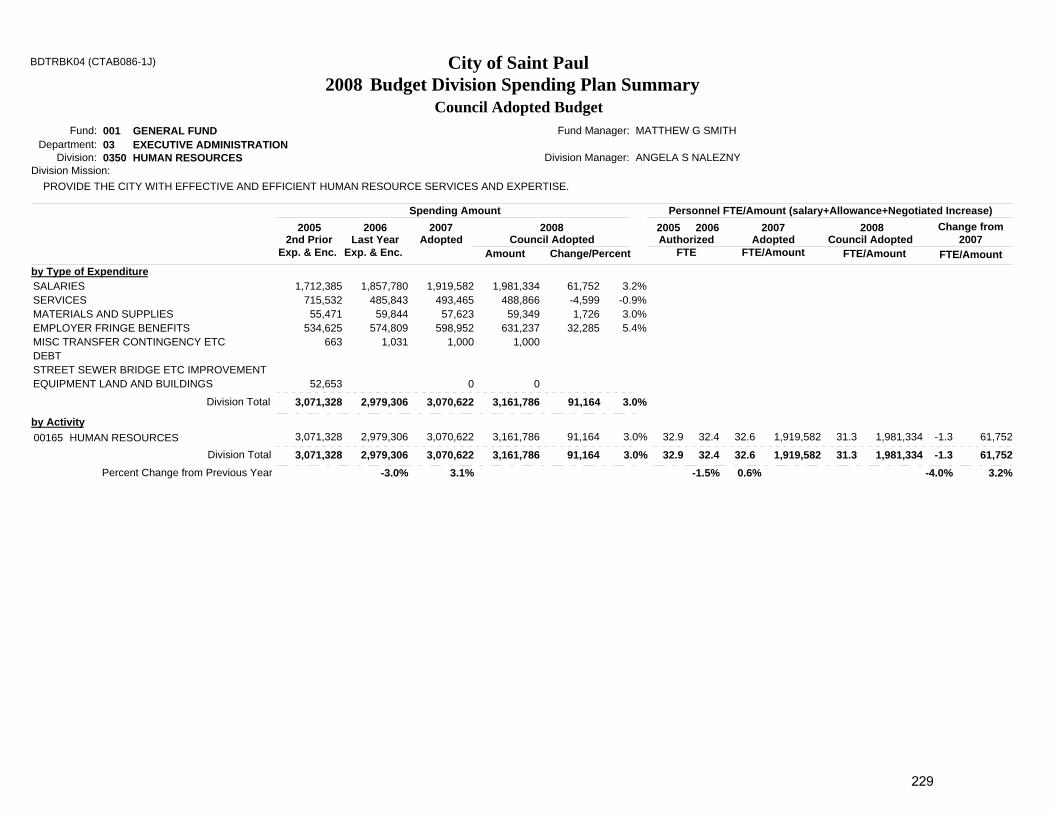
Budget Division Spending Plan Summary 2008City of Saint PaulBDTRBK04 (CTAB086-1J)
Council Adopted Budget001Fund:03Department:0350Division:
3,071,328 2,979,306 3,070,622 3,161,786
1,712,385 715,532 55,471
534,625 663
52,653
1,857,780 485,843 59,844
574,809 1,031
1,919,582 493,465 57,623
598,952 1,000
0
1,981,334 488,866 59,349
631,237 1,000
0
GENERAL FUND MATTHEW G SMITHFund Manager:
SALARIESSERVICESMATERIALS AND SUPPLIESEMPLOYER FRINGE BENEFITSMISC TRANSFER CONTINGENCY ETCDEBTSTREET SEWER BRIDGE ETC IMPROVEMENTEQUIPMENT LAND AND BUILDINGS
EXECUTIVE ADMINISTRATIONHUMAN RESOURCES
Division Mission:
3,071,328 2,979,306 3,070,62200165 HUMAN RESOURCES 3,071,328 2,979,306 3,070,622 3,161,786 32.9 32.4 32.6 31.3 1,919,582 1,981,334by Activity
32.9 32.4 32.6 31.3 1,919,582 1,981,334
Spending Amount2005 2006 2007 2008
Adopted2nd PriorExp. & Enc.
Last YearExp. & Enc.
Personnel FTE/Amount (salary+Allowance+Negotiated Increase)2005 2007 2008Authorized
FTE
2006Adopted
FTE/Amount
PROVIDE THE CITY WITH EFFECTIVE AND EFFICIENT HUMAN RESOURCE SERVICES AND EXPERTISE.
61,752-1.3
Division Total
Division Total
Division Manager: ANGELA S NALEZNY
3,161,786
by Type of Expenditure 61,752-4,599 1,726
32,285
3.2%-0.9% 3.0% 5.4%
91,164 3.0% 61,752-1.3
Percent Change from Previous Year
Amount Change/Percent
91,164 3.0%
91,164 3.0%
Change from2007
FTE/AmountFTE/Amount
-4.0% 3.2%-1.5% 0.6%-3.0% 3.1%
Council Adopted Council Adopted
229
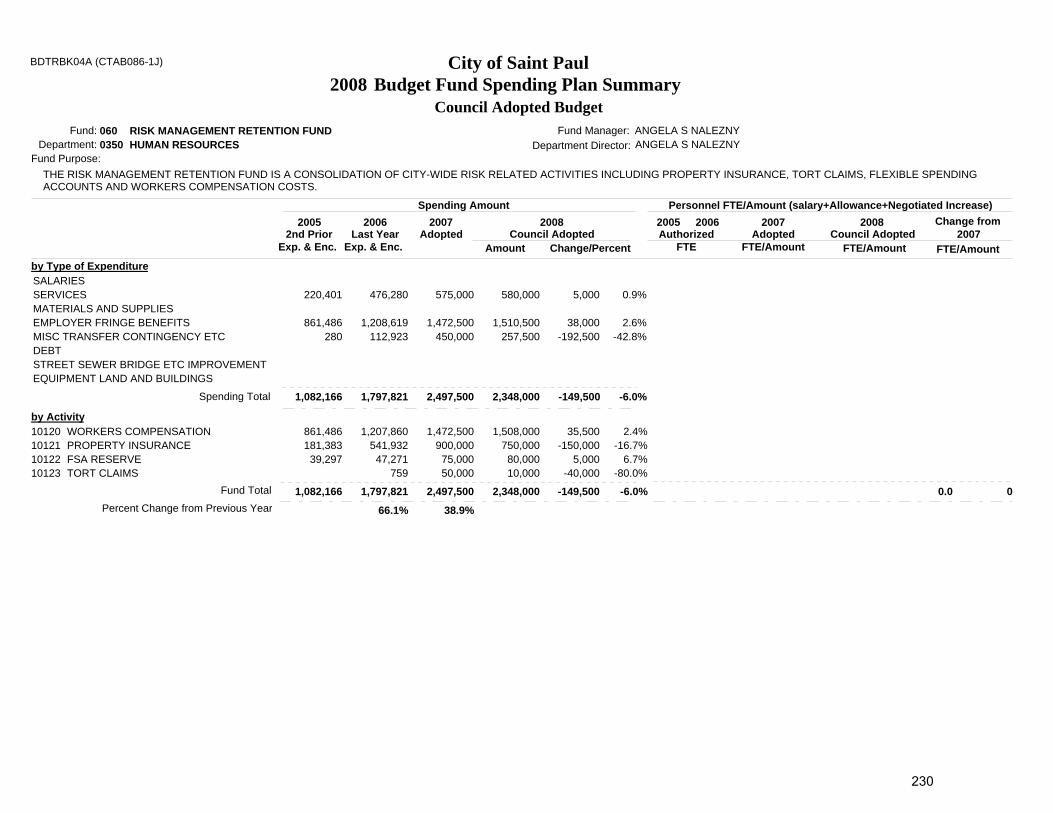
Budget Fund Spending Plan Summary 2008City of Saint PaulBDTRBK04A (CTAB086-1J)
Council Adopted Budget060Fund:0350Department:
1,082,166 1,797,821 2,497,500 2,348,000
220,401
861,486 280
476,280
1,208,619 112,923
575,000
1,472,500 450,000
580,000
1,510,500 257,500
RISK MANAGEMENT RETENTION FUND ANGELA S NALEZNYFund Manager:
SALARIESSERVICESMATERIALS AND SUPPLIESEMPLOYER FRINGE BENEFITSMISC TRANSFER CONTINGENCY ETCDEBTSTREET SEWER BRIDGE ETC IMPROVEMENTEQUIPMENT LAND AND BUILDINGS
HUMAN RESOURCES
1,082,166 2,497,500
10120101211012210123
WORKERS COMPENSATIONPROPERTY INSURANCEFSA RESERVETORT CLAIMS
861,486 181,383 39,297
1,472,500 900,000 75,000 50,000
1,508,000 750,000 80,000 10,000
by Activity
Spending Amount2005 2006 2007 2008
Adopted2nd PriorExp. & Enc.
Last YearExp. & Enc.
Personnel FTE/Amount (salary+Allowance+Negotiated Increase)2005 2007 2008Authorized
FTE
2006Adopted
FTE/Amount
0 0.0
Spending Total
Fund Total 2,348,000
5,000
38,000-192,500
0.9%
2.6%-42.8%
35,500-150,000
5,000-40,000
2.4%-16.7%
6.7%-80.0%
Percent Change from Previous Year
Amount Change/Percent
-149,500 -6.0%
-149,500 -6.0%
Change from2007
FTE/AmountFTE/Amount
Department Director: ANGELA S NALEZNY
1,797,821
Fund Purpose:THE RISK MANAGEMENT RETENTION FUND IS A CONSOLIDATION OF CITY-WIDE RISK RELATED ACTIVITIES INCLUDING PROPERTY INSURANCE, TORT CLAIMS, FLEXIBLE SPENDINGACCOUNTS AND WORKERS COMPENSATION COSTS.
by Type of Expenditure
66.1% 38.9%
1,207,860 541,932 47,271
759
Council Adopted Council Adopted
230

Financing Reports 231
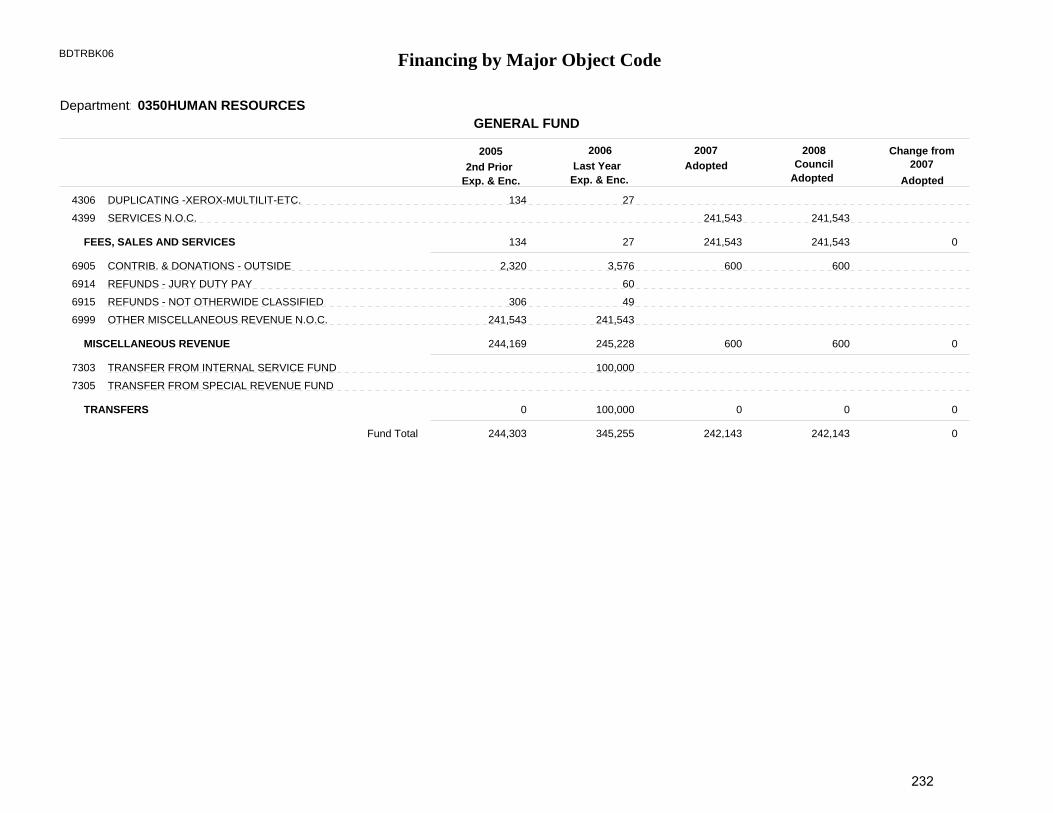
Financing by Major Object CodeBDTRBK06
0350Department:GENERAL FUND
244,303 345,255 242,143 242,143 0
134
244,169
0
27
245,228
100,000
241,543
600
0
241,543
600
0
0
0
0
4306
4399
6905
6914
6915
6999
7303
7305
134
2,320
306
241,543
27
3,576
60
49
241,543
100,000
241,543
600
241,543
600
HUMAN RESOURCES
DUPLICATING -XEROX-MULTILIT-ETC.
SERVICES N.O.C.
CONTRIB. & DONATIONS - OUTSIDE
REFUNDS - JURY DUTY PAY
REFUNDS - NOT OTHERWIDE CLASSIFIED
OTHER MISCELLANEOUS REVENUE N.O.C.
TRANSFER FROM INTERNAL SERVICE FUND
TRANSFER FROM SPECIAL REVENUE FUND
FEES, SALES AND SERVICES
MISCELLANEOUS REVENUE
TRANSFERS
2nd PriorExp. & Enc.
Last YearExp. & Enc.
AdoptedChange from
Adopted
2005 2006 2007 20082007Council
Adopted
Fund Total
232
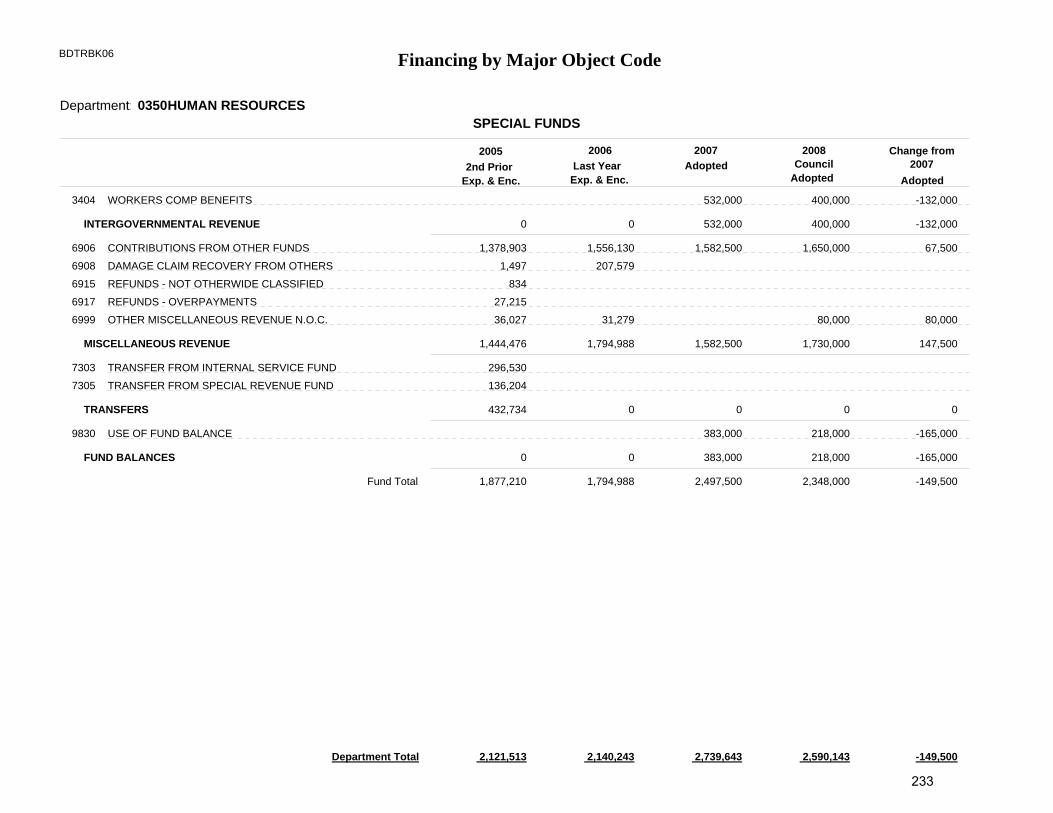
Financing by Major Object CodeBDTRBK06
0350Department:
2,121,513Department Total 2,140,243 2,739,643 2,590,143 -149,500
SPECIAL FUNDS
1,877,210 1,794,988 2,497,500 2,348,000 -149,500
0
1,444,476
432,734
0
0
1,794,988
0
0
532,000
1,582,500
0
383,000
400,000
1,730,000
0
218,000
-132,000
147,500
0
-165,000
3404
6906
6908
6915
6917
6999
7303
7305
9830
1,378,903
1,497
834
27,215
36,027
296,530
136,204
1,556,130
207,579
31,279
532,000
1,582,500
383,000
400,000
1,650,000
80,000
218,000
-132,000
67,500
80,000
-165,000
HUMAN RESOURCES
WORKERS COMP BENEFITS
CONTRIBUTIONS FROM OTHER FUNDS
DAMAGE CLAIM RECOVERY FROM OTHERS
REFUNDS - NOT OTHERWIDE CLASSIFIED
REFUNDS - OVERPAYMENTS
OTHER MISCELLANEOUS REVENUE N.O.C.
TRANSFER FROM INTERNAL SERVICE FUND
TRANSFER FROM SPECIAL REVENUE FUND
USE OF FUND BALANCE
INTERGOVERNMENTAL REVENUE
MISCELLANEOUS REVENUE
TRANSFERS
FUND BALANCES
2nd PriorExp. & Enc.
Last YearExp. & Enc.
AdoptedChange from
Adopted
2005 2006 2007 20082007Council
Adopted
Fund Total
233
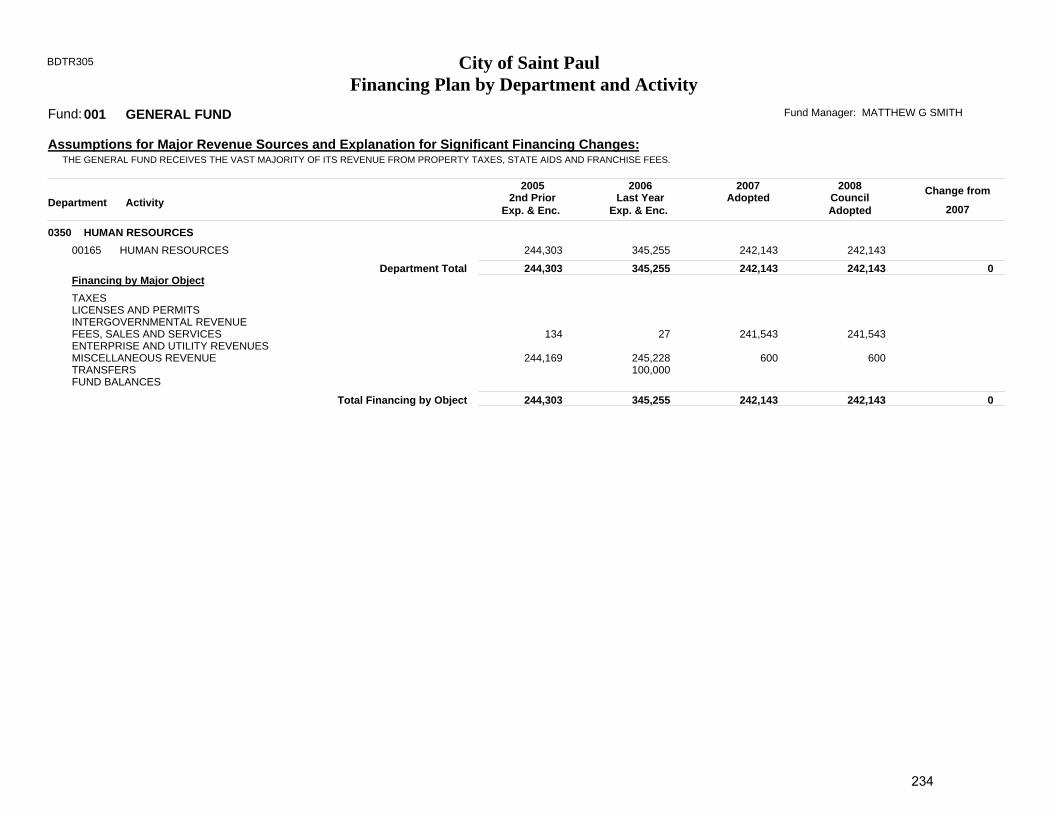
Financing Plan by Department and ActivityCity of Saint PaulBDTR305
001Fund:
0350
244,303 345,255 242,143 242,143 000165 HUMAN RESOURCES 244,303 345,255 242,143 242,143
Department Total
244,303 242,143 0
TAXESLICENSES AND PERMITSINTERGOVERNMENTAL REVENUEFEES, SALES AND SERVICESENTERPRISE AND UTILITY REVENUESMISCELLANEOUS REVENUETRANSFERSFUND BALANCES
134
244,169
27
245,228 100,000
241,543
600
241,543
600
Total Financing by Object
2005 2006 2007Adopted2nd Prior
Exp. & Enc. Last Year
Exp. & Enc.
2008
2007
Change fromDepartment Activity
MATTHEW G SMITH
THE GENERAL FUND RECEIVES THE VAST MAJORITY OF ITS REVENUE FROM PROPERTY TAXES, STATE AIDS AND FRANCHISE FEES.
GENERAL FUND Fund Manager:
Assumptions for Major Revenue Sources and Explanation for Significant Financing Changes:
HUMAN RESOURCES
CouncilAdopted
Financing by Major Object
345,255 242,143
234
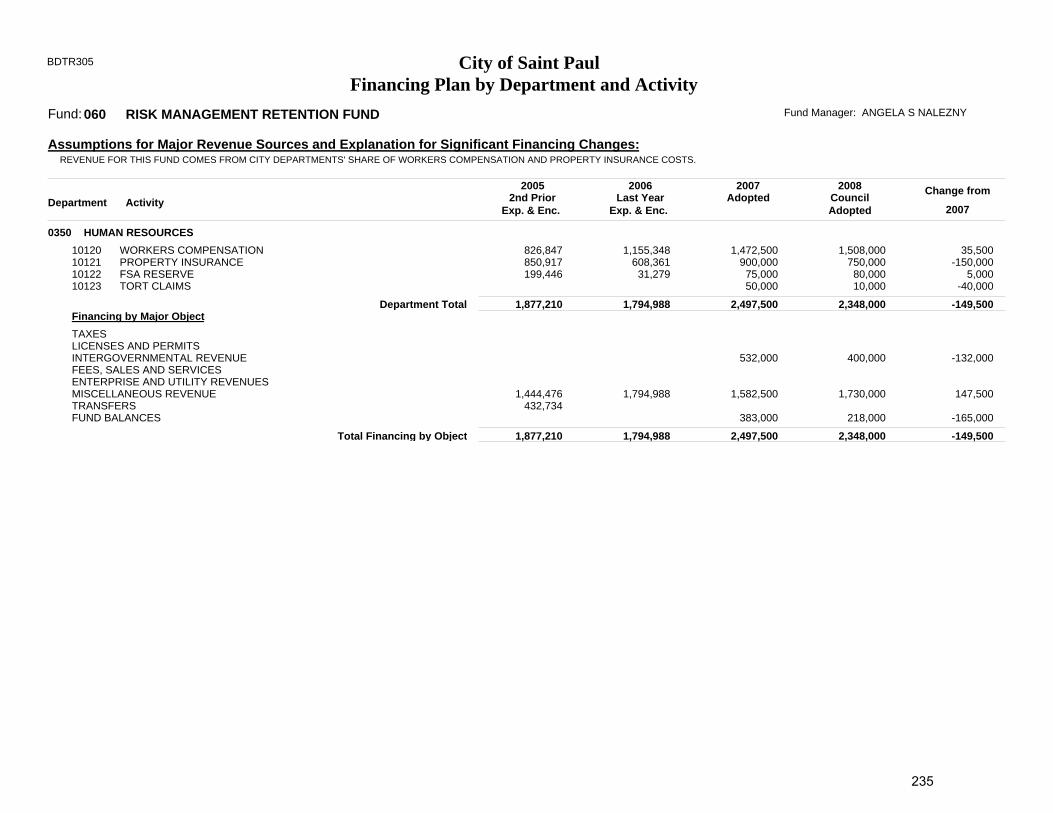
Financing Plan by Department and ActivityCity of Saint PaulBDTR305
060Fund:
0350
1,877,210 1,794,988 2,497,500 2,348,000 -149,500
10120101211012210123
WORKERS COMPENSATIONPROPERTY INSURANCEFSA RESERVETORT CLAIMS
826,847 850,917 199,446
1,155,348 608,361 31,279
1,472,500 900,000 75,000 50,000
1,508,000 750,000 80,000 10,000
35,500-150,000
5,000-40,000
Department Total
1,877,210 2,348,000 -149,500
TAXESLICENSES AND PERMITSINTERGOVERNMENTAL REVENUEFEES, SALES AND SERVICESENTERPRISE AND UTILITY REVENUESMISCELLANEOUS REVENUETRANSFERSFUND BALANCES
1,444,476 432,734
1,794,988
532,000
1,582,500
383,000
400,000
1,730,000
218,000
-132,000
147,500
-165,000
Total Financing by Object
2005 2006 2007Adopted2nd Prior
Exp. & Enc. Last Year
Exp. & Enc.
2008
2007
Change fromDepartment Activity
ANGELA S NALEZNY
REVENUE FOR THIS FUND COMES FROM CITY DEPARTMENTS' SHARE OF WORKERS COMPENSATION AND PROPERTY INSURANCE COSTS.
RISK MANAGEMENT RETENTION FUND Fund Manager:
Assumptions for Major Revenue Sources and Explanation for Significant Financing Changes:
HUMAN RESOURCES
CouncilAdopted
Financing by Major Object
1,794,988 2,497,500
235

Personnel Reports 237

Page 6
JAN-16-08 12:30 PM
BDTR108 2008Budget YearCity of Saint Paul
Personnel Summary by Fund, Department, Division and Activity
0350
32.4 32.9 -1.3
0350
32.4 32.9 -1.300165 32.4 32.9 -1.3
Division Total
Activity
GENERAL FUND
HUMAN RESOURCESHUMAN RESOURCES
HUMAN RESOURCES
DepartmentDivision
Department Total
Change from
31.3
31.3 31.3
32.6
32.6 32.6
Council Adopted200720062005 2008
2007AdoptedFTE
AdoptedFTE
Adopted FTE FTE Adopted
238
Top Related