


Languages
Pages
Legal

November 2020
1
A MONTHLY CHARTBOOK
HOUSING FINANCE POLICY CENTER
HOUSING FINANCEAT A GLANCE

ABOUT THE CHARTBOOK
The Housing Finance Policy Center’s (HFPC) mission is to produce analyses and ideas that promote sound public policy, efficient markets, and access to economic opportunity in the area of housing finance. At A Glance, a monthly chartbook and data source for policymakers, academics, journalists, and others interested in the government’s role in mortgage markets, is at the heart of this mission.
We welcome feedback from our readers on how we can make At A Glance a more useful publication. Please email any comments or questions to [email protected].
To receive regular updates from the Housing Finance Policy Center, please visit here to sign up for our bi-weekly newsletter.
HOUSING FINANCE POLICY CENTER STAFF
Laurie GoodmanCenter Vice President
Alanna McCargoCenter Vice President
Janneke RatcliffeAssociate Vice President and Managing Director
Jim ParrottNonresident Fellow
Jun ZhuNonresident Fellow
Sheryl PardoAssociate Director of Communications
Karan KaulSenior Research Associate
Michael Neal Senior Research Associate
Jung ChoiResearch Associate
Linna ZhuResearch Associate
John WalshResearch Assistant
Caitlin YoungResearch Assistant
Daniel PangResearch Assistant
Alison Rincon
Director, Center Operations
Gideon Berger
Senior Policy Program Manager
Rylea Luckfield
Special Assistant and Project Administrator
CONTENTSOverview
Market Size OverviewValue of the US Residential Housing Market 6Size of the US Residential Mortgage Market 6Private Label Securities 7Agency Mortgage-Backed Securities 7
Origination Volume and Composition First Lien Origination Volume & Share 8
Mortgage Origination Product TypeComposition (All Originations) 9Percent Refi at Issuance
9Cash-Out Refinances
Loan Amount After Refinancing 10Cash-out Refinance Share of All Originations 10Total Home Equity Cashed Out 10
Nonbank Origination ShareNonbank Origination Share: All Loans 11Nonbank Origination Share: Purchase Loans 11Nonbank Origination Share: Refi Loans 11
Securitization Volume and CompositionAgency/Non-Agency Share of Residential MBS Issuance 12Non-Agency MBS Issuance 12Non-Agency Securitization 12
Credit Box
Housing Credit Availability Index (HCAI)Housing Credit Availability Index 13Housing Credit Availability Index by Channel 13-14
Credit Availability for Purchase LoansBorrower FICO Score at Origination Month 15Combined LTV at Origination Month 15DTI at Origination Month 15Origination FICO and LTV by MSA 16
Nonbank Credit BoxAgency FICO: Bank vs. Nonbank 17GSE FICO: Bank vs. Nonbank 17Ginnie Mae FICO: Bank vs. Nonbank 17GSE LTV: Bank vs. Nonbank 18Ginnie Mae LTV: Bank vs. Nonbank 18GSE DTI: Bank vs. Nonbank 18Ginnie Mae DTI: Bank vs. Nonbank 18
State of the Market
Mortgage Origination Projections & Originator ProfitabilityTotal Originations and Refinance Shares 19Originator Profitability and Unmeasured Costs 19

Housing SupplyMonths of Supply 20Housing Starts and Home Sales 20
Housing Affordability National Housing Affordability Over Time 21Affordability Adjusted for MSA-Level DTI 21
Home Price IndicesNational Year-Over-Year HPI Growth 22Changes in CoreLogic HPI for Top MSAs 22
First-Time HomebuyersFirst-Time Homebuyer Share 23Comparison of First-time and Repeat Homebuyers, GSE and FHA Originations 23
Delinquencies and Loss Mitigation Activity Negative Equity Share 24Loans in Serious Delinquency/Foreclosure 24Loan Modifications and Liquidations 24
GSEs under Conservatorship
GSE Portfolio Wind-DownFannie Mae Mortgage-Related Investment Portfolio 25Freddie Mac Mortgage-Related Investment Portfolio 25
Effective Guarantee Fees & GSE Risk-Sharing Transactions Effective Guarantee Fees 26Fannie Mae Upfront Loan-Level Price Adjustment 26GSE Risk-Sharing Transactions and Spreads 27-28
Serious Delinquency RatesSerious Delinquency Rates – Fannie Mae, Freddie Mac, FHA & VA 29Serious Delinquency Rates – Single-Family Loans & Multifamily GSE Loans 29
Agency Issuance
Agency Gross and Net IssuanceAgency Gross Issuance 30Agency Net Issuance 30
Agency Gross Issuance & Fed PurchasesMonthly Gross Issuance 31Fed Absorption of Agency Gross Issuance 31
Mortgage Insurance ActivityMI Activity & Market Share 32FHA MI Premiums for Typical Purchase Loan 33Initial Monthly Payment Comparison: FHA vs. PMI 33
Related HFPC Work
Publications and Events 34

Housing Supply Falls to Record Low Benefitting Home Sellers
The months’ supply of existing homes fell to an alarmingly low level of 2.5 months in October, and threatens to undermine the opportunity of homeownership for many households. The lack of homes alone makes homeownership difficult, but the lower supply also increases home prices, reducing affordability. One subtle reason that sales prices rise when supply is low, is that buyers must pay a higher price relative to the seller’s asking price. This suggests that sellers are benefitting from today’s low supply conditions. However, key supply and demand trends suggest that sellers’ advantage could erode somewhat in the coming months.
The 2.5 months’ supply of homes, reported by the National Association of Realtors (NAR), means that, at the current sales pace, the inventory of homes nationwide will be exhausted in less than 3 months. The recent decline in months’ supply from 4.8 months in May partly reflects a rebound in home sales. After existing home sales volume fell to 3.91 million in May, it then rose by 75 percent to approximately 6.85 million by October. NAR reports, however, that the inventory of homes for sale in October was just 1.4 million, a series low.
Amid shrinking inventory, sales prices have risen. Since May, existing home inventory has fallen by 5.0 percent according to NAR, while sales prices have risen by 1.3 percent according to Urban Institute calculations of Black Knight data. Since January 2012, when housing market activity began to sustainably improve after the sharp decline in the wake of the Great Recession, the inventory of existing homes has shrunk by 47.4 percent while house prices have risen 56.4 percent.
While the increase in sales prices tells us that demand is high, the sales-price to list-price ratio suggests that buyers are eager to purchase homes. As the inventory of for-sale homes has declined since 2012, the ratio of the sales-price to the list-price has increased. According to Redfin, the ratio of the sales-price to the list-price peaked in September 2020 at 99.4 percent, the latest month of data, a three-percentage point increase since February 2012, the first month of data. Inventory fell by 55 percent over this same period. In other words, as inventory has declined, the average homebuyer is paying a little closer to the sellers’ asking price.
The increase in the ratio of the sales-price to the list-price partly reflects a larger percentage of buyers paying a sales price that exceeds the seller’s list price. As inventory has declined since 2012, the share of buyers paying a sales price above the buyers asking price increased from 18.3 percent to 32.8 percent in September.
The housing market is tilted toward the seller, according to the current data, but that could change. There was a sharp rebound in single-family housing starts in recent months, suggesting that more supply is forthcoming. Additionally, the pace of purchase mortgage applications has moderated in recent months as COVID infections soar and the NAR Housing Affordability Index has fallen from its year ago level. Although the market currently favors sellers their advantage could inch somewhat closer to balance in the near future.
INSIDE THIS ISSUE• Although year-to-date 2020 nonagency
securitizations are down compared to 2019, there are clear signs of recovery. Securitization volumes in recent months have been highly comparable to the same months of last year (page 12).
• The serious delinquency rates for FHA and VA mortgages climbed higher in Q3 2020. FHA rose from 7.96 percent in Q2 to 10.76 percent in Q3. VA rose from 3.98 percent in Q2 to 5.77 percent in Q3 (page 29).
• VA’s share of new mortgage insurance written increased to 31 percent in Q3 2020, the highest level in at least 21 years (page 32).
INTRODUCTION
94%
95%
96%
97%
98%
99%
100%
0.0
0.5
1.0
1.5
2.0
2.5
Millions
For-sale Inventory Sale Price-List Price Ratio
Source: Redfin.
Sale-List Price Ratio Climbs Amid Inventory Decline
0%
10%
20%
30%
40%
2012 2013 2014 2015 2016 2017 2018 2019 2020
Share of Homes Sold Above List Price
Source: Redfin.
6
MARKET SIZE OVERVIEWThe Federal Reserve’s Flow of Funds Report has indicated a gradually increasing total value of the housing market, driven primarily by growing home equity since 2012. The Q2 2020 numbers show that while mortgage debt outstanding remained steady at $11.3 trillion, total home equity grew slightly from $21.1 trillion in Q1 2020 to $21.5 trillion in the second quarter of 2020, bringing the total value of the housing market to $32.8 trillion, 28.4 percent higher than the pre-crisis peak in 2006. Agency MBS account for 63.1 percent of the total mortgage debt outstanding, private-label securities make up 3.9 percent, and unsecuritized first liens make up 28.8 percent. Home equity loans comprise the remaining 4.2 percent of the total.
OVERVIEW
Debt,household mortgages,
$9,833
$7.13
$3.26
$0.44
$0.47
0
1
2
3
4
5
6
7
8
2000 2001 2002 2003 2004 2005 2006 2007 2008 2009 2010 2011 2012 2013 2014 2015 2016 2017 2018 2019 2020Q2
($ trillions)
Composition of the US Single Family Mortgage Market
Agency MBS Unsecuritized first liens Private Label Securities Home Equity loans
Sources: Federal Reserve Flow of Funds, eMBS and Urban Institute. Last updated September 2020.Note: Unsecuritized first liens includes loans held by commercial banks, GSEs, savings institutions, credit unions and other financial companies
$11.3
$21.5
$32.8
0.0
5.0
10.0
15.0
20.0
25.0
30.0
35.0
2000 2001 2002 2003 2004 2005 2006 2007 2008 2009 2010 2011 2012 2013 2014 2015 2016 2017 2018 2019 2020Q2
($ trillions)Debt Household equity Total value
Value of the US Single Family Housing Market
Sources: Federal Reserve Flow of Funds and Urban Institute. Last updated September 2020.Note: Single family includes 1-4 family mortgages. The home equity number is grossed up from Fed totals to include the value of households and the non-financial business sector.
7
MARKET SIZE OVERVIEWOVERVIEW
As of September 2020, our sample of first lien mortgage debt in the private-label securitization market totaled $280 billion and was split among prime (12.9 percent), Alt-A (29.5 percent), and subprime (57.6 percent) loans. In October 2020, outstanding securities in the agency market totaled $7.4 trillion, 42.6 percent of which was Fannie Mae, 29.4 percent Freddie Mac, and 28.0 percent Ginnie Mae.
0.040.080.16
0
0.2
0.4
0.6
0.8
1
1999 2000 2001 2002 2003 2004 2005 2006 2007 2008 2009 2010 2011 2012 2013 2014 2015 2016 2017 2018 2019 2020
($ trillions)
Private-Label Securities by Product Type
Prime Alt-A Subprime
Sources: CoreLogic, Black Knight and Urban Institute.
3.1
2.1
2.2
7.4
0
1
2
3
4
5
6
7
8
2000 2001 2002 2003 2004 2005 2006 2007 2008 2009 2010 2011 2012 2013 2014 2015 2016 2017 2018 2019 2020
($ trillions)Fannie Mae Freddie Mac Ginnie Mae Total
Agency Mortgage-Backed Securities
Sources: eMBS and Urban Institute.
September 2020
October 2020
8
OVERVIEW
ORIGINATION VOLUMEAND COMPOSITION
$0.0
$0.5
$1.0
$1.5
$2.0
$2.5
$3.0
$3.5
$4.0
2001 2002 2003 2004 2005 2006 2007 2008 2009 2010 2011 2012 2013 2014 2015 2016 2017 2018 2019 2020Q1
2020Q2
2020Q3
($ trillions)
First Lien Origination Volume
GSE securitization FHA/VA securitization PLS securitization Portfolio
Sources: Inside Mortgage Finance and Urban Institute. Last updated November 2020.
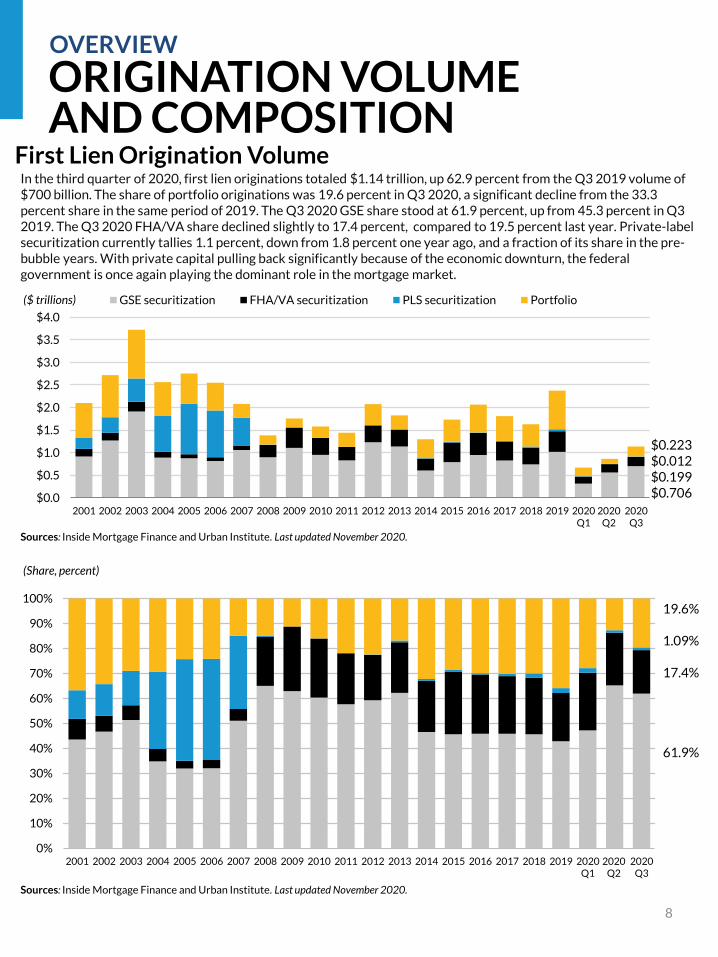
In the third quarter of 2020, first lien originations totaled $1.14 trillion, up 62.9 percent from the Q3 2019 volume of $700 billion. The share of portfolio originations was 19.6 percent in Q3 2020, a significant decline from the 33.3 percent share in the same period of 2019. The Q3 2020 GSE share stood at 61.9 percent, up from 45.3 percent in Q3 2019. The Q3 2020 FHA/VA share declined slightly to 17.4 percent, compared to 19.5 percent last year. Private-label securitization currently tallies 1.1 percent, down from 1.8 percent one year ago, and a fraction of its share in the pre-bubble years. With private capital pulling back significantly because of the economic downturn, the federal government is once again playing the dominant role in the mortgage market.
$0.223$0.012$0.199$0.706
0%
10%
20%
30%
40%
50%
60%
70%
80%
90%
100%
2001 2002 2003 2004 2005 2006 2007 2008 2009 2010 2011 2012 2013 2014 2015 2016 2017 2018 2019 2020Q1
2020Q2
2020Q3
Sources: Inside Mortgage Finance and Urban Institute. Last updated November 2020.
(Share, percent)
19.6%
1.09%
17.4%
61.9%
9
MORTGAGE ORIGINATION PRODUCT
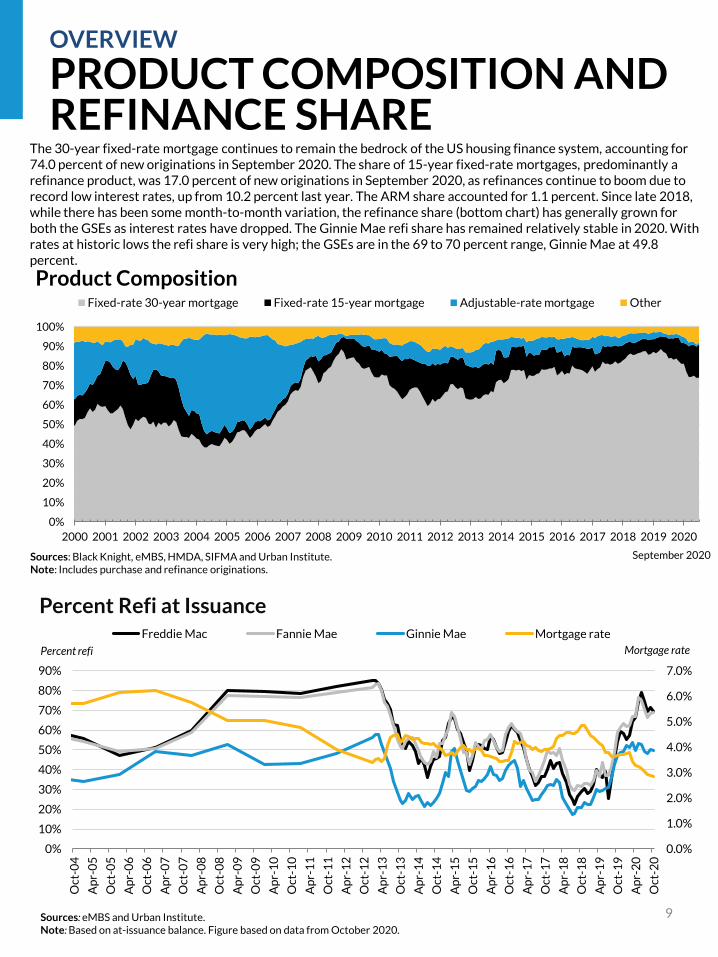
TYPEThe 30-year fixed-rate mortgage continues to remain the bedrock of the US housing finance system, accounting for 74.0 percent of new originations in September 2020. The share of 15-year fixed-rate mortgages, predominantly a refinance product, was 17.0 percent of new originations in September 2020, as refinances continue to boom due to record low interest rates, up from 10.2 percent last year. The ARM share accounted for 1.1 percent. Since late 2018, while there has been some month-to-month variation, the refinance share (bottom chart) has generally grown for both the GSEs as interest rates have dropped. The Ginnie Mae refi share has remained relatively stable in 2020. With rates at historic lows the refi share is very high; the GSEs are in the 69 to 70 percent range, Ginnie Mae at 49.8 percent.
OVERVIEW
PRODUCT COMPOSITION AND REFINANCE SHARE
0%
10%
20%
30%
40%
50%
60%
70%
80%
90%
100%
2000 2001 2002 2003 2004 2005 2006 2007 2008 2009 2010 2011 2012 2013 2014 2015 2016 2017 2018 2019 2020
Product CompositionFixed-rate 30-year mortgage Fixed-rate 15-year mortgage Adjustable-rate mortgage Other
Sources: Black Knight, eMBS, HMDA, SIFMA and Urban Institute. Note: Includes purchase and refinance originations.
September 2020
0.0%
1.0%
2.0%
3.0%
4.0%
5.0%
6.0%
7.0%
0%
10%
20%
30%
40%
50%
60%
70%
80%
90%
Oct
-04
Ap
r-0
5
Oct
-05
Ap
r-0
6
Oct
-06
Ap
r-0
7
Oct
-07
Ap
r-0
8
Oct
-08
Ap
r-0
9
Oct
-09
Ap
r-1
0
Oct
-10
Ap
r-1
1
Oct
-11
Ap
r-1
2
Oct
-12
Ap
r-1
3
Oct
-13
Ap
r-1
4
Oct
-14
Ap
r-1
5
Oct
-15
Ap
r-1
6
Oct
-16
Ap
r-1
7
Oct
-17
Ap
r-1
8
Oct
-18
Ap
r-1
9
Oct
-19
Ap
r-2
0
Oct
-20
Percent Refi at IssuanceFreddie Mac Fannie Mae Ginnie Mae Mortgage rate
Sources: eMBS and Urban Institute.Note: Based on at-issuance balance. Figure based on data from October 2020.
Mortgage ratePercent refi
CASH-OUT REFINANCESOVERVIEW
$0.0
$10.0
$20.0
$30.0
$40.0
$50.0
$60.0
$70.0
$80.0
$90.0
1996 1999 2002 2005 2008 2011 2014 2017 2020
$ billions
Equity Take-Out from Conventional Mortgage Refinance Activity
Sources: eMBS and Urban Institute.Note: Data as of September 2020.
2020 Q3
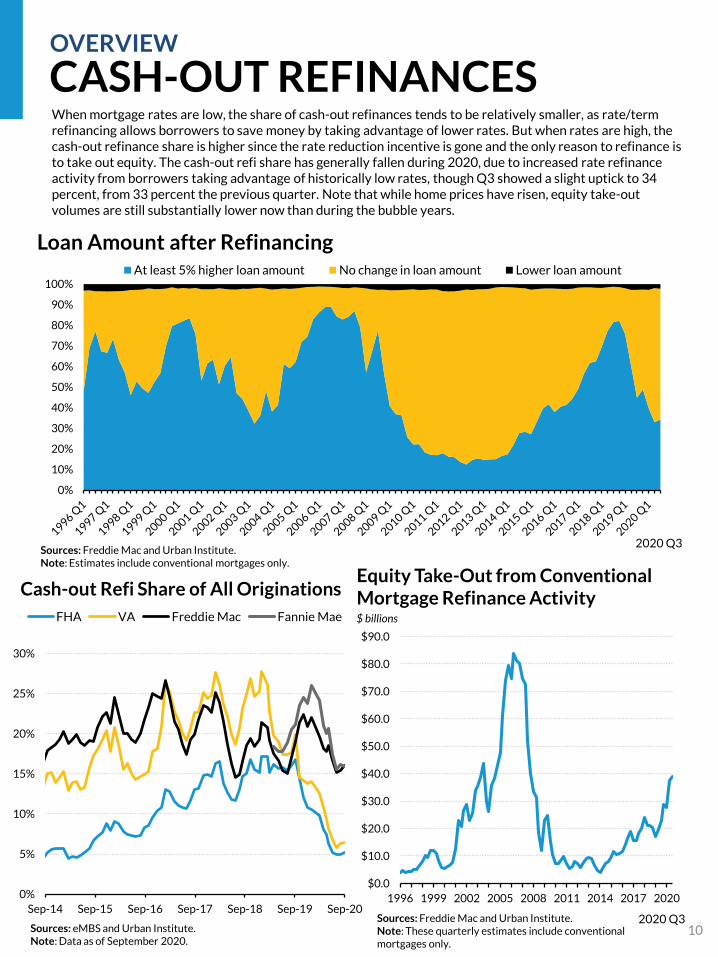
When mortgage rates are low, the share of cash-out refinances tends to be relatively smaller, as rate/term refinancing allows borrowers to save money by taking advantage of lower rates. But when rates are high, the cash-out refinance share is higher since the rate reduction incentive is gone and the only reason to refinance is to take out equity. The cash-out refi share has generally fallen during 2020, due to increased rate refinance activity from borrowers taking advantage of historically low rates, though Q3 showed a slight uptick to 34 percent, from 33 percent the previous quarter. Note that while home prices have risen, equity take-out volumes are still substantially lower now than during the bubble years.
0%
5%
10%
15%
20%
25%
30%
Sep-14 Sep-15 Sep-16 Sep-17 Sep-18 Sep-19 Sep-20
FHA VA Freddie Mac Fannie Mae
Sources: Freddie Mac and Urban Institute.Note: These quarterly estimates include conventional mortgages only.
Cash-out Refi Share of All Originations
0%
10%
20%
30%
40%
50%
60%
70%
80%
90%
100%At least 5% higher loan amount No change in loan amount Lower loan amount
10
Sources: Freddie Mac and Urban Institute.Note: Estimates include conventional mortgages only.
Loan Amount after Refinancing
2020 Q3
Sources: eMBS and Urban Institute. Sources: eMBS and Urban Institute.
92%
0%
10%
20%
30%
40%
50%
60%
70%
80%
90%
100%
Fe
b-1
4
Ap
r-1
4
Jun
-14
Au
g-1
4
Oct
-14
De
c-1
4
Fe
b-1
5
Ap
r-1
5
Jun
-15
Au
g-1
5
Oct
-15
De
c-1
5
Fe
b-1
6
Ap
r-1
6
Jun
-16
Au
g-1
6
Oct
-16
De
c-1
6
Fe
b-1
7
Ap
r-1
7
Jun
-17
Au
g-1
7
Oct
-17
De
c-1
7
Fe
b-1
8
Ap
r-1
8
Jun
-18
Au
g-1
8
Oct
-18
De
c-1
8
Fe
b-1
9
Ap
r-1
9
Jun
-19
Au
g-1
9
Oct
-19
De
c-1
9
Fe
b-2
0
Ap
r-2
0
Jun
-20
Au
g-2
0
Oct
-20
Nonbank Origination Share: All Loans
All Fannie Freddie Ginnie
75%70%
0%
10%
20%
30%
40%
50%
60%
70%
80%
90%
100%
Ap
r-1
4
Oct
-14
Ap
r-1
5
Oct
-15
Ap
r-1
6
Oct
-16
Ap
r-1
7
Oct
-17
Ap
r-1
8
Oct
-18
Ap
r-1
9
Oct
-19
Ap
r-2
0
Oct
-20
All Fannie Freddie Ginnie
0%
10%
20%
30%
40%
50%
60%
70%
80%
90%
100%
Ap
r-1
4
Oct
-14
Ap
r-1
5
Oct
-15
Ap
r-1
6
Oct
-16
Ap
r-1
7
Oct
-17
Ap
r-1
8
Oct
-18
Ap
r-1
9
Oct
-19
Ap
r-2
0
Oct
-20
All Fannie Freddie Ginnie
Nonbank Origination Share: Refi Loans
11
AGENCY NONBANK ORIGINATION SHARE
OVERVIEW
Nonbank Origination Share: Purchase Loans
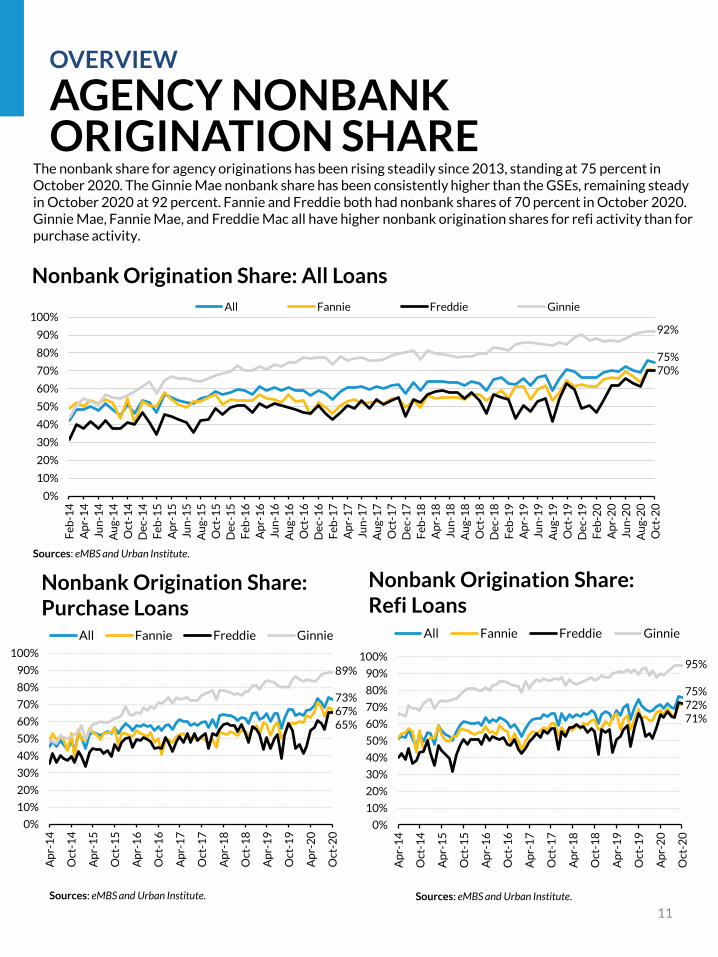
The nonbank share for agency originations has been rising steadily since 2013, standing at 75 percent in October 2020. The Ginnie Mae nonbank share has been consistently higher than the GSEs, remaining steady in October 2020 at 92 percent. Fannie and Freddie both had nonbank shares of 70 percent in October 2020. Ginnie Mae, Fannie Mae, and Freddie Mac all have higher nonbank origination shares for refi activity than for purchase activity.
Sources: eMBS and Urban Institute.
89%
73%67%65%
95%
75%72%71%
$-
$200
$400
$600
$800
$1,000
$1,200
$1,400
($ billions)Re-REMICs and other
Scratch and dentAlt A
Subprime
Prime
Sources: Inside Mortgage Finance and Urban Institute.
Non-Agency MBS Issuance
$4.80$12.90$7.59$4.63$8.99
12
SECURITIZATION VOLUME AND COMPOSITION
OVERVIEW
97.27%
2.73%0%
10%
20%
30%
40%
50%
60%
70%
80%
90%
100%
19
96
19
97
19
98
19
99
20
00
20
01
20
02
20
03
20
04
20
05
20
06
20
07
20
08
20
09
20
10
20
11
20
12
20
13
20
14
20
15
20
16
20
17
20
18
20
19
20
20
Agency share Non-agency share
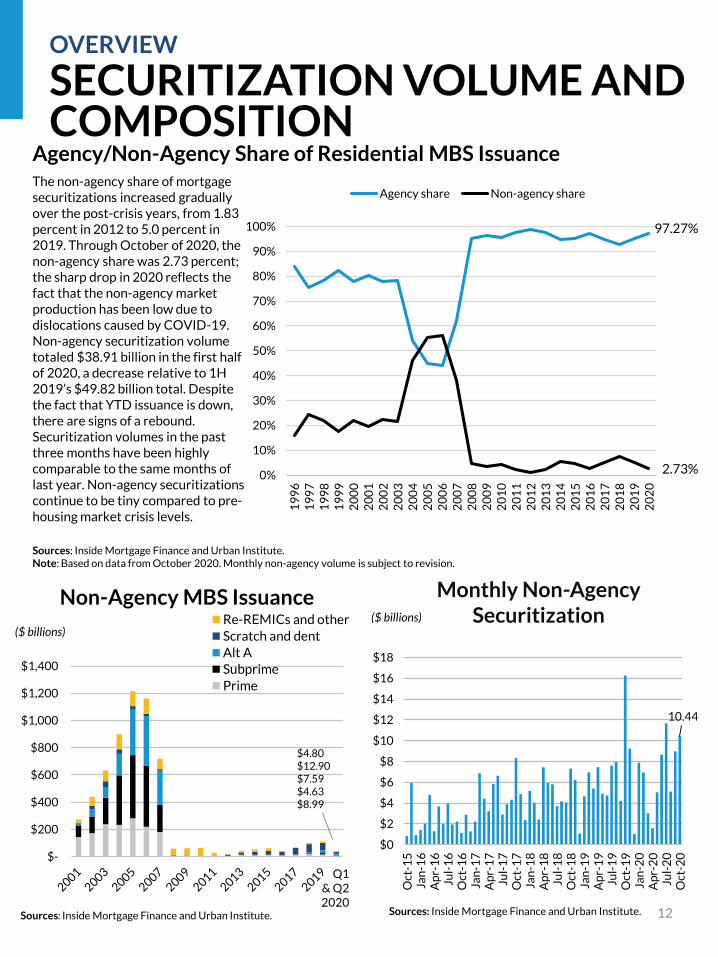
Agency/Non-Agency Share of Residential MBS IssuanceThe non-agency share of mortgage securitizations increased gradually over the post-crisis years, from 1.83 percent in 2012 to 5.0 percent in 2019. Through October of 2020, the non-agency share was 2.73 percent; the sharp drop in 2020 reflects the fact that the non-agency market production has been low due to dislocations caused by COVID-19. Non-agency securitization volume totaled $38.91 billion in the first half of 2020, a decrease relative to 1H 2019’s $49.82 billion total. Despite the fact that YTD issuance is down, there are signs of a rebound. Securitization volumes in the past three months have been highly comparable to the same months of last year. Non-agency securitizations continue to be tiny compared to pre-housing market crisis levels.
Sources: Inside Mortgage Finance and Urban Institute.Note: Based on data from October 2020. Monthly non-agency volume is subject to revision.
10.44
$0
$2
$4
$6
$8
$10
$12
$14
$16
$18
Oct
-15
Jan
-16
Ap
r-1
6Ju
l-1
6O
ct-1
6Ja
n-1
7A
pr-
17
Jul-
17
Oct
-17
Jan
-18
Ap
r-1
8Ju
l-1
8O
ct-1
8Ja
n-1
9A
pr-
19
Jul-
19
Oct
-19
Jan
-20
Ap
r-2
0Ju
l-2
0O
ct-2
0
($ billions)
Monthly Non-Agency Securitization
Sources: Inside Mortgage Finance and Urban Institute.
Q1 & Q22020

0
2
4
6
8
10
12
14
16
18
1999 2000 2001 2002 2003 2004 2005 2006 2007 2008 2009 2010 2011 2012 2013 2014 2015 2016 2017 2018 2019
PercentTotal default risk
Borrower risk
Product risk
Reasonable
lending
standards
GSE Channel
13
HOUSING CREDIT AVAILABILITY INDEX
CREDIT BOX
The Urban Institute’s Housing Credit Availability Index (HCAI) assesses lenders’ tolerance for both borrower riskand product risk, calculating the share of owner-occupied purchase loans that are likely to go 90+ days delinquent over the life of the loan. The HCAI stood at 5.2 percent in Q2 2020, down from an adjusted 5.3 percent in Q1 2020. Note that we updated the methodology as of Q2 2020, see new methodology here. Tightening in the GSE and government channels has driven a retraction of credit availability through the first half of 2020, as the risk in the portfolio and private-label securitization market remains a shadow of what it once was. More information about the HCAI is available here.
Q2 2020
All Channels
0
1
2
3
4
5
6
7
8
9
1998 1999 2000 2001 2002 2003 2004 2005 2006 2007 2008 2009 2010 2011 2012 2013 2014 2015 2016 2017 2018 2019 2020
Percent Total default risk
Product risk
Borrower risk
Sources: eMBS, CoreLogic, HMDA, IMF, and Urban Institute.Note: Default is defined as 90 days or more delinquent at any point. Last updated October 2020.
Q2 2020
The GSE market has expanded the credit box proportionately more than the government channel in recent years, although the GSE box is still much narrower. From Q2 2011 to Q1 2019, the total risk taken by the GSE channel more than doubled, from 1.4 percent to 3.0 percent. This is still very modest by pre-crisis standards. However, over the past year, credit availability has trended down and tightened further in the first half of 2020 in response to changing market conditions due to COVID-19, standing at 2.7 percent in Q2 2020.

14
HOUSING CREDIT AVAILABILITY INDEX
CREDIT BOX
Government Channel
Portfolio and Private Label Securities Channels
0
5
10
15
20
25
1998 1999 2000 2001 2002 2003 2004 2005 2006 2007 2008 2009 2010 2011 2012 2013 2014 2015 2016 2017 2018 2019 2020
Percent
Total default risk
Borrower risk
Product risk
Q2 2020
0
5
10
15
20
25
1998 1999 2000 2001 2002 2003 2004 2005 2006 2007 2008 2009 2010 2011 2012 2013 2014 2015 2016 2017 2018 2019 2020
PercentTotal default risk
Borrower risk
Product risk
Q2 2020Sources: eMBS, CoreLogic, HMDA, IMF, and Urban Institute.Note: Default is defined as 90 days or more delinquent at any point. Last updated October 2020.
The total default risk the government loan channel is willing to take bottomed out at 9.6 percent in Q3 2013. It fluctuated in a narrow range at or above that number for three years. In the nine quarters from Q4 2016 to Q1 2019, the risk in the government channel had risen significantly from 9.9 to 12.1 percent. In Q2 2020, risk in the government channel receded to 10.8 percent, moving closer to 2016 levels and still far below the pre-bubble level of 19 to 23 percent.
The portfolio and private-label securities (PP) channel took on more product risk than the Government and GSE channels during the bubble. After the crisis, the channel’s product and borrower risks dropped sharply. The numbers have stabilized since 2013, with product risk well below 0.5 percent and total risk largely in the range of 2.5 to 3.0 percent; it was 3.0 percent in Q2 2020. However, the PP market share plummeted during the COVID-19 crisis, as borrowers increasingly used government or GSE channels or could not obtain a mortgage at all.
15
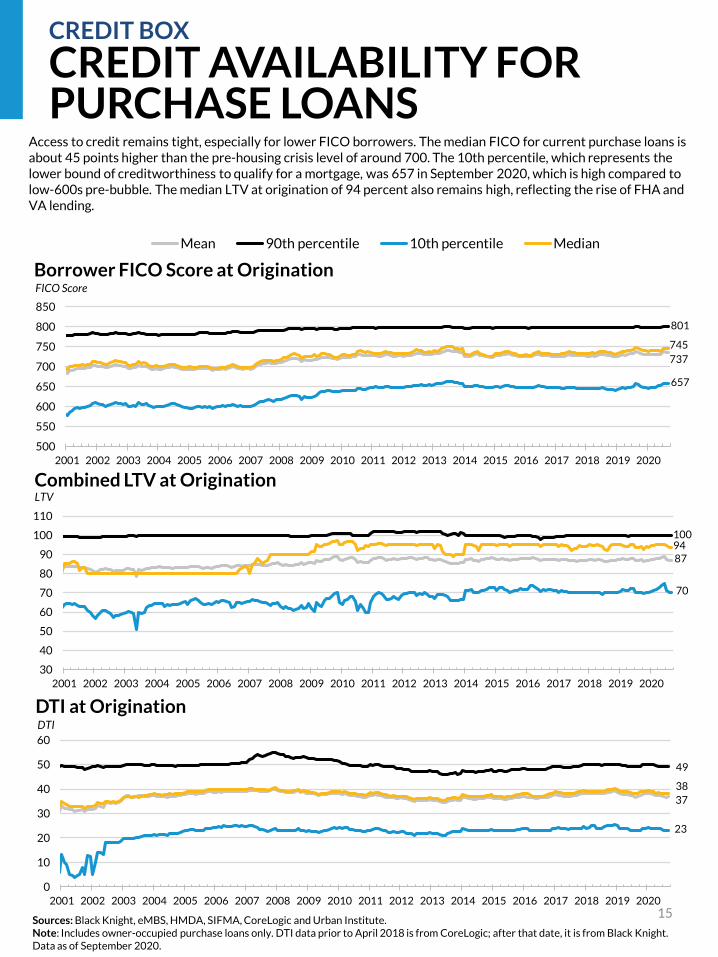
CREDIT AVAILABILITY FORAccess to credit remains tight, especially for lower FICO borrowers. The median FICO for current purchase loans is about 45 points higher than the pre-housing crisis level of around 700. The 10th percentile, which represents the lower bound of creditworthiness to qualify for a mortgage, was 657 in September 2020, which is high compared to low-600s pre-bubble. The median LTV at origination of 94 percent also remains high, reflecting the rise of FHA and VA lending.
CREDIT AVAILABILITY FOR PURCHASE LOANS
CREDIT BOX
100
8794
70
30
40
50
60
70
80
90
100
110
2001 2002 2003 2004 2005 2006 2007 2008 2009 2010 2011 2012 2013 2014 2015 2016 2017 2018 2019 2020
LTV
Combined LTV at Origination
Sources: Black Knight, eMBS, HMDA, SIFMA, CoreLogic and Urban Institute.Note: Includes owner-occupied purchase loans only. DTI data prior to April 2018 is from CoreLogic; after that date, it is from Black Knight.Data as of September 2020.
49
37
38
23
0
10
20
30
40
50
60
2001 2002 2003 2004 2005 2006 2007 2008 2009 2010 2011 2012 2013 2014 2015 2016 2017 2018 2019 2020
DTI at OriginationDTI
737
801
657
745
500
550
600
650
700
750
800
850
2001 2002 2003 2004 2005 2006 2007 2008 2009 2010 2011 2012 2013 2014 2015 2016 2017 2018 2019 2020
FICO Score
Borrower FICO Score at Origination
Mean 90th percentile 10th percentile Median
16
CREDIT AVAILABILITY FORCREDIT AVAILABILITY BY MSA FOR PURCHASE LOANS
CREDIT BOX
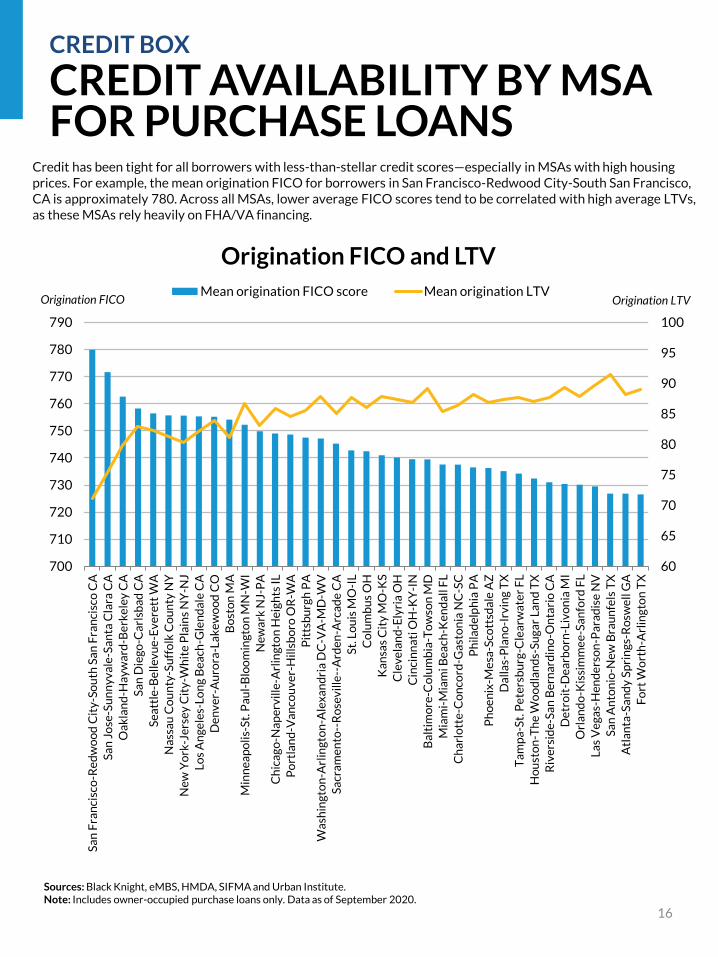
Credit has been tight for all borrowers with less-than-stellar credit scores—especially in MSAs with high housing prices. For example, the mean origination FICO for borrowers in San Francisco-Redwood City-South San Francisco, CA is approximately 780. Across all MSAs, lower average FICO scores tend to be correlated with high average LTVs, as these MSAs rely heavily on FHA/VA financing.
60
65
70
75
80
85
90
95
100
700
710
720
730
740
750
760
770
780
790
Sa
n F
ran
cisc
o-R
ed
wo
od
Cit
y-S
ou
th S
an
Fra
nci
sco
CA
Sa
n J
ose
-Su
nn
yv
ale
-Sa
nta
Cla
ra C
A
Oa
kla
nd
-Ha
yw
ard
-Be
rke
ley
CA
Sa
n D
ieg
o-C
arl
sba
d C
A
Se
att
le-B
ell
ev
ue
-Ev
ere
tt W
A
Na
ssa
u C
ou
nty
-Su
ffo
lk C
ou
nty
NY
Ne
w Y
ork
-Je
rse
y C
ity
-Wh
ite
Pla
ins
NY
-NJ
Lo
s A
ng
ele
s-L
on
g B
ea
ch-G
len
da
le C
A
De
nv
er-
Au
rora
-La
ke
wo
od
CO
Bo
sto
n M
A
Min
ne
ap
oli
s-S
t. P
au
l-B
loo
min
gto
n M
N-W
I
Ne
wa
rk N
J-P
A
Ch
ica
go
-Na
pe
rvil
le-A
rlin
gto
n H
eig
hts
IL
Po
rtla
nd
-Va
nco
uv
er-
Hil
lsb
oro
OR
-WA
Pit
tsb
urg
h P
A
Wa
shin
gto
n-A
rlin
gto
n-A
lex
an
dri
a D
C-V
A-M
D-W
V
Sa
cra
me
nto
--R
ose
vil
le--
Ard
en
-Arc
ad
e C
A
St.
Lo
uis
MO
-IL
Co
lum
bu
s O
H
Ka
nsa
s C
ity
MO
-KS
Cle
ve
lan
d-E
lyri
a O
H
Cin
cin
na
ti O
H-K
Y-I
N
Ba
ltim
ore
-Co
lum
bia
-To
wso
n M
D
Mia
mi-
Mia
mi B
ea
ch-K
en
da
ll F
L
Ch
arl
ott
e-C
on
cord
-Ga
sto
nia
NC
-SC
Ph
ila
de
lph
ia P
A
Ph
oe
nix
-Me
sa-S
cott
sda
le A
Z
Da
lla
s-P
lan
o-I
rvin
g T
X
Ta
mp
a-S
t. P
ete
rsb
urg
-Cle
arw
ate
r F
L
Ho
ust
on
-Th
e W
oo
dla
nd
s-S
ug
ar
La
nd
TX
Riv
ers
ide
-Sa
n B
ern
ard
ino
-On
tari
o C
A
De
tro
it-D
ea
rbo
rn-L
ivo
nia
MI
Orl
an
do
-Kis
sim
me
e-S
an
ford
FL
La
s V
eg
as-
He
nd
ers
on
-Pa
rad
ise
NV
Sa
n A
nto
nio
-Ne
w B
rau
nfe
ls T
X
Atl
an
ta-S
an
dy
Sp
rin
gs-
Ro
swe
ll G
A
Fo
rt W
ort
h-A
rlin
gto
n T
X
Origination LTVOrigination FICO
Origination FICO and LTV
Mean origination FICO score Mean origination LTV
Sources: Black Knight, eMBS, HMDA, SIFMA and Urban Institute.Note: Includes owner-occupied purchase loans only. Data as of September 2020.
Sources: eMBS and Urban Institute. Sources: eMBS and Urban Institute.
680
690
700
710
720
730
740
750
760
770
780
Jan
-14
Ap
r-1
4
Jul-
14
Oct
-14
Jan
-15
Ap
r-1
5
Jul-
15
Oct
-15
Jan
-16
Ap
r-1
6
Jul-
16
Oct
-16
Jan
-17
Ap
r-1
7
Jul-
17
Oct
-17
Jan
-18
Ap
r-1
8
Jul-
18
Oct
-18
Jan
-19
Ap
r-1
9
Jul-
19
Oct
-19
Jan
-20
Ap
r-2
0
Jul-
20
Oct
-20
Agency FICO: Bank vs. NonbankAll Median FICO Bank Median FICO Nonbank Median FICOFICO
Sources: eMBS and Urban Institute.
660
680
700
720
740
760
780
Oct
-14
Fe
b-1
5
Jun
-15
Oct
-15
Fe
b-1
6
Jun
-16
Oct
-16
Fe
b-1
7
Jun
-17
Oct
-17
Fe
b-1
8
Jun
-18
Oct
-18
Fe
b-1
9
Jun
-19
Oct
-19
Fe
b-2
0
Jun
-20
Oct
-20
All Median FICO
Bank Median FICO
Nonbank Median FICO
Ginnie Mae FICO: Bank vs. Nonbank
660
680
700
720
740
760
780
Oct
-14
Fe
b-1
5
Jun
-15
Oct
-15
Fe
b-1
6
Jun
-16
Oct
-16
Fe
b-1
7
Jun
-17
Oct
-17
Fe
b-1
8
Jun
-18
Oct
-18
Fe
b-1
9
Jun
-19
Oct
-19
Fe
b-2
0
Jun
-20
Oct
-20
All Median FICO
Bank Median FICO
Nonbank Median FICO
GSE FICO: Bank vs. Nonbank
17
CREDIT BOX
AGENCY NONBANK CREDIT BOX
FICO FICO
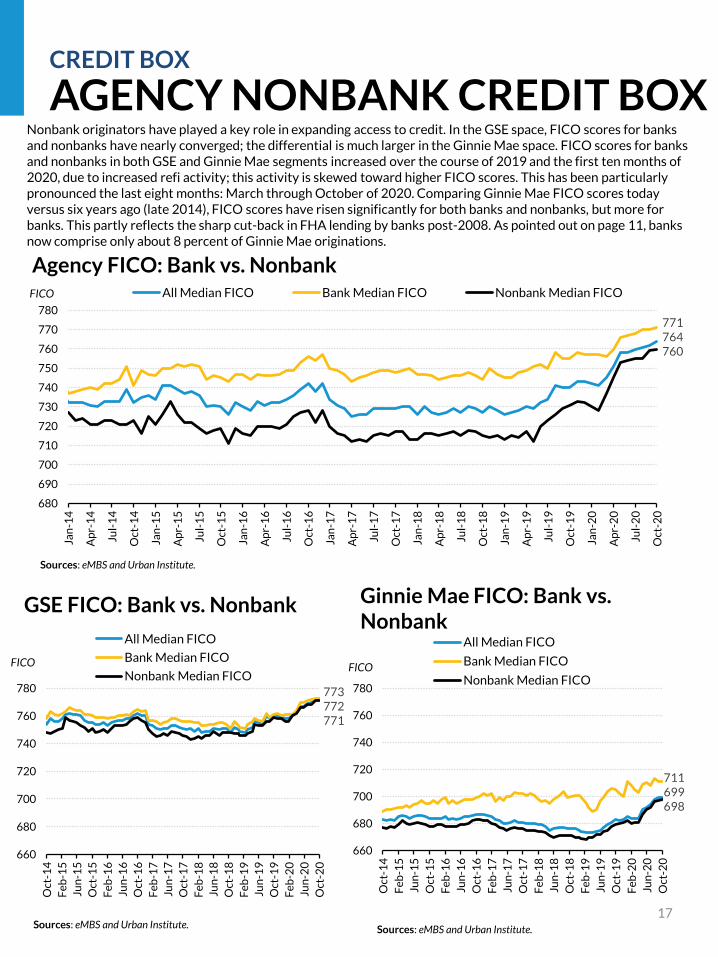
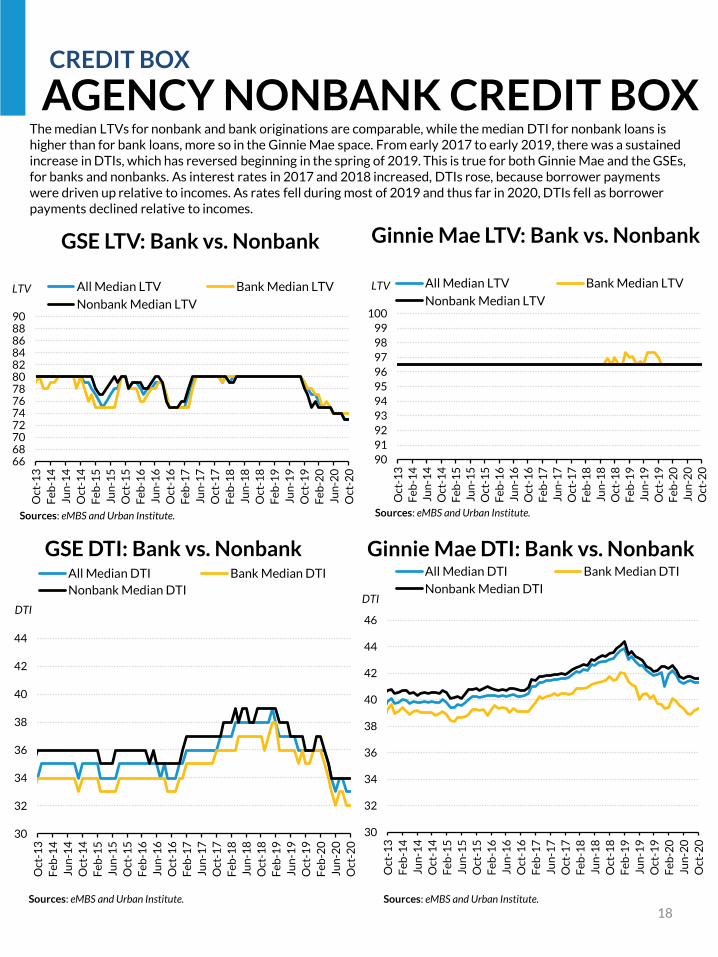
Nonbank originators have played a key role in expanding access to credit. In the GSE space, FICO scores for banks and nonbanks have nearly converged; the differential is much larger in the Ginnie Mae space. FICO scores for banks and nonbanks in both GSE and Ginnie Mae segments increased over the course of 2019 and the first ten months of 2020, due to increased refi activity; this activity is skewed toward higher FICO scores. This has been particularly pronounced the last eight months: March through October of 2020. Comparing Ginnie Mae FICO scores today versus six years ago (late 2014), FICO scores have risen significantly for both banks and nonbanks, but more for banks. This partly reflects the sharp cut-back in FHA lending by banks post-2008. As pointed out on page 11, banks now comprise only about 8 percent of Ginnie Mae originations.
773772771
711699698
771764760
Sources: eMBS and Urban Institute. Sources: eMBS and Urban Institute.
66687072747678808284868890
Oct
-13
Fe
b-1
4
Jun
-14
Oct
-14
Fe
b-1
5
Jun
-15
Oct
-15
Fe
b-1
6
Jun
-16
Oct
-16
Fe
b-1
7
Jun
-17
Oct
-17
Fe
b-1
8
Jun
-18
Oct
-18
Fe
b-1
9
Jun
-19
Oct
-19
Fe
b-2
0
Jun
-20
Oct
-20
GSE LTV: Bank vs. Nonbank
All Median LTV Bank Median LTV
Nonbank Median LTV
Sources: eMBS and Urban Institute.
90
91
92
93
94
95
96
97
98
99
100
Oct
-13
Fe
b-1
4
Jun
-14
Oct
-14
Fe
b-1
5
Jun
-15
Oct
-15
Fe
b-1
6
Jun
-16
Oct
-16
Fe
b-1
7
Jun
-17
Oct
-17
Fe
b-1
8
Jun
-18
Oct
-18
Fe
b-1
9
Jun
-19
Oct
-19
Fe
b-2
0
Jun
-20
Oct
-20
All Median LTV Bank Median LTV
Nonbank Median LTV
Sources: eMBS and Urban Institute.
30
32
34
36
38
40
42
44
46
Oct
-13
Fe
b-1
4
Jun
-14
Oct
-14
Fe
b-1
5
Jun
-15
Oct
-15
Fe
b-1
6
Jun
-16
Oct
-16
Fe
b-1
7
Jun
-17
Oct
-17
Fe
b-1
8
Jun
-18
Oct
-18
Fe
b-1
9
Jun
-19
Oct
-19
Fe
b-2
0
Jun
-20
Oct
-20
All Median DTI Bank Median DTI
Nonbank Median DTI
30
32
34
36
38
40
42
44
Oct
-13
Fe
b-1
4
Jun
-14
Oct
-14
Fe
b-1
5
Jun
-15
Oct
-15
Fe
b-1
6
Jun
-16
Oct
-16
Fe
b-1
7
Jun
-17
Oct
-17
Fe
b-1
8
Jun
-18
Oct
-18
Fe
b-1
9
Jun
-19
Oct
-19
Fe
b-2
0
Jun
-20
Oct
-20
GSE DTI: Bank vs. NonbankAll Median DTI Bank Median DTI
Nonbank Median DTI
18
CREDIT BOX
AGENCY NONBANK CREDIT BOX
Ginnie Mae LTV: Bank vs. Nonbank
Ginnie Mae DTI: Bank vs. Nonbank
LTV LTV
DTIDTI
The median LTVs for nonbank and bank originations are comparable, while the median DTI for nonbank loans is higher than for bank loans, more so in the Ginnie Mae space. From early 2017 to early 2019, there was a sustained increase in DTIs, which has reversed beginning in the spring of 2019. This is true for both Ginnie Mae and the GSEs, for banks and nonbanks. As interest rates in 2017 and 2018 increased, DTIs rose, because borrower payments were driven up relative to incomes. As rates fell during most of 2019 and thus far in 2020, DTIs fell as borrower payments declined relative to incomes.

19
STATE OF THE MARKET
MORTGAGE ORIGINATION PROJECTIONS
Fannie Mae, Freddie Mac and the MBA estimate 2020 origination volume to be between $3.39 and $4.12 trillion, higher than the $2.17 to $2.33 trillion in 2019. These numbers put 2020 in competition to be either the highest origination year in the 21st century, or just behind the 2003 number of $3.73 trillion; page 8 top provides the longer historical time series. The very robust 2020 origination volume is due to very strong refinance activity. All three groups expect the refinance share to be 12 to 17 percentage points higher than in 2019, based on continued low rates in the wake of COVID-19.
Total Originations and Refinance Shares Originations ($ billions) Refi Share (percent)
PeriodTotal, FNMA
estimateTotal, FHLMC
estimateTotal, MBA
estimateFNMA
estimateFHLMC
estimateMBA
estimate
2019 Q1 359 361 325 34 35 30
2019 Q2 581 584 501 35 36 29
2019 Q3 752 734 651 50 49 42
2019 Q4 770 753 696 57 57 55
2020 Q1 788 670 563 63 60 52
2020 Q2 1106 1008 928 68 67 61
2020 Q3 1283 1114 962 63 60 55
2020 Q4 940 791 937 56 53 55
2016 2052 2125 1891 49 47 49
2017 1826 1810 1760 36 37 35
2018 1766 1700 1677 30 32 28
2019 2462 2432 2253 46 46 44
2020 4117 3582 3390 63 61 56
2021 2721 2685 2561 41 46 36
Sources: Fannie Mae, Freddie Mac, Mortgage Bankers Association and Urban Institute.Note: Shaded boxes indicate forecasted figures. All figures are estimates for total single-family market. Regarding interest rates, the yearly averages for 2016, 2017, 2018 and 2019 were 3.8, 4.0, 4.6, and 3.9 percent. For 2020, the respective projections for Fannie, Freddie, and MBA are 3.1, 3.2, and 2.9 percent. Freddie Mac forecasts are now released quarterly, last updated October 2020.
5.4
0
1
2
3
4
5
6
7
Dollars per $100 loan
Originator Profitability and Unmeasured CostsIn September 2020, Originator Profitability and Unmeasured Costs (OPUC) stood at $5.42 per $100 loan, down slightly from lastmonth’s $5.9, the highest level on record. Increased profitability reflects lender capacity constraints amidst strong refi demand. Additionally, the Fed’s massive purchases of agency MBS since March pushed down secondary yields, thus widening the spread toprimary rates. We would expect OPUC to remain elevated for some time, declining as the backlog of refinance activity is processed, volumes ebb and originators begin to compete more aggressively on price. OPUC, formulated and calculated by the Federal Reserve Bank of New York, is a good relative measure of originator profitability. OPUC uses the sales price of a mortgage in the secondary market (less par) and adds two sources of profitability; retained servicing (both base and excess servicing, net of g-fees), and points paid by the borrower. OPUC is generally high when interest rates are low, as originators are capacity constrained due to refinance demand and have no incentive to reduce rates. Conversely, when interest rates are higher and refi activity low, competition forces originators to lower rates, driving profitability down.
Sources: Federal Reserve Bank of New York, updated monthly and available at this link: http://www.ny.frb.org/research/epr/2013/1113fust.html and Urban Institute. Last updated September 2020.Note: OPUC is a is a monthly (4-week moving) average as discussed in Fuster et al. (2013).

2.5
0
2
4
6
8
10
12
14
19
99
20
00
20
01
20
02
20
03
20
04
20
05
20
06
20
07
20
08
20
09
20
10
20
11
20
12
20
13
20
14
20
15
20
16
20
17
20
18
20
19
20
20
Months of supply
20
SERIOUS DELINQUENCY RAHOUSING SUPPLYSTATE OF THE MARKET
Housing Starts and Home Sales
Housing Starts, thousands Home Sales. thousands
YearTotal,FNMA
estimate
Total, MBA estimate
Total, NAHB
estimate
Total, FNMA
estimate
Total, FHLMC estimate
Total, MBA estimate
Total, NAHB
estimate*
2016 1174 1177 1177 6011 6010 6001 5385
2017 1203 1208 1208 6123 6120 6158 5522
2018 1250 1250 1250 5957 5960 5956 5357
2019 1290 1295 1295 6023 6000 6016 5439
2020 1355 1363 1356 6365 6200 6423 5769
2021 1467 1473 1321 6413 6100 7168 6078
Sources: Mortgage Bankers Association, Fannie Mae, Freddie Mac, National Association of Home Builders and Urban Institute.Note: Shaded boxes indicate forecasted figures; column labels indicate source of estimate. Freddie Mac home sales are now updated quarterly instead of monthly, with the last update in October 2020. *NAHB home sales estimate is for single-family structures only, it excludes condos and co-ops. Other figures include all single-family sales.
Months of Supply
October 2020Source: National Association of Realtors and Urban Institute. Data as of October 2020.
Months of supply in October 2020 was 2.5, 1.4 months lower than it was in October 2019 and a new record low for the second month in a row. Strong demand for housing in recent years, fueled by low mortgage rates, has kept the months supply limited. Fannie Mae, the MBA, and the NAHB forecast 2020 housing starts to be 1.35 to 1.36 million units; these 2020 forecasts from are above 2019 levels. Fannie Mae, Freddie Mac, and the MBA predict total home sales of 6.2 to 6.4 million units in 2020, above 2019 levels.

HOUSING AFFORDABILITYSTATE OF THE MARKET
Despite price increases over the last 8 years, home prices remain affordable by historic standards, as interest rates are now near generational lows. As of October 2020, with a 20 percent down payment, the share of median income needed for the monthly mortgage payment stood at 24.3 percent; with 3.5 down, it is 27.7 percent. These numbers are very close to the 2001-2003 median, and represent a sharp decrease in affordability in recent months. The last time we were at this affordability level was in February of 2019, and before that, in 2008. As shown in the bottom picture, mortgage affordability varies widely by MSA.
National Mortgage Affordability Over Time
0%
5%
10%
15%
20%
25%
30%
35%
40%
20
01
20
02
20
03
20
04
20
05
20
06
20
07
20
08
20
09
20
10
20
11
20
12
20
13
20
14
20
15
20
16
20
17
20
18
20
19
20
20
Mortgage affordability with 20% down
Mortgage affordability with 3.5% downMedian housing expenses to income
Average Mortgage Affordability with 3.5% down (2001-2003)
Average Mortgage Affordability with 20% down (2001-2003)
0%10%20%30%40%50%60%70%80%90%
100%
Sa
n F
ran
cisc
o-R
ed
wo
od
Cit
y-S
ou
th S
an
Fra
nci
sco
; CA
Sa
n J
ose
-Su
nn
yv
ale
-Sa
nta
Cla
ra; C
A
Sa
n D
ieg
o-C
arl
sba
d; C
A
Oa
kla
nd
-Hay
war
d-B
erk
ele
y; C
A
Lo
s A
ng
ele
s-L
on
g B
ea
ch-G
len
da
le; C
A
Mia
mi-
Mia
mi B
ea
ch-K
en
da
ll; F
L
Se
att
le-B
ell
ev
ue
-Ev
ere
tt; W
A
Riv
ers
ide
-San
Be
rna
rdin
o-O
nta
rio
; CA
Na
ssa
u C
ou
nty
-Su
ffo
lk C
ou
nty
; NY
De
nv
er-
Au
rora
-Lak
ew
oo
d; C
O
Po
rtla
nd
-Va
nco
uv
er-
Hil
lsb
oro
; OR
-WA
Sa
cra
me
nto
--R
ose
vil
le--
Ard
en
-Arc
ad
e; C
A
La
s V
eg
as-
He
nd
ers
on
-Pa
rad
ise
; NV
Bo
sto
n; M
A
Ne
w Y
ork
-Je
rse
y C
ity
-Wh
ite
Pla
ins;
NY
-NJ
Ne
wa
rk; N
J-P
A
Orl
an
do
-Kis
sim
me
e-S
an
ford
; FL
Ph
oe
nix
-Me
sa-S
cott
sda
le; A
Z
Wa
shin
gto
n-A
rlin
gto
n-A
lex
an
dri
a; D
C-V
A-M
D-W
V
Da
lla
s-P
lan
o-I
rvin
g; T
X
Ta
mp
a-S
t. P
ete
rsb
urg
-Cle
arw
ate
r; F
L
Ho
ust
on
-Th
e W
oo
dla
nd
s-S
ug
ar
La
nd
; TX
Sa
n A
nto
nio
-Ne
w B
rau
nfe
ls; T
X
Ch
ica
go
-Na
pe
rvil
le-A
rlin
gto
n H
eig
hts
; IL
Ch
arl
ott
e-C
on
cord
-Gas
ton
ia; N
C-S
C
Ba
ltim
ore
-Co
lum
bia
-To
wso
n; M
D
Fo
rt W
ort
h-A
rlin
gto
n; T
X
Atl
an
ta-S
an
dy
Sp
rin
gs-
Ro
swe
ll; G
A
Min
ne
apo
lis-
St.
Pa
ul-
Blo
om
ing
ton
; MN
-WI
Co
lum
bu
s; O
H
Ka
nsa
s C
ity
; MO
-KS
St.
Lo
uis
; MO
-IL
Cin
cin
na
ti; O
H-K
Y-I
N
Ph
ila
de
lph
ia; P
A
Cle
ve
lan
d-E
lyri
a; O
H
Pit
tsb
urg
h; P
A
De
tro
it-D
ea
rbo
rn-L
ivo
nia
; MI
Mortgage affordability with 20% downMortgage affordability with 3.5% down
Mortgage affordability index
Mortgage Affordability by MSA
Sources: National Association of Realtors, US Census Bureau, Current Population Survey, American Community Survey, Moody’sAnalytics, Freddie Mac Primary Mortgage Market Survey, and the Urban Institute.Note: Mortgage affordability is the share of median family income devoted to the monthly principal, interest, taxes, and insurance payment required to buy the median home at the Freddie Mac prevailing rate 2018 for a 30-year fixed-rate mortgage and property tax and insurance at 1.75 percent of the housing value. Data for the bottom chart as of Q2 2019.
21
October 2020
5.79
4.04
-15%
-10%
-5%
0%
5%
10%
15%
22
MSA
HPI changes (%)
% above peak2000 to peak
Peak totrough
Trough to current
United States 74.9 -25.2 59.9 19.6
New York-Jersey City-White Plains, NY-NJ 127.7 -22.5 50.4 16.6
Los Angeles-Long Beach-Glendale, CA 179.4 -38.1 95.7 21.1
Chicago-Naperville-Arlington Heights, IL 67.2 -38.4 48.5 -8.6
Atlanta-Sandy Springs-Roswell, GA 32.3 -35.0 85.9 20.8
Washington-Arlington-Alexandria, DC-VA-MD-WV 149.0 -28.3 43.0 2.4
Houston-The Woodlands-Sugar Land, TX 29.2 -6.6 52.2 42.1
Phoenix-Mesa-Scottsdale, AZ 113.1 -51.0 108.5 2.1
Riverside-San Bernardino-Ontario, CA 174.5 -51.6 97.0 -4.7
Dallas-Plano-Irving, TX 26.3 -7.3 71.9 59.4
Minneapolis-St. Paul-Bloomington, MN-WI 69.2 -30.6 67.1 16.0
Seattle-Bellevue-Everett, WA 90.3 -33.1 114.0 43.1
Denver-Aurora-Lakewood, CO 34.1 -12.2 97.7 73.5
Baltimore-Columbia-Towson, MD 123.2 -24.4 24.9 -5.5
San Diego-Carlsbad, CA 148.1 -37.4 85.6 16.1
Anaheim-Santa Ana-Irvine, CA 163.2 -35.2 70.9 10.7
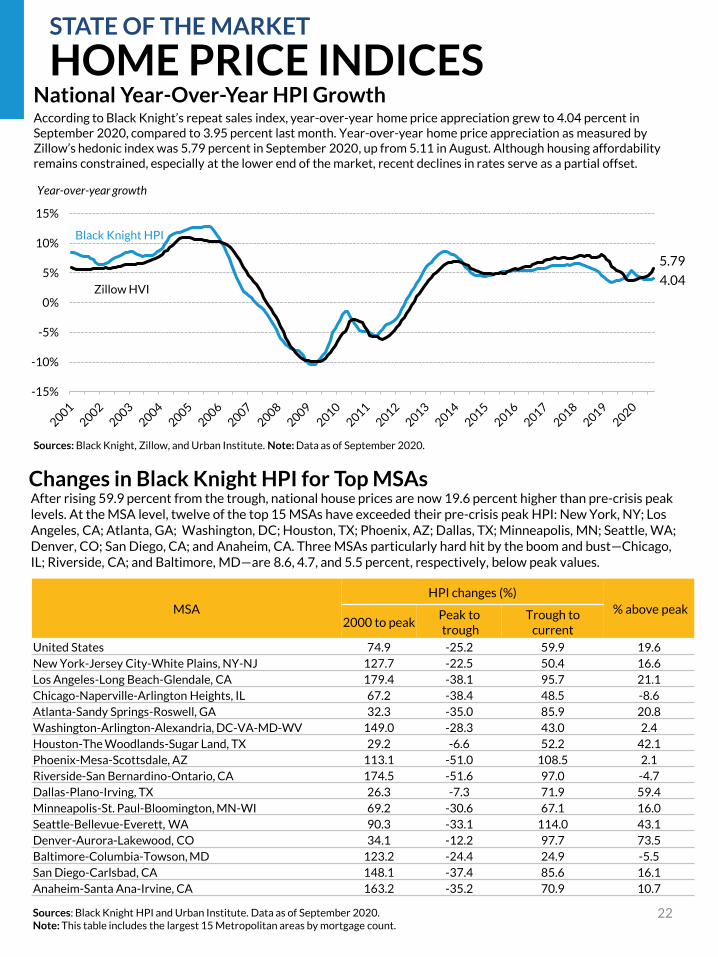
Sources: Black Knight HPI and Urban Institute. Data as of September 2020. Note: This table includes the largest 15 Metropolitan areas by mortgage count.
Changes in Black Knight HPI for Top MSAsAfter rising 59.9 percent from the trough, national house prices are now 19.6 percent higher than pre-crisis peak levels. At the MSA level, twelve of the top 15 MSAs have exceeded their pre-crisis peak HPI: New York, NY; Los Angeles, CA; Atlanta, GA; Washington, DC; Houston, TX; Phoenix, AZ; Dallas, TX; Minneapolis, MN; Seattle, WA; Denver, CO; San Diego, CA; and Anaheim, CA. Three MSAs particularly hard hit by the boom and bust—Chicago, IL; Riverside, CA; and Baltimore, MD—are 8.6, 4.7, and 5.5 percent, respectively, below peak values.
HOME PRICE INDICESSTATE OF THE MARKET
National Year-Over-Year HPI Growth According to Black Knight’s repeat sales index, year-over-year home price appreciation grew to 4.04 percent in September 2020, compared to 3.95 percent last month. Year-over-year home price appreciation as measured by Zillow’s hedonic index was 5.79 percent in September 2020, up from 5.11 in August. Although housing affordability remains constrained, especially at the lower end of the market, recent declines in rates serve as a partial offset.
Sources: Black Knight, Zillow, and Urban Institute. Note: Data as of September 2020.
Black Knight HPI
Zillow HVI
Year-over-year growth
23
FIRST-TIME HOMEBUYERSSTATE OF THE MARKET
20%
30%
40%
50%
60%
70%
80%
90%
2001 2002 2003 2004 2005 2006 2007 2008 2009 2010 2011 2012 2013 2014 2015 2016 2017 2018 2019 2020
First-Time Homebuyer Share
GSEs FHA VA
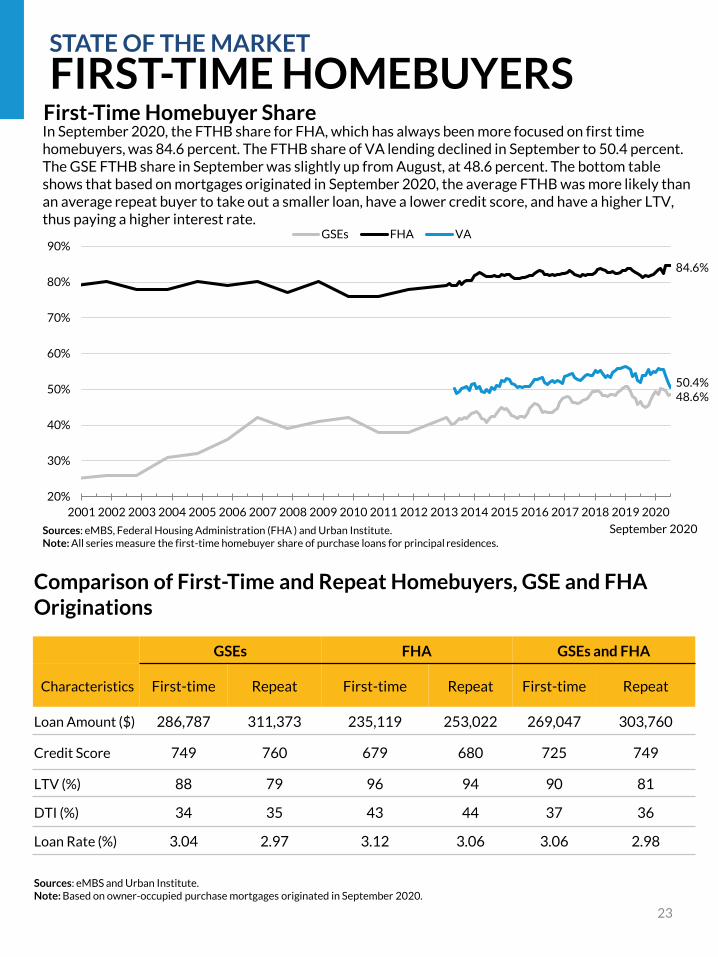
In September 2020, the FTHB share for FHA, which has always been more focused on first time homebuyers, was 84.6 percent. The FTHB share of VA lending declined in September to 50.4 percent. The GSE FTHB share in September was slightly up from August, at 48.6 percent. The bottom table shows that based on mortgages originated in September 2020, the average FTHB was more likely than an average repeat buyer to take out a smaller loan, have a lower credit score, and have a higher LTV, thus paying a higher interest rate.
Sources: eMBS, Federal Housing Administration (FHA ) and Urban Institute.Note: All series measure the first-time homebuyer share of purchase loans for principal residences.
84.6%
50.4%48.6%
Comparison of First-Time and Repeat Homebuyers, GSE and FHA Originations
GSEs FHA GSEs and FHA
Characteristics First-time Repeat First-time Repeat First-time Repeat
Loan Amount ($) 286,787 311,373 235,119 253,022 269,047 303,760
Credit Score 749 760 679 680 725 749
LTV (%) 88 79 96 94 90 81
DTI (%) 34 35 43 44 37 36
Loan Rate (%) 3.04 2.97 3.12 3.06 3.06 2.98
Sources: eMBS and Urban Institute.Note: Based on owner-occupied purchase mortgages originated in September 2020.
September 2020
0
200
400
600
800
1,000
1,200
1,400
1,600
2007Q3-Q4
2008 2009 2010 2011 2012 2013 2014 2015 2016 2017 2018 2019Q1-Q3
Number of loans (thousands)Loan Modifications and Liquidations
Hamp Permanent Mods
Proprietary mods completed
Total liquidations
Sources: Hope Now and Urban Institute.Note: Liquidations include both foreclosure sales and short sales. Last updated March 2020.
STATE OF THE MARKET
DELINQUENCIES AND LOSS MITIGATION ACTIVITY
0%
2%
4%
6%
8%
10%
12%1
Q0
1
1Q
02
1Q
03
1Q
04
1Q
05
1Q
06
1Q
07
1Q
08
1Q
09
1Q
10
1Q
11
1Q
12
1Q
13
1Q
14
1Q
15
1Q
16
1Q
17
1Q
18
1Q
19
1Q
20
Percent of loans 90 days or more delinquent
Percent of loans in foreclosure
Percent of loans 90 days or more delinquent or in foreclosure
Sources: Mortgage Bankers Association and Urban Institute. Last updated September 2020.
0%
5%
10%
15%
20%
25%
30%
35%
1Q
11
4Q
11
3Q
12
2Q
13
1Q
14
4Q
14
3Q
15
2Q
16
1Q
17
4Q
17
3Q
18
2Q
19
1Q
20
Negative Equity ShareNegative equity Near or in negative equity
Sources: CoreLogic and Urban Institute.Note: Loans with negative equity refer to loans above 100 percent LTV. Loans near negative equity refer to loans above 95 percent LTV. Last updated September 2020.
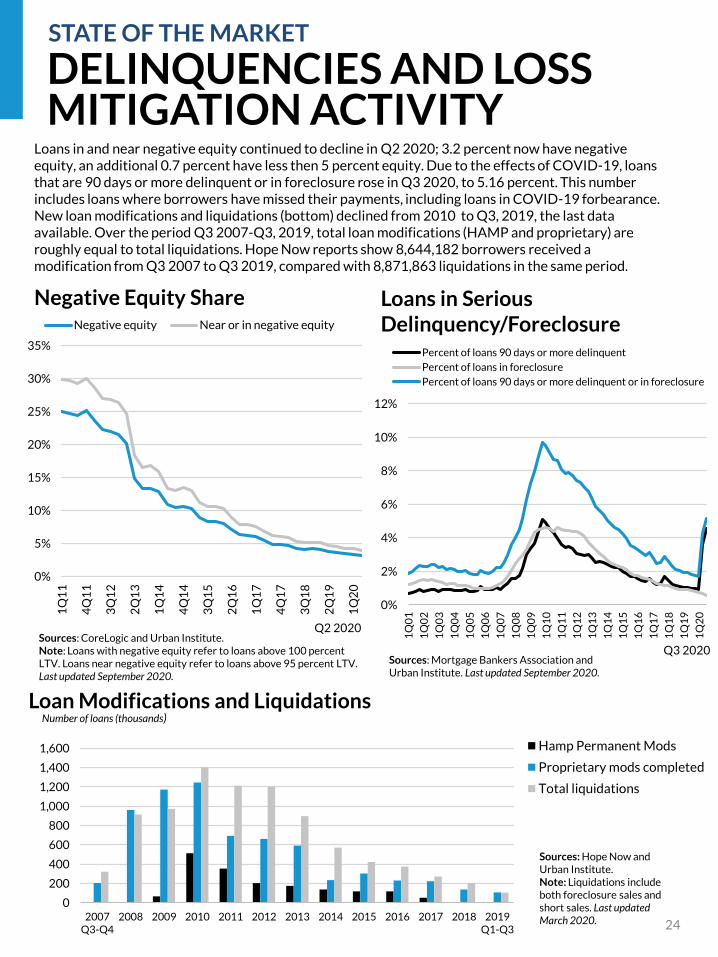
Loans in and near negative equity continued to decline in Q2 2020; 3.2 percent now have negative equity, an additional 0.7 percent have less then 5 percent equity. Due to the effects of COVID-19, loans that are 90 days or more delinquent or in foreclosure rose in Q3 2020, to 5.16 percent. This number includes loans where borrowers have missed their payments, including loans in COVID-19 forbearance. New loan modifications and liquidations (bottom) declined from 2010 to Q3, 2019, the last data available. Over the period Q3 2007-Q3, 2019, total loan modifications (HAMP and proprietary) are roughly equal to total liquidations. Hope Now reports show 8,644,182 borrowers received a modification from Q3 2007 to Q3 2019, compared with 8,871,863 liquidations in the same period.
Loans in Serious Delinquency/Foreclosure
24
Q3 2020
Q2 2020

25
Even though the Fannie Mae and Freddie Mac portfolios are well below the $250 billion size they were required to reach by year-end 2018, the portfolios have continued to shrink. From September 2019 to September 2020, the Fannie portfolio contracted by 2.8 percent, and the Freddie portfolio contracted by 10.6 percent. Within the portfolio, Fannie Mae held their less liquid assets (mortgage loans, non-agency MBS), relatively constant from the year prior, while Freddie Mac increased theirs. This reflects both a smaller overall portfolio and the increased need to hold loans in portfolio for loss mitigation purposes.
GSE PORTFOLIO WIND-DOWNGSES UNDER CONSERVATORSHIP
0
100
200
300
400
500
600
700
800
900
2005 2006 2007 2008 2009 2010 2011 2012 2013 2014 2015 2016 2017 2018 2019 2020
($ billions)
FHLMC MBS in portfolio Non-FHLMC agency MBS Non-agency MBS Mortgage loans
Sources: Freddie Mac and Urban Institute.
Freddie Mac Mortgage-Related Investment Portfolio Composition
Current size: $198.2 billion2018 cap: $250 billionShrinkage year-over-year: 10.6 percentGrowth in less-liquid assets year-over-year: 9.5 percent
0
100
200
300
400
500
600
700
800
900
2006 2007 2008 2009 2010 2011 2012 2013 2014 2015 2016 2017 2018 2019 2020
($ billions)
FNMA MBS in portfolio Non-FNMA agency MBS Non-agency MBS Mortgage loans
Fannie Mae Mortgage-Related Investment Portfolio Composition
Current size: $172.1 billion2018 cap: $250 billionShrinkage year-over-year: 2.8 percentShrinkage in less-liquid assets year-over-year: 1.2 percent
September 2020
September 2020
Sources: Fannie Mae and Urban Institute.
26
GSES UNDER CONSERVATORSHIP
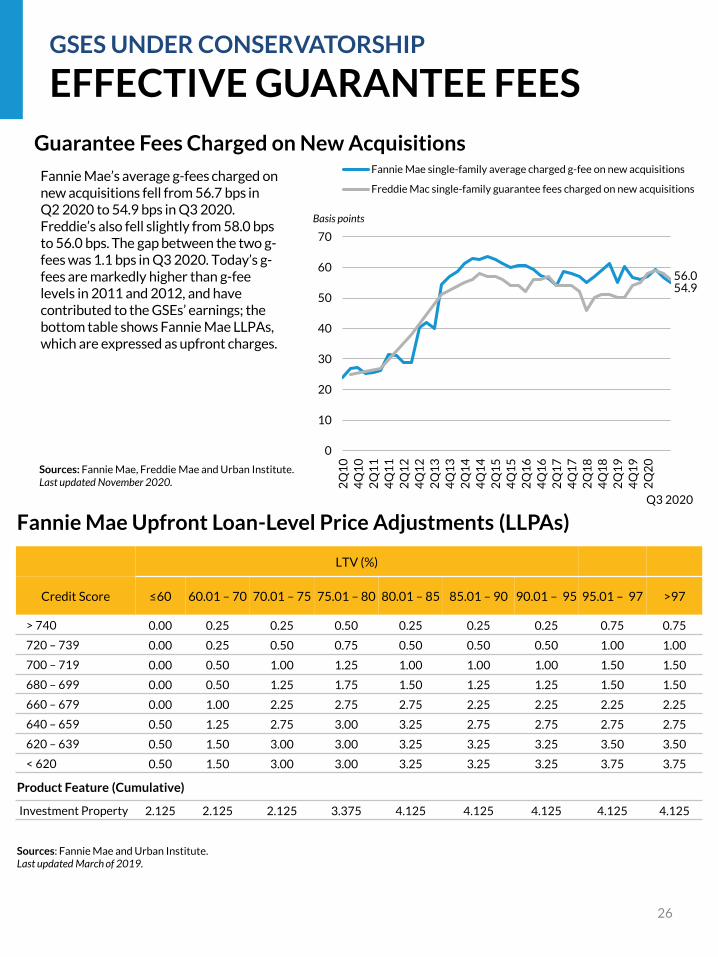
EFFECTIVE GUARANTEE FEES
Fannie Mae Upfront Loan-Level Price Adjustments (LLPAs)
LTV (%)
Credit Score ≤60 60.01 – 70 70.01 – 75 75.01 – 80 80.01 – 85 85.01 – 90 90.01 – 95 95.01 – 97 >97
> 740 0.00 0.25 0.25 0.50 0.25 0.25 0.25 0.75 0.75
720 – 739 0.00 0.25 0.50 0.75 0.50 0.50 0.50 1.00 1.00
700 – 719 0.00 0.50 1.00 1.25 1.00 1.00 1.00 1.50 1.50
680 – 699 0.00 0.50 1.25 1.75 1.50 1.25 1.25 1.50 1.50
660 – 679 0.00 1.00 2.25 2.75 2.75 2.25 2.25 2.25 2.25
640 – 659 0.50 1.25 2.75 3.00 3.25 2.75 2.75 2.75 2.75
620 – 639 0.50 1.50 3.00 3.00 3.25 3.25 3.25 3.50 3.50
< 620 0.50 1.50 3.00 3.00 3.25 3.25 3.25 3.75 3.75
Product Feature (Cumulative)
Investment Property 2.125 2.125 2.125 3.375 4.125 4.125 4.125 4.125 4.125
Sources: Fannie Mae and Urban Institute.Last updated March of 2019.
56.054.9
0
10
20
30
40
50
60
70
2Q
10
4Q
10
2Q
11
4Q
11
2Q
12
4Q
12
2Q
13
4Q
13
2Q
14
4Q
14
2Q
15
4Q
15
2Q
16
4Q
16
2Q
17
4Q
17
2Q
18
4Q
18
2Q
19
4Q
19
2Q
20
Guarantee Fees Charged on New AcquisitionsFannie Mae single-family average charged g-fee on new acquisitions
Freddie Mac single-family guarantee fees charged on new acquisitions
Basis points
Sources: Fannie Mae, Freddie Mae and Urban Institute. Last updated November 2020.
Fannie Mae’s average g-fees charged on new acquisitions fell from 56.7 bps in Q2 2020 to 54.9 bps in Q3 2020. Freddie’s also fell slightly from 58.0 bps to 56.0 bps. The gap between the two g-fees was 1.1 bps in Q3 2020. Today’s g-fees are markedly higher than g-fee levels in 2011 and 2012, and have contributed to the GSEs’ earnings; the bottom table shows Fannie Mae LLPAs, which are expressed as upfront charges.
Q3 2020
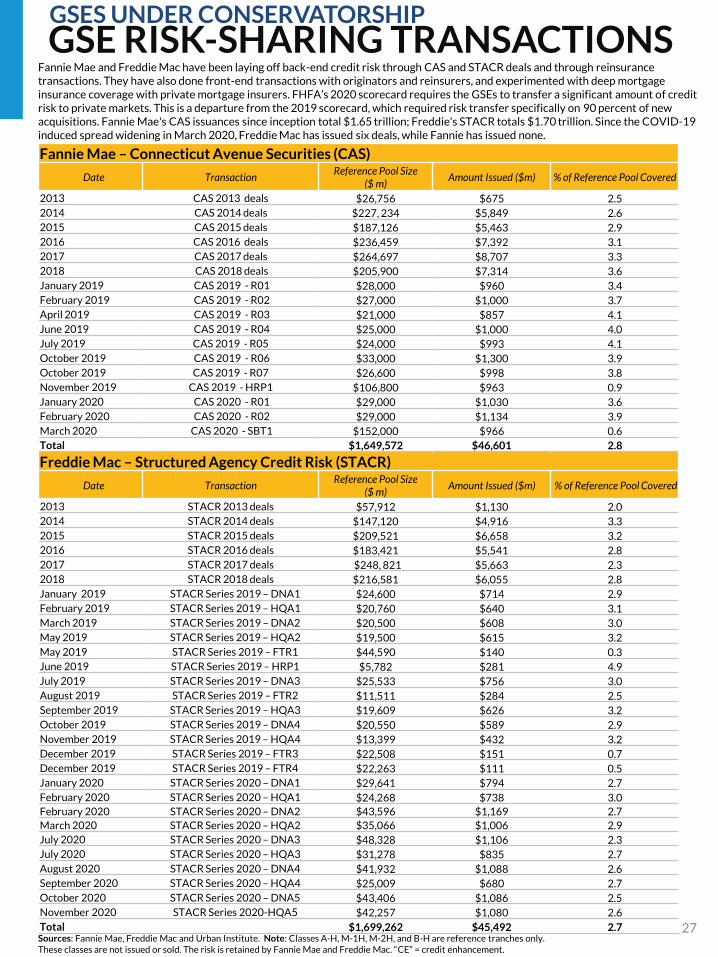
GSE RISK-SHARING TRANSACTIONS
Sources: Fannie Mae, Freddie Mac and Urban Institute. Note: Classes A-H, M-1H, M-2H, and B-H are reference tranches only. These classes are not issued or sold. The risk is retained by Fannie Mae and Freddie Mac. “CE” = credit enhancement.
27
GSES UNDER CONSERVATORSHIP
Fannie Mae – Connecticut Avenue Securities (CAS)
Date TransactionReference Pool Size
($ m)Amount Issued ($m) % of Reference Pool Covered
2013 CAS 2013 deals $26,756 $675 2.5
2014 CAS 2014 deals $227, 234 $5,849 2.6
2015 CAS 2015 deals $187,126 $5,463 2.9
2016 CAS 2016 deals $236,459 $7,392 3.1
2017 CAS 2017 deals $264,697 $8,707 3.3
2018 CAS 2018 deals $205,900 $7,314 3.6
January 2019 CAS 2019 - R01 $28,000 $960 3.4
February 2019 CAS 2019 - R02 $27,000 $1,000 3.7
April 2019 CAS 2019 - R03 $21,000 $857 4.1
June 2019 CAS 2019 - R04 $25,000 $1,000 4.0
July 2019 CAS 2019 - R05 $24,000 $993 4.1
October 2019 CAS 2019 - R06 $33,000 $1,300 3.9
October 2019 CAS 2019 - R07 $26,600 $998 3.8
November 2019 CAS 2019 - HRP1 $106,800 $963 0.9
January 2020 CAS 2020 - R01 $29,000 $1,030 3.6
February 2020 CAS 2020 - R02 $29,000 $1,134 3.9
March 2020 CAS 2020 - SBT1 $152,000 $966 0.6
Total $1,649,572 $46,601 2.8
Freddie Mac – Structured Agency Credit Risk (STACR)
Date TransactionReference Pool Size
($ m)Amount Issued ($m) % of Reference Pool Covered
2013 STACR 2013 deals $57,912 $1,130 2.0
2014 STACR 2014 deals $147,120 $4,916 3.3
2015 STACR 2015 deals $209,521 $6,658 3.2
2016 STACR 2016 deals $183,421 $5,541 2.8
2017 STACR 2017 deals $248, 821 $5,663 2.3
2018 STACR 2018 deals $216,581 $6,055 2.8
January 2019 STACR Series 2019 – DNA1 $24,600 $714 2.9
February 2019 STACR Series 2019 – HQA1 $20,760 $640 3.1
March 2019 STACR Series 2019 – DNA2 $20,500 $608 3.0
May 2019 STACR Series 2019 – HQA2 $19,500 $615 3.2
May 2019 STACR Series 2019 – FTR1 $44,590 $140 0.3
June 2019 STACR Series 2019 – HRP1 $5,782 $281 4.9
July 2019 STACR Series 2019 – DNA3 $25,533 $756 3.0
August 2019 STACR Series 2019 – FTR2 $11,511 $284 2.5
September 2019 STACR Series 2019 – HQA3 $19,609 $626 3.2
October 2019 STACR Series 2019 – DNA4 $20,550 $589 2.9
November 2019 STACR Series 2019 – HQA4 $13,399 $432 3.2
December 2019 STACR Series 2019 – FTR3 $22,508 $151 0.7
December 2019 STACR Series 2019 – FTR4 $22,263 $111 0.5
January 2020 STACR Series 2020 – DNA1 $29,641 $794 2.7
February 2020 STACR Series 2020 – HQA1 $24,268 $738 3.0
February 2020 STACR Series 2020 – DNA2 $43,596 $1,169 2.7
March 2020 STACR Series 2020 – HQA2 $35,066 $1,006 2.9
July 2020 STACR Series 2020 – DNA3 $48,328 $1,106 2.3
July 2020 STACR Series 2020 – HQA3 $31,278 $835 2.7
August 2020 STACR Series 2020 – DNA4 $41,932 $1,088 2.6
September 2020 STACR Series 2020 – HQA4 $25,009 $680 2.7
October 2020 STACR Series 2020 – DNA5 $43,406 $1,086 2.5
November 2020 STACR Series 2020-HQA5 $42,257 $1,080 2.6
Total $1,699,262 $45,492 2.7
Fannie Mae and Freddie Mac have been laying off back-end credit risk through CAS and STACR deals and through reinsurance transactions. They have also done front-end transactions with originators and reinsurers, and experimented with deep mortgage insurance coverage with private mortgage insurers. FHFA’s 2020 scorecard requires the GSEs to transfer a significant amount of credit risk to private markets. This is a departure from the 2019 scorecard, which required risk transfer specifically on 90 percent of new acquisitions. Fannie Mae's CAS issuances since inception total $1.65 trillion; Freddie's STACR totals $1.70 trillion. Since the COVID-19 induced spread widening in March 2020, Freddie Mac has issued six deals, while Fannie has issued none.
0
200
400
600
800
1000
1200
1400
1600
1800
2000
Ma
r-1
7M
ay
-17
Jul-
17
Se
p-1
7N
ov
-17
Jan
-18
Ma
r-1
8M
ay
-18
Jul-
18
Se
p-1
8N
ov
-18
Jan
-19
Ma
r-1
9M
ay
-19
Jul-
19
Se
p-1
9N
ov
-19
Jan
-20
Ma
r-2
0M
ay
-20
Jul-
20
Se
p-2
0N
ov
-20
2014/15 Low Index 2016 Low Index
2017 Low Index 2018 Low Index
2019 Low Index
28Sources: Vista Data Services and Urban Institute. Note: Data as of November 13, 2020.
GSE RISK-SHARING INDICESGSES UNDER CONSERVATORSHIP
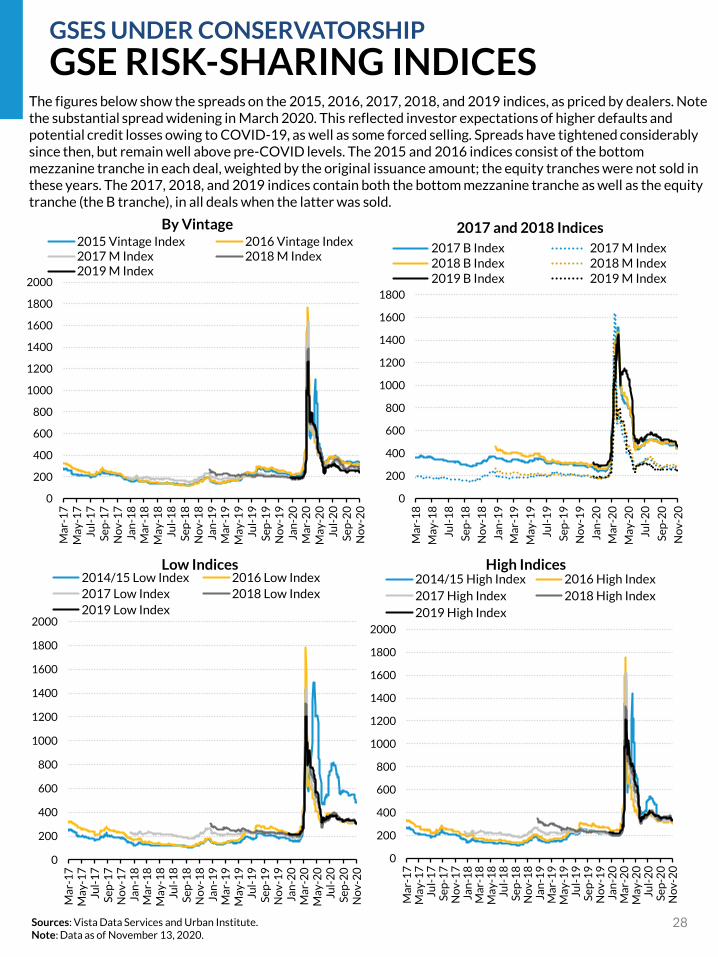
The figures below show the spreads on the 2015, 2016, 2017, 2018, and 2019 indices, as priced by dealers. Note the substantial spread widening in March 2020. This reflected investor expectations of higher defaults and potential credit losses owing to COVID-19, as well as some forced selling. Spreads have tightened considerably since then, but remain well above pre-COVID levels. The 2015 and 2016 indices consist of the bottom mezzanine tranche in each deal, weighted by the original issuance amount; the equity tranches were not sold in these years. The 2017, 2018, and 2019 indices contain both the bottom mezzanine tranche as well as the equity tranche (the B tranche), in all deals when the latter was sold.
0
200
400
600
800
1000
1200
1400
1600
1800
Ma
r-1
8
Ma
y-1
8
Jul-
18
Se
p-1
8
No
v-1
8
Jan
-19
Ma
r-1
9
Ma
y-1
9
Jul-
19
Se
p-1
9
No
v-1
9
Jan
-20
Ma
r-2
0
Ma
y-2
0
Jul-
20
Se
p-2
0
No
v-2
0
2017 B Index 2017 M Index2018 B Index 2018 M Index2019 B Index 2019 M Index
0
200
400
600
800
1000
1200
1400
1600
1800
2000
Ma
r-1
7M
ay
-17
Jul-
17
Se
p-1
7N
ov
-17
Jan
-18
Ma
r-1
8M
ay
-18
Jul-
18
Se
p-1
8N
ov
-18
Jan
-19
Ma
r-1
9M
ay
-19
Jul-
19
Se
p-1
9N
ov
-19
Jan
-20
Ma
r-2
0M
ay
-20
Jul-
20
Se
p-2
0N
ov
-20
2015 Vintage Index 2016 Vintage Index2017 M Index 2018 M Index2019 M Index
0
200
400
600
800
1000
1200
1400
1600
1800
2000
Ma
r-1
7M
ay
-17
Jul-
17
Se
p-1
7N
ov
-17
Jan
-18
Ma
r-1
8M
ay
-18
Jul-
18
Se
p-1
8N
ov
-18
Jan
-19
Ma
r-1
9M
ay
-19
Jul-
19
Se
p-1
9N
ov
-19
Jan
-20
Ma
r-2
0M
ay
-20
Jul-
20
Se
p-2
0N
ov
-20
2014/15 High Index 2016 High Index
2017 High Index 2018 High Index
2019 High Index
Low Indices High Indices
By Vintage 2017 and 2018 Indices
28
29
SERIOUS DELINQUENCY RATESGSES UNDER CONSERVATORSHIP
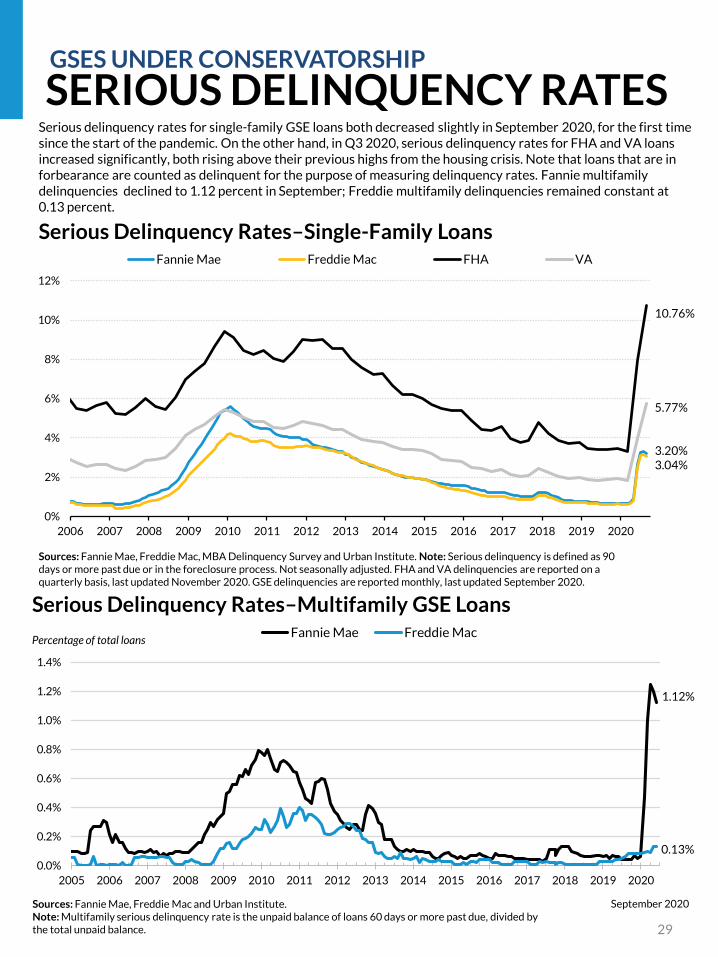
Serious delinquency rates for single-family GSE loans both decreased slightly in September 2020, for the first time since the start of the pandemic. On the other hand, in Q3 2020, serious delinquency rates for FHA and VA loans increased significantly, both rising above their previous highs from the housing crisis. Note that loans that are in forbearance are counted as delinquent for the purpose of measuring delinquency rates. Fannie multifamily delinquencies declined to 1.12 percent in September; Freddie multifamily delinquencies remained constant at 0.13 percent.
0.13%
1.12%
0.0%
0.2%
0.4%
0.6%
0.8%
1.0%
1.2%
1.4%
2005 2006 2007 2008 2009 2010 2011 2012 2013 2014 2015 2016 2017 2018 2019 2020
Percentage of total loans
Serious Delinquency Rates–Multifamily GSE LoansFannie Mae Freddie Mac
Sources: Fannie Mae, Freddie Mac and Urban Institute.Note: Multifamily serious delinquency rate is the unpaid balance of loans 60 days or more past due, divided by the total unpaid balance.
September 2020
0%
2%
4%
6%
8%
10%
12%
2006 2007 2008 2009 2010 2011 2012 2013 2014 2015 2016 2017 2018 2019 2020
Fannie Mae Freddie Mac FHA VA
Sources: Fannie Mae, Freddie Mac, MBA Delinquency Survey and Urban Institute. Note: Serious delinquency is defined as 90 days or more past due or in the foreclosure process. Not seasonally adjusted. FHA and VA delinquencies are reported on a quarterly basis, last updated November 2020. GSE delinquencies are reported monthly, last updated September 2020.
Serious Delinquency Rates–Single-Family Loans
10.76%
5.77%
3.20%3.04%
30
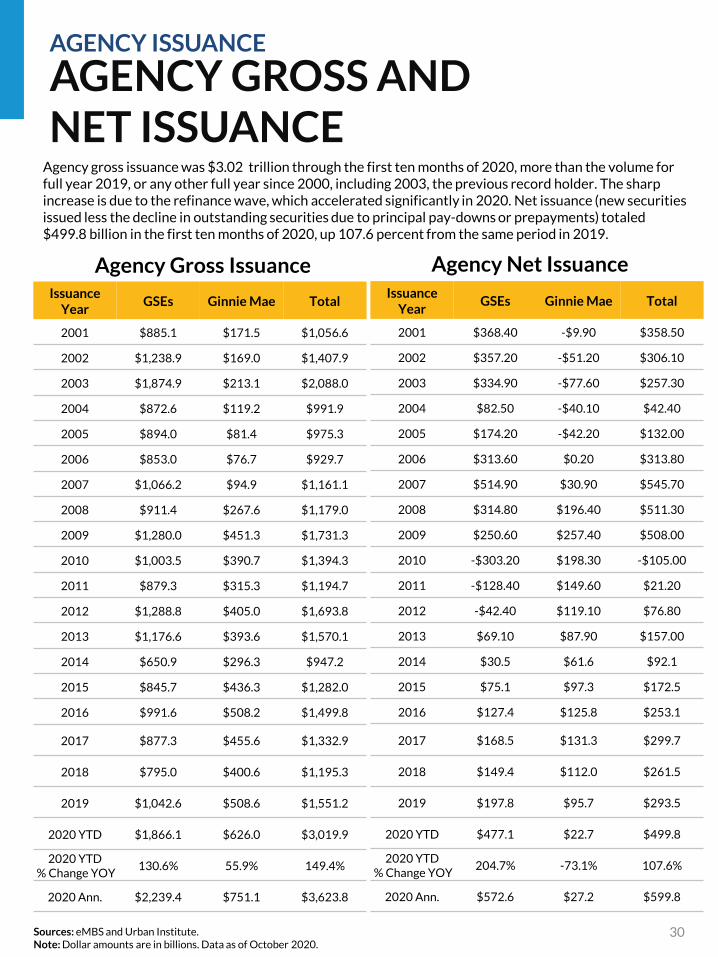
Agency Gross Issuance Agency Net Issuance
AGENCY GROSS AND NET ISSUANCE
AGENCY ISSUANCE
Issuance Year
GSEs Ginnie Mae Total
2001 $885.1 $171.5 $1,056.6
2002 $1,238.9 $169.0 $1,407.9
2003 $1,874.9 $213.1 $2,088.0
2004 $872.6 $119.2 $991.9
2005 $894.0 $81.4 $975.3
2006 $853.0 $76.7 $929.7
2007 $1,066.2 $94.9 $1,161.1
2008 $911.4 $267.6 $1,179.0
2009 $1,280.0 $451.3 $1,731.3
2010 $1,003.5 $390.7 $1,394.3
2011 $879.3 $315.3 $1,194.7
2012 $1,288.8 $405.0 $1,693.8
2013 $1,176.6 $393.6 $1,570.1
2014 $650.9 $296.3 $947.2
2015 $845.7 $436.3 $1,282.0
2016 $991.6 $508.2 $1,499.8
2017 $877.3 $455.6 $1,332.9
2018 $795.0 $400.6 $1,195.3
2019 $1,042.6 $508.6 $1,551.2
2020 YTD $1,866.1 $626.0 $3,019.9
2020 YTD% Change YOY
130.6% 55.9% 149.4%
2020 Ann. $2,239.4 $751.1 $3,623.8
Agency gross issuance was $3.02 trillion through the first ten months of 2020, more than the volume for full year 2019, or any other full year since 2000, including 2003, the previous record holder. The sharp increase is due to the refinance wave, which accelerated significantly in 2020. Net issuance (new securities issued less the decline in outstanding securities due to principal pay-downs or prepayments) totaled $499.8 billion in the first ten months of 2020, up 107.6 percent from the same period in 2019.
Sources: eMBS and Urban Institute.Note: Dollar amounts are in billions. Data as of October 2020.
Issuance Year
GSEs Ginnie Mae Total
2001 $368.40 -$9.90 $358.50
2002 $357.20 -$51.20 $306.10
2003 $334.90 -$77.60 $257.30
2004 $82.50 -$40.10 $42.40
2005 $174.20 -$42.20 $132.00
2006 $313.60 $0.20 $313.80
2007 $514.90 $30.90 $545.70
2008 $314.80 $196.40 $511.30
2009 $250.60 $257.40 $508.00
2010 -$303.20 $198.30 -$105.00
2011 -$128.40 $149.60 $21.20
2012 -$42.40 $119.10 $76.80
2013 $69.10 $87.90 $157.00
2014 $30.5 $61.6 $92.1
2015 $75.1 $97.3 $172.5
2016 $127.4 $125.8 $253.1
2017 $168.5 $131.3 $299.7
2018 $149.4 $112.0 $261.5
2019 $197.8 $95.7 $293.5
2020 YTD $477.1 $22.7 $499.8
2020 YTD% Change YOY
204.7% -73.1% 107.6%
2020 Ann. $572.6 $27.2 $599.8
0
50
100
150
200
250
300
350
400($ billions)
Fed Absorption of Agency Gross Issuance
Gross issuance Total Fed purchases
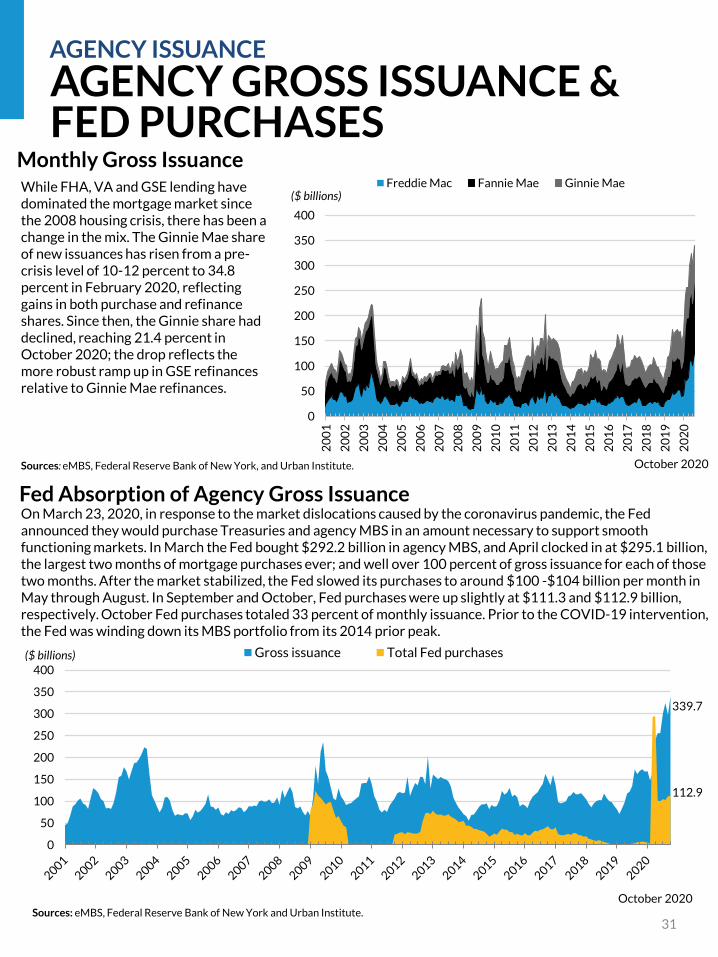
On March 23, 2020, in response to the market dislocations caused by the coronavirus pandemic, the Fed announced they would purchase Treasuries and agency MBS in an amount necessary to support smooth functioning markets. In March the Fed bought $292.2 billion in agency MBS, and April clocked in at $295.1 billion, the largest two months of mortgage purchases ever; and well over 100 percent of gross issuance for each of those two months. After the market stabilized, the Fed slowed its purchases to around $100 -$104 billion per month in May through August. In September and October, Fed purchases were up slightly at $111.3 and $112.9 billion, respectively. October Fed purchases totaled 33 percent of monthly issuance. Prior to the COVID-19 intervention, the Fed was winding down its MBS portfolio from its 2014 prior peak.
Sources: eMBS, Federal Reserve Bank of New York and Urban Institute.
October 2020
339.7
112.9
31
AGENCY GROSS AND NET ISSUANCE BY MONTH
AGENCY ISSUANCE
AGENCY GROSS ISSUANCE & FED PURCHASES
0
50
100
150
200
250
300
350
400
20
01
20
02
20
03
20
04
20
05
20
06
20
07
20
08
20
09
20
10
20
11
20
12
20
13
20
14
20
15
20
16
20
17
20
18
20
19
20
20
($ billions)
Monthly Gross IssuanceFreddie Mac Fannie Mae Ginnie Mae
October 2020Sources: eMBS, Federal Reserve Bank of New York, and Urban Institute.
While FHA, VA and GSE lending have dominated the mortgage market since the 2008 housing crisis, there has been a change in the mix. The Ginnie Mae share of new issuances has risen from a pre-crisis level of 10-12 percent to 34.8 percent in February 2020, reflecting gains in both purchase and refinance shares. Since then, the Ginnie share had declined, reaching 21.4 percent in October 2020; the drop reflects the more robust ramp up in GSE refinances relative to Ginnie Mae refinances.
32
MORTGAGE INSURANCE ACTIVITY
AGENCY ISSUANCE
0%
10%
20%
30%
40%
50%
60%
70%
80%
90%
100%
1999 2001 2003 2005 2007 2009 2011 2013 2015 2017 2019
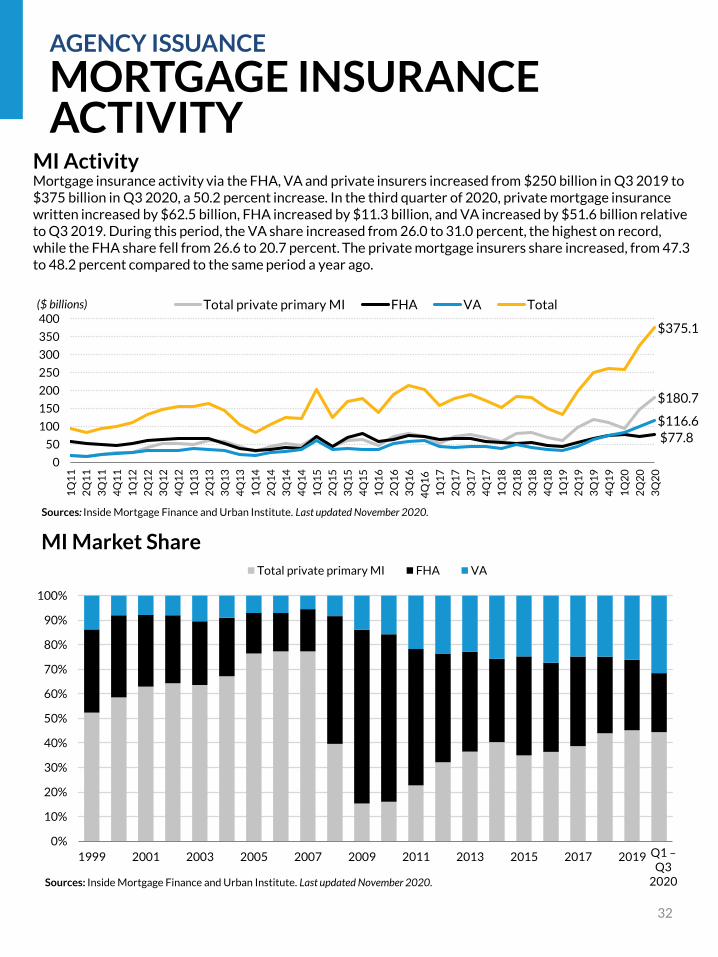
MI Market Share Total private primary MI FHA VA
Sources: Inside Mortgage Finance and Urban Institute. Last updated November 2020.
$180.7
$77.8
$116.6
$375.1
0
50
100
150
200
250
300
350
400
1Q
11
2Q
11
3Q
11
4Q
11
1Q
12
2Q
12
3Q
12
4Q
12
1Q
13
2Q
13
3Q
13
4Q
13
1Q
14
2Q
14
3Q
14
4Q
14
1Q
15
2Q
15
3Q
15
4Q
15
1Q
16
2Q
16
3Q
16
4Q
16
1Q
17
2Q
17
3Q
17
4Q
17
1Q
18
2Q
18
3Q
18
4Q
18
1Q
19
2Q
19
3Q
19
4Q
19
1Q
20
2Q
20
3Q
20
($ billions) Total private primary MI FHA VA Total
MI Activity
Sources: Inside Mortgage Finance and Urban Institute. Last updated November 2020.
Mortgage insurance activity via the FHA, VA and private insurers increased from $250 billion in Q3 2019 to $375 billion in Q3 2020, a 50.2 percent increase. In the third quarter of 2020, private mortgage insurance written increased by $62.5 billion, FHA increased by $11.3 billion, and VA increased by $51.6 billion relative to Q3 2019. During this period, the VA share increased from 26.0 to 31.0 percent, the highest on record, while the FHA share fell from 26.6 to 20.7 percent. The private mortgage insurers share increased, from 47.3 to 48.2 percent compared to the same period a year ago.
Q1 –Q3
2020

33
MORTGAGE INSURANCE ACTIVITY
AGENCY ISSUANCE
FHA MI Premiums for Typical Purchase Loan
Case number dateUpfront mortgage insurance premium
(UFMIP) paidAnnual mortgage insurance
premium (MIP)1/1/2001 - 7/13/2008 150 50
7/14/2008 - 4/5/2010* 175 55
4/5/2010 - 10/3/2010 225 55
10/4/2010 - 4/17/2011 100 90
4/18/2011 - 4/8/2012 100 115
4/9/2012 - 6/10/2012 175 125
6/11/2012 - 3/31/2013a 175 125
4/1/2013 – 1/25/2015b 175 135
Beginning 1/26/2015c 175 85
Sources: Ginnie Mae and Urban Institute.Note: A typical purchase loan has an LTV over 95 and a loan term longer than 15 years. Mortgage insurance premiums are listed in basis points. * For a short period in 2008 the FHA used a risk based FICO/LTV matrix for MI. a
Applies to purchase loans less than or equal to $625,500. Those over that amount have an annual premium of 150 bps.b
Applies to purchase loans less than or equal to $625,500. Those over that amount have an annual premium of 155 bps.c
Applies to purchase loans less than or equal to $625,500. Those over that amount have an annual premium of 105 bps.
FHA premiums rose significantly in the years following the housing crash, with annual premiums rising from 50 to 135 basis points between 2008 to 2013 as FHA worked to shore up its finances. In January 2015, President Obama announced a 50 bps cut in annual insurance premiums, making FHA mortgages more attractive than GSE mortgages for the overwhelming majority of borrowers putting down less than 5%. The April 2016 reduction in PMI rates for borrowers with higher FICO scores and April 2018 reduction for lower FICO borrowers has partially offset that. As shown in the bottom table, a borrower putting 3.5 percent down with a FICO of less than 720 will find FHA financing to be more financially attractive, borrowers with FICOs of 720 and above will find GSE execution with PMI to be more attractive.
AssumptionsProperty Value $250,000Loan Amount $241,250LTV 96.5Base Rate
Conforming 2.83FHA 3.12
Initial Monthly Payment Comparison: FHA vs. PMI
FICO 620 - 639 640 - 659 660 - 679 680 - 699 700 - 719 720 - 739 740 - 759 760 +
FHA MI Premiums
FHA UFMIP 1.75 1.75 1.75 1.75 1.75 1.75 1.75 1.75
FHA MIP 0.85 0.85 0.85 0.85 0.85 0.85 0.85 0.85
PMI
GSE LLPA* 3.50 2.75 2.25 1.50 1.50 1.00 0.75 0.75
PMI Annual MIP 1.86 1.65 1.54 1.21 0.99 0.87 0.70 0.58
Monthly Payment
FHA $1,222 $1,222 $1,222 $1,222 $1,222 $1,222 $1,222 $1,222
PMI $1,461 $1,399 $1,364 $1,277 $1,233 $1,196 $1,155 $1,131
PMI Advantage -$240 -$177 -$142 -$56 -$11 $26 $67 $91
Sources: Genworth Mortgage Insurance, Ginnie Mae, and Urban Institute. FHA rate from MBA Weekly Applications Survey. Conforming rate from Freddie Mac Primary Mortgage Market Survey.Note: Rates as of October 2020.Mortgage insurance premiums listed in percentage points. Grey shade indicates FHA monthly payment is more favorable, while blue indicates PMI is more favorable. The PMI monthly payment calculation does not include special programs like Fannie Mae’s HomeReady and Freddie Mac’s Home Possible (HP), both offer more favorable rates for low- to moderate-income borrowers.LLPA= Loan Level Price Adjustment, described in detail on page 25.
Upcoming events:See our events page for more information on other upcoming and past events.
Projects
The Mortgage Servicing Collaborative
Housing Credit Availability Index (HCAI)
Home Mortgage Disclosure Act Projects
Mortgage Markets COVID-19 Collaborative
Reducing the Racial Homeownership Gap
Publications
Closing the Gaps: Building Black Wealth through HomeownershipAuthors: Alanna McCargo, Jung Choi Date: November 23, 2020
Housing and Land Use Implications of Split-Roll Property Tax Reform in CaliforniaAuthors: Solomon Greene, Laurie Goodman, Sarah Strochak, Daniel Teles, Patrick SpausterDate: October 1, 2020
During the Pandemic, Policymakers Should Maintain Forbearance but Fix Its CostsAuthors: Michael Neal, Linna Zhu, Faith Schwartz Date: September 23, 2020
Newark Housing PulseAuthors: Michael Neal, Caitlin Young, Sarah Strochak, Laurie Goodman, Alanna McCargoDate: September 18, 2020
The CFPB's Proposed QM Rule Will Responsibly Ease Credit AvailabilityAuthors: Karan Kaul, Laurie Goodman, Jun ZhuDate: September 4, 2020
Before the Pandemic, Homeowners of Color Faced Structural Barriers to the Benefits of HomeownershipAuthors: Michael Neal, Jung Choi, John WalshDate: August 28, 2020
Analysis of the Proposed 2020 FHFA Rule on Enterprise CapitalAuthors: Edward Golding, Laurie Goodman, Jun ZhuDate: August 27, 2020
Blog Posts
Low-Income Renters and Renters in Their Prime Working Years Urgently Need More Federal AssistanceAuthors: Jung Choi, Laurie GoodmanDate: November 16, 2020
Mounting Pressures on Mom-and-Pop Landlords Could Spell Trouble for the Affordable Rental MarketAuthors: Jung Choi, Laurie GoodmanDate: November 10, 2020
Why It’s So Hard to Own a Home in Newark, New JerseyAuthors: Michael Neal, Laurie Goodman, Caitlin YoungDate: November 6, 2020
Understanding the Impact of Property Taxes Is Critical for Effective Local PolicymakingAuthors: Linna Zhu, Sheryl PardoDate: November 5, 2020
Appraisal Waivers Have Helped Homeowners Find Payment Flexibility Amid Pandemic-Induced Economic StrugglesAuthors: Michael Neal, Laurie GoodmanDate: October 16, 2020
Evictions Are on Pause, but Many Renters Still Can’t PayAuthors: Aaron Shroyer, Kathryn Reynolds, Sarah StrochakDate: October 6, 2020
A Broader Outreach Strategy Would Help 400,000 Needlessly Delinquent Mortgage BorrowersAuthors: Michael Neal, Laurie GoodmanDate: October 5, 2020
Proposition 15 Won't Worsen California’s Housing CrisisAuthors: Patrick Spauster, Sarah StrochakDate: September 30, 2020
Black and Hispanic Landlords Are Facing Great Financial Struggles because of the COVID-19 Pandemic. They Also Support Their Tenants at Higher Rates.Authors: Laurie Goodman, Jung ChoiDate: September 4, 2020
PUBLICATIONS AND EVENTSRELATED HFPC WORK
34
35
Copyright November 2020. The Urban Institute. All rights reserved. Permission is granted for reproduction of this file, with attribution to the Urban Institute. The Urban Institute is a nonprofit, nonpartisan policy research and educational organization that examines the social, economic, and governance problems facing the nation.
Acknowledgments
The Housing Finance Policy Center (HFPC) was launched with generous support at the leadership level from the Citi Foundation and John D. and Catherine T. MacArthur Foundation. Additional support was provided by The Ford Foundation and The Open Society Foundations.
Ongoing support for HFPC is also provided by the Housing Finance Innovation Forum, a group of organizations and individuals that support high-quality independent research that informs evidence-based policy development. Funds raised through the Forum provide flexible resources, allowing HFPC to anticipate and respond to emerging policy issues with timely analysis. This funding supports HFPC’s research, outreach and engagement, and general operating activities.
The chartbook is funded by these combined sources. We are grateful to them and to all our funders, who make it possible for Urban to advance its mission.
The views expressed are those of the authors and should not be attributed to the Urban Institute, its trustees, or its funders. Funders do not determine research findings or the insights and recommendations of Urban experts. Further information on the Urban Institute’s funding principles is available at www.urban.org/support.
Housing Finance Innovation Forum Members as of November 2020
Organizations400 Capital ManagementAGNC Investment Corp.Arch Capital GroupAssurantBank of America Caliber Home LoansCitizens BankEllington Management GroupFICOGenworth Mortgage InsuranceHousing Policy Council Ivory HomesMGICMortgage Bankers AssociationMovement MortgageMr. Cooper National Association of Home BuildersNational Association of RealtorsNational Foundation for Credit CounselingOcwenPretium PartnersPulte Home MortgageQuicken LoansRiskSpanTwo Harbors Investment Corp.Union Home MortgageU.S. Mortgage Insurers VantageScoreWaterfall Asset Management, LLCWells Fargo
IndividualsKenneth BaconJay & Alanna McCargoMary MillerJim MillsteinShekar NarasimhanFaith SchwartzMark & Ava Zandi
Data PartnersBlack Knight, Inc.CoreLogicExperianFirst AmericanMoody’s Analytics

Top Related