


Languages
Pages
Legal

1
Homophily, Cultural Drift and the Co-Evolution of Cultural Groups
Damon Centola1, Juan Carlos González-Avella2, Víctor M. Eguíluz2 and Maxi San
Miguel2*
11730 Cambridge Street, S408, The Institute for Quantitative Social Science, Harvard University, Cambridge, MA 02138
2 IFISC (CSIC-UIB), Campus Universitat de les Illes Balears, E-07122 Palma de
Mallorca, Spain.
June 20, 2007 Keywords: Social Networks, Cultural Diversity, Homophily, Cultural Drift, Social Dynamics *Send correspondence to: Damon Centola, [email protected], Institute for Quantitative Social Science, 1730 Cambridge St., S408, Harvard University, Cambridge MA, 02138. DMC acknowledges support from the Robert Wood Johnson Foundation and from the NSF through Cornell University's IGERT program in non-linear dynamics and through grant SES-0432917. JCG, VME, and MSM acknowledge financial support from MEC (Spain) through projects CONOCE2 (FIS2004-00953) and FISICOS (FIS2007-60327).

2
Homophily, Cultural Drift and the Co-Evolution of Cultural Groups
Abstract
Studies of cultural differentiation have shown that social mechanisms that normally lead
to cultural convergence - homophily and influence - can also explain how distinct cultural
groups can form. So long as the level of heterogeneity in the population is high enough,
cultural diversity can emerge. However, this emergent cultural diversity has proven to be
unstable in the face of “cultural drift” – small errors or innovations that allow cultures to
change from within. We develop a model of cultural differentiation that combines the
traditional mechanisms of homophily and influence with a third mechanism of “network
homophily”, in which network structure co-evolves with cultural interaction. We show
that if social ties are allowed to change with cultural influence, a complex relationship
between heterogeneity and cultural diversity is revealed, in which increased
heterogeneity can reduce cultural group formation while simultaneously increasing social
connectedness. Our results show that in certain regions of the parameter space these co-
evolutionary dynamics can lead to patterns of cultural diversity that are stable in the
presence of cultural drift.

3
Homophily, Cultural Drift and the Co-Evolution of Cultural Groups
Homophily – the principle that “likes attract” – is a prominent explanation for the
persistence of cultural diversity. More precisely, homophily is the tendency of people
with similar traits (including physical, cultural, and attitudinal characteristics) to interact
with one another more than with people with dissimilar traits. There are three reasons
why homophily is such a powerful force in cultural dynamics, where “culture” is defined
as a set of individual attributes that are subject to social influence (Axelrod 1997).
Psychologically, we often feel justified in our opinions when we are surrounded by others
who share the same beliefs – what Lazarsfeld & Merton (1954) call value homophily
(Huston & Levinger 1978, Knoke 1990); we also feel more comfortable when we interact
with others who share a similar cultural background, i.e., status homophily (Lazarsfeld &
Merton 1954, Fischer 1977, Marsden 1987, 1988, Shrum 1988). Both of these reasons are
forms of choice homophily (McPherson & Smith-Lovin 1987, McPherson et al. 2001),
where patterns of interaction are driven by preferences for similarity. The third reason,
induced homophily (McPherson & Smith-Lovin 1987, McPherson et al. 2001), emerges
not from individual choice but from influence dynamics that makes individuals more
similar over time.
While homophily has been studied empirically as an important factor in the
formation and differentiation of social groups (Fischer 1977, Marsden 1988, Popielarz &
McPherson 1995), there are relatively few formal models that show how homophily
functions to create and preserve social differentiation (Axelrod 1997, Mark 1998, Macy
4
et al. 2003). This is because in addition to the principle of choice homophily, social
scientists also observe the principle of social influence: the more that people interact with
one another, the more similar they become. This influence process produces induced
homophily, in which the disproportionate interaction of likes with likes may not be the
result of a psychological tendency, but rather the result of continuous interaction
(McPherson & Smith-Lovin 1987). When choice homophily (hereafter “homophily”) and
social influence are taken together, the explanation of cultural diversity poses something
of a paradox: “if people who are similar to one another tend to become more alike in their
beliefs, attitudes, and behavior when they interact, why do not all such differences
eventually disappear?” (Axelrod 1997: 203).
While the processes of homophily and influence can produce global convergence,
Axelrod (1997) shows that they can also act as local convergence mechanisms, which
produce emergent social cleavages that lead to global polarization. Thus, the answer to
the paradox is that as homophily increases, some groups of people do indeed converge on
their cultural characteristics; yet, if there is enough heterogeneity in the population, this
similarity among group members can also make them even more dissimilar from the
members of other groups (Duncan et al. 1968, Knoke 1990). Ultimately, this can produce
cultural groups that are so dissimilar from one another that their members cannot interact
across group boundaries. This shows not only that the simple combination of homophily
and social influence can produce and sustain patterns of global diversity (Axelrod 1997),
but also that the development of cultural barriers between groups can arise from a process
of social self-organization in which emergent differences becomes significant enough to
prevent inter-group contact, even without enmity across group lines.
5
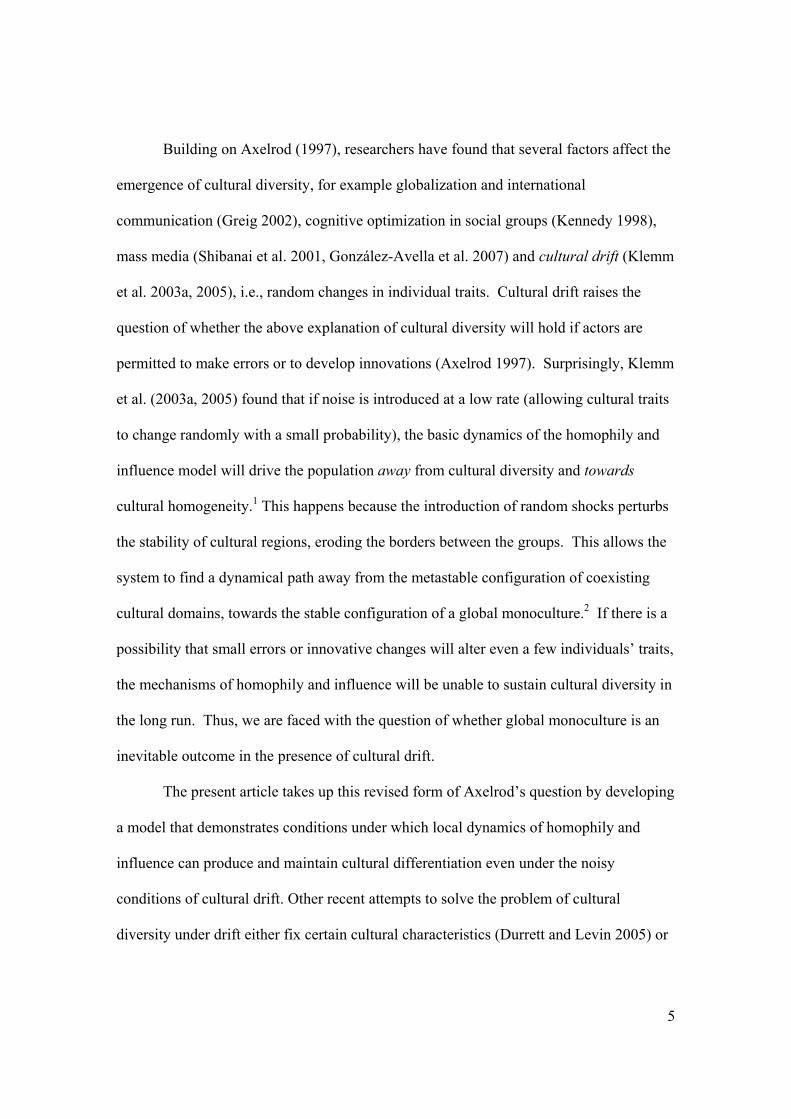
Building on Axelrod (1997), researchers have found that several factors affect the
emergence of cultural diversity, for example globalization and international
communication (Greig 2002), cognitive optimization in social groups (Kennedy 1998),
mass media (Shibanai et al. 2001, González-Avella et al. 2007) and cultural drift (Klemm
et al. 2003a, 2005), i.e., random changes in individual traits. Cultural drift raises the
question of whether the above explanation of cultural diversity will hold if actors are
permitted to make errors or to develop innovations (Axelrod 1997). Surprisingly, Klemm
et al. (2003a, 2005) found that if noise is introduced at a low rate (allowing cultural traits
to change randomly with a small probability), the basic dynamics of the homophily and
influence model will drive the population away from cultural diversity and towards
cultural homogeneity.1 This happens because the introduction of random shocks perturbs
the stability of cultural regions, eroding the borders between the groups. This allows the
system to find a dynamical path away from the metastable configuration of coexisting
cultural domains, towards the stable configuration of a global monoculture.2 If there is a
possibility that small errors or innovative changes will alter even a few individuals’ traits,
the mechanisms of homophily and influence will be unable to sustain cultural diversity in
the long run. Thus, we are faced with the question of whether global monoculture is an
inevitable outcome in the presence of cultural drift.
The present article takes up this revised form of Axelrod’s question by developing
a model that demonstrates conditions under which local dynamics of homophily and
influence can produce and maintain cultural differentiation even under the noisy
conditions of cultural drift. Other recent attempts to solve the problem of cultural
diversity under drift either fix certain cultural characteristics (Durrett and Levin 2005) or

6
introduce xenophobia into the dynamics (Macy et al. 2003). We preserve the basic
homophily and imitation dynamics developed by Axelrod (1997). The key development
in our approach is the specification of homophily. While both choice and induced
homophily have been primary mechanisms for understanding how distinct cultural groups
can form (Axelrod 1997, Mark 1998, 2003, Durrett and Levin 2005), most research in
this tradition places an emphasis upon the changing distribution, or clustering, of traits
over time. However, recent research shows that network dynamics – the changing
patterns of social interaction over time – may play an equally important role in
understanding the effects of homophily on group formation (McPherson et al. 2001).
Following this line of research, we introduce “network homophily” via the co-evolution
of individual traits and network structure (McPherson et al. 1992, Lazer 2001, Eguíluz et
al. 2005).
In previous models of cultural evolution (Axelrod 1997, Kennedy 1998, Greig
2002, Klemm et al. 2003), the network of social interactions remains fixed, which forces
individuals with no cultural traits in common to remain “tied” to each other in the social
network despite having no possibility for interaction. However, in our approach to
studying cultural dynamics, if cultural influence processes create differentiation between
two neighbors such that they have no cultural traits in common we allow these
individuals to alter the structure of the social network by dropping their tie and forming
new ties to other individuals. Thus, in our specification of homophily the network of
social interactions is not fixed (Axelrod 1997, Klemm et al. 2003b), but rather it evolves
in tandem with the actions of the individuals (Macy 1991, Lazer 2001) as a function of
changing cultural similarities and differences (Blau and Schwarz 1984, Marsden 1987,
7
1988, McPherson et al. 2001). Following Klemm et al.’s (2003a, 2003b, 2003c, 2005) use
of the level of heterogeneity in the population as a control parameter, our network-based
approach allows us to map the space of possible co-evolutionary outcomes, and thereby
to show how network structure and cultural group formation depend upon one another.
These results allow us to address the question of how stable cultural groups can be
maintained in the presence of cultural drift.
A Co-Evolutionary Model of Cultural Dynamics
We use an agent-based model (Axelrod 1997) in which each actor i has its individual
attributes defined as a vector of F cultural features; each feature represents a different
kind of taste or behavior (e.g., language, religion, music choice, clothing, etc.), and takes
its value from a range of q possible traits. Thus, the state of an actor i is a vector of F
cultural features (σi1, σi2, . . . σiF), where each σif corresponds to a cultural trait assigned
from the range of integers between 0 and q-1. The length of the vector F represents the
social complexity of the population, i.e., the larger F is, the greater the number of cultural
characteristics that are attributable to each individual (Blau and Schwarz 1984). The
number of traits, q, represents the heterogeneity of the population (Blau and Schwarz
1984). The larger q is, the larger the number of possible traits that a given feature can
have, corresponding to a greater number of cultural options in the society.
The initial state consists of N agents located in a two dimensional square lattice
with von Neumann neighborhoods (Axelrod 1997, Centola, et al. 2005), which allows for
easy comparison with previous work (Axelrod 1997, Castellano et al. 2000, Klemm et al.
2003a, 2005). Each actor is randomly assigned F cultural traits. Agents are neighbors if
8
they are connected by a direct link in the network, where the weight of this link is
determined by their cultural similarity, defined below. The dynamics of the model are
defined by the following rules:
1) Select an agent i at random from the population. Call i the ‘active’ agent.
From among i’s neighbors, select a random neighbor j and call this agent the
‘partner’.
2) Calculate the overlap, or cultural similarity, between i and j as the number of
features on which i and j have the same trait: ∑=
=F
fjfif
jiO1
,),( σσδ .
3) If i and j share some features in common, but are not yet identical, i.e., 0 <
O(i, j) < F, then i and j interact with probability O(i, j)/F.
4) Agent i interacts with agent j by choosing a random feature g such that i and j
do not already overlap, i.e., jgig σσ ≠ . The active agent i then sets its trait at
feature g to match its partner’s trait at feature g, i.e., jgig σσ = .
5) If O(i, j) = 0, i removes j from his network of social ties T, and randomly
selects an agent k, where ijkTk ,, ≠∉ and adds k to its social network.
Rules 1-4 define the basic homophily and influence model, in which actors who
are similar are more likely to interact. Interaction makes actors who are similar become
even more similar, increasing the weight of their tie and the likelihood of future
interaction. As shown by Axelrod (1997), as some actors become more similar, others
become less similar, as the dynamics of cultural evolution create widening gaps between
the emerging cultural communities. Some neighbors in the social network may become
so different from one another that they no longer share any cultural traits in common.
9
When this happens, the weight of the tie between them drops to zero, and no longer
functions as a means for cultural influence. Rule 5, schematically explained in Fig. 1,
incorporates network dynamics into the specification of homophily by allowing actors to
“drop” these zero weight ties. Just like members of a social clique who have grown
distant from one another by virtue of interacting with different social groups (Macy et al.
2003), or voluntary group members who share less and less in common as they derive
more of their social and cultural influence from outside sources (McPherson et al. 1992),
as social differentiation reduces shared traits, the remaining ties become a vestigial
feature of the actors’ social histories, and are ultimately broken (McPherson et al. 2001).
These network homophily dynamics allow the structure of the social network to
co-evolve with the dynamics of social influence. According to rule 5, if an active
individual tries to interact with a neighbor with whom there is zero overlap in cultural
features, it drops the tie to this neighbor and randomly forms a new tie to another
individual. This rule allows individuals to change their social ties while preserving the
overall density of the social network. Taken together, rules 1-5 model the co-evolution
(Eguíluz et al. 2005) of social structure and individual traits in the dynamics of cultural
change.
Model Dynamics
In the absence of co-evolutionary network dynamics (rules 1-4 only), the system can
evolve either toward complete homogeneity or toward cultural diversity, depending on
the level of heterogeneity, q, and the number of cultural features, F (Axelrod 1997,
10
Castellano et al. 2000). In the limit of large N, for regular lattices, random networks and
small world networks there is a well defined transition: for a fixed F, there is a critical
value of q, qc, that corresponds to the transition from global monoculture to cultural
diversity (Castellano et al. 2000, Klemm et al. 2003b, 2003c). Thus, a single parameter –
the heterogeneity in the population – controls the dynamics of whether the population
evolves toward multiculturalism or toward a global monoculture. This transition is sharp,
going from complete monoculture to widespread diversity on either side of the critical
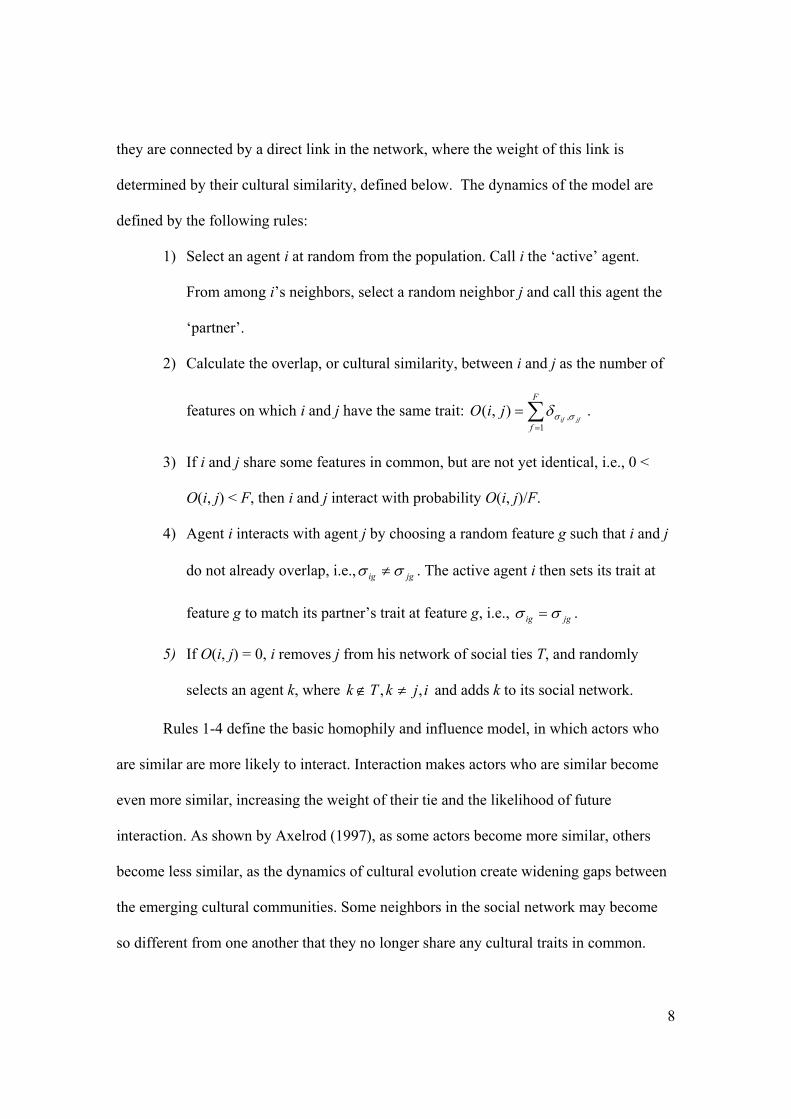
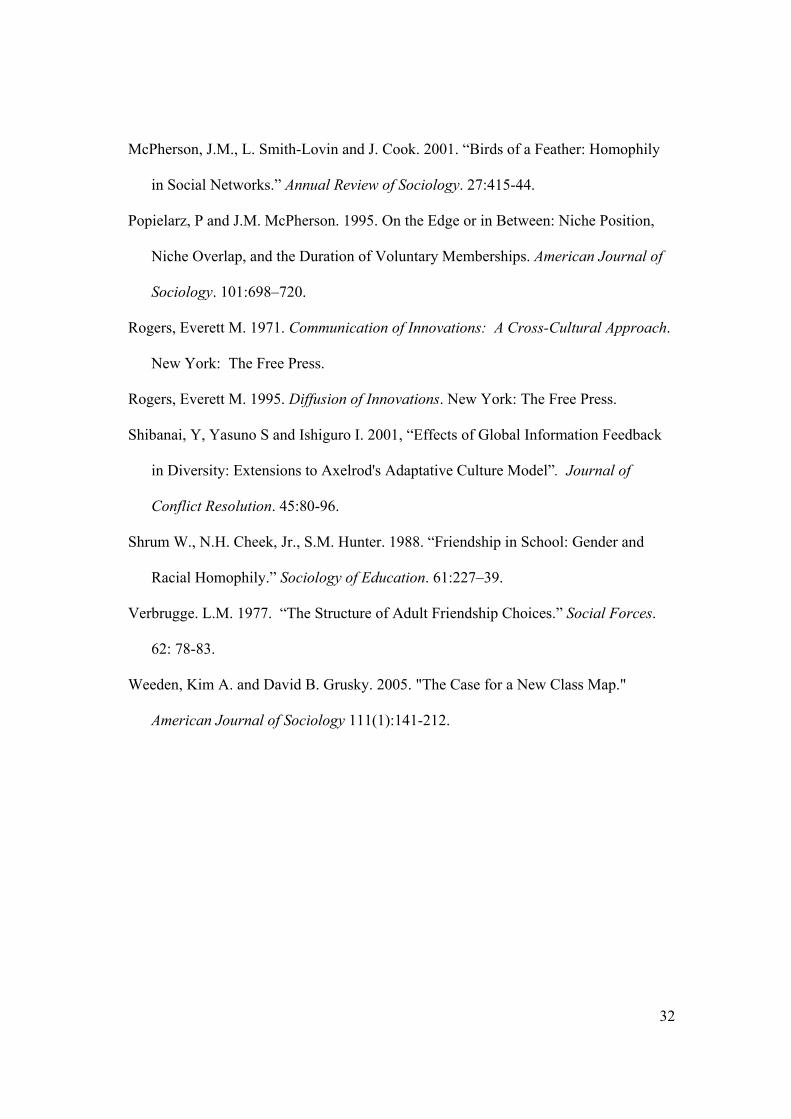
value (Klemm et al. 2003c). In Figure 2, the transition is shown by the dramatic change
in the average size (normalized by N) of the largest cultural domain, <Smax>/N, as q
increases.3 When q < qc, the largest cultural domain approximates the size of the entire
population <Smax> ~ N, indicating little or no cultural diversity.4 However, for q > qc
increased heterogeneity guarantees that the largest cultural domain is only a small
fraction of the population (<Smax> << N). Correspondingly, when <Smax>/N is small, the
number of distinct cultural groups is large.
How does the introduction of co-evolution (rule 5) affect this transition from
global monoculture to multiculturalism? Figure 2 shows that introducing network
dynamics has the quantitative effect of increasing the critical value of q. Thus, there is a
large range of values of q for which multiculturalism is achieved in a fixed network,
while co-evolutionary dynamics lead to a monocultural state.5
The co-evolutionary dynamics not only affect the critical value of q, they also
dramatically alter the structure of the social network. Depending on the value of q, the
network can evolve from a regular lattice into a complex random network with a giant
connected cluster, or can break apart into multiple components (physical groups) of

11
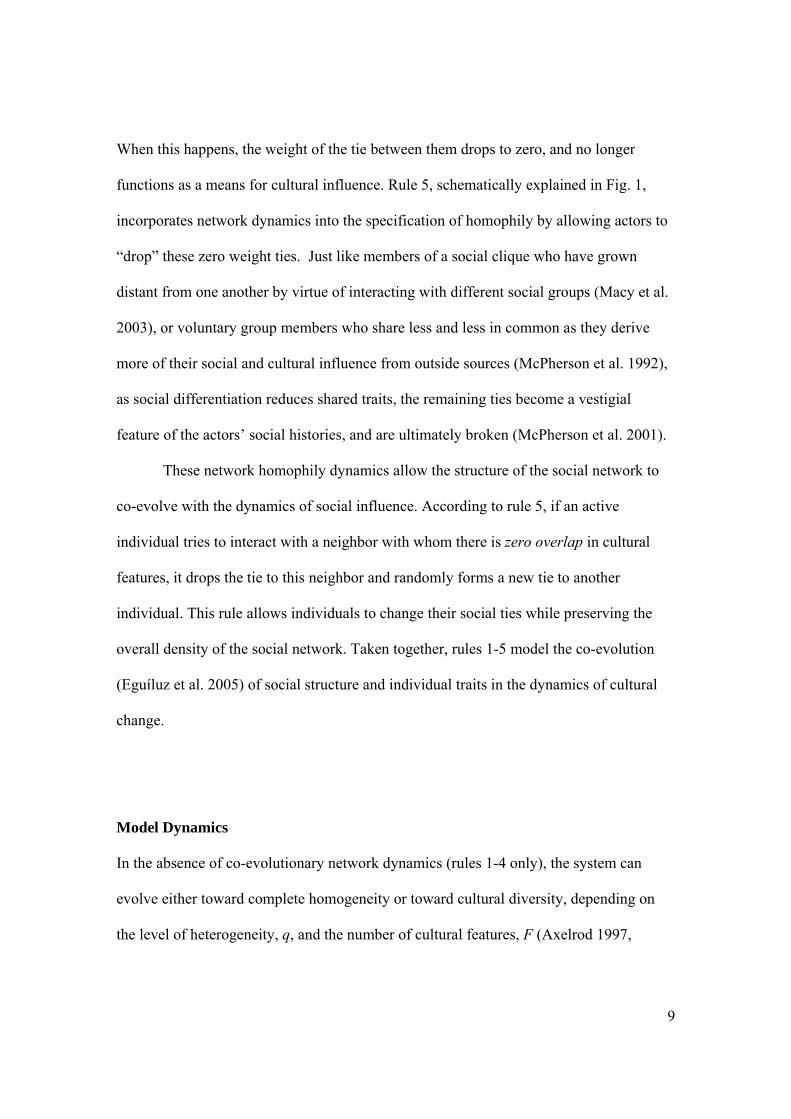
different sizes. This latter point is quite important, for it means that while cultural
diffusion on the fixed network produces boundaries that define the cultural regions, the
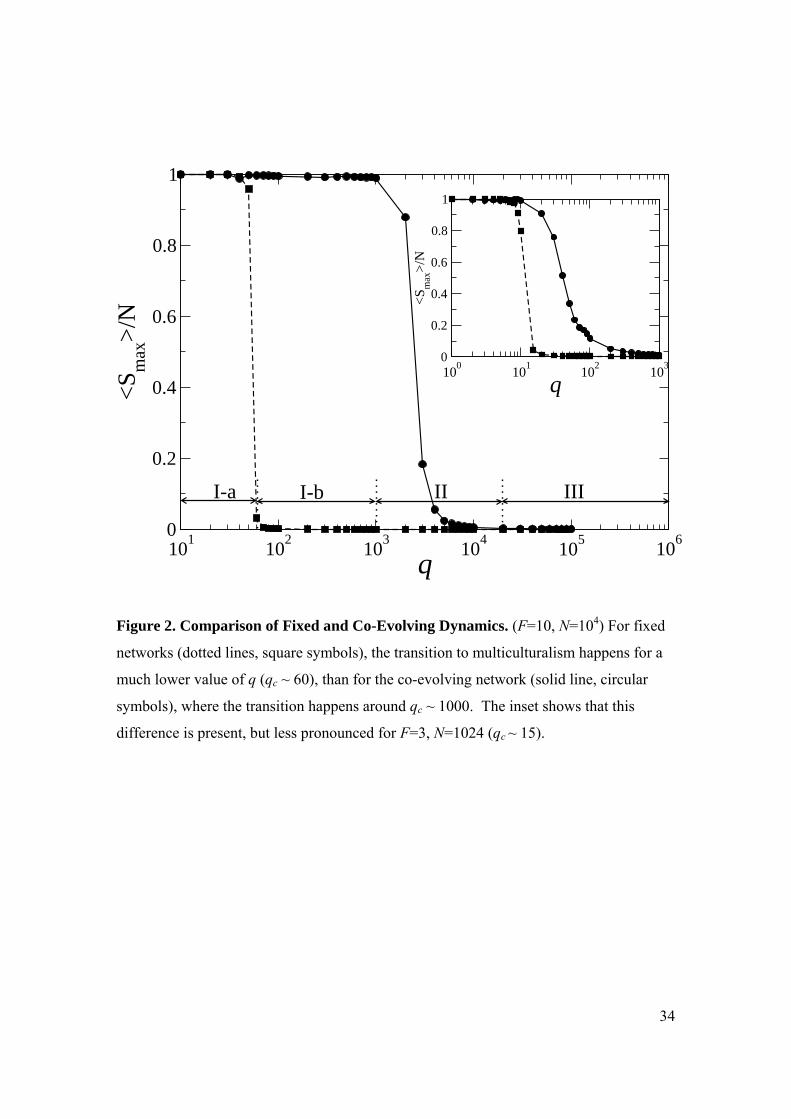
dynamic network can self-organize into culturally distinct physical groups. This process
of self-organization is illustrated in Figure 3. Beginning with a regular lattice (Figure
3a), the system first loses its original structure (Figure 3b), then forms into culturally
homogenous regions (Figure 3c), which ultimately become culturally homogenous
components (Figure 3d). The colors of the nodes indicate unique cultural groups, which
change over time due to the influence process. Assuming the initial network is connected,
this process of network self-organization is independent of the initial conditions. We
experimented with a variety of initial network topologies (e.g., small world networks,
random networks, and regular lattices), and found that the network quickly reorganizes in
a random network. More precisely, the final network configuration for different values of
q is well described by a Poisson distribution of the number of links per node (i.e., the
degree distribution).
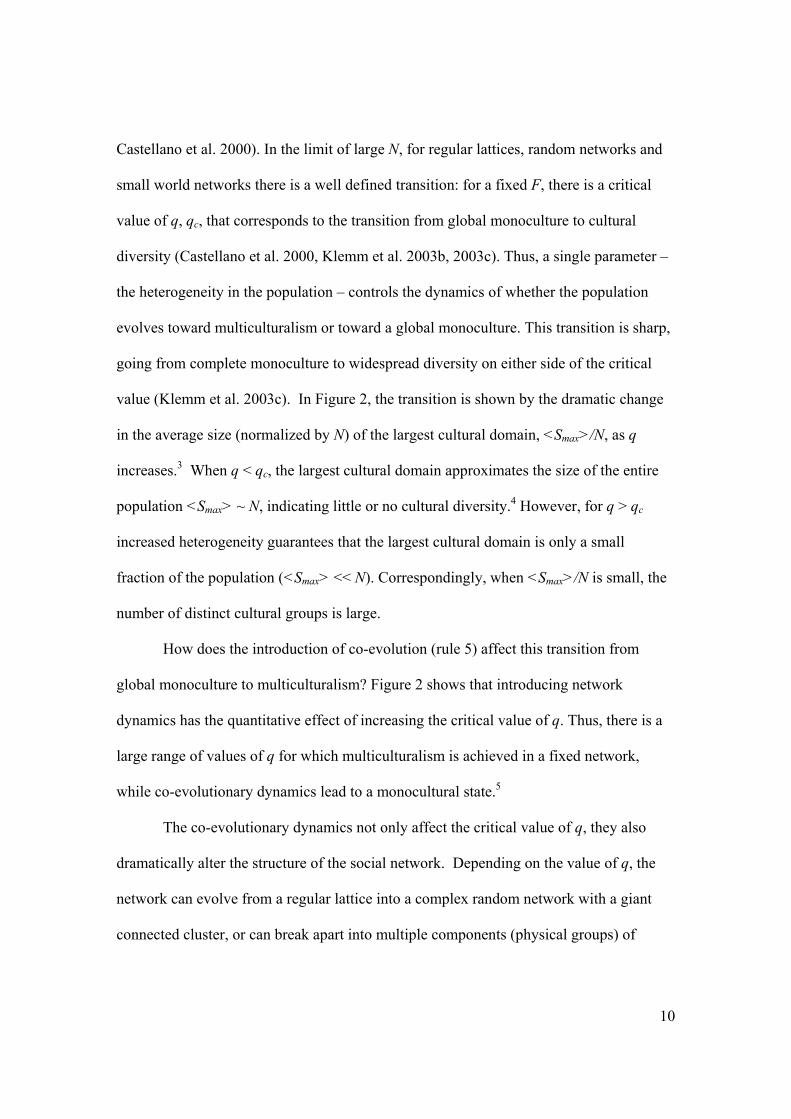
These network dynamics are surprisingly dependent upon the level of
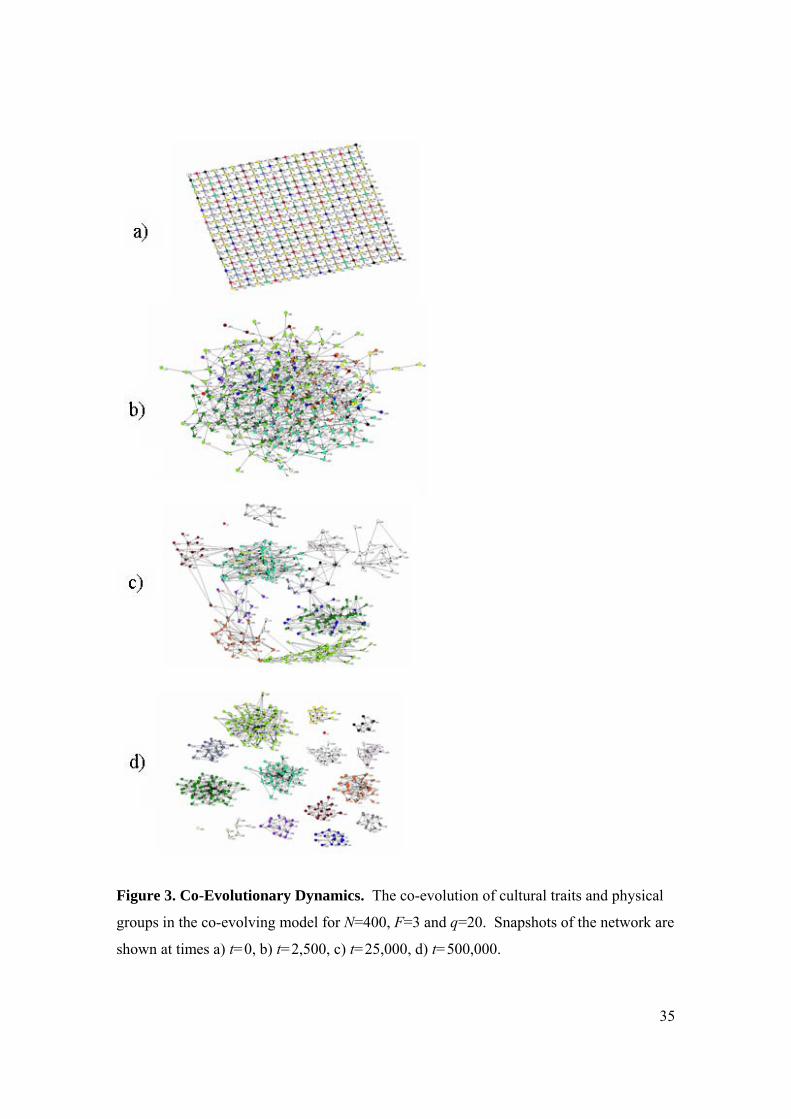
heterogeneity in the population, as shown in Figures 4 and 5. Figure 4 illustrates the
effects of increasing q on the size of the largest network component, or physical group,
that is produced by the co-evolutionary process. Initially, increasing q causes component
size to decrease; however, for higher levels of q there is a transition above which
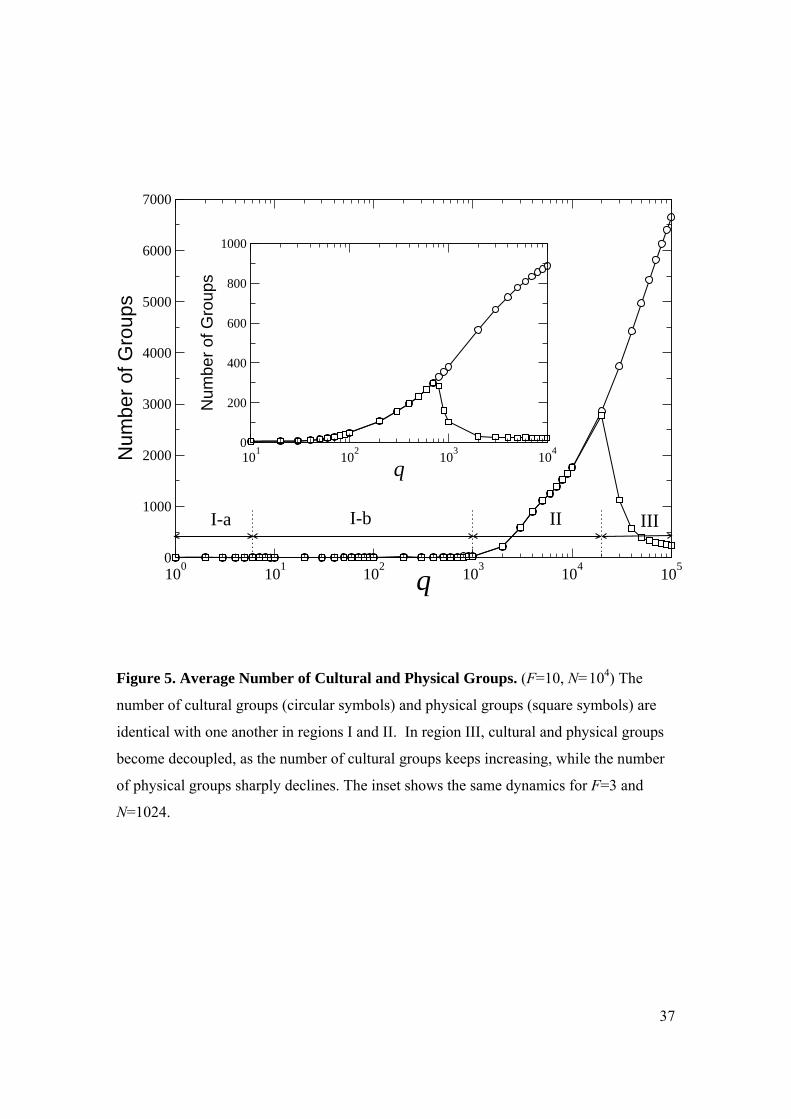
component size reverses its trend and increases sharply. Figure 5 shows the effects of q
on the number of distinct cultural and physical groups. This figure also indicates a
sharply curvilinear effect of increasing q. In both figures, these co-evolutionary
outcomes are divided into four distinct regions of the parameter space:
12
• Region Ia) values of q < qc (qc=60 for F=10 and qc=15 for F=3) where a global
monocultural state is reached in a fixed network.
• Region Ib) values qc < q < qc´ for which a fixed network attains cultural
differentiation (shown in Figure 1), while a co-evolving network produces a dominant
monocultural state.
• Region II) values of qc´ < q < q* for which multicultural states are produced in
both a fixed network and in a co-evolving network, and the number of cultural and
physical groups coincide asymptotically in time in a co-evolving network.
• Region III) values of q>q*, where q* corresponds to a threshold value (q* ~
2x10⁴ for F=10, q* ~ 7x10² for F=3) above which the number of cultural and physical
groups no longer coincide.
In region I, the co-evolutionary model produces global monoculture across the
entire range of q values. We show this region as sub-divided into regions Ia and Ib to
compare the fixed network model to the co-evolutionary one. Region Ia is the simplest
case since there is insufficient heterogeneity to allow cultural differentiation – even in a
fixed network there are too few cultural options for cultural diversity to emerge. In
region Ib there is sufficient heterogeneity to allow cultural diversity to emerge in the
fixed network, however, in the co-evolutionary model, cultural homogeneity still
dominates the population. This is because actors in the dynamic network are able to find
paths around local borders by forming new ties. As actors create new links across the
population, their ties form a large connected component (technically a giant network
component) that allows cultural boundaries to break down, and gives rise to a global
monoculture. As q increases, we approach region II, in which the dynamic network
13
breaks into multiple components. In Figure 4, region II (approximately 103 ≈ qc’ < q <
2x10⁴ for F=10 and N=104) corresponds to values of q for which there is a gradual
decrease in the average size of the largest physical group. Correspondingly, in Figure 2,
this region corresponds to a gradual decrease in the average size of the largest cultural
group. Thus, as the size of the largest component decreases, so does the size of the
largest cultural domain. In Figure 5, region II is also shown to correspond to the values
of q for which there is a gradual increase of the average number of physical and cultural
groups. So, as the network breaks apart into multiple components, it also forms into
more cultural groups.
Computational analyses of the transition between regions I and II show that the
critical value of q’c increases with the size of the population, N. Thus the more people
who participate in the cultural exchange, the more heterogeneity is required in order to
prevent assimilation into a global monoculture. Further, we also found that for larger
values of F, the critical transition between regions I and II becomes sharper, as seen in
the differences in Figures 2 and 4 between the transitions in the insets (F=3) and in the
main figures (F=10). For F=3 there is a gradual transition between a dominant culture
and abundant cultural diversity. However, for F=10, the size of the largest cultural
domain undergoes a sharp transition from a single group occupying almost the entire
population, to many small groups of the same size.
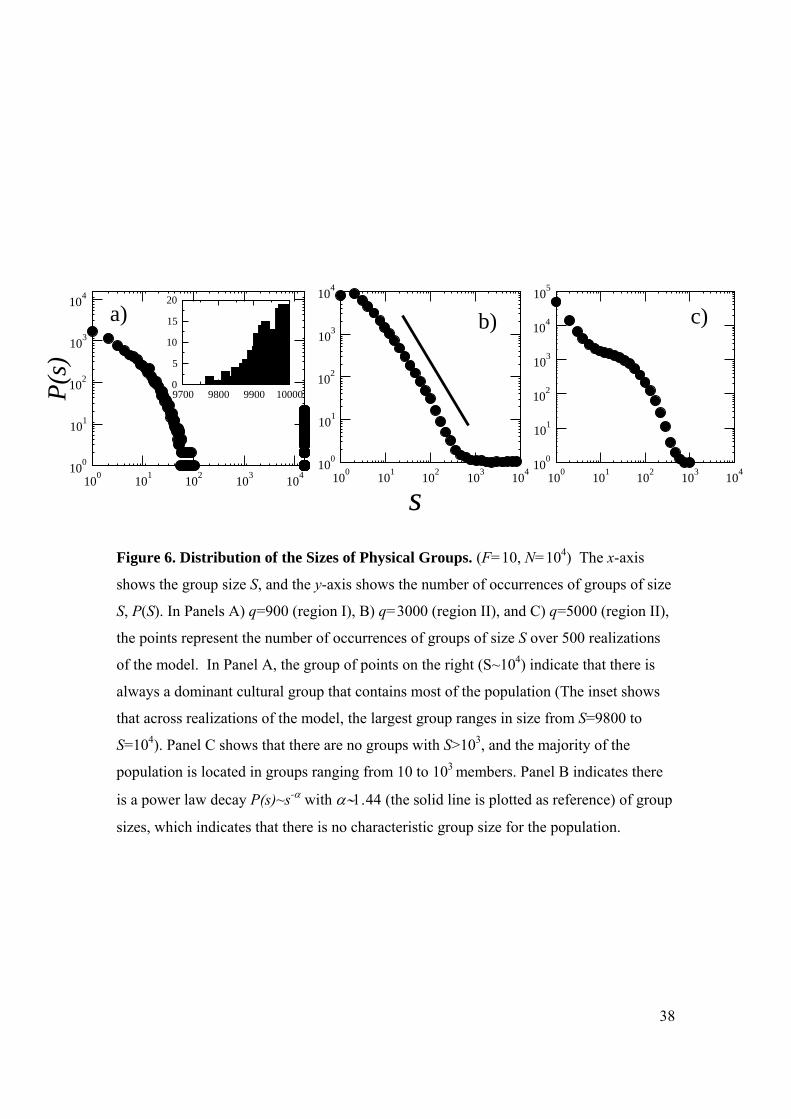
Closer analysis shows that for F=10 the distribution of group sizes undergoes an
unexpected “phase transition” as the system moves between regions I and II. Figure 6
(F=10) shows the distribution of group sizes for a system in region I (q=900), deep in
region II (q=5000), and intermediate between them (q=3000). The x-axis indicates the
14
size of the group, S, and the y-axis indicates the number of clusters of size S, P(S). Each
point in Figure 6 is a record of how many times a group of size S occurred in 500
independent realizations of the model. In Panel A (region I, q=900), the majority of the
population is in a large component, approximately the size of the population (S~N). This
is indicated by the occurrence of groups at the far right side of the panel. Small groups or
individual isolates (S~1) make up the remainder of the population. Deep in region II
(Panel C, q=5000), there are no occurrences of groups larger than 1000, and most groups
have a size between 10 and 1000 individuals. Intermediate between them, there is a
transition point (Panel B, q~3000), where the distribution of group sizes is “scale free,”
i.e., it follows a power law. This indicates that for this intermediate value of q, there exist
cultural groups of all possible sizes, making it impossible to define a characteristic group
size for the population.6 Thus, in region II there is a complex and surprising transition in
the sizes of the cultural groups that substantively affects the cultural composition of the
population.
Our model demonstrates a process of group differentiation through which a large
heterogeneous group fractures and then consolidates into multiple cliques, or subgroups.
This process has been documented in the formation of adolescent and adult friendship
groups (Cohen 1977, Verbrugge 1977), voluntary organizations (McPherson et al. 1992,
Popielarz and McPherson 1995), social movements (Heckathorn 1996), class identity
(Weeden and Grusky 2005), and cultural norms more generally (Latane 2000). As the
number of cultural options in a population increases, the average similarity among the
members of large heterogeneous groups decreases. Further, as individuals find others like
them, and grow more similar, emerging cleavages in the large group eventually result in a

15
splintering process, whereby large groups disaggregate into smaller, more culturally
“specialized” ones (McPherson et al. 1992, Latane 2000).
The key to these homophily dynamics is the changing nature of the social
network. Cultural influence and social adaptation processes allow individuals to “evolve”
in the space of cultural ideas and behaviors, changing the social landscape. As people
grow apart, the reinforcing effects of reduced similarity and reduced interaction cause old
ties to be dropped; reciprocally, new friendships are made with people who share one’s
current tastes and preferences. Eventually, this process of individual differentiation also
creates group consolidation, as detachment from dissimilar people also gives rise to
stronger bonds with more similar individuals (Bourdieu 1984). “This tendency for
network relations to form between those who have similar social characteristics is known
as the ‘homophily principle.’ Since individuals close to one another on a dimension of
social space are similar, homophily implies that ties are local in social space.” (Popielarz
& McPherson 1995: 701)
In region II, the physical space of the social network is rearranged until all ties are
“local in social space”. This process produces an emergent social landscape in which
discrete social clusters (i.e., components) correspond to distinct “trait groups.” The more
heterogeneity in the population, the more exclusive these trait groups become (Bourdieu
1984).
However, surprisingly, this trend of increasing cultural distinction with greater
heterogeneity is not continuous. Figure 4 also shows that the trend of decreasing
component size, observed in Region II, is non-monotonic in q. Above q* (region III), the
size of the largest component increases sharply. By contrast, Figure 2 shows no

16
corresponding change in the size of the largest cultural group, which continues to
decrease for q > q*. In regions I and II the number of cultural groups matches the
number of physical groups, indicating that each component corresponds to a different
cultural domain, however Figure 5 shows that in region III the number of cultures
continues to increase, while the number of network components starts to decrease. Thus,
in region III, the dynamics of cultural group formation de-couple from the dynamics of
network formation.
This indicates that q* represents a transition in the dynamics of cultural evolution
past which social structure does not determine the formation of cultural groups. This is
certainly anomalous, since from the definition of our dynamical model, physical and
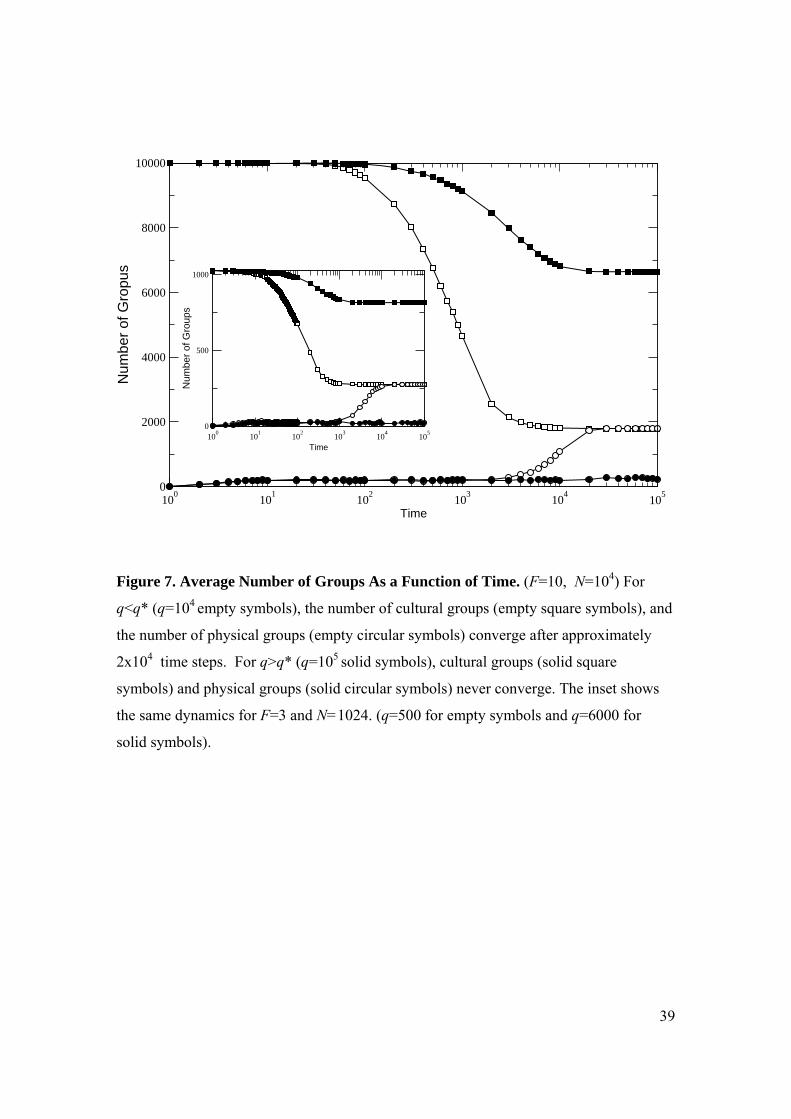
cultural groups are expected to coincide asymptotically. Figure 7 sheds light on this
anomalous result by examining the time evolution of network groups (circles) and
cultural groups (squares) for values of q above (solid) and below (empty) q*. First, we
observe that both above and below q*, the dynamics of network evolution (physical
group formation) is slower than the dynamics of cultural group formation. For q<q*, the
number of cultural groups (empty squares) stabilizes at approximately t=4000, but the
number of physical groups (empty circles) does not finally converge until t=20,000. For
q>q*, the trend is similar, with cultural groups (solid squares) stabilizing at around
t=20,000, however the number of physical groups (solid circles) fails to converge.
This failure of the network to converge highlights the primary difference between
the behavior of the system above and below q*. As heterogeneity increases, there is an
excess of cultural possibilities, and it becomes less likely that any two actors will have
any traits in common. Above q*, the large number of cultural possibilities overwhelms

17
actors in a finite system, making it difficult for them to find any overlapping traits with
one another. As the size of q becomes of the order NF (system size times number of
features), the number of possible traits is so much larger than the number of instantiated
traits at any given time that the probability of individuals having any cultural overlap
approaches zero. The consequence is that co-evolutionary dynamics result in actors
continuously breaking links and searching for new partners in the network, without ever
reaching a stationary configuration.
Thus, in region III, the abundance of cultural options overwhelms the population,
creating “anomic” (Durkheim 1997 [1897]) actors, who develop unlikely combinations of
cultural features that prevent them from interacting with anyone. While some actors are
able to form into homophilous clusters, the anomic actors perpetually add and drop ties.
When q>q*, the largest component in the network consists of this disenfranchised group
of actors who are unable to establish memberships in any of the homophilous social
clusters. With increasing heterogeneity, the number of anomic actors increases, as does
the size of this component, until the entire population forms a single network that is
simply a buzz of adding and dropping ties with no mutual influence or lasting
relationships. The over-abundance of cultural options actually prevents the formation of
cultural groups, and thus eliminates the forms of social diversity that heterogeneity was
thought to help create. This suggests that, in addition to previous findings that increased
heterogeneity facilitates the maintenance of cultural diversity, under certain conditions
limiting cultural opportunities may also facilitate the preservation of diverse cultural
groups.

18
In summary, holding the system size and the number of features constant, we can
thus identify the complex ways in which heterogeneity controls the dynamics of cultural
co-evolution. For q < qc´, there is a dominant connected component of the social network
where the cultural patterns converge on a global monoculture. For qc´ < q < q*, the
network breaks off into components that correspond to distinct cultural groups. Finally,
for even greater values of heterogeneity (q > q*), network evolution and cultural
evolution decouple, as the size of the largest component increases dramatically while
cultural groups fragment into ever smaller – ultimately idiosyncratic – patterns of traits.
Finally, it is worth commenting on the robustness of our findings with respect to
the specific co-evolution rule (rule 5) that we have implemented. With this rule, the
cultural traits of individuals and the structure of the social network co-evolve on the same
time scale. However, this temporal constraint can be relaxed. Different time scales for the
evolution of cultural traits and network ties can be introduced by a parameter p that
determines the probability with which rule 5 is applied in a time step. That is, each time
an individual is activated to participate in a cultural interaction, there is a probability p
that a link of zero overlap is removed and a new random link is established. Thus far, we
assume that p=1. As a robustness check, we have tested our results for other values of p.
We found that the same results are produced for values of p>0, with the difference that
the time needed to reach the final configurations becomes much larger as p becomes
small. Thus, relaxing the assumption that p=1 has the effect of increasing the transient
time of the dynamics without affecting the final outcome.
Cultural Drift and Co-Evolution

19
This analysis of the co-evolutionary dynamics suggests that in region II, where nontrivial
multicultural states survive in a co-evolving network, the co-evolutionary cultural
processes of homophily and influence may in fact stabilize the co-existence of distinct
cultural regions even in the presence of continuous stochasticity. Following Klemm et al.
(2003a, 2005), we add cultural drift to the evolutionary dynamics by adding noise in the
form of continuous random shocks, as defined by the following rule:
6) With probability r, perform a single feature perturbation. A single feature
perturbation is defined as randomly choosing an agent i from the population,
},...,1{ Ni∈ ; randomly choosing one of i’s features, },...,1{ Ff ∈ ; then
randomly choosing a trait s from the list of possible traits, },...,1{ qs∈ , and
setting ifσ = s.
Depending on whether the rate of perturbation r is less than or greater than the time scale
on which the homophily and influence dynamics operate, the system will either be
slightly perturbed on a regular basis (small noise rate), or the system will be constantly
flooded with noise (large noise rate) and unable to reach any kind of equilibrium. In fixed
networks, there is a critical value of the noise rate rc above which noise dominates the
behavior of the system (Klemm et al. 2003a). We are here interested in the small noise
rate limit (r < rc), which tests the stability of cultural diversity in the presence of cultural
drift.
As a benchmark for comparison, Figure 8 shows the effects of cultural drift in
region Ib for a fixed network and for a co-evolutionary model. For a fixed network
(Figure 8a), we observe that without cultural drift (r=0, solid line) the system stabilizes in
a multicultural state NS <<max for the whole duration of the simulation. However,
20
cultural drift (r=10-5, dashed line) drives the system towards a monocultural state, where
NS ~max (Klemm et al. 2003a, 2005). It is worth noting that this monocultural state is
not fixed, as perturbations take the system in random excursions away from, and then
back to, any of the qF equivalent monocultural states. As a new trait percolates through
the network, the size of the largest cultural group drops as more people adopt the new
trait. However, as even more people adopt the trait, the size of the largest group
increases again until cultural uniformity is restored. For a co-evolving network (Figure
8b) we observe that after an initial transient the system orders itself in a monocultural
state. This happens in the same time scale with noise (dashed line) and without noise
(solid line). As in the fixed network, cultural drift causes random excursions from the
final monocultural state, only to return to another one.
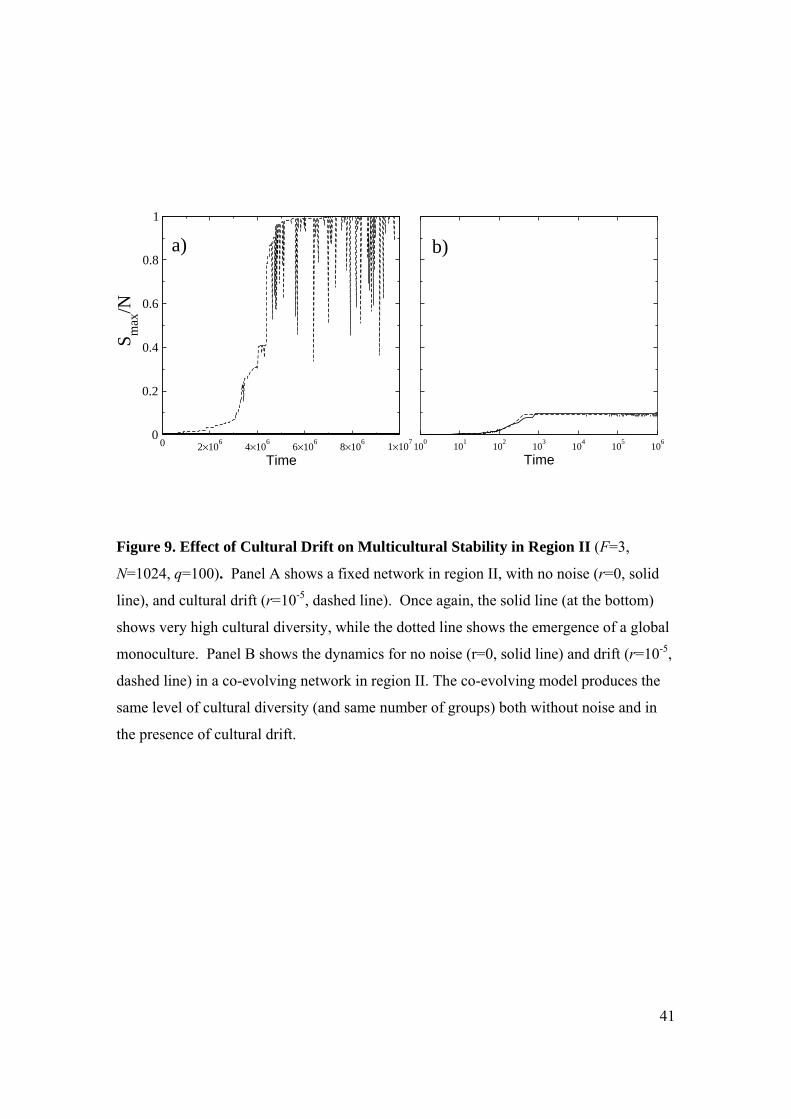
A more interesting effect is shown in Figures 9a and 9b, which corresponds to
region II. For the fixed network (Figure 9a), the results are the same as in region Ib:
without noise (solid line) the system stabilizes with high levels of heterogeneity, but with
noise (dashed line) the system reaches a homogeneous state. As before, noise-induced
excursions away from monoculture give rise to changes in the cultural make-up of the
group, but the system always returns to a monocultural state. For the co-evolving
network (Figure 9b), we observe that in the absence of cultural drift (solid line) the co-
evolution model quickly finds a stable state and then remains in that state for the rest of
the simulation. When cultural drift is added to the co-evolution model (dashed line), not
much happens. The model with noise reaches a stable state in about the same time, and
with Smax/N of about the same size, as it does without noise. Small perturbations
occasionally propagate through the groups, causing shifts in their cultural identities.
21
However, the network structure, the number of physical groups, and the composition of
the groups remains unchanged.
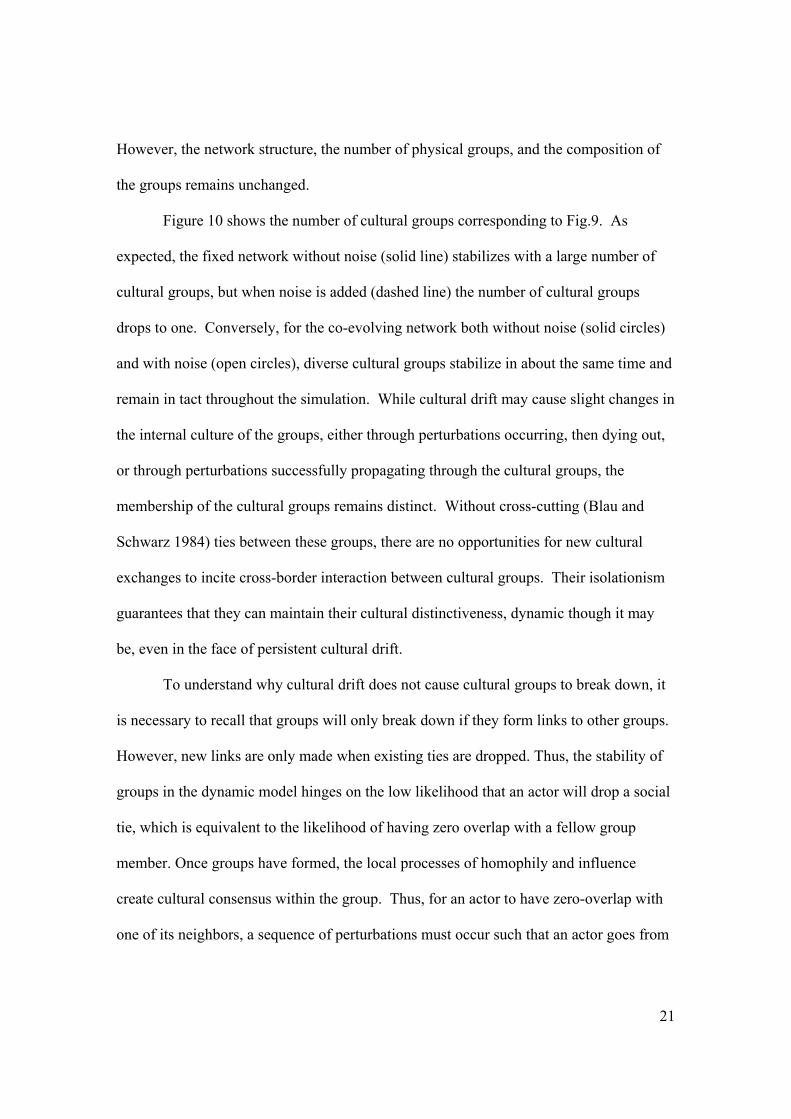
Figure 10 shows the number of cultural groups corresponding to Fig.9. As
expected, the fixed network without noise (solid line) stabilizes with a large number of
cultural groups, but when noise is added (dashed line) the number of cultural groups
drops to one. Conversely, for the co-evolving network both without noise (solid circles)
and with noise (open circles), diverse cultural groups stabilize in about the same time and
remain in tact throughout the simulation. While cultural drift may cause slight changes in
the internal culture of the groups, either through perturbations occurring, then dying out,
or through perturbations successfully propagating through the cultural groups, the
membership of the cultural groups remains distinct. Without cross-cutting (Blau and
Schwarz 1984) ties between these groups, there are no opportunities for new cultural
exchanges to incite cross-border interaction between cultural groups. Their isolationism
guarantees that they can maintain their cultural distinctiveness, dynamic though it may
be, even in the face of persistent cultural drift.
To understand why cultural drift does not cause cultural groups to break down, it
is necessary to recall that groups will only break down if they form links to other groups.
However, new links are only made when existing ties are dropped. Thus, the stability of
groups in the dynamic model hinges on the low likelihood that an actor will drop a social
tie, which is equivalent to the likelihood of having zero overlap with a fellow group
member. Once groups have formed, the local processes of homophily and influence
create cultural consensus within the group. Thus, for an actor to have zero-overlap with
one of its neighbors, a sequence of perturbations must occur such that an actor goes from

22
complete overlap to zero overlap. A lone perturbation on one feature will leave the
altered actor with a very high level of similarity with its neighbors. Thus, a single
perturbation will result in either the new cultural feature reverting to its original state (if
the altered actor is influence by its neighbor), or the new cultural feature being adopted
by a neighbor (if the altered actor influences its neighbor). In both cases, the dynamics of
homophily and influence guarantee that the local group will achieve cultural consensus
on the newly introduced feature, either through its elimination or its adoption.
In order for similarity between neighbors to decline, an actor with a new cultural
feature must keep the cultural feature without it either being adopted or eliminated, while
a second perturbation occurs, either to the originally altered actor or to one of its
neighbors. This second perturbation must occur on a separate cultural feature, and must
lessen the overlap between the two neighbors. Once again, no influence can take place,
otherwise their similarity will increase, leading toward the absorption or elimination of
the new traits. This sequence of perturbations must occur, without interruption by the
processes of local influence, F times in order for two culturally identical neighbors to
develop zero overlap. The probability of this occurring is roughly 1/NF, or the chance that
a single agent will be perturbed F times in a row on a different feature each time. The
probability is even lower if we consider that none of these perturbations can match any of
the neighbors’ current traits. For the systems we have been studying (N=104) with F=10,
the chances of such an event are less than one in 1040. Furthermore, for the noise levels
used here and elsewhere (Klemm et al. 2003a, 2005) to represent cultural drift, the model
dynamics operate at a much faster timescale than do the perturbations (on average, all
actors are activated ten times between each global perturbation), making the probability
23
that such a sequence of perturbations could occur before homophily and influence
dynamics would recover cultural consensus infinitesimally small. Thus, at least during
time scales that are quite large as compared with the timescale of cultural convergence
(approximately 103), multicultural states in co-evolutionary systems are robust against
cultural drift.
Discussion
In many respects, social and cultural trends toward broad cultural integration are
increasing (Greig 2002, Brady et al. 2007). Communication technologies, such as phone,
fax machine, and now email, make rapid exchange of ideas and information easy across
great distances (Rogers 1971, 1995). Similarly, cultural influences are now regularly
shared on a global scale, as international travel, tourism, and education make the world
smaller, and invite the exchange of cultural traits (McNeill 1988, Foster 1991, Elkins
1997). These trends in the “globalization” of culture have been furthered by the advent
of the Internet (Blossfeld et al. 2005, Brady et al. 2007), which provides near
instantaneous access to people and ideas world-wide. However, surprisingly, the Internet
may also be one of the most profound contemporary arenas for understanding the
processes of cultural differentiation.
Recent studies of the behavior of participants in on-line communities suggest that
group formation processes, and the emergence of friendship “cliques,” in on-line
environments may exhibit the same co-evolutionary dynamics as those found in our
model. Backstrom et al. (2006) found that interactions in the dynamic social networks of
on-line communities produced distinct social groups with densely-knit “strong ties”
24
(Granovetter 1973) within social clusters. These emergent groups serve both to reinforce
the existence of social ties within clusters, and to maintain group identity and shared
practices. These findings are particularly salient to our results because the Backstrom et
al. study is one of the few studies of social interaction in which the dynamics of adding
and dropping ties has been closely observed in the formation of communities. Their
results suggest not only that distinct cultural clusters emerge through endogenous
interaction, but that these groups are highly stable – once social clusters form, cross-
cutting ties are unlikely to cause them break down.
While the Backstrom et al. study provides support for our model of the co-
evolution of social groups, it is worth noting that the world of online communities does
not resemble the end state of our model (shown in Figure 3d), in which the network is
composed entirely of disconnected clusters. Rather, on-line communities more closely
resemble the social structure shown in Figure 3c, in which there is a strong bias toward
the clustered community “cores,” but with many overlapping memberships. This pattern
of self-organized social clustering suggests that these communities may well represent an
intermediate stage of the co-evolutionary dynamics found in our model.
Remarkably, these results suggest that even given the unlimited social space for
cultural exchange available in the on-line world, most people tend to restrict their
interactions to memberships in highly clustered, highly similar social groups. This trend
in on-line populations suggests that even in the virtual world of Internet communities,
network homophily governs the dynamics of cultural co-evolution: people have a
preference for interacting with others who share similar traits and practices (Homans
25
1962, McPherson et al 2001), which naturally diversifies the social world into emergent
social clusters.
Our results reveal an optimistic implication of these preliminary findings from on-
line communities: despite the growing technological trends toward increased connectivity
and globalization, social diversity can be maintained even in highly connected
environments. For thousands of years of human history, the emergence and maintenance
of group boundaries has sustained the diversity of cultural practices across different
populations (Barth 1998 [1969], Durkheim 2001 [1912], Boyd and Richerson 2005). In
modern on-line communities, similar patterns of diversification emerge, and for a similar
reason: the homophily principle actively constrains the communities to which we belong,
and the people with whom we choose to interact, share ideas, and adopt our patterns of
life (Popielarz and McPherson 1995, McPherson et al. 2001). The results from our model
show that through the dynamics of network co-evolution, these patterns of preferential
interaction of like with like produce cultural pockets whose identity and ideas, though
flexible, are nonetheless stable from dissolution into a homogeneous global culture.
While trends toward globalization provide more means of contact between more people,
these same venues for interaction (e.g., the Internet) also demonstrate the strong tendency
of people to self-organize into culturally defined groups, which can ultimately help to
preserve overall diversity.
Conclusion
Our study of cultural differentiation introduces network homophily into the dynamics of
cultural interaction. This co-evolutionary model formalizes the idea that patterns of social

26
interaction change with processes of social influence. The co-evolution of network
structure and cultural traits reveals a complex relationship between heterogeneity and the
emergence of diverse cultural groups, indicating four qualitatively distinct regions of the
parameter space. In region Ia, a large component of the network remains connected, and
both fixed and co-evolutionary dynamics lead to a dominant monocultural state in the
presence of noise. In region Ib, culturally diverse groups can form in the fixed network,
but they are unstable, and quickly collapse back into global monoculture in the presence
of cultural drift. However, in region II cultural groups can form in the dynamic network,
and these groups are stable even in the presence of continuous stochastic shocks.
Consistent with the results of Popielarz and McPherson (1995), in region II the
interaction of homophily and influence produces a niche structure whereby peripheral
members are either absorbed into the core beliefs of the social group (by influence), or
are forced out of the social group (by zero overlap). It is significant, however, that these
social niches are not produced through competition or selection pressure (cf. Popielarz
and McPherson 1995), but through the mechanisms of homophily and influence in a co-
evolutionary process. Thus, even in the absence of selection pressures, a population can
self-organize into stable social niches that define its diverse cultural possibilities.
These dynamics of group formation resemble those found in many areas of social
life (McPherson et al. 2001), including on-line communities. Our results show that the
co-evolutionary dynamics that form these communities also make them robust to the
forces of cultural drift, helping to ensure the long term stability of cultural diversity even
in highly networked environments.
27
We also found that as heterogeneity increases, q approaches the threshold at
which it enters region III. These very high levels of heterogeneity are empirically
unrealistic in most cases, however they warn of a danger that comes with increasing
options for social and cultural differentiation, particularly when the population is small,
or there is modest cultural complexity. Unlike cultural drift, which causes cultural groups
to disappear through growing cultural consensus, a sudden flood of cultural options can
also cause cultural groups to disappear; but instead of being due to too few options
limiting diversity, it is due to excessive cultural options creating the emergence of highly
idiosyncratic individuals who cannot form group identifications or long term social ties.
References
Axelrod, R. 1997. “The Dissemination of Culture: A Model with Local Convergence
and Global Polarization.” Journal of Conflict Resolution. 41: 203-226.
Backstrom, L., D. Huttenlocher, X. Lan, and J. Kleinberg. 2006. “Group Formation in
Large Social Networks: Membership, Growth, and Evolution.” In Proceedings of
the 12th ACM SIGKDD International Conference on Knowledge Discovery in Data.
Aug. 20-23. Philadelphia.
Barth, Fredrik. 1969. Ethnic and Group Boundaries (Long Grove, Ill: Waveland Press
reprint: 1998)

28
Blau, P. M., and J. E. Schwartz. 1984. Crossing Social Circles. Orlando: Academic
Press.
Blossfeld HP, Klijzing E, Mills M, Kurz K. 2005. Globalization, Uncertainty and
Youth in Society. New York: Routledge.
Bourdieu, Pierre. 1984. Distinction. Cambridge, Mass: Harvard Univ. Press.
Boyd, Robert and Peter J. Richerson 2005. The Origin and Evolution of Cultures.
New York: Oxford Univ. Press.
Brady, David, Jason Beckfield, and Wei Zhao. 2007. “The Consequences of Economic
Globalization for Affluent Democracies.” Annual Review of Sociology. 33: 15.1-
15.22.
Castellano Claudio, M. Marsilli and A. Vespignani. 2000. “Nonequilibrium Phase
Transition in a Model for Social Influence” Phys. Rev. Lett. 85, 3536–3539.
Centola, Damon, Robb Willer, and Michael W. Macy. 2005. “The Emperor’s Dilemma:
A Computational Model of Self-Enforcing Norms.” American Journal of Sociology.
110(4):1009-40.
Cohen, J. 1977. “Sources of Peer Group Homogeneity.” Sociology of Education.
50:227-41.
Duncan, O.D, A.O. Haller and A. Portes. 1968. “Peer Influences on Aspirations: A
Reinterpretation.” American Journal of Sociology. 74:119–37.
Durkheim, E. 1897. Suicide (New York: The Free Press reprint: 1997)
Durkheim, E. 1912. The Elementary Forms of Religious Life. (New York: Oxford
Univ. Press reprint: 2001)
29
Durrett, R. and S. A. Levin. 2005. “Can Stable Social Groups Be Maintained by
Homophilous Imitation Alone?” Journal of Economic Behavior and Organization.
57(3): 267-286.
Eguíluz Victor M., Martín G Zimmermann, Camilo J Cela-Conde, Maxi San Miguel.
2005. “Cooperation and Emergence of Role Differentiation in the Dynamics of
Social Networks.” American Journal of Sociology 110, 977-1008
Elkins, David. 1997. “Globalization, Telecommunications, and Virtual Ethnic
Communities.” International Political Science Review. 18: 139-52.
Fischer CS. 1977. Networks and Places: Social Relations in the Urban Setting. New
York: Free Press.
Foster, Robert. 1991. “Making National Cultures in the Global Ecumene.” Annual
Review of Anthropology. 20:235-60.
González-Avella J.C., Cosenza M., Klemm K., Eguíluz V.M. and San Miguel M.
(2007), “Information feedback and mass media effects in cultural dynamics”.
Journal of Artificial Societies and Social Simulation,
http://jasss.soc.surrey.ac.uk/2007/6/2.html.
Granovetter, M. 1973. “The Strength of Weak Ties.” American Journal of Sociology
78: 1360-80.
Greig, J.M. 2002. “The End of Geography?: Globalization, Communications, and
Culture in the International System.” Journal of Conflict Resolution. 46: 225-243
Heckathorn, Doug. 1996. “Dynamics and Dilemmas of Collective Action.” American
Sociological Review 61:250–77.
Homans, George C. 1962. Sentiments and Activities. New York: The Free Press.
30
Huston, T.L. and G. Levinger. 1978. “Interpersonal Attraction and Relationships.”
Annu. Rev. Psychol. 29:115–56
Kennedy, J. 1998. “Thinking is Social: Experiments with the Adaptive Culture
Model.” Journal of Conflict Resolution. 42: 56-76
Klemm, K., V.M. Eguíluz, R. Toral, and M. San Miguel. 2003a. “Global Culture: A
Noise Induced Transition in Finite Systems.” Physical Review E. 67, 045101 R.
Klemm, K., V.M. Eguíluz, R. Toral, and M. San Miguel. 2003b. “Nonequilibrium
Transitions in Complex Networks: A Model of Social Interaction.” Physical Review
E 67, 026120.
Klemm, K., V.M. Eguíluz, R. Toral, and M. San Miguel. 2003c. “Role of
Dimensionality in Axelrod´s Model for the Dissemination of Culture.” Physica A
327, 1-5.
Klemm, K., V.M. Eguíluz, R. Toral, and M. San Miguel. 2005. “Globalization,
Polarization and Cultural Drift.” J. Economic Dynamics and Control 29, 321-334.
Knoke, D. 1990. Political Networks: The Structural Perspective. New York,
Cambridge University Press.
Lazarsfeld,P. and R. K. Merton. 1954. “Friendship as a Social Process: A Substantive
and Methodological Analysis,” in Freedom and Control in Modern Society, Morroe
Berger, Theodore Abel, and Charles H. Page, eds. New York: Van Nostrand, 18-66.
Latane, Bib. 2000. “Pressure to Uniformity and the Evolution of Cultural Norms:
Modeling Dynamics of Social Impact,” In Computational Modeling of Behavior in
Organizations. Hulin and D. Illgen (eds). Washington, D.C, pp.189-215.
31
Lazer, D. 2001. The Co-Evolution of Individual and Network. J. Math. Sociology, 25,
69-108.
Macy, M.W. 1991. “Learning to Cooperate: Stochastic and Tacit Collusion in Social
Exchange.” American Journal of Sociology. 97:808-843.
Macy, M.W., James Kitts, Andreas Flache, and Steve Benard. 2003. “Polarization in
Dynamic Networks: A Hopfield Model of Emergent Structure,” in Dynamic Social
Network Modeling and Analysis, National Academy Press.
Mark, N. 1998. “Beyond Individual Differences: Social Differentiation from First
Principles. American Sociological Review. 63, 3.
Mark, N. 2003. “Culture and Competition: Homophily and Distancing Explanations for
Cultural Niches.” American Sociological Review. 68, 3.
Marsden, P.V. 1987. “Core Discussion Networks of Americans.” American
Sociological Review. 52:122–313.
Marsden, P.V. 1988. “Homogeneity in Confiding Relations.” Social Networks 10:57–
76.
McNeill, William. 1988. “Diffusion in History.” In The Transfer and Transformation
of Ideas and Material Culture, Peter J. Hugill and D. Bruce Dickson (eds.). College
Station: Texas A&M Press.
McPherson, JM, P. Popielarz, and S. Drobnic. 1992. “Social Networks and
Organizational Dynamics. American Sociological Review.” 57:153–70.
McPherson, J.M. and L. Smith-Lovin. 1987. “Homophily in Voluntary Organizations:
Status Distance and the Composition of Face-to-Face Groups.” American
Sociological Review. 52:370–79.
32
McPherson, J.M., L. Smith-Lovin and J. Cook. 2001. “Birds of a Feather: Homophily
in Social Networks.” Annual Review of Sociology. 27:415-44.
Popielarz, P and J.M. McPherson. 1995. On the Edge or in Between: Niche Position,
Niche Overlap, and the Duration of Voluntary Memberships. American Journal of
Sociology. 101:698–720.
Rogers, Everett M. 1971. Communication of Innovations: A Cross-Cultural Approach.
New York: The Free Press.
Rogers, Everett M. 1995. Diffusion of Innovations. New York: The Free Press.
Shibanai, Y, Yasuno S and Ishiguro I. 2001, “Effects of Global Information Feedback
in Diversity: Extensions to Axelrod's Adaptative Culture Model”. Journal of
Conflict Resolution. 45:80-96.
Shrum W., N.H. Cheek, Jr., S.M. Hunter. 1988. “Friendship in School: Gender and
Racial Homophily.” Sociology of Education. 61:227–39.
Verbrugge. L.M. 1977. “The Structure of Adult Friendship Choices.” Social Forces.
62: 78-83.
Weeden, Kim A. and David B. Grusky. 2005. "The Case for a New Class Map."
American Journal of Sociology 111(1):141-212.

33
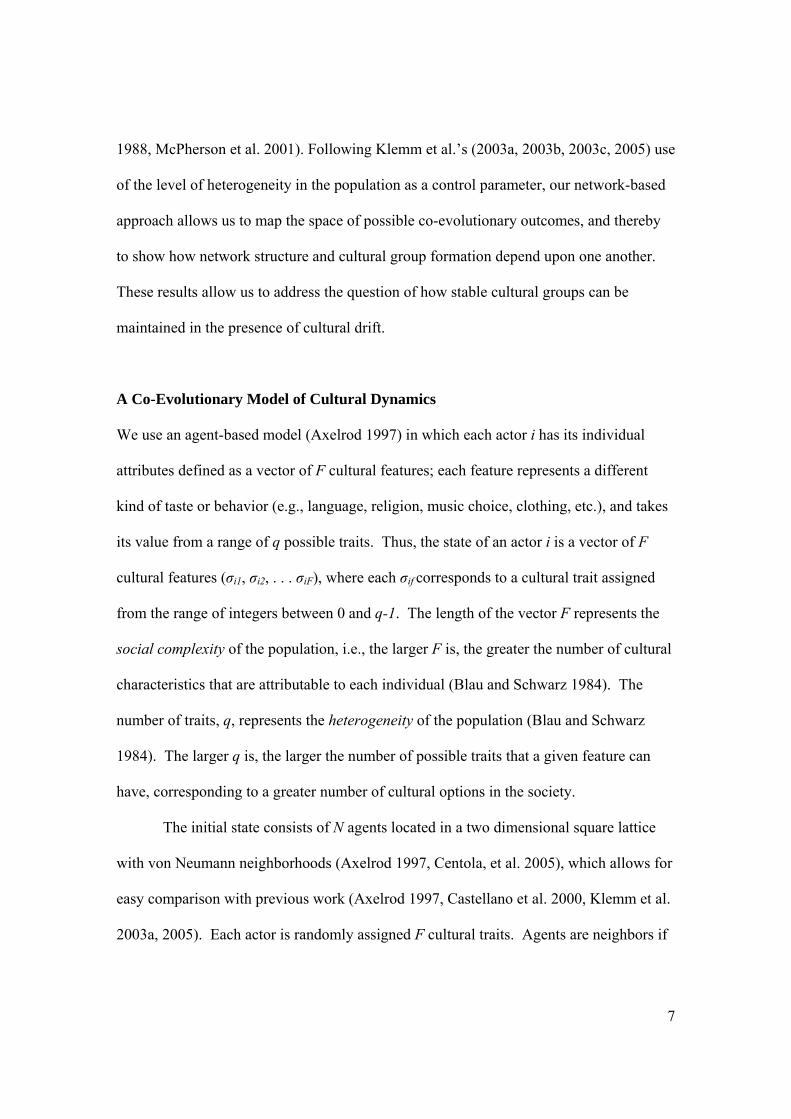
Fig.1 Dynamic networks. Illustrates network dynamics for a system with F=3 and q=7.
The network on the left (at time t) shows each node with its corresponding vector of
cultural features at time t. The network on the right shows the same population at time
t+1. The links between nodes are weighted according to their overlap: dashed line for
zero overlap, continuous lines for overlap = 1, and double line for overlap = 2. At time t,
the overlap between nodes 1 and 2, O(1,2), is zero, as is O(1,3). At time t, node 1 has
been selected as active and node 3 as its partner (rule 1). Rules 2-4 imply no changes of
state given that O(1,3)=0. Following rule 5, the link between 1 and 3 is removed and
node 1 is linked randomly to a different node. The new link between nodes1 and 6
(shown in the network on the right) has overlap O(1,6)=1.
34
101
102
103
104
105
106
q0
0.2
0.4
0.6
0.8
1
<S m
ax>
/N
100
101
102
103
q0
0.2
0.4
0.6
0.8
1
<S m
ax>
/N
III-bI-a III
Figure 2. Comparison of Fixed and Co-Evolving Dynamics. (F=10, N=104) For fixed
networks (dotted lines, square symbols), the transition to multiculturalism happens for a
much lower value of q (qc ~ 60), than for the co-evolving network (solid line, circular
symbols), where the transition happens around qc ~ 1000. The inset shows that this
difference is present, but less pronounced for F=3, N=1024 (qc ~ 15).
35
Figure 3. Co-Evolutionary Dynamics. The co-evolution of cultural traits and physical
groups in the co-evolving model for N=400, F=3 and q=20. Snapshots of the network are
shown at times a) t=0, b) t=2,500, c) t=25,000, d) t=500,000.
36
100
101
102
103
104
105
q0
0.2
0.4
0.6
0.8
1
Siz
e of
Max
imun
Com
pone
nt /N
100
101
102
103
104
q
0
0.2
0.4
0.6
0.8
1
Siz
e of
Max
imun
Com
pone
nt /
N
I-a I-b II III
Figure 4: Size of Largest Component in the Co-Evolutionary Network. (F=10,
N=104) Change in the average size of the largest network component (physical group) is
shown for increasing values of q. In regions Ia and Ib, <Smax>/N remains constant, while
in region II it decreases dramatically. In region III (q > q* ~ 2 x 10⁴), this trend
qualitatively reverses, producing a steep increases in the size of the largest component.
The inset show similar dynamics for F=3 and N=1024 (q* ~ 7 x 10²).
37
100
101
102
103
104
105
q0
1000
2000
3000
4000
5000
6000
7000
Num
ber
of G
roup
s
101
102
103
104
q0
200
400
600
800
1000
Num
ber
of G
roup
s
I-a I-b II III
Figure 5. Average Number of Cultural and Physical Groups. (F=10, N=104) The
number of cultural groups (circular symbols) and physical groups (square symbols) are
identical with one another in regions I and II. In region III, cultural and physical groups
become decoupled, as the number of cultural groups keeps increasing, while the number
of physical groups sharply declines. The inset shows the same dynamics for F=3 and
N=1024.
38
100
101
102
103
104
100
101
102
103
104
100
101
102
103
104
100
101
102
103
104
100
101
102
103
104
100
101
102
103
104
105
9700 9800 9900 100000
5
10
15
20
P(s
)
s
a) b) c)
Figure 6. Distribution of the Sizes of Physical Groups. (F=10, N=104) The x-axis
shows the group size S, and the y-axis shows the number of occurrences of groups of size
S, P(S). In Panels A) q=900 (region I), B) q=3000 (region II), and C) q=5000 (region II),
the points represent the number of occurrences of groups of size S over 500 realizations
of the model. In Panel A, the group of points on the right (S~104) indicate that there is
always a dominant cultural group that contains most of the population (The inset shows
that across realizations of the model, the largest group ranges in size from S=9800 to
S=104). Panel C shows that there are no groups with S>103, and the majority of the
population is located in groups ranging from 10 to 103 members. Panel B indicates there
is a power law decay P(s)~s-α with α∼1.44 (the solid line is plotted as reference) of group
sizes, which indicates that there is no characteristic group size for the population.
39
100
101
102
103
104
105
Time
0
2000
4000
6000
8000
10000
Num
ber
of G
ropu
s
100
101
102
103
104
105
Time
0
500
1000
Num
ber
of G
roup
s
Figure 7. Average Number of Groups As a Function of Time. (F=10, N=104) For
q<q* (q=104 empty symbols), the number of cultural groups (empty square symbols), and
the number of physical groups (empty circular symbols) converge after approximately
2x10⁴ time steps. For q>q* (q=105 solid symbols), cultural groups (solid square
symbols) and physical groups (solid circular symbols) never converge. The inset shows
the same dynamics for F=3 and N=1024. (q=500 for empty symbols and q=6000 for
solid symbols).

40
0 2×10⁵
4×10⁵
6×10⁵
8×10⁵
1×10⁶
Time
0
0.2
0.4
0.6
0.8
1
Sm
ax/N
100
102
104
106
Time
a) b)
Figure 8. Effect of Cultural Drift on Multicultural Stability in Region Ib (F=3,
N=1024, q=20). Panel A shows a fixed network in region Ib, with no noise (r=0, solid
line), and cultural drift (r=10-5, dashed line). The solid line (at the bottom) shows very
high cultural diversity, while the dotted line shows the emergence of a global
monoculture. Panel B shows the dynamics for no noise (r=0, solid line) and drift (r=10-5,
dashed line) in a co-evolving network in region Ib, where there is insufficient
heterogeneity to produce cultural diversity.
41
0 2×10⁶
4×10⁶
6×10⁶
8×10⁶
1×10⁷
Time
0
0.2
0.4
0.6
0.8
1
Sm
ax/N
100
101
102
103
104
105
106
Time
a) b)
Figure 9. Effect of Cultural Drift on Multicultural Stability in Region II (F=3,
N=1024, q=100). Panel A shows a fixed network in region II, with no noise (r=0, solid
line), and cultural drift (r=10-5, dashed line). Once again, the solid line (at the bottom)
shows very high cultural diversity, while the dotted line shows the emergence of a global
monoculture. Panel B shows the dynamics for no noise (r=0, solid line) and drift (r=10-5,
dashed line) in a co-evolving network in region II. The co-evolving model produces the
same level of cultural diversity (and same number of groups) both without noise and in
the presence of cultural drift.
42
100
101
102
103
104
105
106
107
Time
0
100
200
300
400
500
600
700
800
900
1000
Num
ber
of c
ultu
ral g
roup
s Fixed NetworkWithout DriftWith Drift
Fixed Network
Co-evolving ModelWithout Drift
With DriftCo-evolving Model
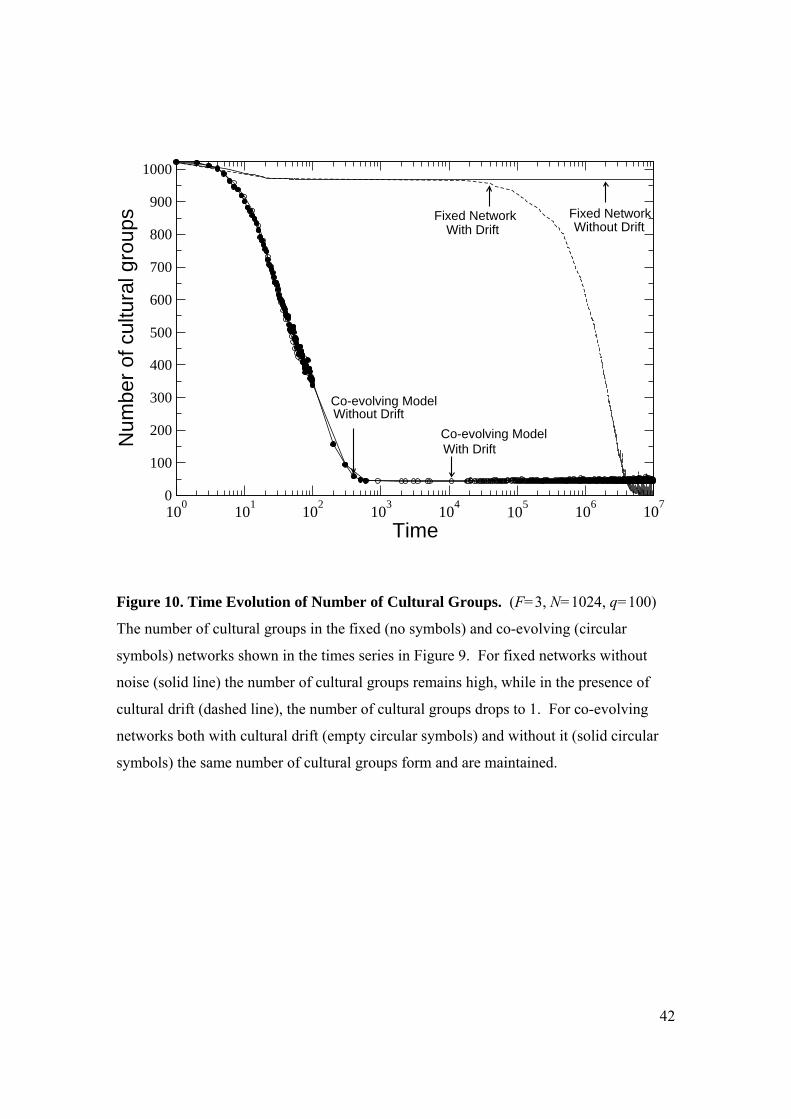
Figure 10. Time Evolution of Number of Cultural Groups. (F=3, N=1024, q=100)
The number of cultural groups in the fixed (no symbols) and co-evolving (circular
symbols) networks shown in the times series in Figure 9. For fixed networks without
noise (solid line) the number of cultural groups remains high, while in the presence of
cultural drift (dashed line), the number of cultural groups drops to 1. For co-evolving
networks both with cultural drift (empty circular symbols) and without it (solid circular
symbols) the same number of cultural groups form and are maintained.
43
Endnotes
1 Kennedy (1998) finds a similar result when homophily is eliminated from the cultural diffusion model. He shows that when interactions are not constrained by homophily, social influence dynamics leads to a homogenous state with a single global culture. What is more surprising is that even with homophily cultural drift will inevitably drive the system to a global monoculture. 2 Klemm et al. (2003a, 2005) also found that if noise acts at high rates, it overwhelms the dynamics of the model and leads to a state in which distinct cultural regions never form. In this “disordered noise regime” cultural diversity persists, but only as a random pattern of continuously changing traits. 3Averages reported throughout the paper are ensemble averages over 100 realizations with different random initial conditions. 4 The critical value qc is determined as the value of q for which the fluctuations in the ensemble values of Smax is maximum. 5 Figure 2 shows results for F=10 (Klemm et al. 2003a, 2003b, 2003c) and F=3. Results are qualitatively similar, but the transition for F=3 in a co-evolving network occurs for lower values of q. 6 More technical analyses of the transition between region I and region II were performed using methods from the theory of phase transitions; however they provided little additional insight beyond the present analysis.
Top Related