


Languages
Pages
Legal

Holt McDougal Algebra 1
3-4 Graphing Functions
Graph functions given a limited domain.
Graph functions given a domain of all real numbers.
Objectives
Holt McDougal Algebra 1
3-4 Graphing Functions
Scientists can use a function to make conclusions about the rising sea level.
Sea level is rising at an approximate rate of 2.5 millimeters per year. If this rate continues, the function y = 2.5x can describe how many millimeters y sea level will rise in the next x years.
One way to understand functions such as the one above is to graph them. You can graph a function by finding ordered pairs that satisfy the function.
Holt McDougal Algebra 1
3-4 Graphing Functions
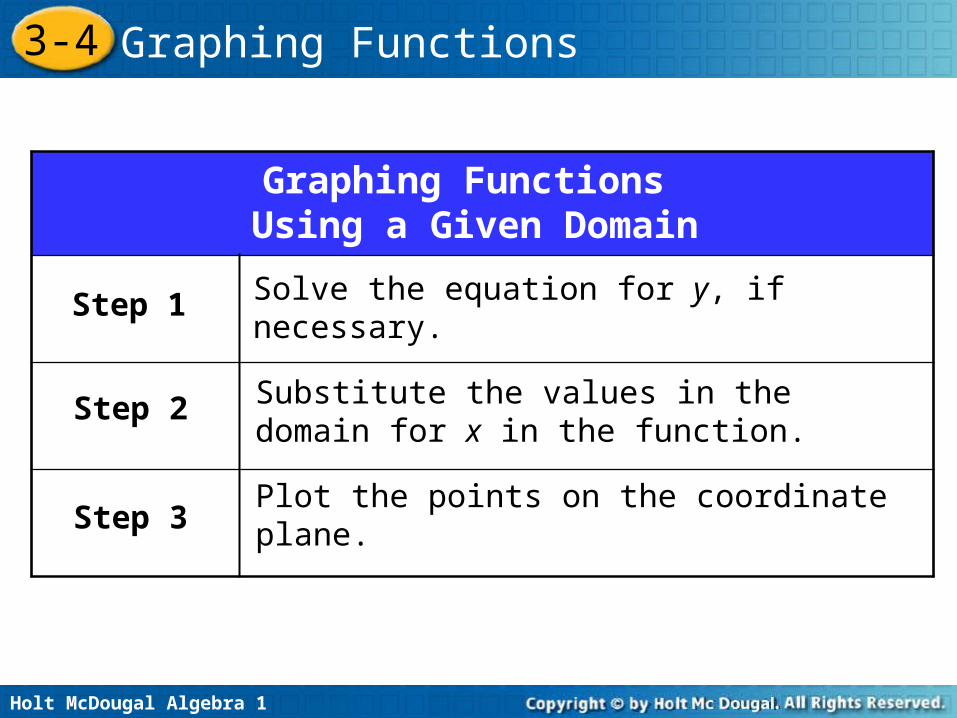
Graphing Functions Using a Given Domain
Step 1 Solve the equation for y, if necessary.
Step 2
Step 3
Substitute the values in the domain for x in the function.
Plot the points on the coordinate plane.
Holt McDougal Algebra 1
3-4 Graphing Functions
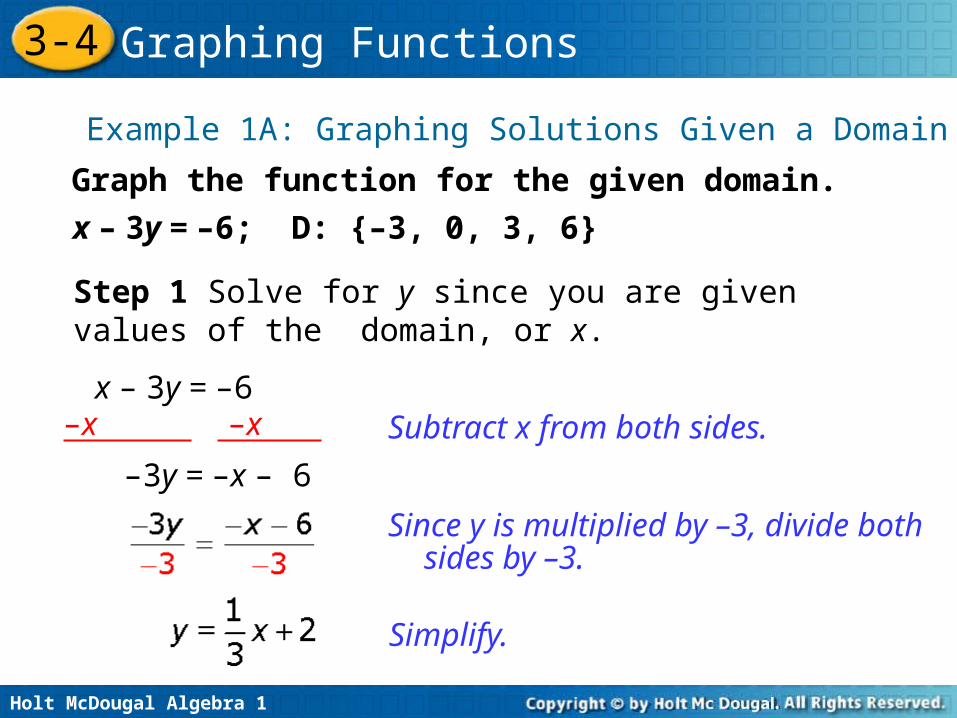
Example 1A: Graphing Solutions Given a Domain
Graph the function for the given domain.
x – 3y = –6; D: {–3, 0, 3, 6}
Step 1 Solve for y since you are given values of the domain, or x.
–x –x
–3y = –x – 6
Subtract x from both sides.
Since y is multiplied by –3, divide both sides by –3.
Simplify.
x – 3y = –6
Holt McDougal Algebra 1
3-4 Graphing Functions
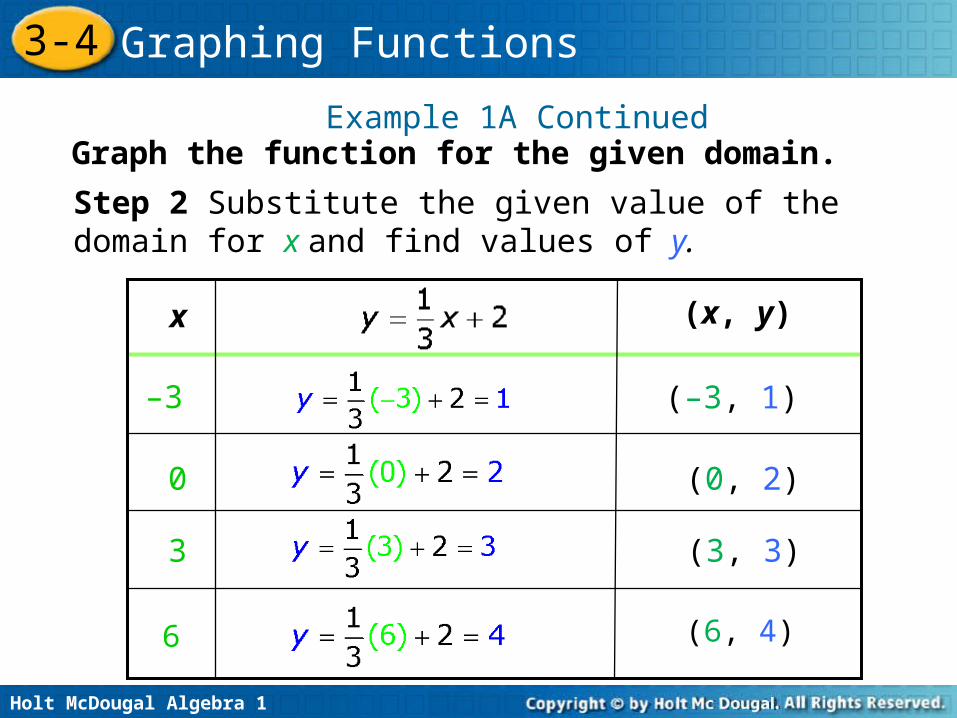
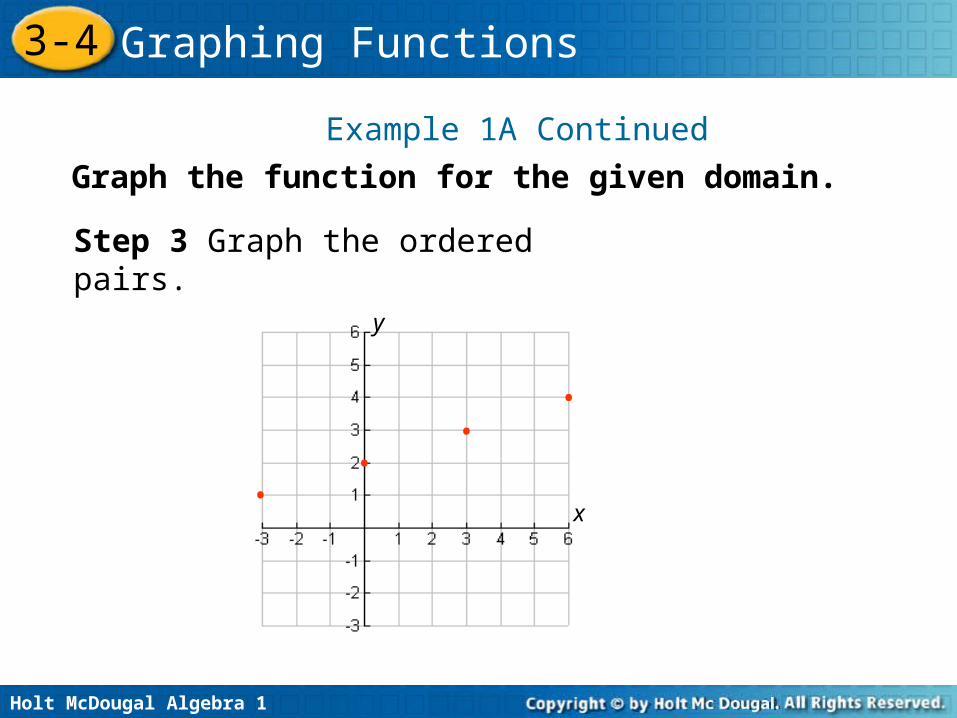
Example 1A Continued
Step 2 Substitute the given value of the domain for x and find values of y.
x (x, y)
–3 (–3, 1)
0 (0, 2)
3 (3, 3)
6 (6, 4)
Graph the function for the given domain.
Holt McDougal Algebra 1
3-4 Graphing Functions
••
••
y
x
Step 3 Graph the ordered pairs.
Example 1A Continued
Graph the function for the given domain.
Holt McDougal Algebra 1
3-4 Graphing Functions
Graph the function for the given domain.
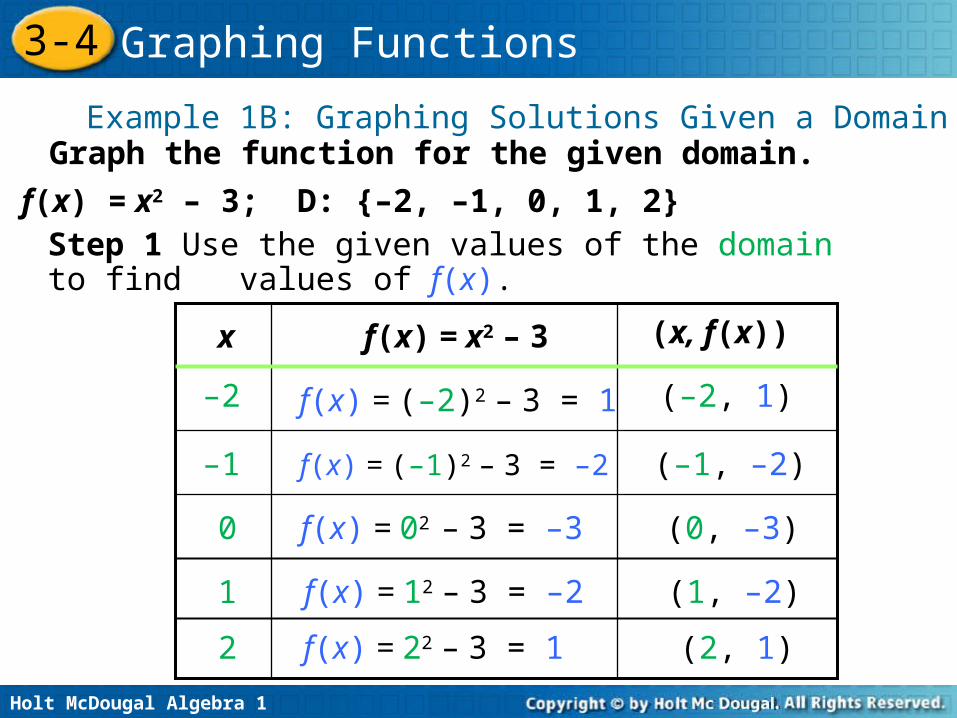
f(x) = x2 – 3; D: {–2, –1, 0, 1, 2}
Example 1B: Graphing Solutions Given a Domain
Step 1 Use the given values of the domain to find values of f(x).
f(x) = x2 – 3 (x, f(x))x
–2
–1
0
1
2
f(x) = (–2)2 – 3 = 1
f(x) = (–1)2 – 3 = –2
f(x) = 02 – 3 = –3
f(x) = 12 – 3 = –2
f(x) = 22 – 3 = 1
(–2, 1)
(–1, –2)
(0, –3)
(1, –2)
(2, 1)
Holt McDougal Algebra 1
3-4 Graphing Functions
•
•
•
•
•
y
x
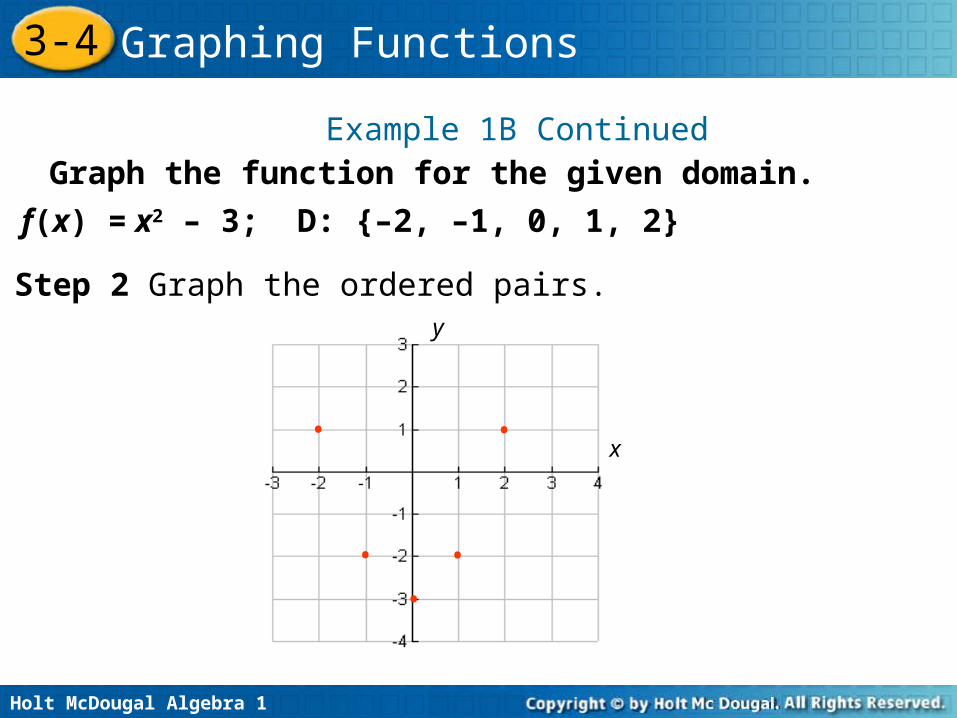
Step 2 Graph the ordered pairs.
Graph the function for the given domain.
f(x) = x2 – 3; D: {–2, –1, 0, 1, 2}
Example 1B Continued
Holt McDougal Algebra 1
3-4 Graphing Functions
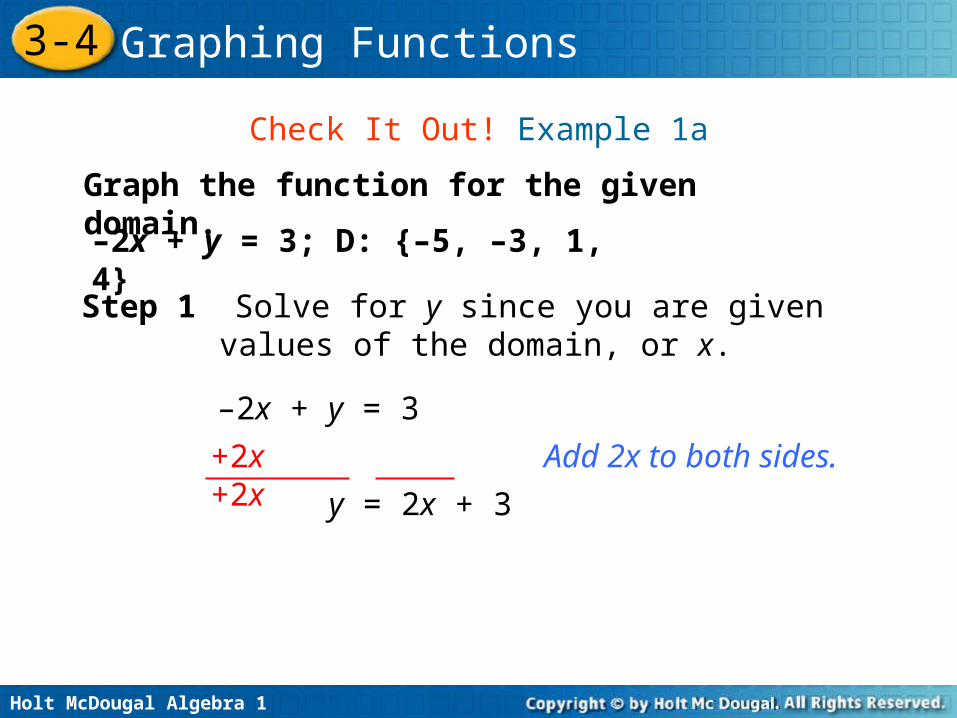
Check It Out! Example 1a
Graph the function for the given domain.
–2x + y = 3; D: {–5, –3, 1, 4}
Step 1 Solve for y since you are given values of the domain, or x.
–2x + y = 3
+2x +2x
y = 2x + 3
Add 2x to both sides.
Holt McDougal Algebra 1
3-4 Graphing Functions
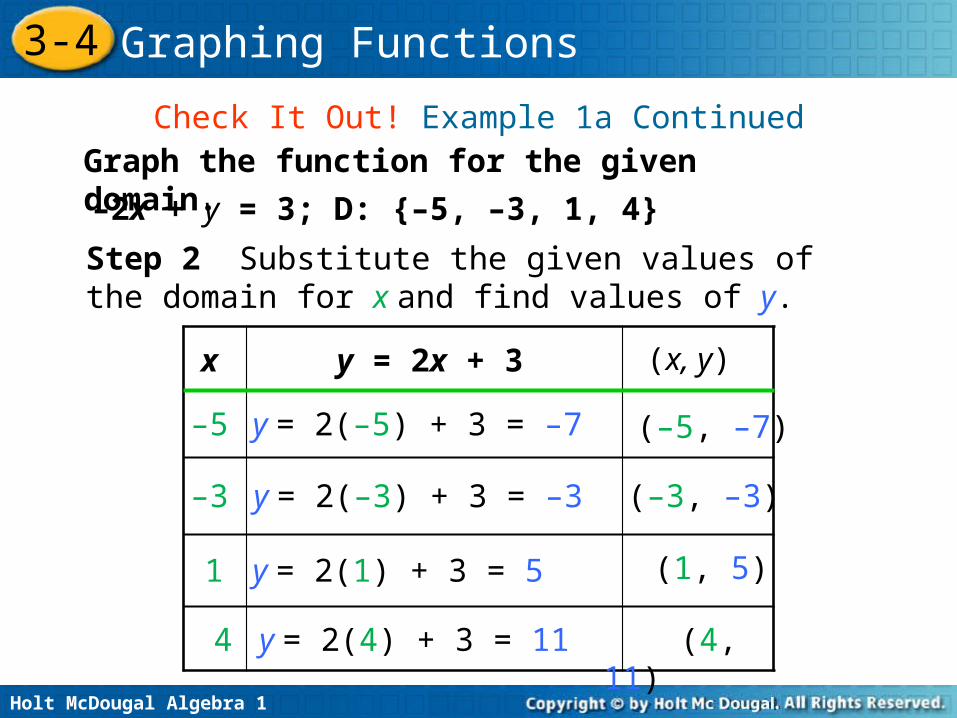
Check It Out! Example 1a ContinuedGraph the function for the given domain.
–2x + y = 3; D: {–5, –3, 1, 4}
y = 2x + 3 x (x, y)
y = 2(–5) + 3 = –7–5 (–5, –7)
y = 2(1) + 3 = 51 (1, 5)
y = 2(4) + 3 = 11 4 (4, 11)
y = 2(–3) + 3 = –3–3 (–3, –3)
Step 2 Substitute the given values of the domain for x and find values of y.
Holt McDougal Algebra 1
3-4 Graphing Functions
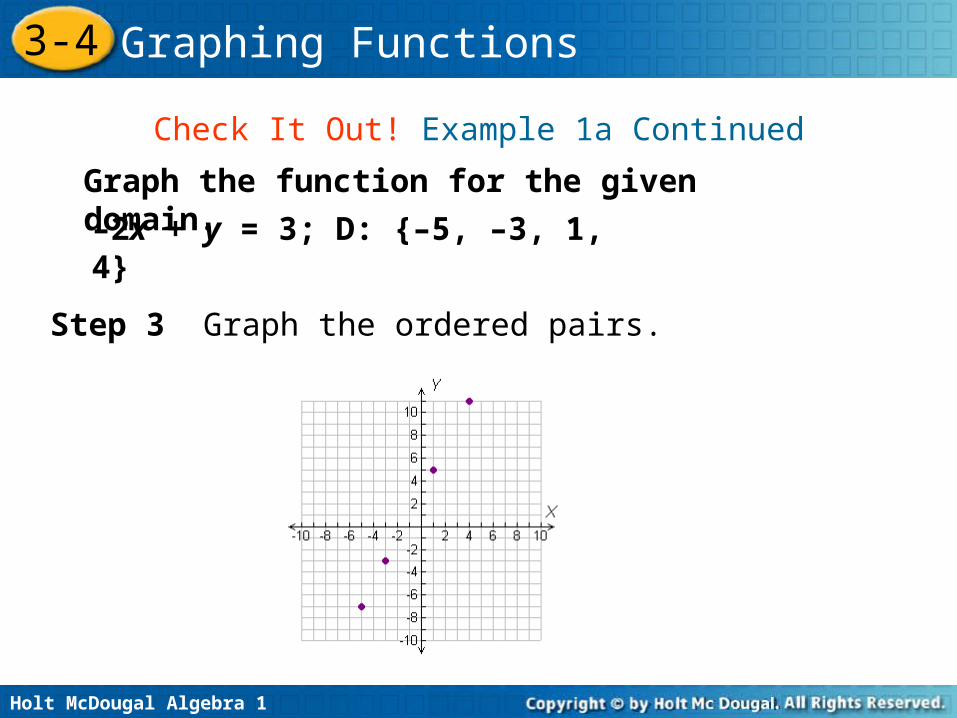
Step 3 Graph the ordered pairs.
Check It Out! Example 1a Continued
Graph the function for the given domain.
–2x + y = 3; D: {–5, –3, 1, 4}
Holt McDougal Algebra 1
3-4 Graphing Functions
Graph the function for the given domain.
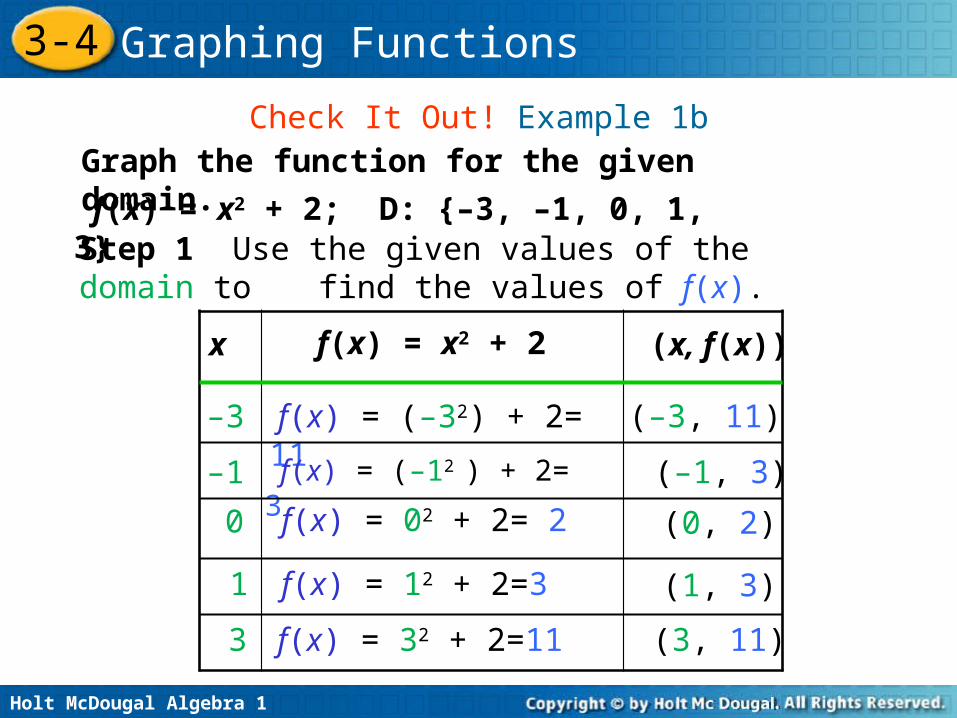
f(x) = x2 + 2; D: {–3, –1, 0, 1, 3}
f(x) = x2 + 2 x (x, f(x))
f(x) = (–32) + 2= 11–3 (–3, 11)
f(x) = 02 + 2= 20 (0, 2)
f(x) = 12 + 2=3 1 (1, 3)
Check It Out! Example 1b
f(x) = (–12 ) + 2= 3–1 (–1, 3)
3 f(x) = 32 + 2=11 (3, 11)
Step 1 Use the given values of the domain to find the values of f(x).
Holt McDougal Algebra 1
3-4 Graphing Functions
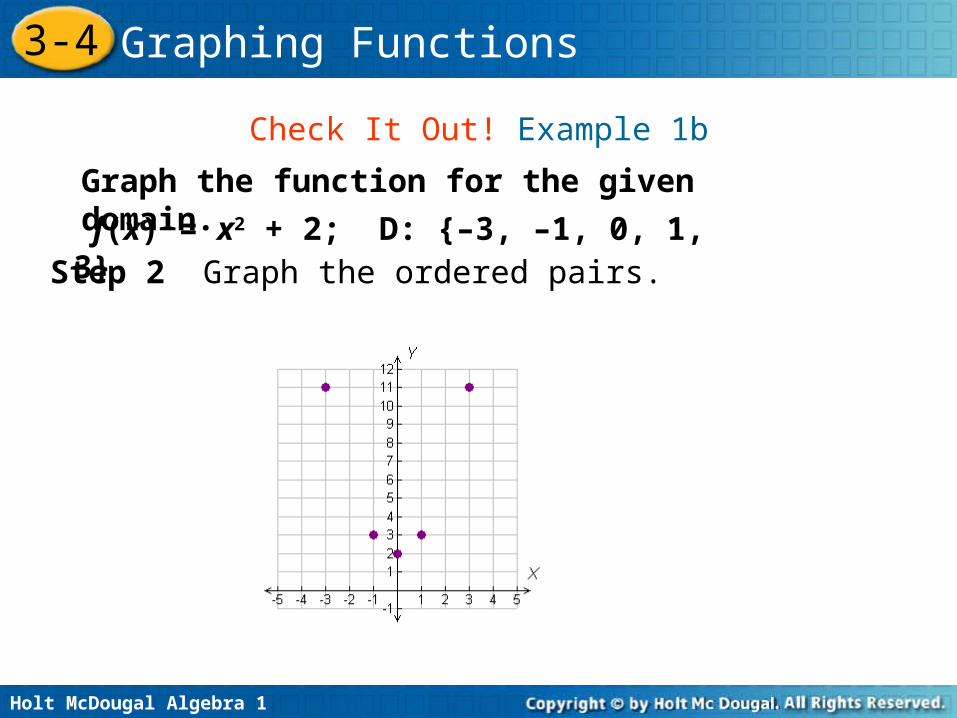
Step 2 Graph the ordered pairs.
Graph the function for the given domain.
f(x) = x2 + 2; D: {–3, –1, 0, 1, 3}
Check It Out! Example 1b
Holt McDougal Algebra 1
3-4 Graphing Functions
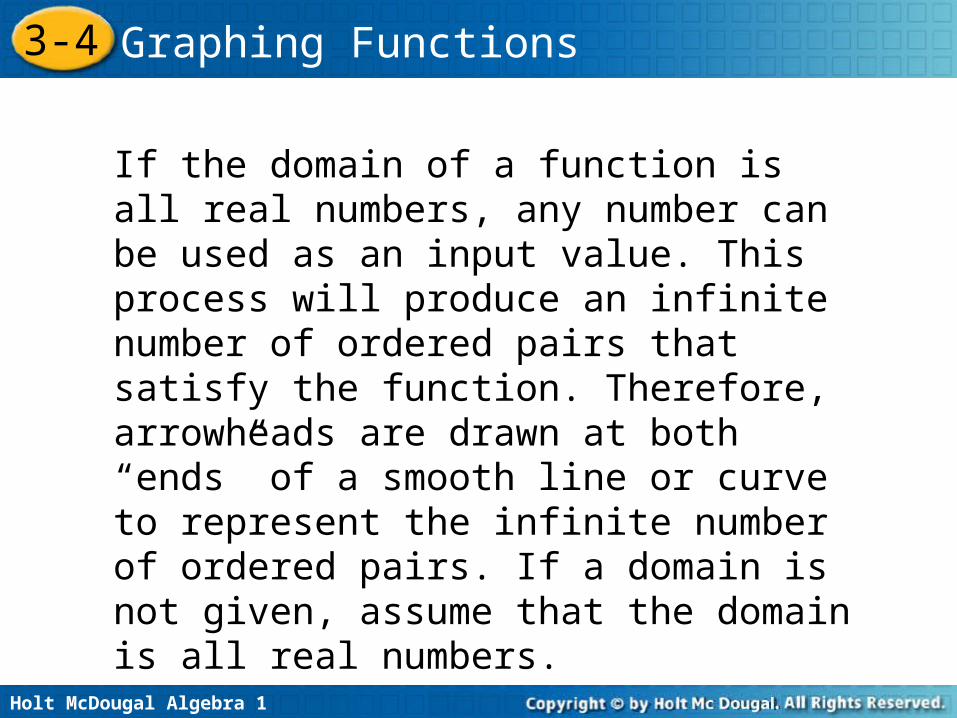
If the domain of a function is all real numbers, any number can be used as an input value. This process will produce an infinite number of ordered pairs that satisfy the function. Therefore, arrowheads are drawn at both “ends” of a smooth line or curve to represent the infinite number of ordered pairs. If a domain is not given, assume that the domain is all real numbers.
Holt McDougal Algebra 1
3-4 Graphing Functions
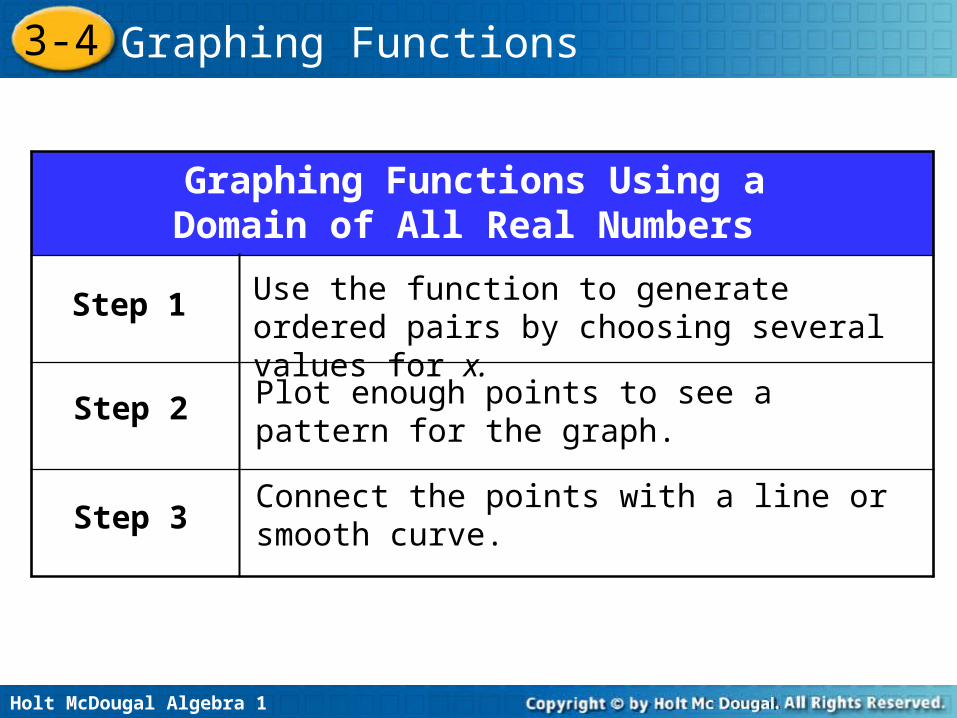
Graphing Functions Using a Domain of All Real Numbers
Step 1 Use the function to generate ordered pairs by choosing several values for x.
Step 2
Step 3
Plot enough points to see a pattern for the graph.
Connect the points with a line or smooth curve.
Holt McDougal Algebra 1
3-4 Graphing Functions
x –3x + 2 = y (x, y)
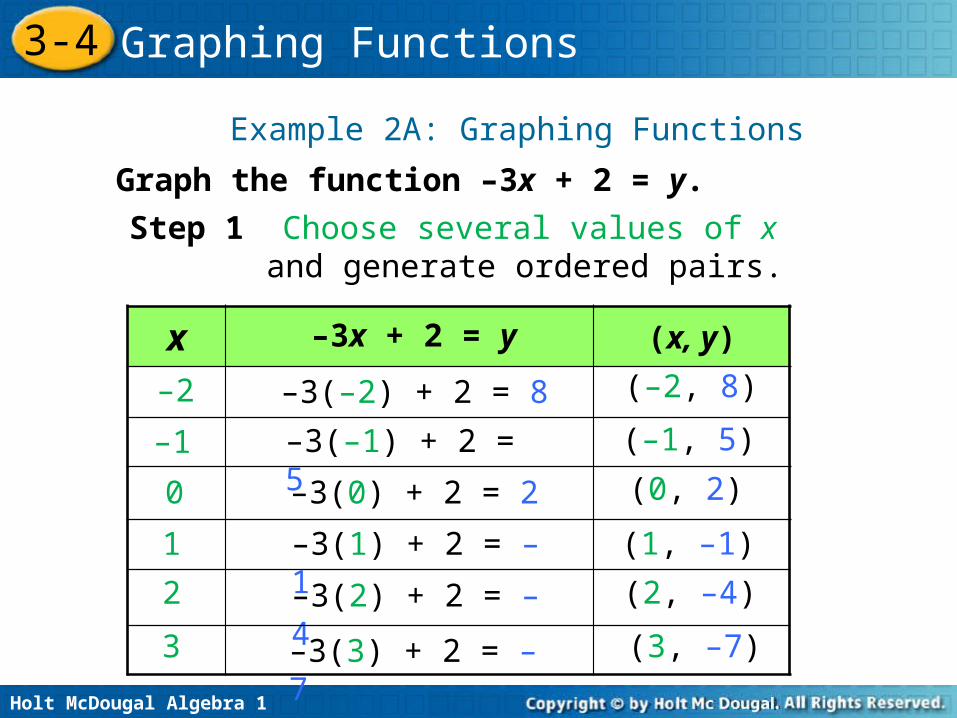
Example 2A: Graphing Functions
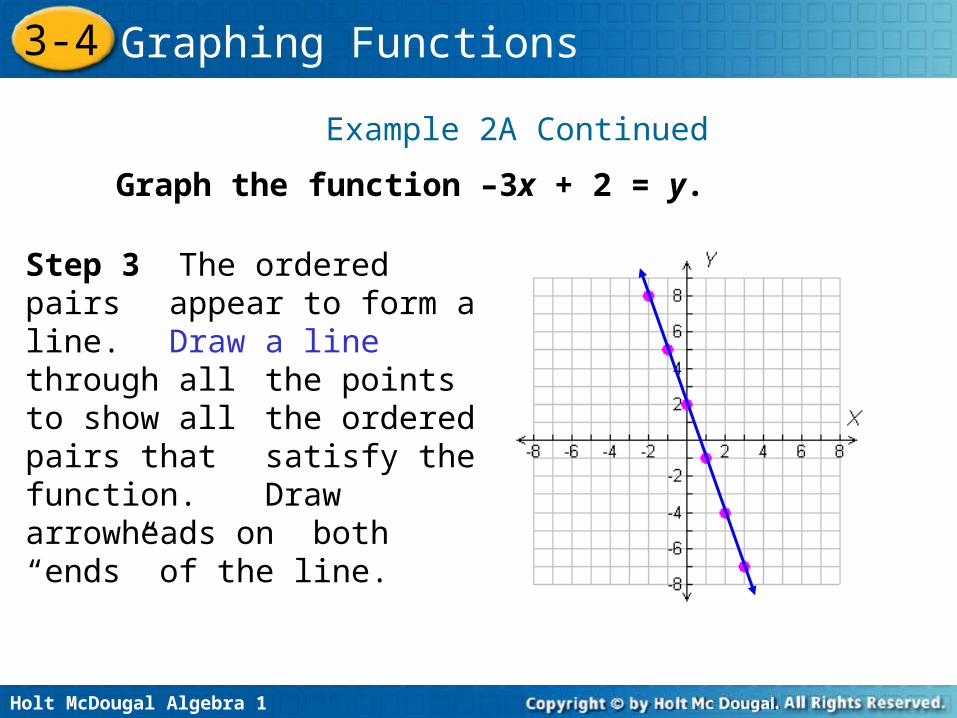
Graph the function –3x + 2 = y.
–3(1) + 2 = –11 (1, –1)
0 –3(0) + 2 = 2 (0, 2)
Step 1 Choose several values of x and generate ordered pairs.
–1 (–1, 5)–3(–1) + 2 = 5
–3(2) + 2 = –42 (2, –4)
3 –3(3) + 2 = –7 (3, –7)
–3(–2) + 2 = 8–2 (–2, 8)
Holt McDougal Algebra 1
3-4 Graphing Functions
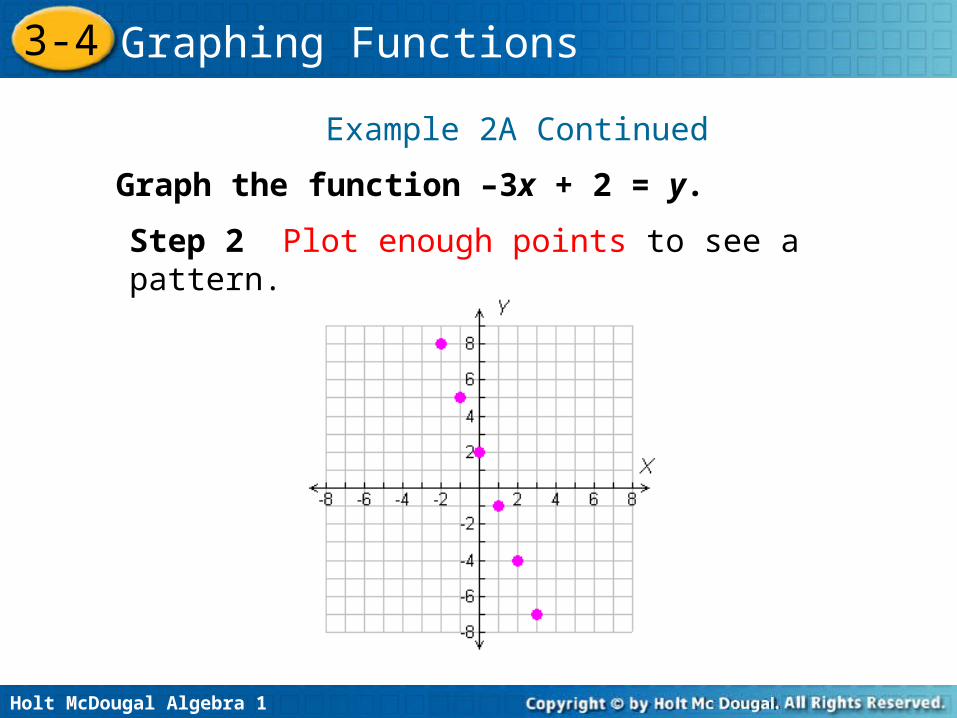
Step 2 Plot enough points to see a pattern.
Example 2A Continued
Graph the function –3x + 2 = y.
Holt McDougal Algebra 1
3-4 Graphing Functions
Step 3 The ordered pairs appear to form a line. Draw a line through all the points to show all the ordered pairs that satisfy the function.
Draw arrowheads on both “ends” of the line.
Example 2A Continued
Graph the function –3x + 2 = y.
Holt McDougal Algebra 1
3-4 Graphing Functions
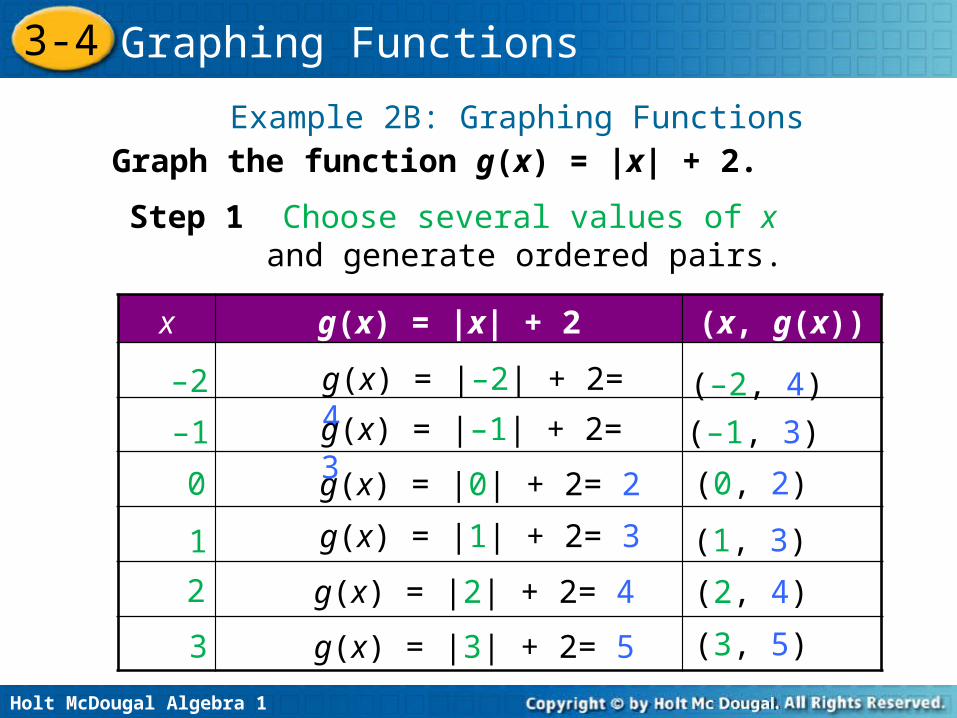
Example 2B: Graphing Functions
g(x) = |–2| + 2= 4–2 (–2, 4)
g(x) = |1| + 2= 31 (1, 3)
0 g(x) = |0| + 2= 2 (0, 2)
Step 1 Choose several values of x and generate ordered pairs.
g(x) = |–1| + 2= 3–1 (–1, 3)
g(x) = |2| + 2= 42 (2, 4)
g(x) = |3| + 2= 53 (3, 5)
Graph the function g(x) = |x| + 2.
x g(x) = |x| + 2 (x, g(x))
Holt McDougal Algebra 1
3-4 Graphing Functions
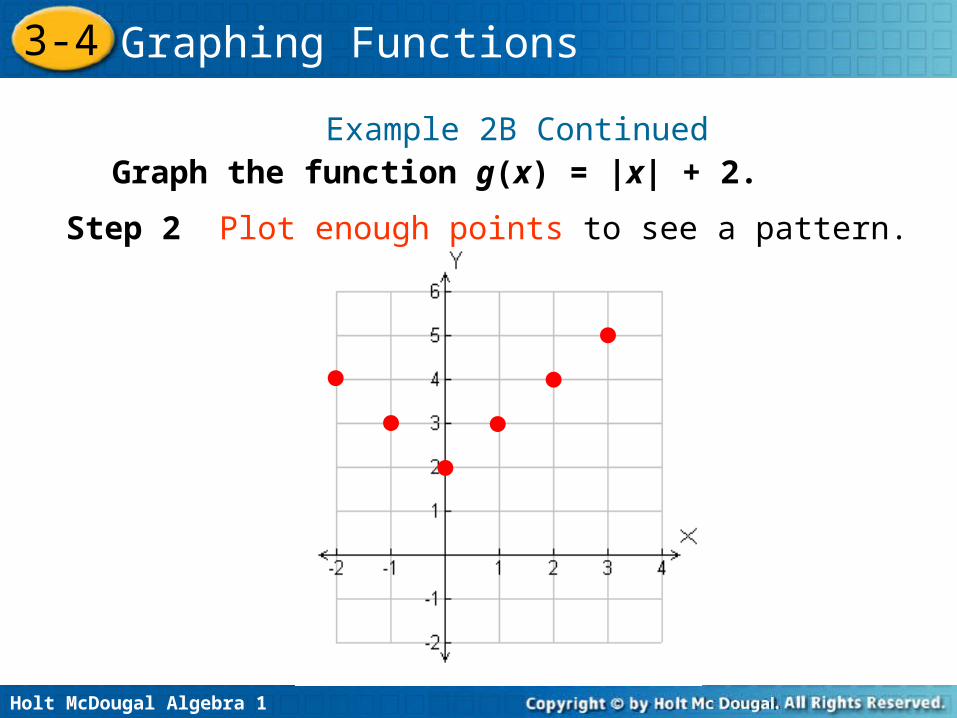
Step 2 Plot enough points to see a pattern.
Example 2B ContinuedGraph the function g(x) = |x| + 2.
Holt McDougal Algebra 1
3-4 Graphing Functions
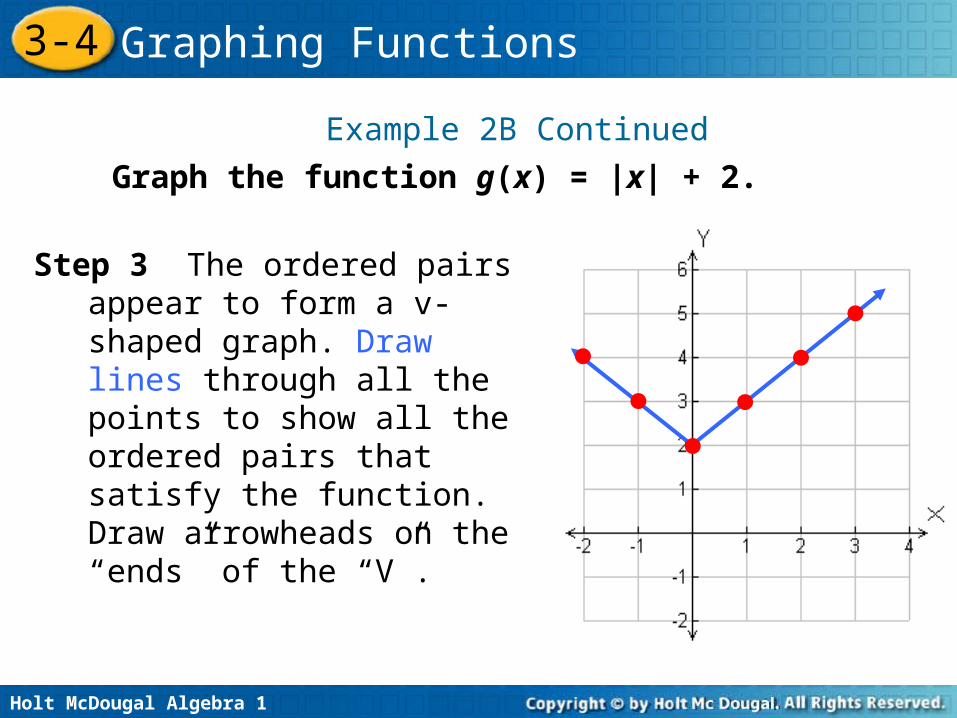
Step 3 The ordered pairs appear to form a v-shaped graph. Draw lines through all the points to show all the ordered pairs that satisfy the function. Draw arrowheads on the “ends” of the “V”.
Example 2B Continued
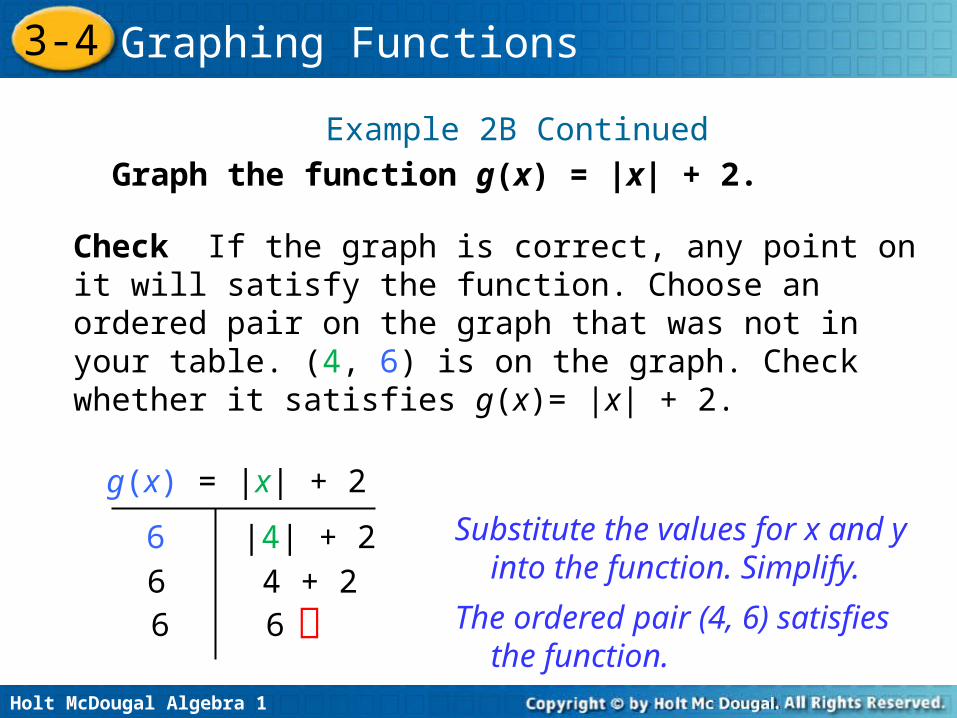
Graph the function g(x) = |x| + 2.
Holt McDougal Algebra 1
3-4 Graphing Functions
Check If the graph is correct, any point on it will satisfy the function. Choose an ordered pair on the graph that was not in your table. (4, 6) is on the graph. Check whether it satisfies g(x)= |x| + 2.
g(x) = |x| + 2
6 |4| + 26 4 + 26 6
Substitute the values for x and y into the function. Simplify.
The ordered pair (4, 6) satisfies the function.
Example 2B ContinuedGraph the function g(x) = |x| + 2.
Holt McDougal Algebra 1
3-4 Graphing Functions
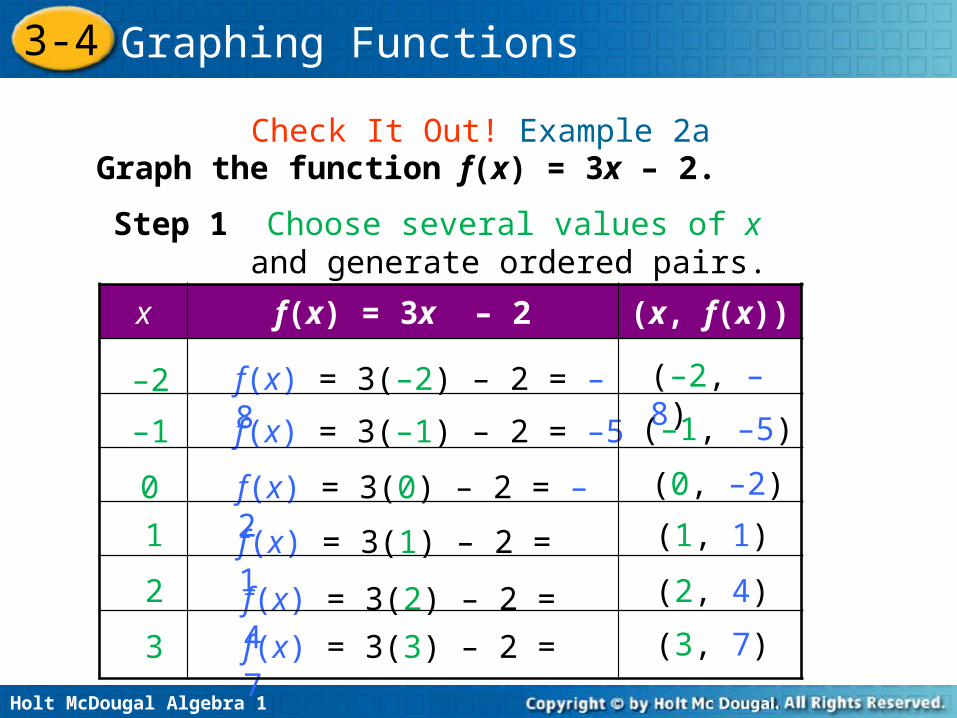
Check It Out! Example 2aGraph the function f(x) = 3x – 2.
f(x) = 3(–2) – 2 = –8–2 (–2, –8)
f(x) = 3(1) – 2 = 11 (1, 1)
0 f(x) = 3(0) – 2 = –2 (0, –2)
Step 1 Choose several values of x and generate ordered pairs.
f(x) = 3(–1) – 2 = –5–1 (–1, –5)
f(x) = 3(2) – 2 = 42 (2, 4)
f(x) = 3(3) – 2 = 73 (3, 7)
x f(x) = 3x – 2 (x, f(x))
Holt McDougal Algebra 1
3-4 Graphing Functions
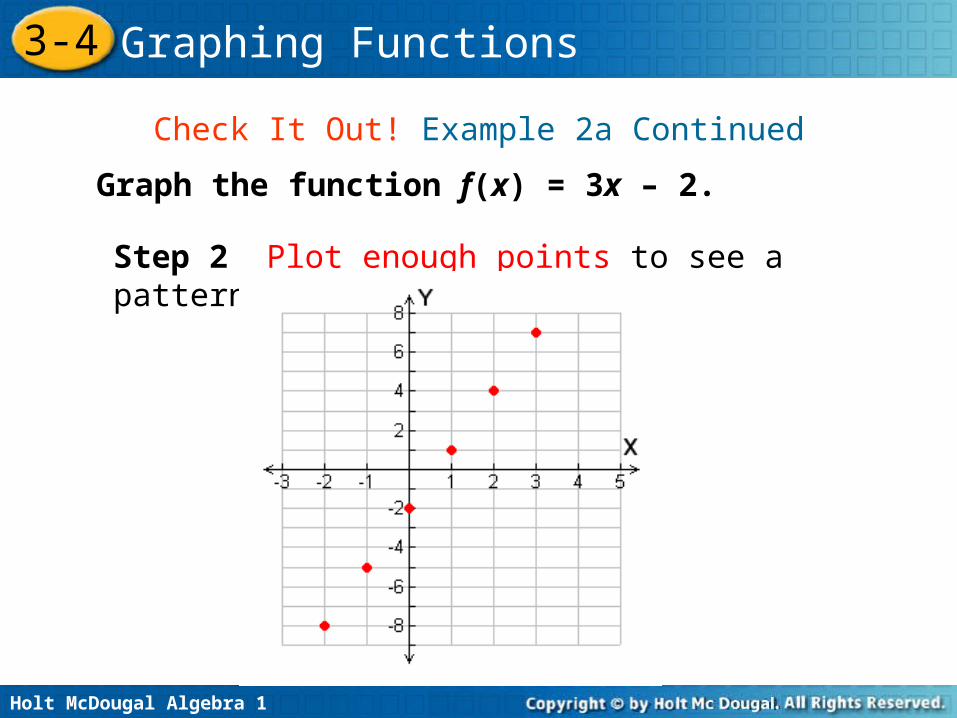
Step 2 Plot enough points to see a pattern.
Check It Out! Example 2a Continued
Graph the function f(x) = 3x – 2.
Holt McDougal Algebra 1
3-4 Graphing Functions
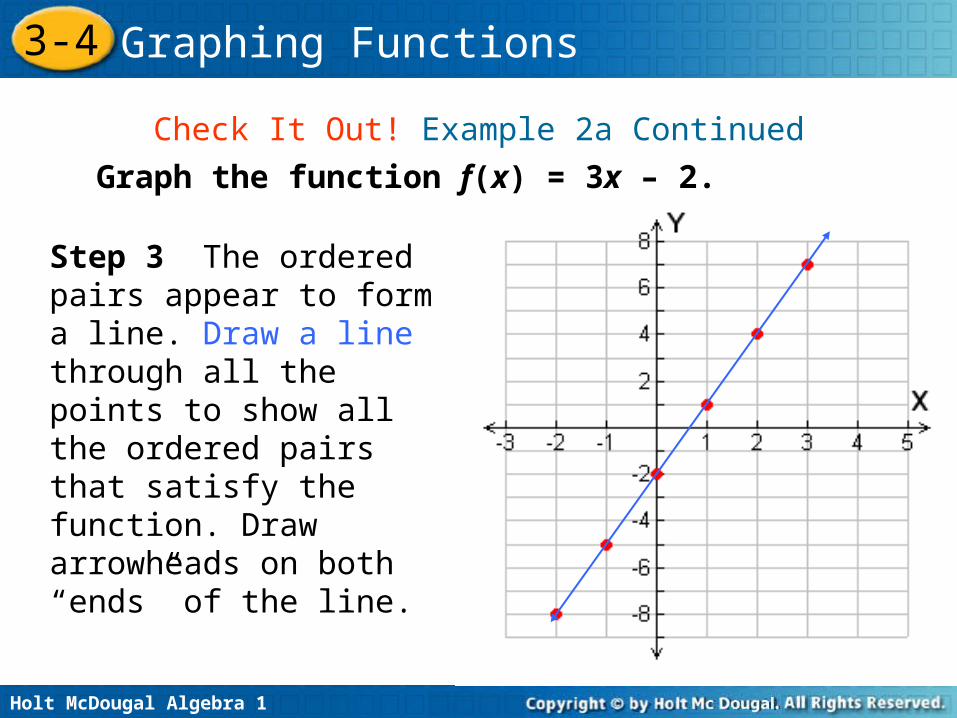
Step 3 The ordered pairs appear to form a line. Draw a line through all the points to show all the ordered pairs that satisfy the function. Draw arrowheads on both “ends” of the line.
Check It Out! Example 2a Continued
Graph the function f(x) = 3x – 2.
Holt McDougal Algebra 1
3-4 Graphing Functions
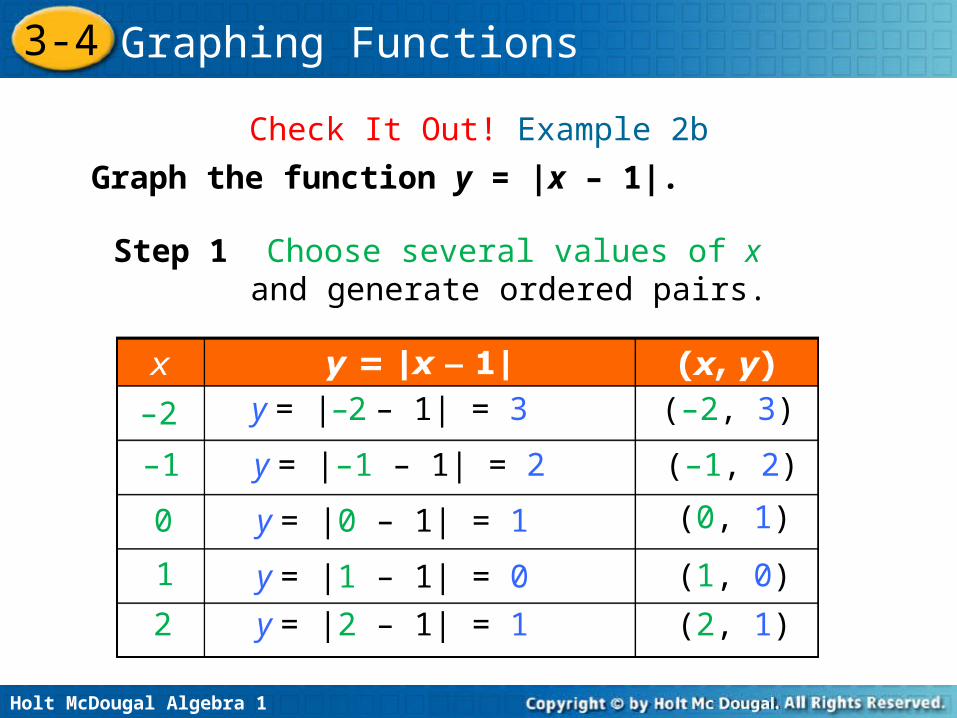
Graph the function y = |x – 1|.
y = |–2 – 1| = 3–2 (–2, 3)
y = |1 – 1| = 01 (1, 0)
0 y = |0 – 1| = 1 (0, 1)
Step 1 Choose several values of x and generate ordered pairs.
y = |–1 – 1| = 2–1 (–1, 2)
y = |2 – 1| = 12 (2, 1)
Check It Out! Example 2b
Holt McDougal Algebra 1
3-4 Graphing Functions
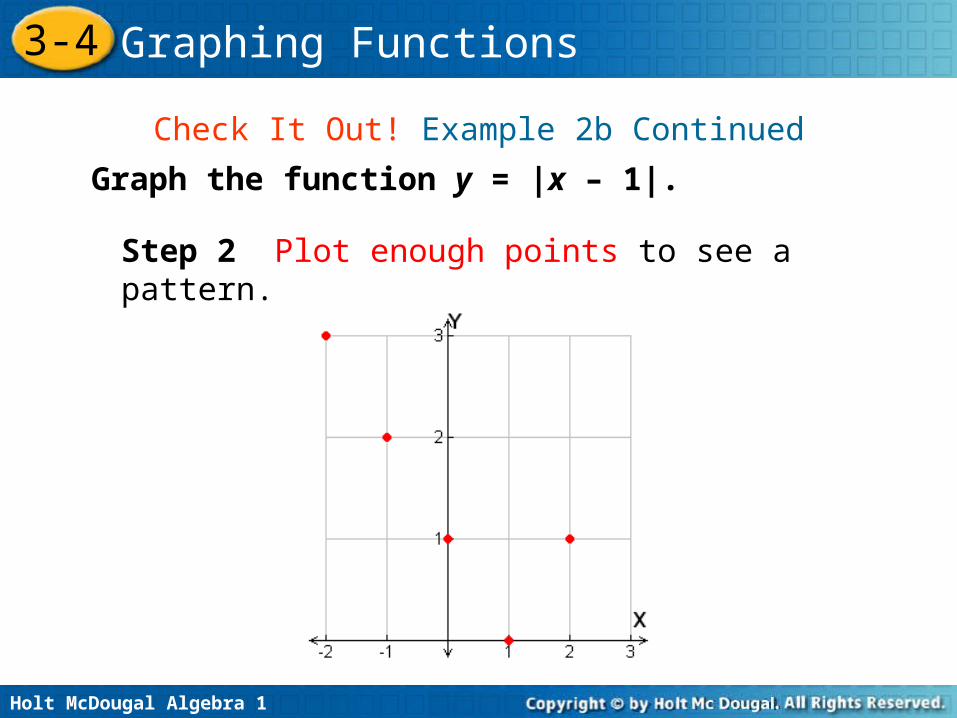
Step 2 Plot enough points to see a pattern.
Graph the function y = |x – 1|.
Check It Out! Example 2b Continued
Holt McDougal Algebra 1
3-4 Graphing Functions
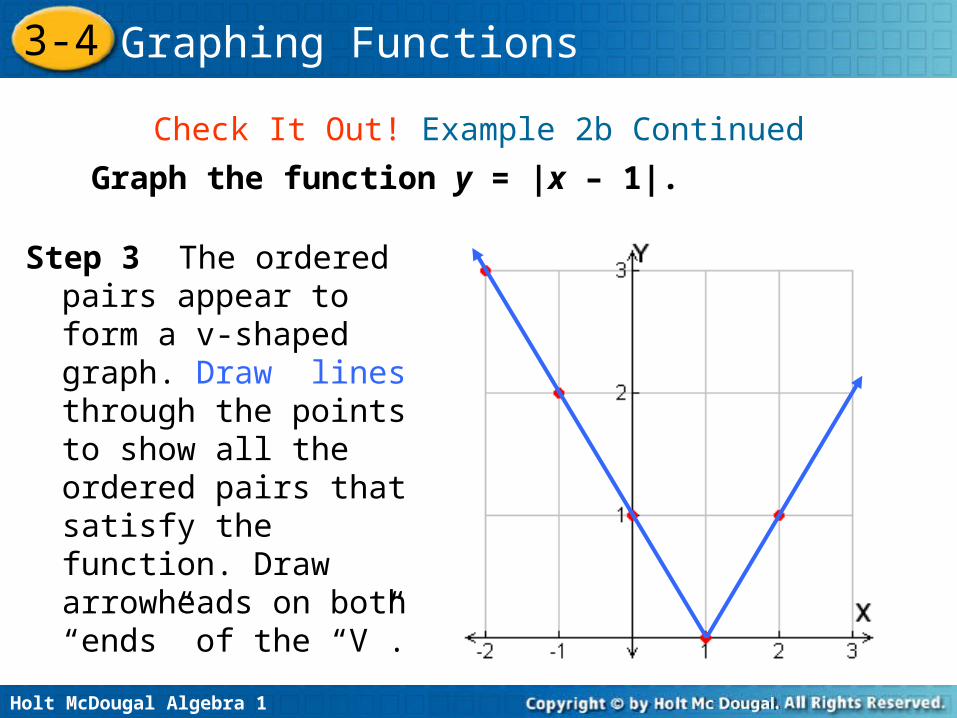
Step 3 The ordered pairs appear to form a v-shaped graph. Draw lines through the points to show all the ordered pairs that satisfy the function. Draw arrowheads on both “ends” of the “V”.
Graph the function y = |x – 1|.
Check It Out! Example 2b Continued
Holt McDougal Algebra 1
3-4 Graphing Functions
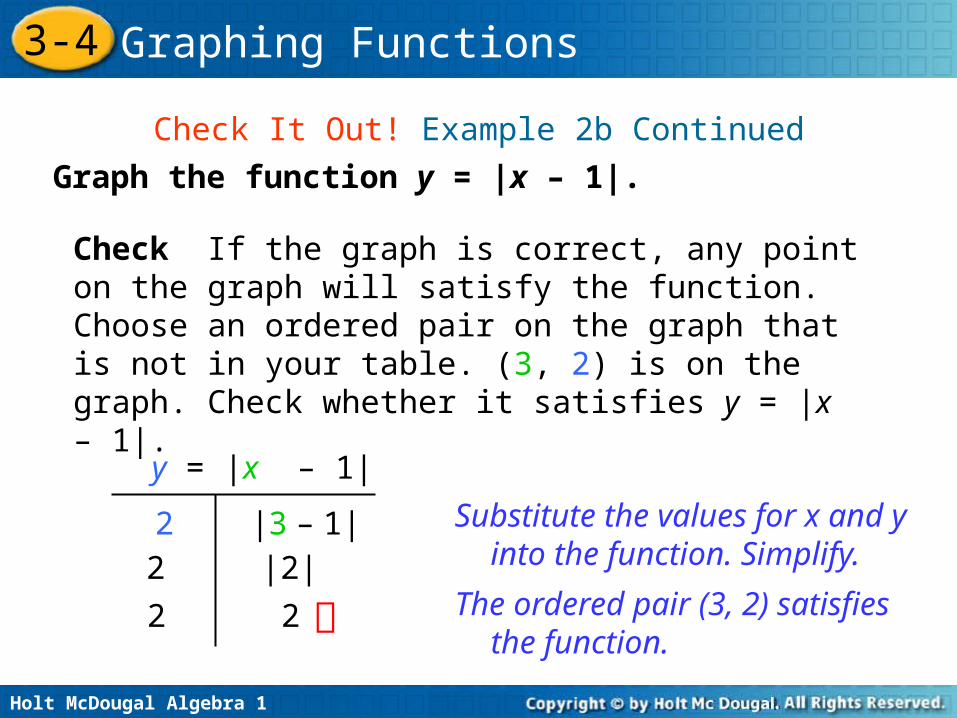
Check If the graph is correct, any point on the graph will satisfy the function. Choose an ordered pair on the graph that is not in your table. (3, 2) is on the graph. Check whether it satisfies y = |x – 1|.
y = |x – 1|
2 |3 – 1|2 |2|
2 2
Substitute the values for x and y into the function. Simplify.
The ordered pair (3, 2) satisfies the function.
Graph the function y = |x – 1|.
Check It Out! Example 2b Continued
Holt McDougal Algebra 1
3-4 Graphing Functions
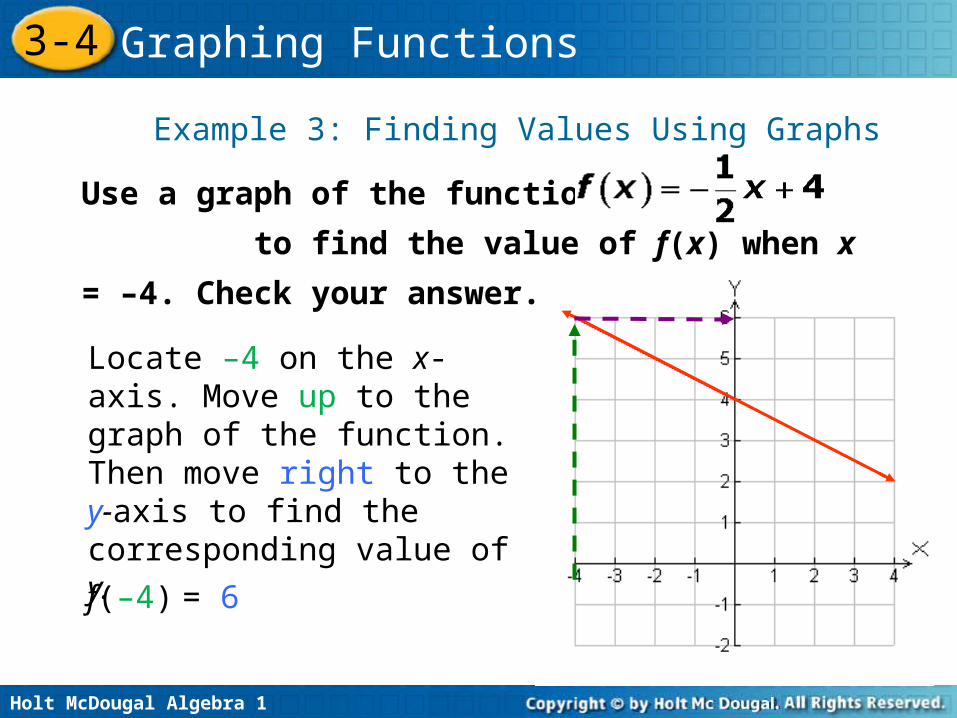
Example 3: Finding Values Using Graphs
Use a graph of the function
to find the value of f(x) when x = –4. Check
your answer.
Locate –4 on the x-axis. Move up to the graph of the function. Then move right to the y-axis to find the corresponding value of y.
f(–4) = 6
Holt McDougal Algebra 1
3-4 Graphing Functions
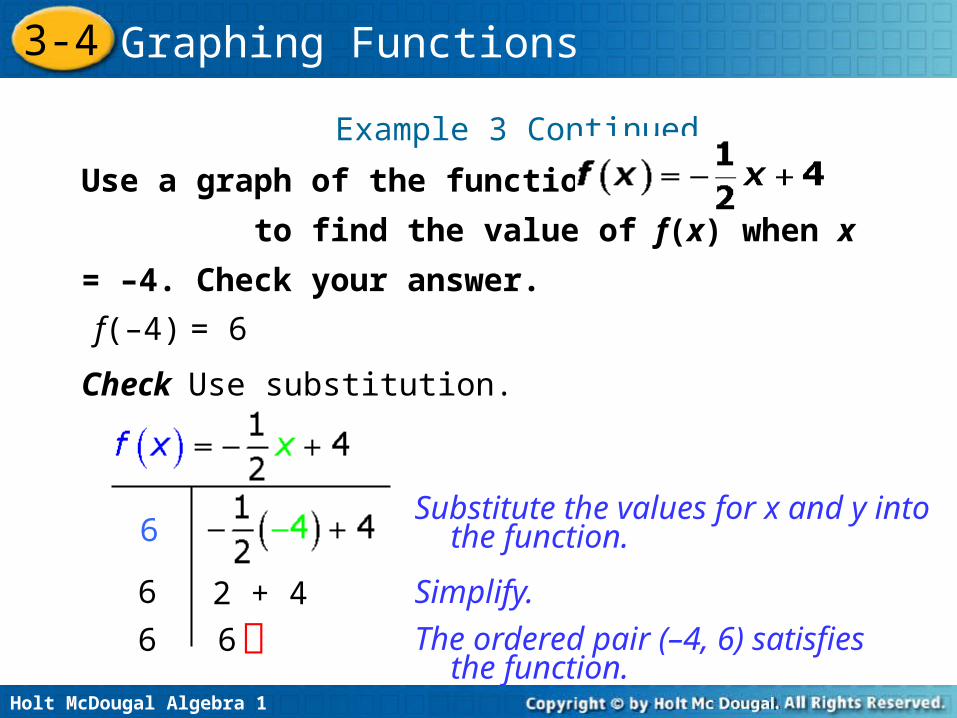
6 2 + 4
6 6
Check Use substitution.
Example 3 Continued
Substitute the values for x and y into the function.
Simplify.
The ordered pair (–4, 6) satisfies the function.
6
Use a graph of the function
to find the value of f(x) when x = –4. Check
your answer.
f(–4) = 6
Holt McDougal Algebra 1
3-4 Graphing Functions
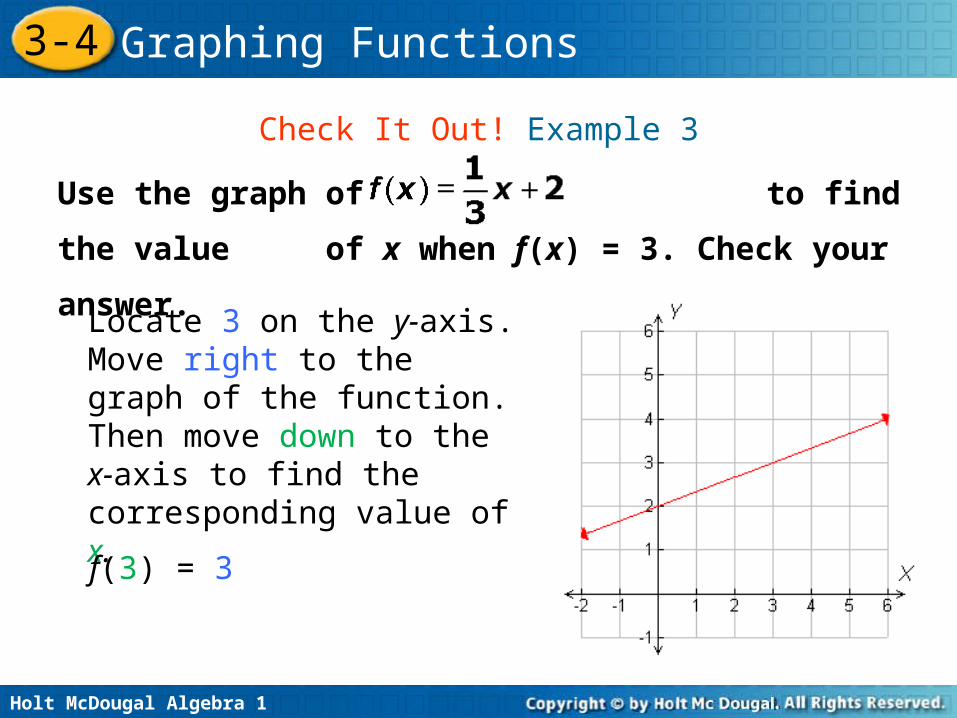
Check It Out! Example 3
Use the graph of to find the value
of x when f(x) = 3. Check your answer.
Locate 3 on the y-axis. Move right to the graph of the function. Then move down to the x-axis to find the corresponding value of x.
f(3) = 3
Holt McDougal Algebra 1
3-4 Graphing Functions
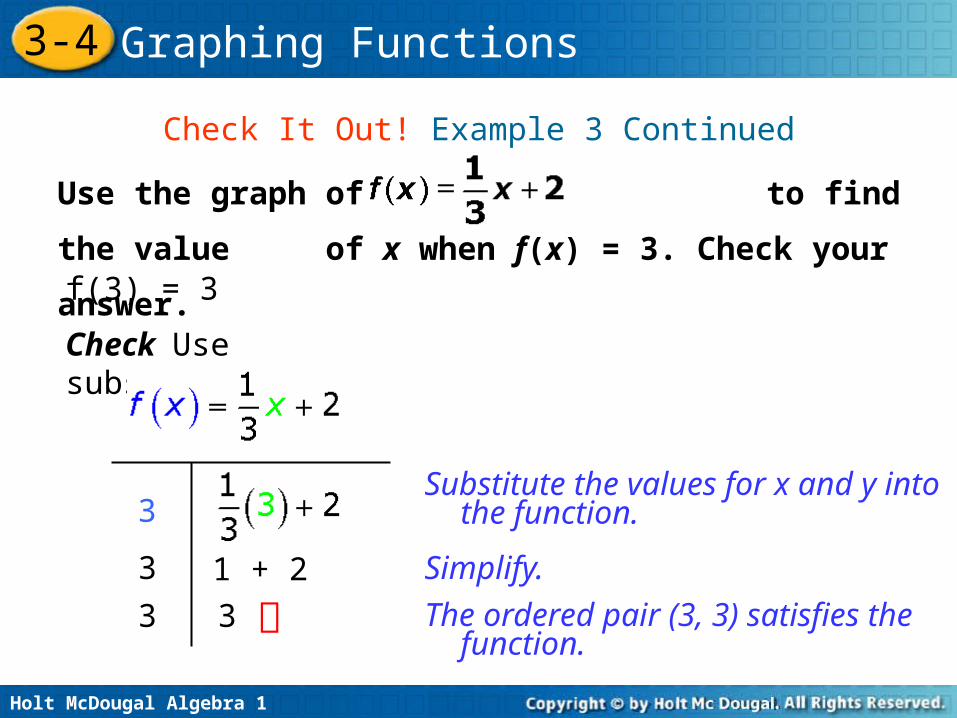
3 1 + 2
3 3
Check Use substitution.
Substitute the values for x and y into the function.
Simplify.
The ordered pair (3, 3) satisfies the function.
Check It Out! Example 3 Continued
Use the graph of to find the value
of x when f(x) = 3. Check your answer. f(3) = 3
3
Holt McDougal Algebra 1
3-4 Graphing Functions
Recall that in real-world situations you may have to limit the domain to make answers reasonable. For example, quantities such as time, distance, and number of people can be represented using only nonnegative values. When both the domain and the range are limited to nonnegative values, the function is graphed only in Quadrant I.
Holt McDougal Algebra 1
3-4 Graphing Functions
Example 4: Problem-Solving Application
A mouse can run 3.5 meters per second. The function y = 3.5x describes the distance in meters the mouse can run in x seconds. Graph the function. Use the graph to estimate how many meters a mouse can run in 2.5 seconds.
Holt McDougal Algebra 1
3-4 Graphing Functions
Example 4 Continued
Understand the Problem1
The answer is a graph that can be used to find the value of y when x is 2.5.
List the important information:
• The function y = 3.5x describes how many meters the mouse can run.
Holt McDougal Algebra 1
3-4 Graphing Functions
Think: What values should I use to graph this function? Both the number of seconds the mouse runs and the distance the mouse runs cannot be negative. Use only nonnegative values for both the domain and the range. The function will be graphed in Quadrant I.
2 Make a Plan
Example 4 Continued
Holt McDougal Algebra 1
3-4 Graphing Functions
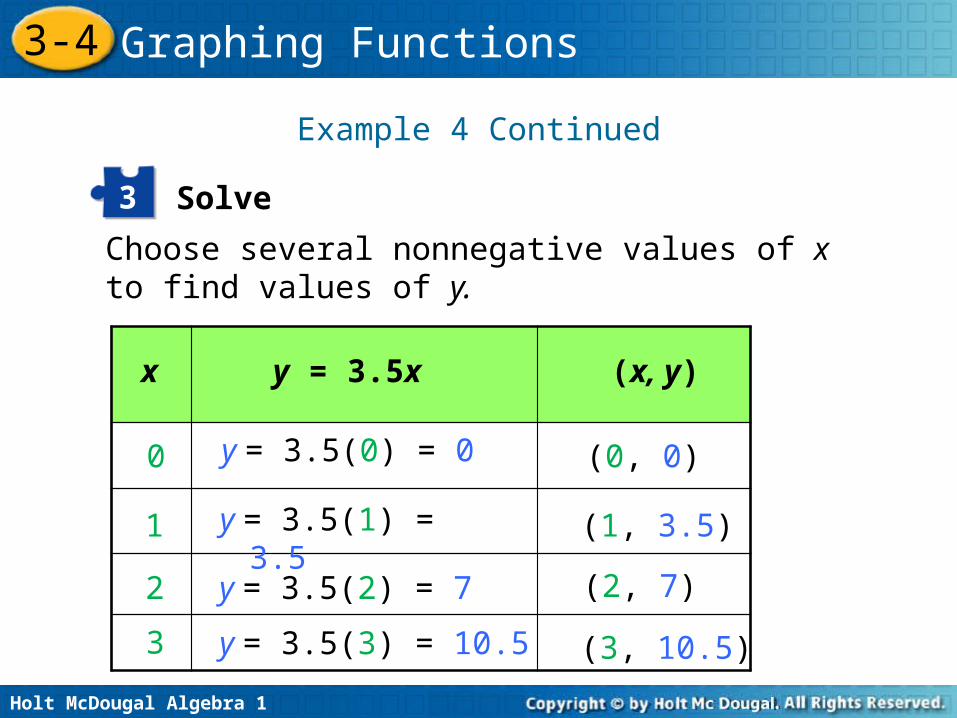
Solve3
Choose several nonnegative values of x to find values of y.
y = 3.5x x (x, y)
y = 3.5(1) = 3.5 1 (1, 3.5)
y = 3.5(2) = 72 (2, 7)
3 y = 3.5(3) = 10.5 (3, 10.5)
y = 3.5(0) = 0 0 (0, 0)
Example 4 Continued
Holt McDougal Algebra 1
3-4 Graphing Functions
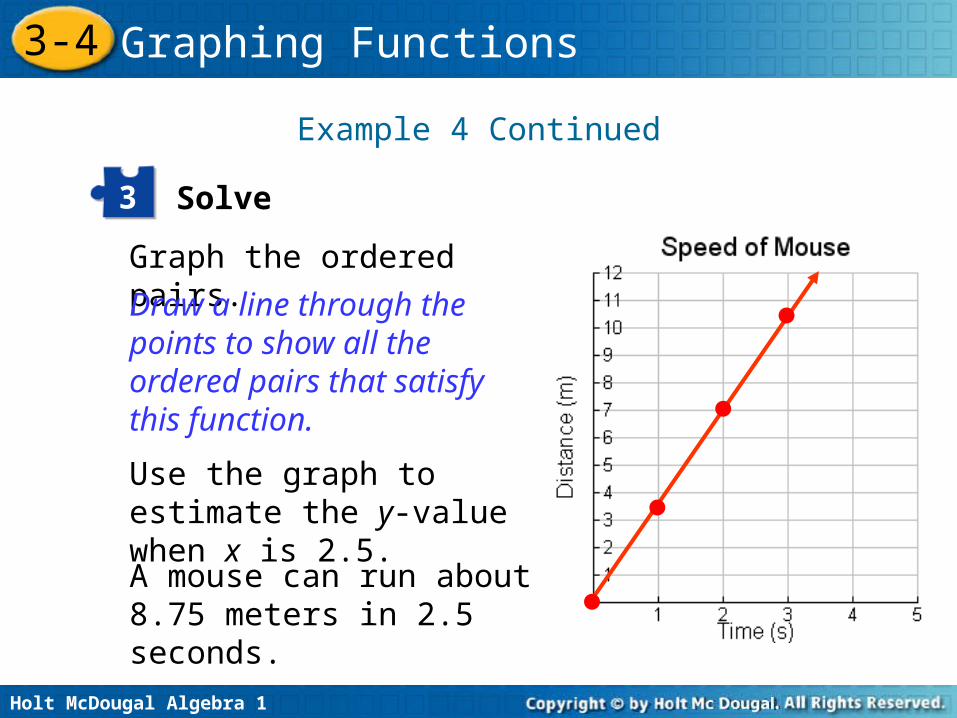
Graph the ordered pairs.
Draw a line through the points to show all the ordered pairs that satisfy this function.
Use the graph to estimate the y-value when x is 2.5.
A mouse can run about 8.75 meters in 2.5 seconds.
Solve3
Example 4 Continued
Holt McDougal Algebra 1
3-4 Graphing Functions
Look Back4
As time increases, the distance traveled also increases, so the graph is reasonable. When x is between 2 and 3, y is between 7 and 10.5. Since 2.5 is between 2 and 3, it is reasonable to estimate y to be 8.75 when x is 2.5.
Example 4 Continued
Holt McDougal Algebra 1
3-4 Graphing Functions
Check It Out! Example 4
The fastest recorded Hawaiian lava flow moved at an average speed of 6 miles per hour. The function y = 6x describes the distance y the lava moved on average in x hours. Graph the function. Use the graph to estimate how many miles the lava moved after 5.5 hours.
Holt McDougal Algebra 1
3-4 Graphing Functions
Check It Out! Example 4 Continued
Understand the Problem1
The answer is a graph that can be used to find the value of y when x is 5.5.
List the important information:
• The function y = 6x describes how many miles the lava can flow.
Holt McDougal Algebra 1
3-4 Graphing Functions
Think: What values should I use to graph this function? Both the speed of the lava and the number of hours it flows cannot be negative. Use only nonnegative values for both the domain and the range. The function will be graphed in Quadrant I.
2 Make a Plan
Check It Out! Example 4 Continued
Holt McDougal Algebra 1
3-4 Graphing Functions
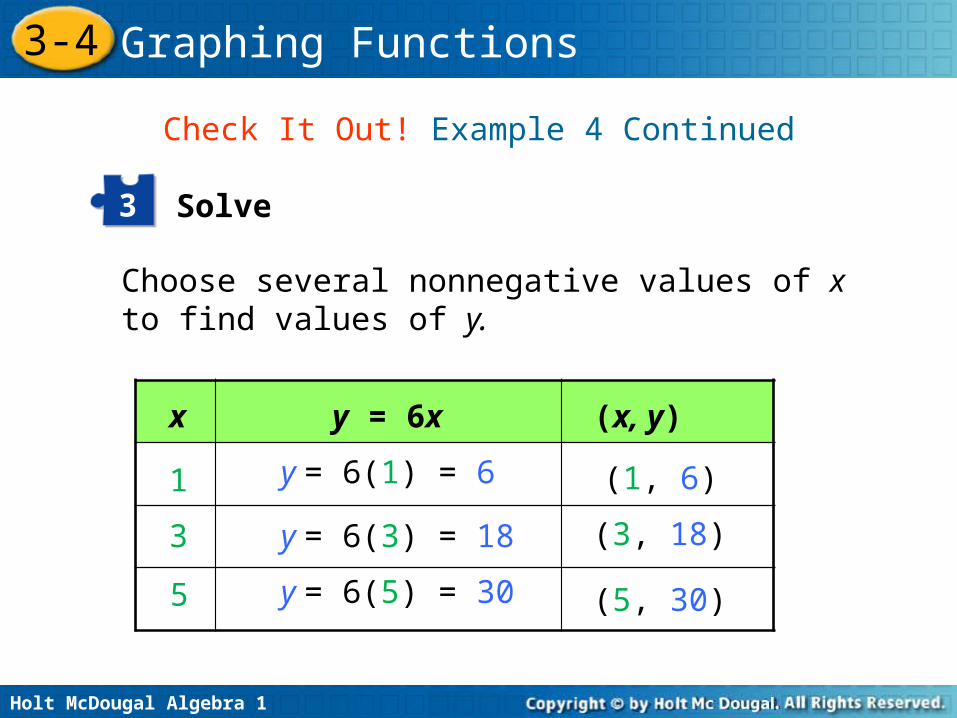
Solve3
Choose several nonnegative values of x to find values of y.
y = 6x x (x, y)
y = 6(1) = 6 1 (1, 6)
y = 6(3) = 183 (3, 18)
5 y = 6(5) = 30 (5, 30)
Check It Out! Example 4 Continued
Holt McDougal Algebra 1
3-4 Graphing Functions
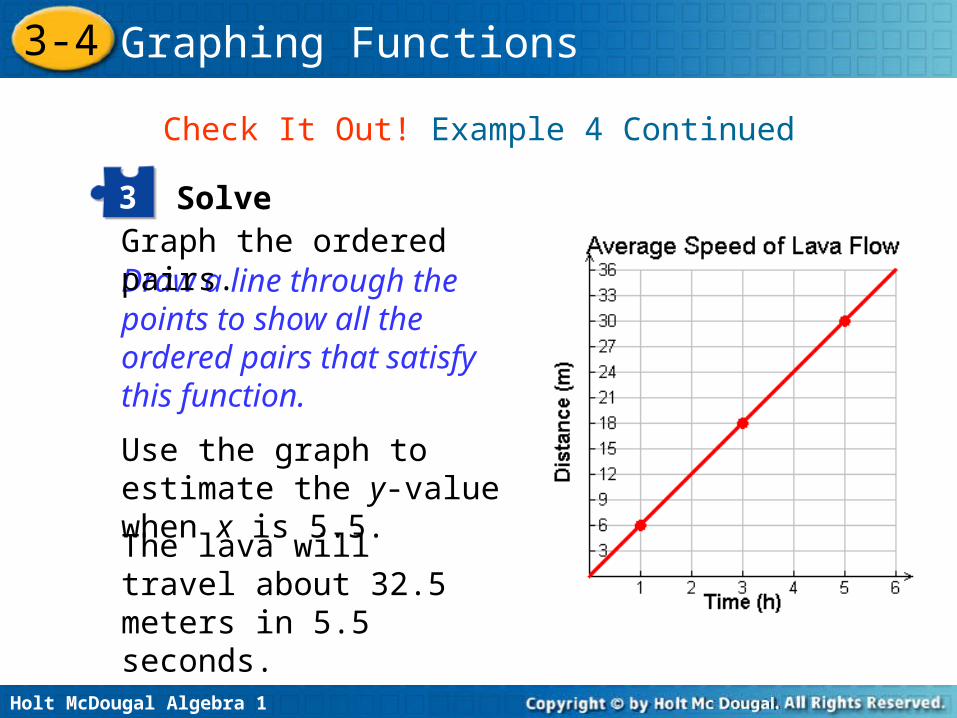
Solve3
Draw a line through the points to show all the ordered pairs that satisfy this function.
Use the graph to estimate the y-value when x is 5.5.
The lava will travel about 32.5 meters in 5.5 seconds.
Check It Out! Example 4 Continued
Graph the ordered pairs.
Holt McDougal Algebra 1
3-4 Graphing Functions
Look Back4
As the amount of time increases, the distance traveled by the lava also increases, so the graph is reasonable. When x is between 5 and 6, y is between 30 and 36. Since 5.5 is between 5 and 6, it is reasonable to estimate y to be 32.5 when x is 5.5.
Check It Out! Example 4 Continued
Holt McDougal Algebra 1
3-4 Graphing Functions
Example 5: Finding points on a graph
Find the value of x so that (x, 3) satisfies 1
62
y x
Holt McDougal Algebra 1
3-4 Graphing Functions
Check it Out! Example 5: Finding points on a graph
Find the value of y so that (-1, y) satisfies
3 9y x
Holt McDougal Algebra 1
3-4 Graphing Functions
Example 6: Determining points on a graph
Determine whether the given points are on
the graph of the equation
a) (0, 3) b) (-5, -2)
| 4 | 7y x
Holt McDougal Algebra 1
3-4 Graphing Functions
Check it Out! Example 6: Determining points on a graph
Determine whether the given points are on
the graph of the equation
a) (2, -1) b) (-1, -6)
2 5y x
Top Related