


Languages
Pages
Legal


Hoi Ho, M.D. Faculty Affairs & Development
Paul L. Foster SOM Texas Tech University HSC

Objectives
Describe the purposes of a JC Analyze commonly used biostatistic tests
in medical journals Examine the new format of JC. Apply new learning in enhancing the
quality of your department JC
Sepsis Study
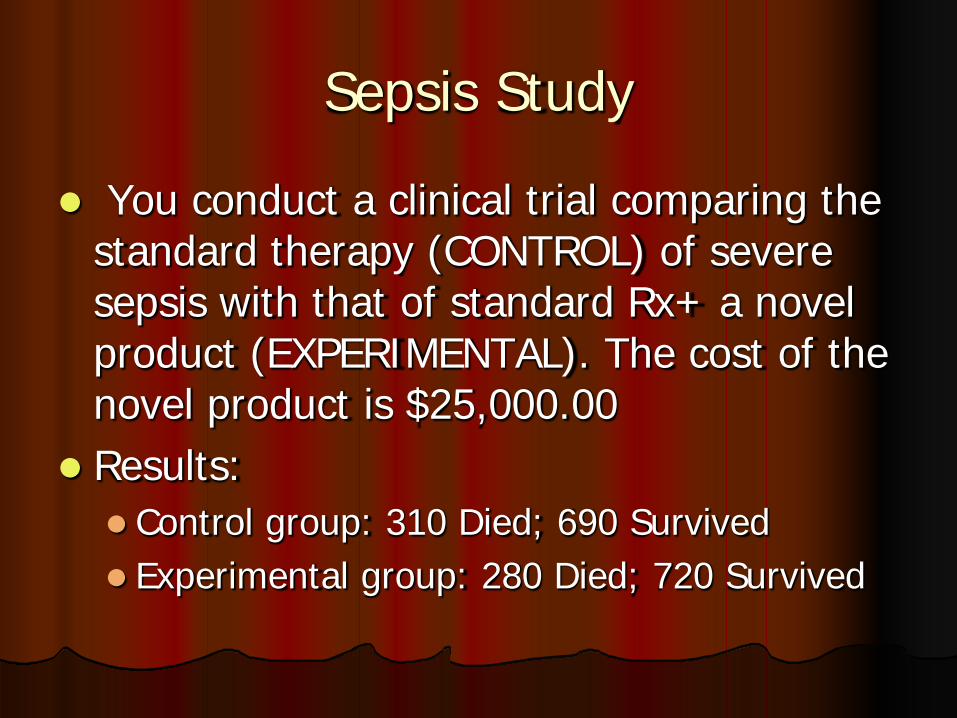
You conduct a clinical trial comparing the standard therapy (CONTROL) of severe sepsis with that of standard Rx+ a novel product (EXPERIMENTAL). The cost of the novel product is $25,000.00
Results: Control group: 310 Died; 690 Survived Experimental group: 280 Died; 720 Survived

Please calculate the following parameters
RRR (relative risk reduction) ARR (absolute risk reduction) NTT (number needed to treat) Cost to save one life

Why We Need Journal Club?
Sharing valid and applicable new information (EBM).
Up-to-date Teaching the skill of reading & analyzing
medical journals Life-long learning tool Requirement of the ACGME/RRC


The Information Jungle
1950: 1,000 scientific journals
1990: 40,000 scientific journals

Annual Published Articles
0
1
2
3
4
5
6
ARTICLES
1970's1980's1990's
Million copies
1970’s 1980’s 1990’s


6 S Levels of Organization of Evidence from Research

The Truth about Scientific Articles
Original & Valuable: 10-15 % of published articles
Helpful in your medical field: <1% published articles.
Applicable in your practice: < 0.1% published articles

Purposes of Evidence-Based JC
JOURNAL CLUB
Change of Practice
Behavior: Practice Gap
System-based practice
Practice-based learning
Up-to-date
Continuing Professional Development
Literature Appraisal
Self-directed Learning

Structure of a Journal Club Team
JOURNAL CLUB TEAM
TRAINING MANAGEMENT EVALUATION DEVELOPMENT
METHODOLOGY LITERATURE APP.
ASSIGMENT SCHEDULING FEEDBACK TOPIC SELECTION
PLANNING
Performance Improvement Follow-up

Format of The Journal Club (I)
1. Presentation by the presenter: 10-15 min. Study background, method, data analysis, results,
discussion, and conclusions- 5 min. Critique on: background, method, statistics, results, and
conclusions- 10 min.
2. Faculty Mentor/Moderator: 10 min. Use EBM to Ask, Comment or Facilitate on study design,
statistics, & data (PGY I, II, III, and Faculty)

Format of the Journal Club (II)
3. Local expertise and audience: pro and con- 10-20 min.
4. Presenter and Mentor: 5-10 min. Conclusions and extrapolation / application

Participants of a Journal Club
JC Participants
Primary Presenter (PGY 2-3)
Facilitator (Faculty)
(Sen. Resident) (Fellow)
Experts (Faculty)
(Local HCW)
Audience (Students) (Residents)
(Others)

Roles of the Primary Presenter
PRIMARY PRESENTER (10-15 min.)
SUMMARY Background
Method Results
Discussion Conclusions
CRITIQUE Method
Data collection Statistics
Data analysis Conclusions
CONCLUSIONS Suggestions Local data
Applications

Roles of the JC Moderator
FACILITATOR MODERATOR
(10 min.)
QUERRY Background
Method Results
Discussion Conclusions
COMMENT CLARIFY
Method Data collection
Statistics Data analysis Conclusions
DISCUSSION Related topics Similar articles Pro and con

Roles of the Audience & Experts
AUDIENCE EXPERTS
(10-20 min.)
QUERRY Background
Method Results
Discussion Conclusions
COMMENT Method
Data collection Statistics
Data analysis Conclusions
DISCUSSION Related topics Similar articles Pro and con

Building Foundation of the Journal Club Team
JOURNAL CLUB TEAM
TRAINING MANAGEMENT EVALUATION DEVELOPMENT
METHODOLOGY ASSIGNMENT FEEDBACK PLANNING
BASIC STATISTICS
EBM
LITERATURE SELECTION
FACULTY PGY II-III
MANDATORY COMPETENCY

Measure Outcomes of JC
Journal Club
Practice Behavior
Post intervention
Audit
Questionnaire Survey
Literature Appraisal
Survey
Standardized Tests
Up-to-Date
Performance Self-
Assessment
Standardized Tests

Mark Twain

Time to work together

Simple Concepts
Sensitivity Specificity Likelihood Ratio (positive/negative) Absolute Risk Reduction Relative Risk Reduction NNT P value Confidence Interval

How do you interpret the p value: Results of a randomized and controlled study of a
medication XX for common cold show subjects on XX protocol had a shorter period of illness by 1.2 day (p<0.05)
1 2 3
0% 0%0%
1. 95% of patients on XX protocol have shorter period of illness by 1.2 days or more compared to the patients in the control group.
2. By chance, less than 5% of patients on XX protocol improved with Tx
3. The larger difference than 1.2 days between the two groups can be observed in <5% of patients from identical population

Misinterpretation of “p value”
Many people misunderstand P values. If the P value is 0.03, that means that there is a 3% chance of observing a difference as large as you observed even if the two population means are identical (the null hypothesis is true). It is tempting to conclude, therefore, that there is a 97% chance that the difference you observed reflects a real difference between populations and a 3% chance that the difference is due to chance. However, this would be an incorrect conclusion. What you can say is that random sampling from identical populations would lead to a difference smaller than you observed in 97% of experiments and larger than you observed in 3% of experiments
http://www.graphpad.com/articles/interpret/principles/p_values.htm

P Value and Confidence Interval
A p value conveys no information about the size of differences or associations.
The p values only provide a dichotomous answer : significant Vs. not significant

P Value and Confidence Interval
Statistical significance is not equivalent to clinical significance.
A p value of <0.0001 is no more clinical significant than a p value of <0.05.

Confidence Interval
Provides a range that contains the TRUE value.
The 95 percent CI provides the boundaries in which we can be 95 % certain of observing TRUE values fall within that range

OBEGONE is an experimental product for weight reduction which has been tested for use in patients with severe obesity. In a recent article published in NEJM, a total of 9,297 patients were recruited into a randomized, double-blind controlled trial. The results are shown below OUTCOME OBGONE PLACEBO Weight loss (n=4,645) (n=4,652) (95% CI) Wt loss 6 lbs 3 lbs 2.2 (-.5 - 6.5) Wt loss +smoking 6 lbs 4 lbs 2 (0.85 - 6.5)

Ramipril is an angiotensin converting enzyme inhibitor which has been tested for use in patients with high cardiovascular risks. In a recent article published in NEJM, a total of 9,297 patients were recruited into a randomized, double-blind controlled trial. The results are shown below OUTCOME RAMIPRIL PLACEBO RR (n=4,645) (n=4,652) (95% CI) CV Events/Death 651(14%) 826(17.8%) 0.78 (0.70-0.86) Non CV Death 200(4.3%) 192(4.1%) 1.03 (0.85-1.26) Death from any cause 482 (10.4%) 569 (12.2%) 0.84 (0.75-0.95)

“I f a man begins w ith certainties, he shall end in doubts, but if he w ill be content to begin w ith doubts, he shall end in certainties.”
Francis Bacon
Top Related