


Languages
Pages
Legal

Brady 1
HEDGE FUNDS: A SYSTEMATIC APPROACH
Ryan Brady Economics 191A/B
June 9, 2006
Brady 2
Investment institutions invoke various investment strategies consisting of fixed income,
small, mid, and large capital equity strategies, foreign currency markets, futures, and many more.
However, one of the more interesting investment strategies used by various financial institutions
is hedge funds. Such funds are collective pools of investors seeking superior returns, a
characteristic shared with mutual funds. However, hedge funds use strategies such as foreign
currency markets, futures, leverage, and derivatives; strategies considered by most to be
noticeably more risky. Furthermore, hedge funds are subject to far less regulation than mutual
funds due to certain SEC exemptions. Hedge fund operations and/or practices have been met
with praise and criticism, and continue to be an enigma within the investment industry.
Hedge funds are defined by some as “collective investment vehicles, often organized as
private partnerships and resident offshore for tax and regulatory purposes” (Eichengreen,
Dynamic 1). In essence, hedge funds are professionally managed funds, similar to mutual funds.
However, hedge funds require a much larger initial investment (a minimum of $250,000 to
$1,000,000) and typically invoke a more aggressive investment approach, using leverage, short,
and derivative positions to maximize returns. Moreover, hedge funds are widely unregulated.
The large initial investment is used to signal that hedge fund investors are more sophisticated
than the common individual, and thus require less regulation, a circumstance more complicated
than the aforementioned qualification.
The aforementioned description is quite basic when considering various views of hedge
fund reputation and/or performance. Gregory Zuckerman writes,
Many hedge funds still beat what were lackluster markets, but their performances didn't match past years. The CSFB/Tremont Hedge Fund Index was up 5.9% through November, the most recent data available, compared with the 4.9% increase in the Standard & Poor's 500-stock Index, the 2.4% rise for the Dow Jones Industrial Average and 1.5% for the Lehman Brothers Bond Index for the same period. The average hedge fund returned 9.6% in 2004.

Brady 3
However, such returns are paired with numerous hedge fund failures, corruption scandals, and
government hearings for unethical and/or illegal actions practiced by certain hedge funds. Ianthe
Jeanne Dugan writes, “Two officials of Durus Capital pleaded guilty late last year to
manipulating the price of the two biotech stocks by concealing large purchases of the stocks
through false SEC filings...” Publications are littered with the mixed stories of hedge funds, their
performance, and their dealings.
Considering the aforementioned, it can be assumed there are multiple variations of the
basic hedge fund definition. Obviously it would be beneficial to determine what separates a
profitable, legitimate, hedge fund from a loosing, corrupt, fund. However, determining what
defines a “good” fund from a “bad” one is difficult because the aforementioned are both relative
and/or subjective terms. It may be possible, given constraints to empirical data, to determine
how common characteristics between hedge funds determine overall performance; where “good”
and/or “bad” are subjective to investor interests. More specifically, a “good” hedge fund would
be one that appropriately aligns investor and managerial goals, where a “bad” hedge fund creates
a divide of incentives (Ackerman, McEnally, and Ravenscraft 836). Systematically analyzing
hedge funds through theoretical, empirical, and specific means will help clarify the
characteristics of hedge funds that influence performance. Moreover, this systematic approach
will likely help clarify the volatility of hedge funds, and how such a circumstance may be
alleviated.

Brady 4
Hedge Funds: A Basic History
In 1901 Alfred Jones, the son of two American parents, was born in Melbourne Australia.
Although having been born in Australia, Jones grew up in the United States. He attended
Harvard in 1923, and proceeded to become a United States Diplomat in Berlin, Germany
beginning in 1930. He continued his education at Columbia and received a Ph.D. in Sociology,
and proceeded to take an editorial position with Fortune magazine in early 1940. In 1948, while
writing an article on the investment industry specifically dealing with investment strategies,
Jones decided to partake in money management. Jones started the first hedge fund in 1949 by
raising $100,000 including $40,000 of his own money. His investment fund was characterized
by the holding of long-term equity positions paired against short selling various other equity
holdings. In essence, Jones’ fund was characterized by his attempts to minimize systematic, or
market based, risk. Such an investment strategy is now distinguished as the classic long/short
equities model. After several years, Jones changed the managerial structure of his fund, going
from a general partnership to a limited partnership. Jones transformed his fund into a limited
liability partnership, adding a 20% incentive fee for the managing partner, a common
characteristic of current hedge funds (McWhinney).
Over the next few years hedge funds remained somewhat of a secret in the investment
world. However, when Fortune magazine published the 1966 article, explaining how hedge
funds had outperformed all other market investments, the secret was out. By 1968 there existed
over 140 different investment partnerships, all calling themselves hedge funds (McWhinney).
In the years to follow, hedge funds moved away from the act of hedging (the act of
reducing risk) and engaged in long term leverage strategies. Unfortunately, such strategies led to
heavy losses, and struck a devastating blow to the industry. Nonetheless, in 1986 a similar
Brady 5
article was run by Institutional Investor outlining the superior performance of Tiger Funds, a
hedge fund managed by Julian Robertson. The aforementioned public notoriety created a rush
back to the hedge fund industry, where typical hedge fund investment strategies were
characterized by foreign currency investment, derivatives, and futures (McWhinney).
History proceeded to repeat itself with the hedge fund industry experiencing yet another
downward spiral. Even Julian Roberson’s infamous Tiger Funds, along with another overtly
successful fund, Quantum Funds, met a dismal end after years of excessive investment success.
(McWhinney)
Although the industry failure in the 1990’s created a movement away from hedge funds,
today they are again marked as incredibly profitable investment mediums. Moreover, the
introduction of the “fund of funds” hedge fund, an investment partnership similar to that of a
mutual fund, has reduced the inherent risks of hedge funds by allowing investors to diversify
their investments. Furthermore, an initial investment for a “fund of funds” is in the range of
$25,000 rather than the original $250,000 to $1,000,000 for a “normal” fund (McWhinney).
Ackermann, McEnally, and Ravenscraft write, “Though the number and size of hedge funds are
small relative to mutual funs, their growth reflects the importance of this alternative investment
vehicle for institutional investors and wealthy individual investors” (833).
Hedge Funds: The Agency Problem And Its Solutions
This strategic interaction between manager and investor is best characterized as a
common agency problem, where the fund manager, or agent, acts on behalf of an investor, or
principle. In his paper The Economic Theory of Agency: The Principle’s Problem, Steven Ross
outlines a general agency problem such as that of manager and investor.
Brady 6
Ross claims that agency problems are not limited to investment interactions; rather they
are merely a product of contractual agreement between agent and principle (134). Upon a
contractual agreement the agent acts over what Ross calls a “feasible action space” (134). The
agent’s action produces a payoff which is dependent on the unique action and a random,
unknown, state of nature (134). Paralleled by the agents decision is the agreement of an
appropriate and feasible fee schedule dependent on the actions payoff and state of nature at the
time of action. Therefore, the agent chooses an action such that principle agent payoff is
maximized over “his/her subjectivity held probability distribution” (134). Ross claims, with
logical reasoning, that principle payoff maximization is constrained by a market imposed
minimum expected fee (135). In essence, the agent acts subject to an expected minimum fee for
themselves. Thus, the agent’s maximization problem becomes a Family-Pareto efficient fee,
where the weighted utility between agent and principle is maximized (135). Ross claims that the
set of payoff structures which simultaneously satisfy the principle problem and lead to Pareto-
efficiency will likely to occur in practice (138). However, the calculations in the formation of
this conclusion assume aspects of interaction that are unlikely to occur, such as perfect
information held by the agent (138).
Ackerman, McEnally, and Ravenscraft claim that the best outcome, or solution, to a
“hedge fund agency problem” is one in which manager and investor incentives are properly
aligned (836). If such a condition is not met managers incur inappropriate amounts of risk,
expend inefficient amounts of effort, reap inappropriate perks, and produce poor and/or
inappropriate investment results (Ackerman, McEnally, and Ravenscraft 836). The ideal
alignment of investor and managerial incentives is a product of incentive contracts, ownership
structure, market forces, and governmental regulation (Ackerman, McEnally, and Ravenscraft

Brady 7
836). However, it is important to note that because hedge funds are sufficiently unregulated, and
implement a wide range of investment strategies, more emphasis is put on the first two
characteristics, especially incentive fees.
Laura Starks examines the impact of compensation contracts on portfolio performance in
her paper “Performance Incentive Fees: An Agency Theoretic Approach.” Although her analysis
focuses on mutual funds, the idea of contractual compensation easily carries over to the hedge
fund industry. Starks states,
The fiduciary relationship between mutual fund management and the investors they represent may be viewed as a principal-agent relationship. Consequently, the methodology from the agency literature can be applied to study the impact of various compensation arrangements on the potential conflict of interest between these two groups. (17)
Starks’ theory compares the effects of both symmetric and bonus incentive plans. In essence,
both of these plans compensate managers for exceeding predicted, or benchmark, performance;
however bonus plans fail to penalize managers for poor performance. Starks finds that symmetric
plans, which penalize poor performance, aligned investor and managerial risk, but resulted in an
inefficient investment in resources. Starks writes, “when the manager’s only decision is to select
the portfolio’s risk level, the optimal symmetric performance contract will provide the
appropriate incentives for selecting the investors desired risk level” (31). It was further
concluded that bonus plans are inferior to symmetric plans because they lead to a more than
optimal amount of risk used by managers (31). It is important to note that hedge fund incentive
plans primarily take the form of bonus plans, creating a higher associated risk levels (Ackerman,
McEnally, and Ravenscraft 837). Jennifer Carpenter also finds a correlation between incentive
fee and risk, where an increase in incentive fee is associated with a decrease in managerial risk.
As such, it seems that incentive fees are not one way streets where less is best. Rather, the ideal
Brady 8
incentive fee induces and optimal amount of risk and hopefully an optimal amount of resource
allocation.
Although it has been established that investment management situations create a dynamic
agency problem, such circumstances assume that the agent, or manager, have no personal funds
invested. Agency literature previously noted ignores situations in which a manager invests
personal assets (significant amounts) into the fund they manage. Such a circumstance creates a
dynamic joint ownership of the fund, where agent and principle alike have similar interests in the
risk and return of the fund (Ackerman, McEnally, and Ravenscraft 837). Although joint
ownership may lead to an insufficient amount of incurred risk, it would likely increase
managerial effort, thus moving it closer to the optimal level, at the cost of lower risk due to the
inherent risk adverse nature of investors ( Ackerman, McEnally, and Ravenscraft. 837).
It was previously stated that little emphasis is placed on market forced alignment due to
hedg’e funds wide range of investment methods. However, it is fairly common to sub-categorize
hedge funds into several categories representing the broad investment methods that such a fund
may adhere to. More specifically, differing hedge funds will place greater or lessened focus on
certain investment methods thus centralizing their overall investment strategy. For example,
certain funds tend to focus solely on the short sales market whereas others may place a greater
emphasis on long positions in emerging markets. As such, it is important, for the purpose of
agency alignment, to understand the extent to which the general hedge fund industry can be
categorized into investment sub-headings. Such a sub-categorization is created by Ackermann,
McEnally, and Ravenscraft in the following table;

Brady 9
Event Driven: Distressed Securities – Manger focuses on securities of companies in reorganization and bankruptcy, ranging from senior secured debt to the common stock of the company. Risk Arbitrage – Manager simultaneously buys stock in a company being acquired and sells stock in its acquirers. Global: International – Manager pays attention to economic change around the world (except in the United States) but more bottom-up oriented in that managers tend to be stock pickers in the markets they like. Uses index derivatives to a much lesser extent than macro managers. Emerging – Manager invests in less mature financial markets of the world, e.g. Hong Kong, Singapore, Pakistan, India. Because shorting is not permitted in many emerging markets, managers must go to cash or other markets when valuations make being long unattractive. Regional – Manager focuses on specific regions of the world, e.g. Latin America, Asia, Europe. Global Macro: Opportunistic trading manager that profits from changes in global economies, typically based on major interest rate shifts. Uses leverage and derivatives. Market Neutral: Long/Short stocks – Half long/half short. Manger attempts to lock-out or neutralize market risk. In theory, market risk is greatly reduced but it is very difficult to make a profit on a large diversified portfolio so stock picking is critical. Convertible arbitrage – Manger goes long convertible securities and short the underlying equities. Stock index arbitrage – Manager buys a basket of stocks and sells short stock index futures, or the reverse. Fixed income arbitrage – Manager buys T-bonds and sells short other T-bonds that replicate the bond purchased in terms of rate and maturity. Short Sales: Manager takes a position that stock prices will go down. Used as a hedge for long-only portfolios and by those who feel market is approaching a bearish trend. U.S. Opportunistic: Value – Manager focuses on assets, cash flow, book value, out-of-favor stocks. Growth – Manager invests in growth stocks; revenues, earnings, and growth potential are key. Short term – Manager holds positions for a short time frame. Fund of Funds Capital is allocated among a number of hedge funds, providing investors with access to managers they might not be able to discover or evaluate on their own. Usually has a lower minimum than a hedge fund.
Brady 10
Although market based regulation is claimed to play a small role in managerial/investor
alignment, the extent to which a hedge fund centralizes its investment strategy around a select
few investments surely must.
Beyond the centralization of investment styles, various researchers view monetary
mobility as a means of market regulation. Richard Ippolito investigates performance reaction in
his paper titled “Consumer reaction to measures of poor quality: Evidence from the mutual fund
industry.” Ippolito claims that, given perfect information and individual ability to act on such
information, that consumers will abandon funds with inherently un-optimal risk and/or recourse
allocation. Ippolito finds that superior performance of mutual funds attracts an inflow of money,
coupled with an outflow of money from poor performing funds. Erik Sirri and Peter Tufano find
similar results in funds with superior returns; however claim that poorly performing funds are not
significantly penalized (1619).
However, the aforementioned market regulation assumes investors posses the ability to
act on available information, an assumption that is not valid in the hedge fund industry. Fancois-
Serge Lhabitant claims that hedge funds incorporate limited redemption possibilities paired with
minimum investment periods, usually starting at a one year minimum (16). In essence, although
mutual funds seem to be fairly liquid investment mediums, hedge funds are characterized by
varied illiquidity, thus negating the aforementioned possibilities of market regulation due to
monetary flows.
Confronting the issue of regulation, the security exchange markets are generally regulated
by the Securities Exchange Commission. The Securities and Exchange Commission, or SEC,
was governmentally created by congress to protect investors (United States, Investor Advocate).
As previously noted, hedge funds are notoriously unregulated, and thus are fairly unregulated by

Brady 11
the SEC. Such an absence of regulation is an important characteristic in the hedge fund industry
because it allows for a more diverse method of investment strategies, and possibly a more drastic
misalignment of managerial/investor incentive. The common explanation for this characteristic
un-regulation is that hedge funds are a private partnership of high net-worth individuals who
require less protection from the SEC, leading to and emphasized under-regulation of funds.
However, the specifics of hedge fund un-regulation are more complicated than the
aforementioned qualification.
The most pressing initial qualification that must be made is whether hedge funds are to be
considered brokers or dealers. The Securities and Exchange Act of 1934 defines dealers as those
who, “…engage in the business of buying or selling securities for his own account, through a
broker or otherwise…” whereas a broker is defined as, “any person engaged in the business of
effecting transactions in securities for the account of others…” (Section 3(a)(5), Section 3(a)(4)).
Obviously hedge funds could adequately qualify as brokers in the sense that the fund is usually
maintained by a fund manager and thus affects transactions for the account of others based on
his/her investment decision (Hacker and Rotunda 1474). However, it is plausible for hedge
funds to be viewed as dealers because it could be said that the fund buys and sells securities for
its own account (Hacker and Rotunda 1474). Robert Hacker and Ronald Rotunda claim that
there has been no discussion by the SEC as to how these definitions might apply to hedge funds,
and only one non-specific comment has been made about hedge funds possibly being considered
dealers based on the aforementioned definitions (1474). As such, there is little evidence to
substantiate the necessity for hedge funds to register under the title of a broker.
Considering the wording of the dealer definition there is further speculation as to whether
hedge funds are dealers or traders. Hacker and Rotunda claim that based on characteristic
Brady 12
dealings, hedge funds are likely to be considered traders rather than dealers, thus alleviating any
need to register as a dealer. Hacker and Rotunda write,
The staff apparently believes that the additional investor protection achieved by requiring registration of investment managers, as well as of broker-dealers through whom managers buy and sell, is insufficient to support that extra requirement. (1476)
As such, hedge funds are exempt from registration under both headings of broker and dealer. Having negated the need to register hedge funds under the title of dealer there is the
question as to whether fund managers should be required to register as investment advisors.
Section 202(a)(11) of the Advisers Act defines “investment adviser” as “any person who, for
compensation, engages in the business of advising others… as to the advisability of investing in,
purchasing, or selling securities…” (United States Advisor Act). It would seem that fund
managers would fall under this qualification and thus be required to register as an investment
advisor, leading to higher levels of overall regulation of hedge funds. However, fund managers
typically meet the following two requirements for exemptions of registration. (1) Have had less
the twelve clients in the past year (2) Not publicly held and/or advertised as an investment
advisor (Hacker and Rotunda 1476-1478). This allows small groups of investment partners to
more aggressively manage money through investments the SEC may consider too risky for
common investors (Hacker and Rotunda 1477). Typically such small groups of investors are
comprised of financially sophisticated individuals who need less protection from the SEC
(Hacker and Rotunda 1477).
SEC regulation stipulates that an individual is publicly held if he/she maintains a
telephone listing, professional stationary, or word or mouth marketing exemplifying him/her as
an investment advisor or any variation thereof (Hacker and Rotunda 1479). Furthermore,
stipulation (1) is satisfied if the partnership is less than fifteen investors and/or if the partnership
Brady 13
collectively creates the fund themselves, and thereafter independently appoints a fund manager.
The latter is considered a satisfying circumstance because the SEC is likely to view such a fund
as a separate and distinguishable legal entity rather than a collective pool of numerous investors
(Hacker and Rotunda 1477-1479). Therefore, it would seem that so long as the appointed fund
manager has not held himself/herself publicly as an investment advisor through the
aforementioned means, hedge funds would be granted investment advisor registration exemption.
Although this exemption from registration is designed to allow small groups of
sophisticated investors freedom to allocate investments as they wish, it also severely restricts
available information and possibly creates conflicts of interest. Investors who do not meet the
aforementioned exemptions, and thus must register with the SEC as an investment advisor, are
required to submit periodic reports including basic fund information, and are not allowed to
accept compensation based on capital gains, or appreciation, of client funds (Hacker and
Rotunda 1480). Such a circumstance is thought to create conflicts of interest, namely the
previously noted agency problem regarding appropriate amounts of risk and resource allocation
(Hacker and Rotunda 1480).
Theoretically, it seems Ackermann, McEnally, and Ravenscraft’s claim regarding
incentive alignment is plausible. Incentive fee, and ownership structure can innately effect risk
and resource investment, thus affecting alignment of incentives. However, it seems that market
and governmental forces lack the influence necessary to affect manager and investor incentives.
However, theoretical implications are only the first step to understanding the world of hedge
funds, and empirical evidence is needed to draw a more accurate picture of this investment
medium.

Brady 14
Empirical Data
At present, hedge funds are not required to disclose specifics of their investment
practices. However, there are many funds that have voluntary disclosed specific fund
information and data which may include specifics such as particular investment styles,
managerial fee, and performance rankings. Such information is typically submitted to institutes
which store and organize such data into collective databases. Such information comes at cost to
the consumer with database access ranging from $1,000 to $6,000 depending on the type, and
duration, of subscription. As such, although private investment firms and/or academic
researchers may have available funds to acquire access to such databases, such a circumstance
was not a viable option for this paper. Because conducting original empirical research and/or
calculations is improbable given the lack of data, emphasis will be placed on previously
published articles featuring empirical analysis of hedge fund performance correlated with
aforementioned characteristics of incentive alignment. More specifically, the information
empirical evidence to follow is published in Ackermann, McEnally, and Ravenscraft’s article
“The Performance of Hedge Funds: Risk, Return, and Incentives.”
There are various institutions that collect information on hedge funds, two of the most
notable databases are Managed Account Reports, Inc. (MAR) and Hedge Fund Research, Inc.
(HFR), which are the databases used by Ackermann, McEnally, and Ravenscraft. The initial step
in evaluating empirical hedge fund performance is the creation of a covariance matrix which will
exemplify correlation between various aspects of hedge funds (Appendix A). The featured
covariance matrix exemplifies possible correlations between annual management fee (MGT),
Incentive fee (INCENT), size (SIZE), age (AGE), United States located (US), Event Driven
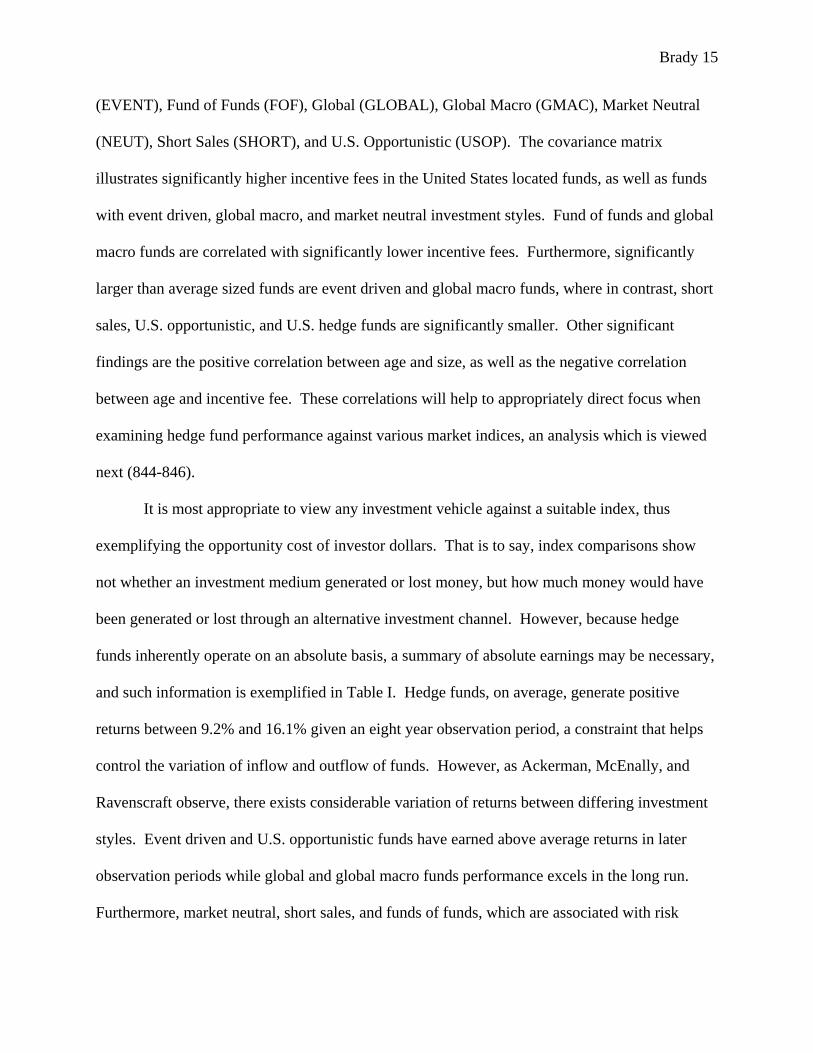
Brady 15
(EVENT), Fund of Funds (FOF), Global (GLOBAL), Global Macro (GMAC), Market Neutral
(NEUT), Short Sales (SHORT), and U.S. Opportunistic (USOP). The covariance matrix
illustrates significantly higher incentive fees in the United States located funds, as well as funds
with event driven, global macro, and market neutral investment styles. Fund of funds and global
macro funds are correlated with significantly lower incentive fees. Furthermore, significantly
larger than average sized funds are event driven and global macro funds, where in contrast, short
sales, U.S. opportunistic, and U.S. hedge funds are significantly smaller. Other significant
findings are the positive correlation between age and size, as well as the negative correlation
between age and incentive fee. These correlations will help to appropriately direct focus when
examining hedge fund performance against various market indices, an analysis which is viewed
next (844-846).
It is most appropriate to view any investment vehicle against a suitable index, thus
exemplifying the opportunity cost of investor dollars. That is to say, index comparisons show
not whether an investment medium generated or lost money, but how much money would have
been generated or lost through an alternative investment channel. However, because hedge
funds inherently operate on an absolute basis, a summary of absolute earnings may be necessary,
and such information is exemplified in Table I. Hedge funds, on average, generate positive
returns between 9.2% and 16.1% given an eight year observation period, a constraint that helps
control the variation of inflow and outflow of funds. However, as Ackerman, McEnally, and
Ravenscraft observe, there exists considerable variation of returns between differing investment
styles. Event driven and U.S. opportunistic funds have earned above average returns in later
observation periods while global and global macro funds performance excels in the long run.
Furthermore, market neutral, short sales, and funds of funds, which are associated with risk
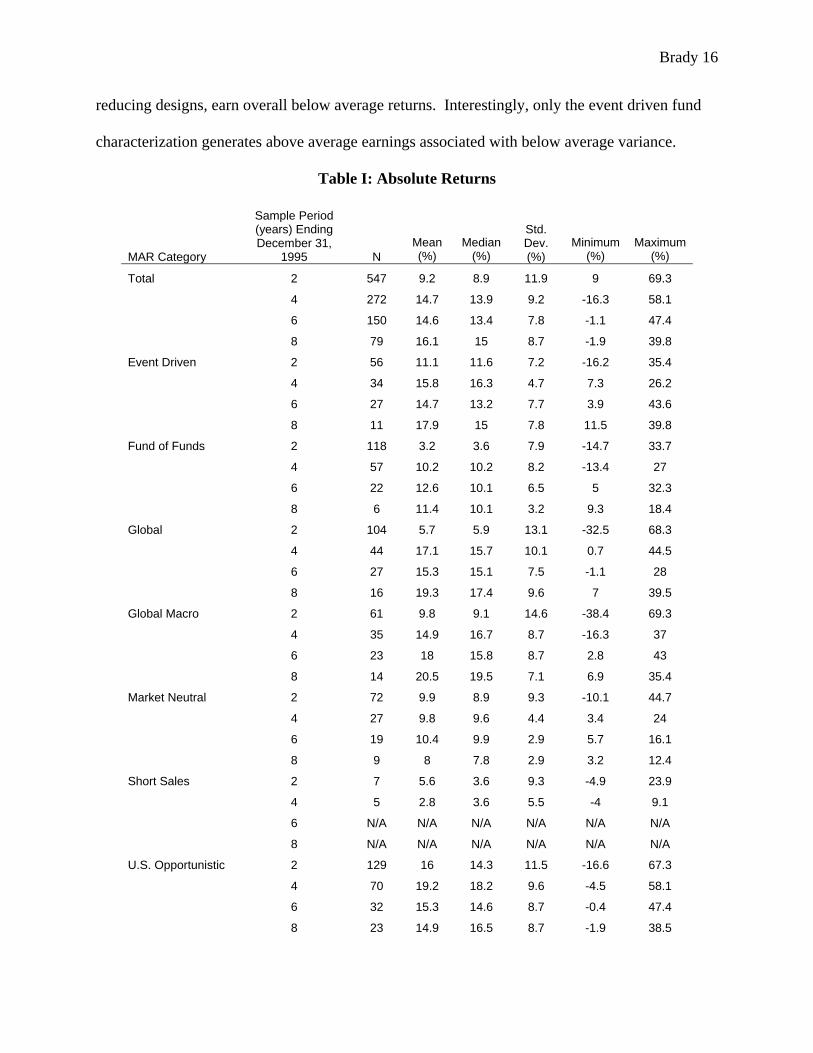
Brady 16
reducing designs, earn overall below average returns. Interestingly, only the event driven fund
characterization generates above average earnings associated with below average variance.
Table I: Absolute Returns
MAR Category
Sample Period (years) Ending December 31,
1995 N Mean (%)
Median (%)
Std. Dev. (%)
Minimum (%)
Maximum (%)
Total 2 547 9.2 8.9 11.9 9 69.3
4 272 14.7 13.9 9.2 -16.3 58.1
6 150 14.6 13.4 7.8 -1.1 47.4
8 79 16.1 15 8.7 -1.9 39.8
Event Driven 2 56 11.1 11.6 7.2 -16.2 35.4
4 34 15.8 16.3 4.7 7.3 26.2
6 27 14.7 13.2 7.7 3.9 43.6
8 11 17.9 15 7.8 11.5 39.8
Fund of Funds 2 118 3.2 3.6 7.9 -14.7 33.7
4 57 10.2 10.2 8.2 -13.4 27
6 22 12.6 10.1 6.5 5 32.3
8 6 11.4 10.1 3.2 9.3 18.4
Global 2 104 5.7 5.9 13.1 -32.5 68.3
4 44 17.1 15.7 10.1 0.7 44.5
6 27 15.3 15.1 7.5 -1.1 28
8 16 19.3 17.4 9.6 7 39.5
Global Macro 2 61 9.8 9.1 14.6 -38.4 69.3
4 35 14.9 16.7 8.7 -16.3 37
6 23 18 15.8 8.7 2.8 43
8 14 20.5 19.5 7.1 6.9 35.4
Market Neutral 2 72 9.9 8.9 9.3 -10.1 44.7
4 27 9.8 9.6 4.4 3.4 24
6 19 10.4 9.9 2.9 5.7 16.1
8 9 8 7.8 2.9 3.2 12.4
Short Sales 2 7 5.6 3.6 9.3 -4.9 23.9
4 5 2.8 3.6 5.5 -4 9.1
6 N/A N/A N/A N/A N/A N/A
8 N/A N/A N/A N/A N/A N/A
U.S. Opportunistic 2 129 16 14.3 11.5 -16.6 67.3
4 70 19.2 18.2 9.6 -4.5 58.1
6 32 15.3 14.6 8.7 -0.4 47.4
8 23 14.9 16.5 8.7 -1.9 38.5
Brady 17
Consequently, the absolute earnings summary demonstrates that hedge funds, with the exception
of event driven, can be classified by a standard risk-return trade off. That is to say, on average,
low earning funds are associated with low risk, or variance, while high earning funds are
associated with higher levels of risk, or variance (846).
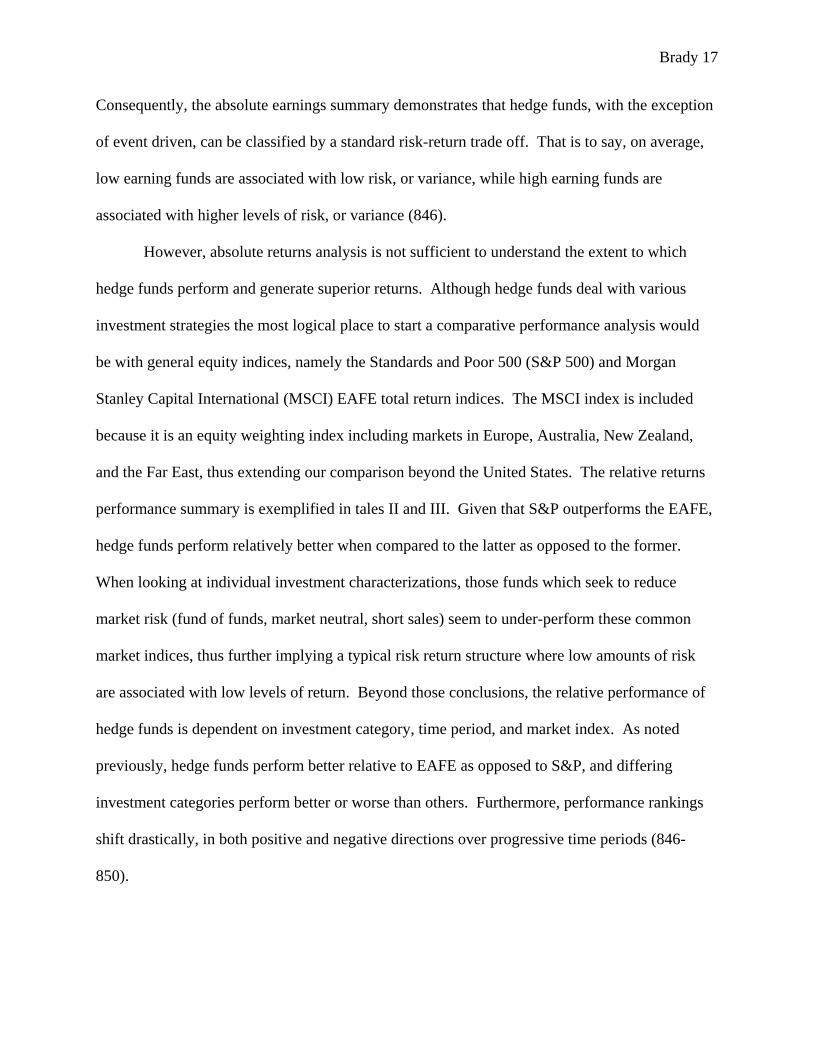
However, absolute returns analysis is not sufficient to understand the extent to which
hedge funds perform and generate superior returns. Although hedge funds deal with various
investment strategies the most logical place to start a comparative performance analysis would
be with general equity indices, namely the Standards and Poor 500 (S&P 500) and Morgan
Stanley Capital International (MSCI) EAFE total return indices. The MSCI index is included
because it is an equity weighting index including markets in Europe, Australia, New Zealand,
and the Far East, thus extending our comparison beyond the United States. The relative returns
performance summary is exemplified in tales II and III. Given that S&P outperforms the EAFE,
hedge funds perform relatively better when compared to the latter as opposed to the former.
When looking at individual investment characterizations, those funds which seek to reduce
market risk (fund of funds, market neutral, short sales) seem to under-perform these common
market indices, thus further implying a typical risk return structure where low amounts of risk
are associated with low levels of return. Beyond those conclusions, the relative performance of
hedge funds is dependent on investment category, time period, and market index. As noted
previously, hedge funds perform better relative to EAFE as opposed to S&P, and differing
investment categories perform better or worse than others. Furthermore, performance rankings
shift drastically, in both positive and negative directions over progressive time periods (846-
850).

Brady 18
Table II: Relative Performance – S&P 500 Index
Hedge Fund Annual Returns Relative to the S&P 500 Total
Return Index
MAR Category
Sample Period (in years) ending December 31,
1996 N Mean (%) p-Value Median (%) p-Value SD (%) Total 2 547 -10.30 0.00 -10.50 0.00 11.90
4 272 0.60 0.28 -0.30 0.54 9.20 6 150 0.60 0.37 -0.70 0.62 7.80 8 79 -0.40 0.68 -1.50 0.31 8.70
Event Driven 2 56 -8.30 0.00 -7.80 0.00 7.20 4 34 1.60 0.05 2.10 0.09 4.70 6 27 0.70 0.66 -0.80 0.62 7.70 8 11 1.40 0.59 -1.60 0.76 7.80
Fund of Funds 2 118 -16.30 0.00 -15.80 0.00 7.90 4 57 -3.90 0.00 -3.90 0.00 8.20 6 22 -1.40 0.34 -3.90 0.15 6.50 8 6 -5.10 0.02 -6.40 0.06 3.20
Global 2 104 -13.70 0.00 -13.50 0.00 13.10 4 44 2.90 0.06 1.60 0.14 10.10 6 27 1.30 0.40 1.10 0.45 7.50 8 16 2.70 0.29 0.80 0.29 9.60
Global Macro 2 61 -9.60 0.00 -10.30 0.00 14.60 4 35 0.70 0.62 2.50 0.23 8.70 6 23 4.00 0.04 1.80 0.03 8.70 8 14 4.00 0.06 2.90 0.06 7.10
Market Neutral 2 72 -9.60 0.00 -10.50 0.00 9.30 4 27 -4.40 0.00 -4.60 0.00 4.40 6 19 -3.60 0.00 -4.20 0.00 2.90 8 9 -8.60 0.00 -8.70 0.00 2.90
Short Sales 2 7 -13.80 0.01 -15.80 0.03 9.30 4 5 -11.30 0.01 -10.50 0.06 5.50 6 N/A N/A N/A N/A N/A N/A 8 N/A N/A N/A N/A N/A N/A
U.S. Opportunistic 2 129 -3.40 0.00 -5.10 0.00 11.50 8 70 5.00 0.00 4.00 0.00 9.60 6 32 1.30 0.42 0.60 0.60 8.70 8 23 -1.70 0.38 0.00 0.42 8.70

Brady 19
Table III: Relative Performance – EAFE Total Return Index
Hedge Fund Annual Returns Relative to the MSCI
EAFE Total Return Index
MAR Category
Sample Period (in years) ending
December 31, 1996 N Mean (%)
p-Value Median (%)
p-Value
SD (%)
Total 2 547 -0.60 0.21 -0.90 0.01 11.90 4 272 4.60 0.00 3.70 0.00 9.20 6 150 9.60 0.00 8.40 0.00 7.80 8 79 7.50 0.00 6.30 0.00 8.70
Event Driven 2 56 1.30 0.19 1.80 0.07 7.20 4 34 5.60 0.00 6.10 0.00 4.70 6 27 9.70 0.00 8.20 0.00 7.70 8 11 9.20 0.00 6.30 0.00 7.80
Fund of Funds 2 118 -6.60 0.00 -6.20 0.00 7.90 4 57 0.00 0.98 0.10 0.80 8.20 6 22 7.60 0.00 5.10 0.00 6.50 8 6 2.80 0.11 1.50 0.03 3.20
Global 2 104 -4.10 0.00 -3.90 0.00 13.10 4 44 6.90 0.00 5.60 0.00 10.10 6 27 10.30 0.00 10.10 0.00 7.50 8 16 10.60 0.00 8.70 0.00 9.60
Global Macro 2 61 0.00 0.99 -0.70 0.95 14.60 4 35 4.70 0.00 6.50 0.00 8.70 6 23 13.00 0.00 10.90 0.00 8.70 8 14 11.80 0.00 10.80 0.00 7.10
Market Neutral 2 72 0.10 0.96 -0.90 0.56 9.30 4 27 -0.40 0.65 -0.60 0.36 4.40 6 19 5.50 0.00 4.90 0.00 2.90 8 9 -0.70 0.52 -0.80 0.57 2.90
Short Sales 2 7 -4.20 0.31 -6.20 0.30 9.30 4 5 -7.30 0.06 -6.50 0.06 5.50 6 N/A N/A N/A N/A N/A N/A 8 N/A N/A N/A N/A N/A N/A
U.S. Opportunistic 2 129 6.30 0.00 4.50 0.00 11.50
8 70 9.00 0.00 8.00 0.00 9.60 6 32 10.30 0.00 9.60 0.00 8.70 8 23 6.20 0.00 7.80 0.00 8.70

Brady 20
Although the aforementioned tables seem to enlighten the manner in which hedge funds
perform relative to market indices, Ackerman, McEnally, and Ravenscraft claim,
the preceding analysis ignores differences in risk between hedge funds and the various indices. Hedge funds may be enhancing returns by taking on extra risk. Alternatively, some hedge funds are designed to reduce risk. (850)
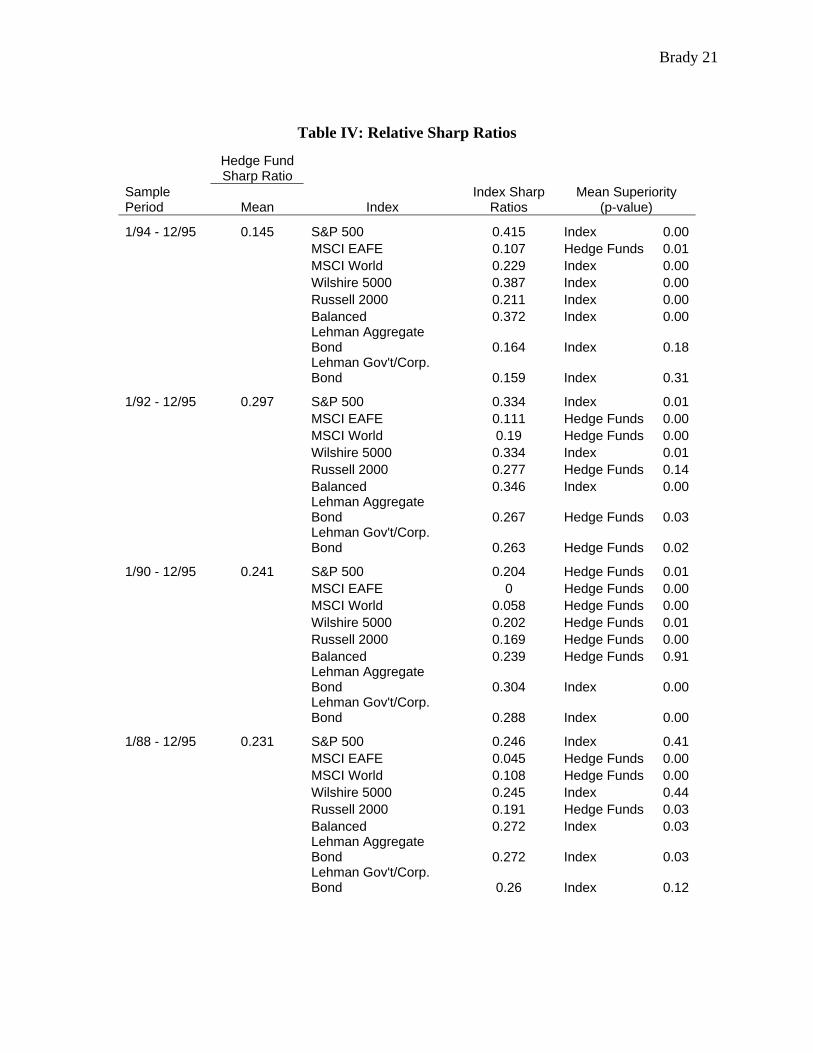
Thus, total risk must be considered using traditional Sharp ratios. The sharp ratio is difference in
returns between hedge fund and a risk free investment, divided by the volatility of the hedge
fund compared to a risk free alternative (Bodie, Kane, and Marcus 529). Essentially, sharp ratios
denote a reward-to-volatility ratio where bigger is better (Bodie, Kane, and Marcus 529-530).
The traditional sharp ratio accountability measure is presented in Table IV; Although Ackerman,
McEnally, and Ravenscraft include a median based superiority analysis also, the mean and
median results are nearly identical, and therefore only the mean based superiority performance
rankings are included. The results of this analysis exemplify little more than the standard index
comparisons where hedge funds performance is a mix between underperforming and
outperforming standard equity and bond indices, even when accounting for risk differentials.
Actually, it seems that the various indices may have a comparative edge over hedge funds in the
superior performance analysis, where 35 of the 64 indices outperform the general hedge fund
category. However, one important characteristic to note is that hedge fund performance is post
fee and/or expenses, and therefore although indices seem to posses comparative advantage over
hedge funds, such indices do not account for costs and/or expenses of investment. It may be that
hedge funds net returns actually outweigh those of the aforementioned standard indices (850-
853).
Brady 21
Table IV: Relative Sharp Ratios
Hedge Fund Sharp Ratio
Sample Period Mean Index
Index Sharp Ratios
Mean Superiority (p-value)
1/94 - 12/95 0.145 S&P 500 0.415 Index 0.00 MSCI EAFE 0.107 Hedge Funds 0.01 MSCI World 0.229 Index 0.00 Wilshire 5000 0.387 Index 0.00 Russell 2000 0.211 Index 0.00 Balanced 0.372 Index 0.00
Lehman Aggregate Bond 0.164 Index 0.18
Lehman Gov't/Corp. Bond 0.159 Index 0.31
1/92 - 12/95 0.297 S&P 500 0.334 Index 0.01 MSCI EAFE 0.111 Hedge Funds 0.00 MSCI World 0.19 Hedge Funds 0.00 Wilshire 5000 0.334 Index 0.01 Russell 2000 0.277 Hedge Funds 0.14 Balanced 0.346 Index 0.00
Lehman Aggregate Bond 0.267 Hedge Funds 0.03
Lehman Gov't/Corp. Bond 0.263 Hedge Funds 0.02
1/90 - 12/95 0.241 S&P 500 0.204 Hedge Funds 0.01 MSCI EAFE 0 Hedge Funds 0.00 MSCI World 0.058 Hedge Funds 0.00 Wilshire 5000 0.202 Hedge Funds 0.01 Russell 2000 0.169 Hedge Funds 0.00 Balanced 0.239 Hedge Funds 0.91
Lehman Aggregate Bond 0.304 Index 0.00
Lehman Gov't/Corp. Bond 0.288 Index 0.00
1/88 - 12/95 0.231 S&P 500 0.246 Index 0.41 MSCI EAFE 0.045 Hedge Funds 0.00 MSCI World 0.108 Hedge Funds 0.00 Wilshire 5000 0.245 Index 0.44 Russell 2000 0.191 Hedge Funds 0.03 Balanced 0.272 Index 0.03
Lehman Aggregate Bond 0.272 Index 0.03
Lehman Gov't/Corp. Bond 0.26 Index 0.12

Brady 22
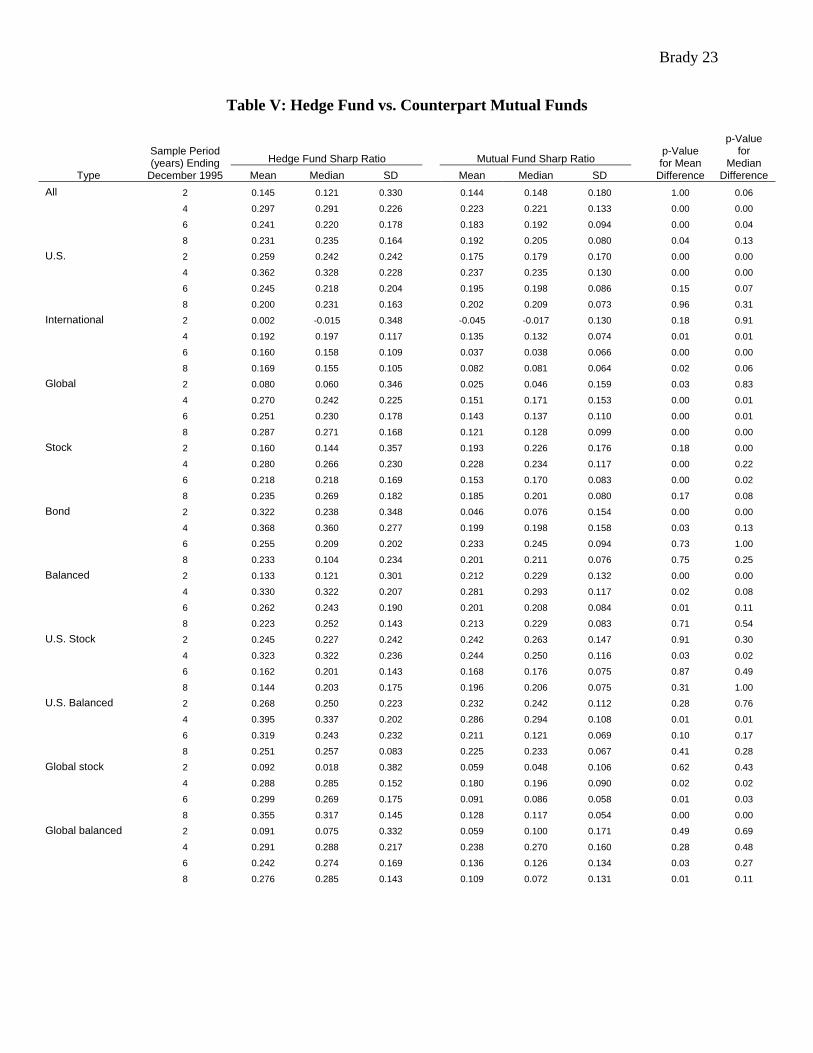
Empirical analysis is further advanced by comparing hedge funds to mutual funds. Such
a comparison is important because hedge funds and mutual funds are similar in many respects;
however differ in important characteristics and performance comparisons may help to shed light
on the benefits or costs of such characteristic differences. Because some MAR categories of
hedge funds do not have equivalent counterpart mutual funds, namely short sales and market
neutral, they are supplemented with additions categories. (1) Stock, bond, or balanced – Funds
are assigned to stock or bond categories depending on the proportion of portfolio that is devoted
to stocks and/or bonds, if they equally weight stocks and bonds then they are placed in the
balanced category. (2) United States, international, and global – depending on the geographical
location where the majority of investments are centered funds are categorized as United States or
international, and if investments are balanced across geographical location they are considered
global. Based on availability of data, categories are further divided into U.S. stock, U.S.
balanced, global stock, and global balanced for more robust results. The results of this
comparison are exemplified in Table V. When hedge funds are compared to equivalent
counterpart mutual funds it seems as though hedge funds posses an insidious comparative
advantage, although significance tests with p-values for mean and median superiority differences
in 8-year samples are inconsistent due to diminished sample size. Hedge funds show
significantly superior returns for 36 of 80 categorical comparisons (854-857).
Brady 23
Table V: Hedge Fund vs. Counterpart Mutual Funds
Hedge Fund Sharp Ratio Mutual Fund Sharp Ratio
Type
Sample Period (years) Ending
December 1995 Mean Median SD Mean Median SD
p-Value for Mean
Difference
p-Value for
Median Difference
All 2 0.145 0.121 0.330 0.144 0.148 0.180 1.00 0.06
4 0.297 0.291 0.226 0.223 0.221 0.133 0.00 0.00
6 0.241 0.220 0.178 0.183 0.192 0.094 0.00 0.04
8 0.231 0.235 0.164 0.192 0.205 0.080 0.04 0.13
U.S. 2 0.259 0.242 0.242 0.175 0.179 0.170 0.00 0.00
4 0.362 0.328 0.228 0.237 0.235 0.130 0.00 0.00
6 0.245 0.218 0.204 0.195 0.198 0.086 0.15 0.07
8 0.200 0.231 0.163 0.202 0.209 0.073 0.96 0.31
International 2 0.002 -0.015 0.348 -0.045 -0.017 0.130 0.18 0.91
4 0.192 0.197 0.117 0.135 0.132 0.074 0.01 0.01
6 0.160 0.158 0.109 0.037 0.038 0.066 0.00 0.00
8 0.169 0.155 0.105 0.082 0.081 0.064 0.02 0.06
Global 2 0.080 0.060 0.346 0.025 0.046 0.159 0.03 0.83
4 0.270 0.242 0.225 0.151 0.171 0.153 0.00 0.01
6 0.251 0.230 0.178 0.143 0.137 0.110 0.00 0.01
8 0.287 0.271 0.168 0.121 0.128 0.099 0.00 0.00
Stock 2 0.160 0.144 0.357 0.193 0.226 0.176 0.18 0.00
4 0.280 0.266 0.230 0.228 0.234 0.117 0.00 0.22
6 0.218 0.218 0.169 0.153 0.170 0.083 0.00 0.02
8 0.235 0.269 0.182 0.185 0.201 0.080 0.17 0.08
Bond 2 0.322 0.238 0.348 0.046 0.076 0.154 0.00 0.00
4 0.368 0.360 0.277 0.199 0.198 0.158 0.03 0.13
6 0.255 0.209 0.202 0.233 0.245 0.094 0.73 1.00
8 0.233 0.104 0.234 0.201 0.211 0.076 0.75 0.25
Balanced 2 0.133 0.121 0.301 0.212 0.229 0.132 0.00 0.00
4 0.330 0.322 0.207 0.281 0.293 0.117 0.02 0.08
6 0.262 0.243 0.190 0.201 0.208 0.084 0.01 0.11
8 0.223 0.252 0.143 0.213 0.229 0.083 0.71 0.54
U.S. Stock 2 0.245 0.227 0.242 0.242 0.263 0.147 0.91 0.30
4 0.323 0.322 0.236 0.244 0.250 0.116 0.03 0.02
6 0.162 0.201 0.143 0.168 0.176 0.075 0.87 0.49
8 0.144 0.203 0.175 0.196 0.206 0.075 0.31 1.00
U.S. Balanced 2 0.268 0.250 0.223 0.232 0.242 0.112 0.28 0.76
4 0.395 0.337 0.202 0.286 0.294 0.108 0.01 0.01
6 0.319 0.243 0.232 0.211 0.121 0.069 0.10 0.17
8 0.251 0.257 0.083 0.225 0.233 0.067 0.41 0.28
Global stock 2 0.092 0.018 0.382 0.059 0.048 0.106 0.62 0.43
4 0.288 0.285 0.152 0.180 0.196 0.090 0.02 0.02
6 0.299 0.269 0.175 0.091 0.086 0.058 0.01 0.03
8 0.355 0.317 0.145 0.128 0.117 0.054 0.00 0.00
Global balanced 2 0.091 0.075 0.332 0.059 0.100 0.171 0.49 0.69
4 0.291 0.288 0.217 0.238 0.270 0.160 0.28 0.48
6 0.242 0.274 0.169 0.136 0.126 0.134 0.03 0.27
8 0.276 0.285 0.143 0.109 0.072 0.131 0.01 0.11
Brady 24
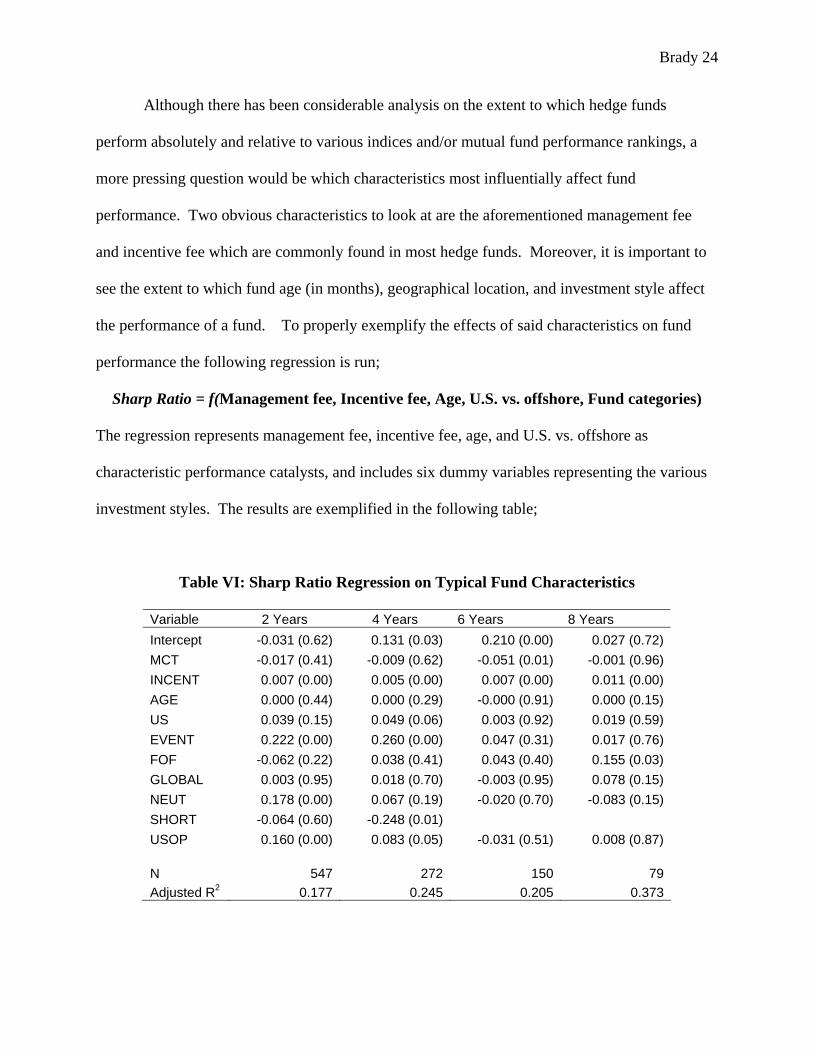
Although there has been considerable analysis on the extent to which hedge funds
perform absolutely and relative to various indices and/or mutual fund performance rankings, a
more pressing question would be which characteristics most influentially affect fund
performance. Two obvious characteristics to look at are the aforementioned management fee
and incentive fee which are commonly found in most hedge funds. Moreover, it is important to
see the extent to which fund age (in months), geographical location, and investment style affect
the performance of a fund. To properly exemplify the effects of said characteristics on fund
performance the following regression is run;
Sharp Ratio = f(Management fee, Incentive fee, Age, U.S. vs. offshore, Fund categories)
The regression represents management fee, incentive fee, age, and U.S. vs. offshore as
characteristic performance catalysts, and includes six dummy variables representing the various
investment styles. The results are exemplified in the following table;
Table VI: Sharp Ratio Regression on Typical Fund Characteristics
Variable 2 Years 4 Years 6 Years 8 Years Intercept -0.031 (0.62) 0.131 (0.03) 0.210 (0.00) 0.027 (0.72)MCT -0.017 (0.41) -0.009 (0.62) -0.051 (0.01) -0.001 (0.96)INCENT 0.007 (0.00) 0.005 (0.00) 0.007 (0.00) 0.011 (0.00)AGE 0.000 (0.44) 0.000 (0.29) -0.000 (0.91) 0.000 (0.15)US 0.039 (0.15) 0.049 (0.06) 0.003 (0.92) 0.019 (0.59)EVENT 0.222 (0.00) 0.260 (0.00) 0.047 (0.31) 0.017 (0.76)FOF -0.062 (0.22) 0.038 (0.41) 0.043 (0.40) 0.155 (0.03)GLOBAL 0.003 (0.95) 0.018 (0.70) -0.003 (0.95) 0.078 (0.15)NEUT 0.178 (0.00) 0.067 (0.19) -0.020 (0.70) -0.083 (0.15)SHORT -0.064 (0.60) -0.248 (0.01)USOP 0.160 (0.00) 0.083 (0.05) -0.031 (0.51) 0.008 (0.87) N 547 272 150 79Adjusted R2 0.177 0.245 0.205 0.373

Brady 25
The most important coefficient to note is that of incentive fee. As exemplified previously, there
is a considerable amount of theoretical evidence that suggests incentive fee would play an
influential role fund performance because it can induce inefficient amounts of risk and/or
resource allocation. The sharp ratio regressions show that incentive fee is a significant
characteristic of fund performance in all four time periods. Ackerman, McEnally, and
Ravenscraft claim that moving from a fund with no incentive fee to one with a 20% incentive
fee, a common compensation agreement in most funds, increases the sharp ratio 0.15 on average
(855-860).
Also essential to understanding fund characteristics is their effect on fund volatility. The
following table shows regression results using the same characteristics and dummy variables as
the aforementioned regression analysis. However, the dependent variable in this regression is
the natural log of standard deviation of hedge fund total returns. The results are exemplified in
the following table.
Table VII: Volatility Regression Table
Variable 2 Years 4 Years 6 Years 8 Years Intercept -3.478 (0.00) -3.309 (0.00) -3.545 (0.00) -3.201 (0.00)MCT 0.115 (0.00) 0.080 (0.11) 0.141 (0.03) 0.064 (0.43)INCENT 0.002 (0.57) 0.001 (0.76) 0.002 (0.73) -0.006 (0.37)AGE -0.001 (0.31) -0.001 (0.33) 0.001 (0.48) 0.001 (0.63)US -0.079 (0.13) -0.185 (0.01) -0.190 (0.04) -0.201 (0.12)EVENT -0.737 (0.00) -0.712 (0.00) -0.452 (0.00) -0.327 (0.09)FOF -0.382 (0.00) -0.452 (0.00) -0.454 (0.01) -1.048 (0.00)GLOBAL 0.115 (0.22) 0.182 (0.14) 0.195 (0.22) -0.005 (0.98)NEUT -0.644 (0.00) -0.595 (0.00) -0.403 (0.01) -0.475(0.02)SHORT 0.333 (0.15) 0.347 (0.16)USOP -0.001 (0.99) 0.025 (0.82) 0.122 (0.40) -0.149 (0.39) N 547 272 150 79Adjusted R2 0.234 0.31 0.274 0.285
Brady 26
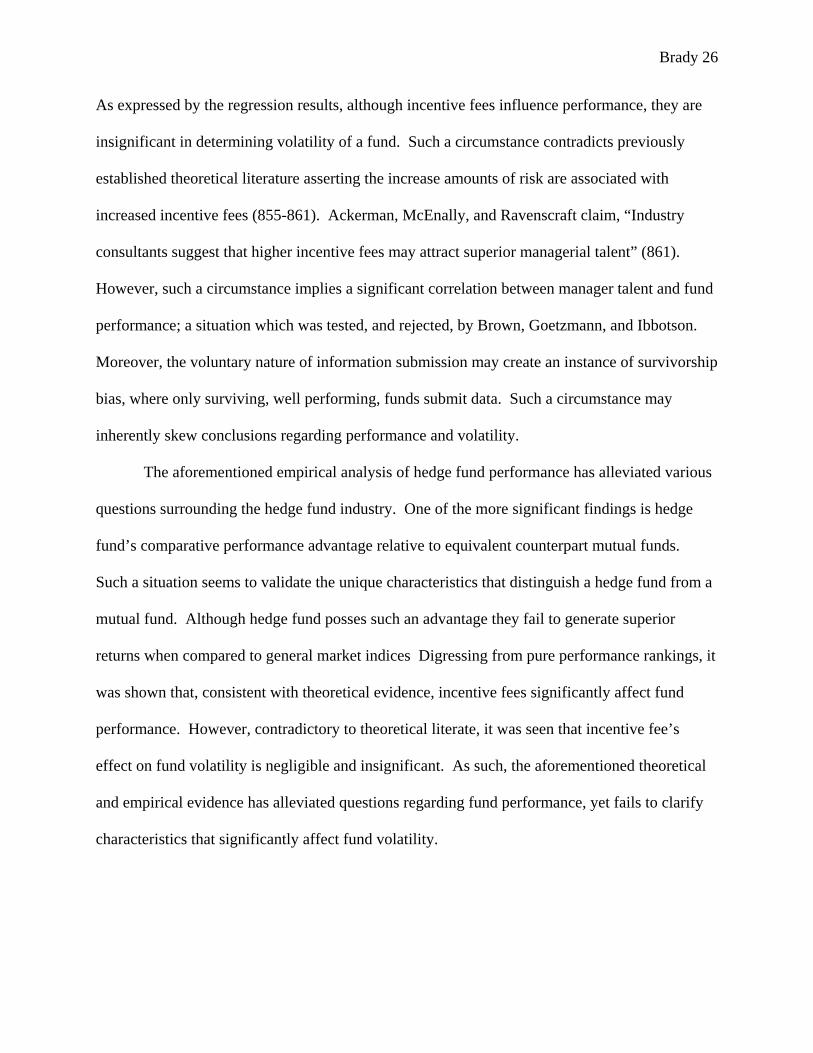
As expressed by the regression results, although incentive fees influence performance, they are
insignificant in determining volatility of a fund. Such a circumstance contradicts previously
established theoretical literature asserting the increase amounts of risk are associated with
increased incentive fees (855-861). Ackerman, McEnally, and Ravenscraft claim, “Industry
consultants suggest that higher incentive fees may attract superior managerial talent” (861).
However, such a circumstance implies a significant correlation between manager talent and fund
performance; a situation which was tested, and rejected, by Brown, Goetzmann, and Ibbotson.
Moreover, the voluntary nature of information submission may create an instance of survivorship
bias, where only surviving, well performing, funds submit data. Such a circumstance may
inherently skew conclusions regarding performance and volatility.
The aforementioned empirical analysis of hedge fund performance has alleviated various
questions surrounding the hedge fund industry. One of the more significant findings is hedge
fund’s comparative performance advantage relative to equivalent counterpart mutual funds.
Such a situation seems to validate the unique characteristics that distinguish a hedge fund from a
mutual fund. Although hedge fund posses such an advantage they fail to generate superior
returns when compared to general market indices Digressing from pure performance rankings, it
was shown that, consistent with theoretical evidence, incentive fees significantly affect fund
performance. However, contradictory to theoretical literate, it was seen that incentive fee’s
effect on fund volatility is negligible and insignificant. As such, the aforementioned theoretical
and empirical evidence has alleviated questions regarding fund performance, yet fails to clarify
characteristics that significantly affect fund volatility.

Brady 27
Long-Term Capital Management – The Specifics of Failure
Having examined both theoretical and empirical evidence of hedge fund performance, it
has yet to be established what factors may cause hedge fund volatility, if any. As such, it may be
beneficial to examine a specific case of fund failure, the most notable being Long-Term Capital
Management. Long-Term Capital Manages a hedge fund called Long-Term Capital Portfolio
that centralized its investment strategy around U.S., Japanese, and European markets, among
others. LTCM’s trader’s were considered some of the best in the industry in the mid 1990’s,
generating net-fee returns of 33.7 percent where the S&P 500 index generated a 29.3 percent
return, an index that fails to incorporate transaction costs and/or investment fees (Eichengreen
and Mathieson IMF).
LTCM used an extensively complicated leverage system on bond, swap, and options
positions to generate high rates of return based on small depreciations in their relative prices.
Furthermore, LTCM borrowed large levels of illiquid, low value, equities paired against short
selling highly liquid, high-quality, securities; such positions were financed through various
international and investment banks. The extreme leveraged investment strategy created a
circumstance where LTCM held an amount of capital equaling $4.8 billion, yet managed a
balance sheet of investment positions equaling $120 billion, 25 times capital to investment.
Individuals familiar with the LTCM portfolio claim that such leveraged positions increased as
the security spread widened, believing that such spreads must inevitably contract. However,
contractions did not occur, rather widened, creating significantly increased levels of market
volatility (Eichengreen and Mathieson IMF).
At one point, LTCM’s net asset value stood at $600 million with a balance-sheet showing
investment positions totaling to $100 billion, a leverage of 167 times capital. Due to the

Brady 28
centralized investment positions surrounding various derivates, investment vehicles which are
exempt from bankruptcy provisions, a disorderly liquidation of LTCM carried potentially
disastrous implications for global markets due to mass liquidation of the aforementioned
derivative positions (Eichengreen and Mathieson IMF).
Such a circumstance caused the Federal Reserve Bank of New York (FRBNY) to
intervene, advising the need for a private sector rescue. The immediate and sudden liquidation
of LTCM assets created a potential situation of significant market disruption. The FRBNY
coordinated a $3.6 billion private sector rescue designed to create an orderly unraveling of
LTCM investment positions. Because much of the private sector creditors involved in the rescue
would have been involved in the deleveraging of LTCM, the private-sector solution can be
viewed as reorganization where major creditors became new owners (Eichengreen and
Mathieson IMF).
In the situation of LTCM, it seems that fund volatility was created by an over-leveraging
of assets. Moreover, it was noted earlier that the hedge fund industry witnessed massive fund
failures in the mid 1900’s when the medium moved away from hedging and towards a
centralized leveraging strategy. As such, it would seem probable to site a source of fund
volatility to the over-extensive leveraging investment style.
Alleviating The Problem: Eliminating Fund Failure and Volatility
Having examined the theoretical, empirical, and specific evidence surrounding the
possible contributions to hedge fund volatility, it must be clarified the extent to which hedge
funds are acceptable under current market circumstances. Although hedge funds seem to possess
a certain amount of volatility, there continued presence in the investment industry suggests there

Brady 29
exists available market demand for such risky investment vehicles. However, significant fund
failures imply that, although hedge funds are filling available market demand, additional
regulation, governmental or otherwise, may be necessary.
Initial theoretical literature focused on the extent to which contractual compensation
agreements affected fund performance. Such literature concluded that increased incentive fees
led to higher levels of associate risk, and bonus plans created an inefficient amount of expended
risk. It was further concluded that symmetric incentive plans create a more desired risk level but
an un-optimal amount of resource allocation. Given the aforementioned specifics of fund failure,
it would seem ideal to create a contractual compensation structure where a close to optimal
amount of risk is expelled in exchange for a possible un-optimal amount of resource allocation.
Symmetric incentive plans would be superior to joint-ownership structure because the latter can
potentially create a situation where the manager can not effectively manage the fund due to
his/her risk adverse nature. Furthermore, it has already been established that symmetric
incentive plans are superior to bonus plans. Thus, symmetric incentive structures seem ideal
given that joint-ownership induces too little risk where bonus plans induce too much.
Although it has been established that incentive fees probably play little role in the
volatility of hedge funds, an optimal risk premium on investment positions would seem to
necessarily alleviate any extreme leverage positions. Funds operating under optimal amounts of
risk allocation would no longer take extreme leverage positions, thus alleviating volatility on
world markets due to fund failure.
Dealing with issues of information, it was exemplified that hedge funds operate under an
extreme lack of information. Annual returns are not publicly held or published but are
voluntarily submitted to private institutions who organize such data into complex databases.
Brady 30
Such databases are then sold at a premium to any individuals willing to pay subscription prices
of $1,000-$6,000, creating a constraint to the availability of information. However, some may
claim that investors willing to invest $250,000-$1,000,000 probably view such subscription costs
as inconsequential. Nonetheless, submissions to such databases are voluntary and thus possibly
create a sufficiently biased information set.
Eichengreen and Mathieson claim that asymmetric information circumstances occur in
hedge fund crediting as well. They write, “Although major banks typically analyze detailed
financial statements before extending credit to hedge funds, regulators also recognize that others
lack the sophistication to understand fully all the risks associated with the hedge fund industry.”
Furthermore, hedge funds may not fully disclose information on particular investment positions
(Eichengreen and Mathieson IMF).
Further exasperating this chain of asymmetric and/or imperfect information is the manner
in which funds encounter inflows of money due to basic performance news (examples shown in
basic fund history), and the extent to which they may violate their SEC exemptions by recruiting
uninformed cliental. As such, it seems there exists the necessity to alleviate such information
gaps, thus allowing investors to make well informed investment decisions.
Conclusions
Hedge funds are undoubtedly an integral medium in the investment industry. Their
continued growth and success validates the necessity for an investment medium which employs a
more aggressive, and possibly more risky, investment strategy. However, there exists a tipping
point when excessive fund risk, and correlated volatility, negate their necessity to hold market
share. Fund characteristics that deviate incentives, extensive leverage positions, and

Brady 31
asymmetrical information create potential market volatility, creating the potential for market
disruption. As such, although funds are filling available market demand, greater regulation is
needed. Requiring funds to employ symmetric incentive plans would better align investor and
managerial risk incentive, thus likely decreasing instances of fund failure and/or volatility.
Moreover, more efficient monitoring of registration exemption paired with required periodic
performance filings would likely alleviate certain instances of asymmetrical information leading
to fund failure and/or volatility. Hedge funds are undoubtedly an interesting and unique
investment medium; however there seems to be room for improvement.
Brady 32
Works Cited
Ackermann, Carl, Richard McEnally, and David Ravenscraft. "The Performance of Hedge
Funds: Risk, Return, and Incentives." The Journal of Finance 54 (1999): 833-875. 1 Feb.
2006 <www.jstor.org>.
Bodie, Zvi, Alex Kane, and Alan J. Marcus. Essentials of Investments. 3rd ed. Irwin McGraw-
Hill, 1998.
Brown, Stephen J., William N. Goetzmann, and Rodger G. Ibbotson. "Offshore Hedge Funds:
Survival and Performance 1989-1995." The Journal of Business 72 (1999): 91-117.
Journal Storage. UCSD, San Diego.
Carpenter, Jennifer N. The Optimal Investment Policy for a Fund Manager Compensated with an
Incentive Fee. Diss. New York Univ., 1995.
Dugan, Ianthe J. "Hedge Funds Draw Scrutiny Over Merger Play." The Wall Street Journal 11
Jan. 2006. 15 Jan. 2006 <http://online.wsj.com/home/us>.
Eichengreen, Barry, Donald Mathieson, Bankim Chadha, Anne Jansen, Laura Kodres, and Sunil
Sharma. Hedge Funds and Financial Market Dynamics. Washington DC: International
Monetary Fund, 1998.
Eichengreen, Barry, and Donald Mathieson. International Monetary Fund. Hedge Funds: What
Do We Really Know? Sept. 1999. 1 Mar. 2006
<http://www.imf.org/external/pubs/ft/issues/issues19/index.htm>.
Hacker, Robert C., and Ronald D. Rotunda. "SEC Registration of Private Investment
Partnerships After Aprahamson Vs. Fleschner." Columbia Law Review 78 (1978): 1471-
1489. Journal Storage. UCSD, San Diego. 1 May 2006.
"Hedge Fund." Investopidia.com. 1996. 10 Jan. 2006 <http://www.investopedia.com/>.
Brady 33
Ippolito, Richard A. "Reaction to Measures of Poor Quality: Evidence From the Mutual Fund
Industry." Journal of Law and Economics 35 (1992): 45-70. Journal Storage. UCSD, San
Diego. 4 Apr. 2006.
Lhaitant, Fancois-Sege. Hedge Funds. New York: John Wiley & Sons Ltd., 1988.
McWhinney, Jim. "A Brief History of the Hedge Fund." Investopedia. 8 Nov. 2005. 1 Feb. 2006
<http://www.investopedia.com>.
Ross, Stephen A. "The Economic Theory of Agency: the Principal's Problem." The American
Economic Review 63 (1973): 134-139. Journal Storage. UCSD, San Diego. 1 Apr. 2006.
Sirri, Erik R., and Peter Tufano. "Costly Search and Mutual Fund Flows." The Journal of
Finance 53 (1998): 1589-1622. Journal Storage. UCSD, San Diego. 2 June 2006.
Starks, Laura T. "Performance Incentive Fees: an Agency Theoretic Approach." The Journal of
Financial and Quantitative Analysis 22 (1987): 17-32. Journal Storage. UCSD, San
Diego. 1 Apr. 2006.
United States of America. Securities Exchange Commission. Investment Advisors Act of 1940. 1
June 2006.
United States of America. Securities Exchange Commission. The Investor's Advocate: How the
SEC Protects Investors, Maintains Market Integrity, and Facilitates Capital Formation. 12
Apr. 2006 <http://www.sec.gov/about/whatwedo.shtml>.
United States of America. United States Securities and Exchange Commission. Securities
Exchange Act of 1934. 5 May 2006
<http://www.sec.gov/divisions/corpfin/34act/index1934.shtml>.
Zuckerman, Gregory. "Hedge Funds Grow Popular With Investors." The Wall Street Journal 3
Jan. 2006. 10 Jan. 2006 <http://online.wsj.com/home/us>.

Brady 34

Brady 35
App
endi
x A
Ack
erm
an, M
cEna
lly, R
aven
scra
ft (8
45)
Top Related