


Languages
Pages
Legal


Heat-Related Mortality in Washington State: Past
and Future
The Washington Climate Change Impacts Assessment Conference
February 12, 2009
J. Elizabeth JacksonUniversity of Washington

Heat: Core Public Health Concern Heat waves linked with hundreds of deaths
in the United States annually
Chicago, 1995: estimated 700 deaths Europe, 2003: estimated 30,000 deaths UK, 2003: estimated 2,000 deaths

Heat: Core Public Health Concern Heat waves linked with hundreds of deaths
in the United States annually
Heat waves projected to increase in frequency, duration and intensity

Heat: Core Public Health Concern Heat waves linked with hundreds of deaths
in the United States annually
Heat waves projected to increase in frequency, duration and intensity
Heat-related mortality is likely under-reported

Heat: Core Public Health Concern Heat waves linked with hundreds of deaths
in the United States annually
Heat waves projected to increase in frequency, duration and intensity
Heat-related mortality is likely under-reported
What about Washington State?

Thermal Stress Hyperthermia: the body cannot dissipate
heat absorbed from the environment (CDC, 2005)

Thermal Stress Hyperthermia: the body cannot dissipate
heat absorbed from the environment (CDC, 2005)
Vulnerable Groups Elderly Urban residents Those with chronic or mental illnesses The poor, the socially isolated Outdoor laborers

Other VulnerabilitiesMajor cities of Washington State are particularly at risk for high mortality during heat waves
Milder summers = less adaptation to heat Little residential air conditioning Heat Island Effect

Analytic Goals Establish historical relationship between
heat events and mortality (1980-2006)

Analytic Goals Establish historical relationship between
heat events and mortality (1980-2006)
Estimate future mortality due to heat, i.e., “excess deaths” (2025, 2045, 2085)

Analytic Goals Establish historical relationship between
heat events and mortality (1980-2006)
Estimate future mortality due to heat, i.e., “excess deaths” (2025, 2045, 2085)
Customize estimates for 4 study areas: Greater Seattle Area (King, Pierce, Snohomish) Spokane Tri-cities (Benton, Franklin) Yakima

Measuring Heat Events Humidex: combined effects of heat and
humidity
Heat event threshold: hottest 1% of all days (99th percentile humidex)
Heat Events: Counted the number of heat events and the duration of each heat event
Three climate change scenarios: high, moderate and low summer warming
Measuring Mortality Outcome: daily mortality rate, May-
September (= deaths/population)
Age groups: 45 and older; 65 and older; 85 and older
Causes of death All non-traumatic causes Circulatory, Cardiovascular, Respiratory (not
presented)

Method: Historical RelationshipRelative Risk of death during a heat event =
Mean Daily Mortality Rate(heat event)
Mean Daily Mortality Rate(non-event)
If RR > 1, then risk of death is greater during heat events

Method: Future Excess MortalityExcess deaths during future heat events are calculated from:
Baseline Mortality Rate Risk of death during heat event Future population Climate change
Mean Daily Mortality Rate(non-event) *(Relative Risk – 1)* Projected Population*Projected Heat Events

Baseline Population Parameters
Greater Seattle Area Eastern Washington
0.0
0.5
1.0
1.5
2.0
2.5
3.0
3.5
4.0
1980 2006 1980 2006
Yakima
Tri-cities
Spokane
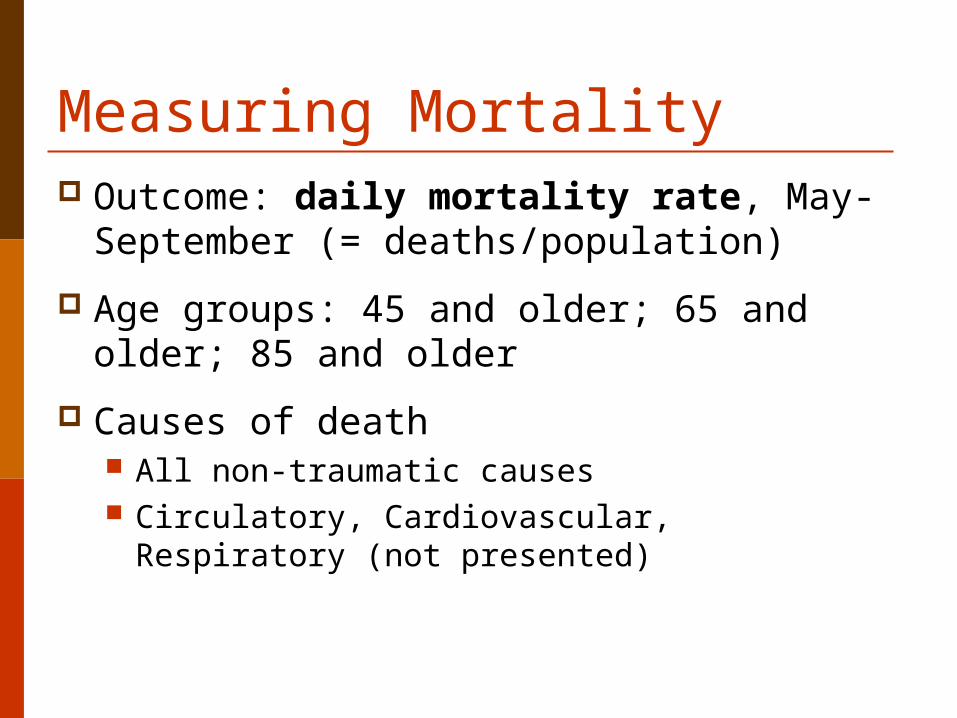
Baseline Climate Parameters
Greater Seattle Area
Spokane Tri-Cities Yakima
Threshold, °F 92.5 100.6 100.9 95.9Mean annual number 1.7 1.8 1.6 1.6Mean duration 2.2 2.0 2.2 2.3
Heat Events, 1980-2006

Relative Risk (non-traumatic), Seattle
0.75
1.00
1.25
1.50
1.75
2.00
0 1 2 3 4 5
Heat event duration (days)
Rel
ativ
e R
isk
Aged 45+
Aged 65+
Aged 85+

Relative Risk (non-traumatic), East
0.75
1.00
1.25
1.50
1.75
2.00
0 1 2 3 4 5
Heat event duration (days)
Rel
ativ
e R
isk
Aged 45+
Aged 65+
Aged 85+

Projected Climate Parameters
0
2
4
6
8
10
12
1980
2000
2020
2040
2060
2080
2100
Number of Heat Events
1980
2000
2020
2040
2060
2080
2100
Greater Seattle Eastside
High
Moderate
Low

Projected Climate Parameters
0
1
2
3
4
5
6
7
1980
2000
2020
2040
2060
2080
2100
Average Duration of Heat Events
1980
2000
2020
2040
2060
2080
2100
Greater Seattle EastsideHigh
Moderate
Low

Projected Excess Deaths, Seattle†
0
250
500
750
1000
2025 2045 2085 2025 2045 2085 2025 2045 2085
Low Moderate High
85+
65-84
45-64
† Population held constant at 2025 projection

Projected Excess Deaths, East†
0
25
50
75
100
2025 2045 2085 2025 2045 2085 2025 2045 2085
Low Moderate High
85+
65-84
45-64
† Population held constant at 2025 projection

Discussion Why the difference between East and
West?

Discussion Why the difference between East and
West? Our estimates of excess deaths due to
future heat are conservative Population growth not factored in Analysis of past heat events may
underestimate effect of longer, hotter events

Discussion Why the difference between East and
West? Our estimates of excess deaths due to
heat are conservative Population growth not factored in Analysis of past heat events may
underestimate effect of longer, hotter events
Consider the possibility of higher-order failures

Limitations Use of county as geographic level linking
heat events and mortality
Reliability of climate and population projections
Change in cause-of-death coding during historical study period
Method does not allow for analysis of smaller, dispersed populations

Conclusions Heat Stress is already a significant
factor in Washington mortality
The number of heat-related deaths will increase because of climate change

AcknowledgementsCo-AuthorsMichael G. Yost PhD, UW Env & Occ Health SciencesCatherine Karr MD PhD, UW Env & Occ Health Sciences, PediatricsCole Fitzpatrick MA, UW Env & Occ Health SciencesBrian K. Lamb PhD, WSU Lab for Atmos Research, Civil & Env EngineeringSerena H. Chung PhD, WSU Lab for Atmos Research, Civil & Env EngineeringJack Chen PhD, National Research Council Canada, Ottawa, ON, CanadaJeremy Avise PhD, California Air Resources Board, Sacramento, CARoger A. Rosenblatt MD, UW Family MedicineRichard A. Fenske PhD, UW Env & Occ Health Sciences
CIG/JISAOPhil Mote PhDEric Salathe PhDAlan Hamlet PhDMarketa McGuire Elser PhDLara Whitely Binder
Top Related