


Languages
Pages
Legal


September 2011 Ilir Bejleri, Ruth Steiner,
Jennifer Cannon
Initial support for this project was provided by a grant from the Robert Wood Johnson Foundation.
Healthy Kids GIS Prototype: Advancing Prevention & Research

Who We Are GeoPlan Center:
Established in 1984 Developed in response to statewide needs for a GIS teaching & research center Florida Geographic Data Library (http://www.fgdl.org/ clearinghouse of GIS data), contains +350 GIS layers from 35 different agencies Attracts 1.5 million $ annually in grants; staff of 15+ persons
Center for Health & the Built Environment:
Established in 2008 Center focus: teaching & research to address the relationship between the built environment & health outcomes Various interdisciplinary research grants such as Safe Routes to School & school siting to support active transport

Presentation Outline • Introduction • System Architecture • Framework of Measures • GIS Data Library • Map Examples • Analytic Tools • Tools Undergoing
Development • Conclusion

Childhood Obesity Epidemic Rapid growth of obesity, widespread in the US
Obesity heightens the risk for Type 2 diabetes, Coronary heart disease, & various cancers and impacts well-being & health
Early intervention is crucial

Why Build Healthy Kids GIS? Causes of childhood obesity are multiple – combination of factors, many that relate to place
GIS is underutilized in childhood obesity research & prevention yet useful for examining the place-variant determinants & risk factors of obesity
Simply a need for a centralized childhood obesity GIS information hub that could extend resources to underserved communities & build their capacity
GIS enables the exploration of relationships among multiple risk factors of obesity
Objectives:
1. Identify core measures 2. Collect relevant data 3. Develop initial GIS
prototypes at the national, state, local map scales that utilizes GIS data

User Interface & Analytical Tools
End Users
Common Measures
Data Sources
data contributions stored in
stored in
dictate needs determine
Data Storage, Processing &
Standardization
Help Users target interventions, inform environmental
changes, policy & research
Prevent & Reduce Childhood Obesity
GIS Logic Model
GIS

Hybrid System Architecture
Consists of 3 co-existing environments: 1. Application-hosting Environment
(the core of the system), functions using a series of four distinct computing servers.
2. Data-provider Environment where information is uploaded.
3. End-users then utilize/retrieve info. via the web-based system within the Client Environment using any standard web browser.
1 2
3

Sources: Chaloupka, FJ, Johnston, LD. (2007) Bridging the Gap: research informing practice and policy for healthy youth behavior. American Journal of Preventive Medicine Oct;33 (4Suppl):S147-61.; Koplan, JP, Liverman, CT, Kraak, VI, Wisham, SL, eds. (2007). Progress in preventing childhood obesity: How do we measure up? Washington, DC: National Academies Press, CDC, RTI International Inc. (2008). Presentation: Common Community Measures for Obesity Prevention (COCOMO).
Structural, Institutional, Systemic Outcomes -School, nutrition labeling, PE, food marketing Policies -Snack taxes
Environment -al Outcomes -Walkability
Cognitive & Social Outcomes
Environment -al Factors -School proximity -Community features -Food environment -Access to recreation facilities
Behavioral Outcomes
-Diet/energy intake -Physical activity levels -Recreational screen time
Health Outcomes
-BMI levels -Obesity prevalence -Obesity-related morbidity
Merged & reconciled measures of childhood obesity to build a comprehensive framework
Added outcome measures in addition to input factors
OU
TC
OM
ES
INP
UT
S
ss
*Food & Physical Activity Related
Conceptual Framework of Measures
Sources: Chaloupka, FJ, Johnston, LD. (2007) Bpractice and policy for healthy youth behaviorOct;33 (4Suppl):S147-61.; Koplan, JP, LivermanProgress in preventing childhood obesity: HowNational Academies Press, CDC, RTI InternatioCommunity Measures for Obesity Prevention
Individual Factors -Socioeconomic characteristics -Public assistance participation
d & Physical Activity
Social Factors -Family influences -Peer influences -Community influences

Geographic data mostly available for environment, SES & public assistance measures, etc. (dark blue) Requires additional work to characterize: policies, access to healthy food, walkability, BMI levels, etc. (turquoise) Geo-aggregated to county unit or larger: screen time & many health outcome measures, etc. (mint) Too many difficulties with operationalizing measures such as the Cognitive/Social outcomes & pregnancy related measures in GIS (white)
GIS Reality

Pilot partnerships were used to explore data availability & tool development at different map scales.
United States
State of Arkansas
Alachua County, FL
Pilot Prototypes

GIS Data Library GIS data library includes over 500 layers
Categorization organized to improve navigability – work in progress since dependent on user feedback
8 Main Categories: Active Living (recreational facilities), Built Environment (Infrastructure, food, safety, schools, transportation) Health/Genetics (health outcomes, BMI) Planning (local zoning regulations) Public Programs & Policies Administrative Boundaries Behavioral Socioeconomic
Access to Recreational Facilities
Infrastructure for Walking to School
Unhealthy Food
Access to Healthy Food
Socioeconomic Characteristics
Public Program Participation Obesity Prevalence
PPO
PPO
AcFo
SC
PP
SC
P
AF
InfW
UnU
Layering of Childhood Obesity Variables in GIS
AcceFacil
IW

GIS Data Library: Active Living Category
Active Living data elements more applicable to the local & state level pilots
Example of GIS Data: Active Living

-Cont. Food Environment
Variety of food data layers - some provided as locational points (food retailers) & polygons (grocers per 1000 persons)

• More analysis possible at the local level than at the national level: ↑ accuracy, ↑ suitability, ↑ function & ↑ data availability
• National level analysis – more aggregated, summarized data
Reality
Very Narrow and Very deep Narrower and Deeper Wide and Shallow
Geographic Extent
Dat
a D
epth
Shallow
Deep
Deeper
Role of Map Scale

MAP EXAMPLES

Analysis of State Policies
Identify states with high obesity risk that do not require BMI data collection at Schools

Link Farms to Schools in Need of Healthier Foods Schools with 40-60% OW students & high participation in Free/Reduced School Lunch Program

Visualize Social Disparities

Improve Infrastructure for Walking

Number of Fast Food, Convenience Stores, & Gas Stations Per 1,000 Children, Alachua County, FL
Highlights areas with concentrations of unhealthy food stores & normalizes for population variations Uses SNAP (food stamp) data on convenience stores & gas station locations


ANALYTICAL TOOLS

Multi-Scale Comparison of Tools
Drawing Tools. Example: propose changes to the Built Environment and create a 1-mile buffer around proposed change.
Useful for selecting at-risk populations
Useful for saving work, sharing it with others, and downloading info.
Tools Available for the National, State, and Local Healthy Kids GIS Prototypes
Example: Find out descriptive information, such as average income in a census block group. Measure the distance from a school to a grocery store.
Tools Available for Childhood Obesity AnalysisNational
State (Arkansas)
Local (Alachua) Many tools were more suitable & useful for analysis at the local level

GIS Tool: Access to Healthy Food Improve Access to Healthy Affordable Food: • Data & tools were
developed to find food deserts (red) & propose a healthy food source


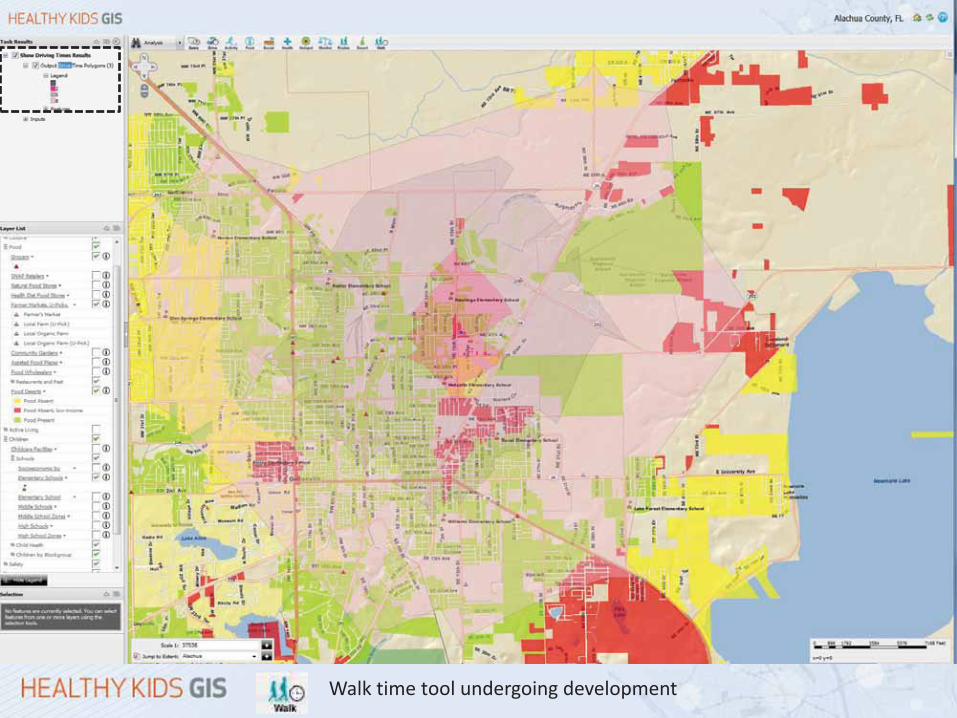
Walk time tool undergoing development

Reporting Tool: Highlight School Characteristics
Enables cross-comparisons across a region Example info provided: SES, participation levels in the free/reduced school lunch program, HH income, adult obesity rates, adult physical inactivity rates, etc.
Click tool & Select Query:
+ Additional Parameters (if desired)
=
*Only portion of report shown.

Tools Undergoing Development
Hotspot Tool - Identify concentrations of high crime & crashes or low concentrations of healthy retailers that accept SNAP subsidies.
Monitor Interventions Toolset – track the effectiveness & efficiency of different childhood obesity prevention strategies.
Safe Routes to Schools Toolset - Examine the active transportation environment near schools and where children live to highlight needs and barriers .
Walk Time Tool - Calculate the walk time from a user-specified location (10 minutes, 15 minutes, 20 minutes)
Health Resources Toolset - Assess health resources availability & needs in areas defined by the user.

Safe Routes to School Toolset Purpose: Examine the active transportation environment near schools and highlight where children live and the associated facilitators and barriers for walking or bicycling to schools.
Functions:
Show walking distances in a network Visually compare densities of children Present a more accurate pedestrian shed around a school by identifying barriers for walking such as major roads and safety concerns and facilitators such as crossing guard locations
Usage Example: Are there areas near schools that need safety improvements to increase the amount of students walking or biking to school? Implementation:
This would require the use of network analyst to calculate the walking distance and time. Already collected useful data, need to collect sidewalk, bicycle/pedestrian crash data, and crime data for the study area.

Safe Routes to School: Conceptual Design
Products: Multi-modal network dataset Interactive maps showing connectivity and areas within walking distance based on the network from the school Image shows how the pedestrian shed would be portrayed more accurately with information on barriers such as high traffic volume and intolerable walking conditions

Toolset to Monitor Interventions Purpose: Monitor the effects of different interventions & policies over time
Functions: Measure relative changes in the target population: OW/OB rates, incidence, other health outcome measures Visualize effectiveness of interventions individually & in comparison to other interventions Helps decide which interventions to adopt
Implementation: Already building a dataset that records the location of childhood obesity interventions/policies (such as snack tax states & the HKHC grant information) Data collection on policies such as school policies on access to healthy foods (Healthy Schools Program, Alliance for a Healthier Generation, etc.), implementation dates, cost, number of recipients, & area. Need data before & after intervention
User decides which locations to compare & the intervention type Yields summary reports that details intervention type, costs, timeframe, impacted population, health information of children before & after, etc.

Hotspot Tool: Conceptual Design User Interactivity:
Choose the feature type such as crime, fast food restaurants, etc. and An area of measure to calculate densities such as 1/2 square mile
Products: Numerical ranks Heat-map with shaded gradient symbols New datasets that effectively summarizes the data & gives it more meaning
Easily visualize disparities and spatial patterns

Health Resources Toolset Purpose: Evaluate access to health resources; identify disparities Function: Provide a summary of the available health resources such as the amount of healthcare facilities, percent uninsured, etc. in different locations Implementation: The UF research team has already collected some datasets useful for this effort. Further data collection, processing, & standardization would need to be completed.
User Interactivity: Choose locations to compare & variables (ie, medical facilities, health professionals)
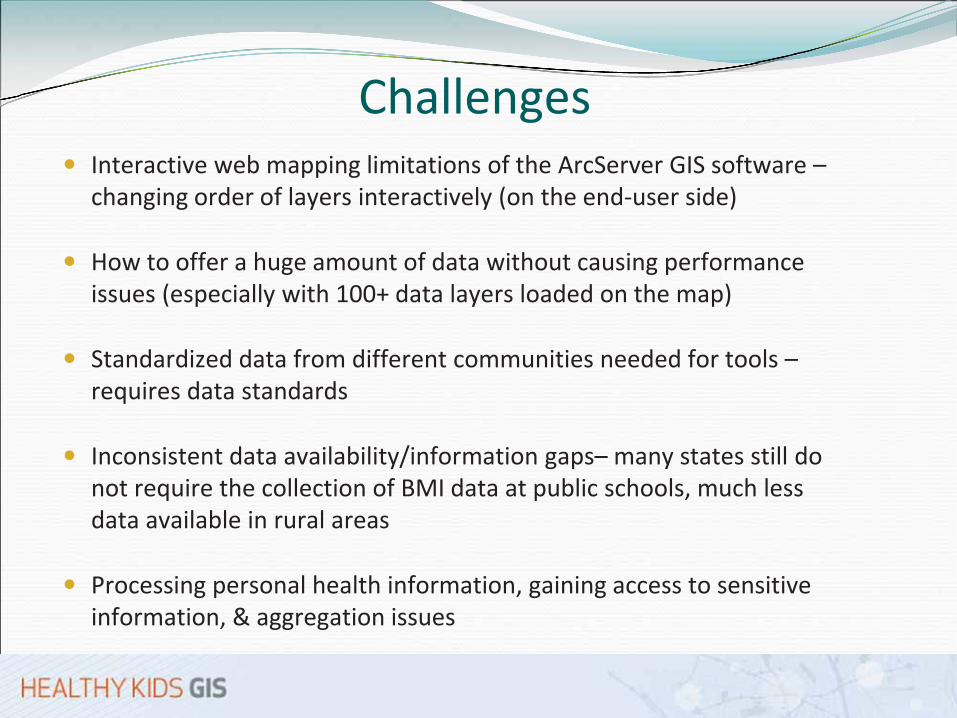
Challenges Interactive web mapping limitations of the ArcServer GIS software – changing order of layers interactively (on the end-user side)
How to offer a huge amount of data without causing performance issues (especially with 100+ data layers loaded on the map)
Standardized data from different communities needed for tools – requires data standards
Inconsistent data availability/information gaps– many states still do not require the collection of BMI data at public schools, much less data available in rural areas
Processing personal health information, gaining access to sensitive information, & aggregation issues
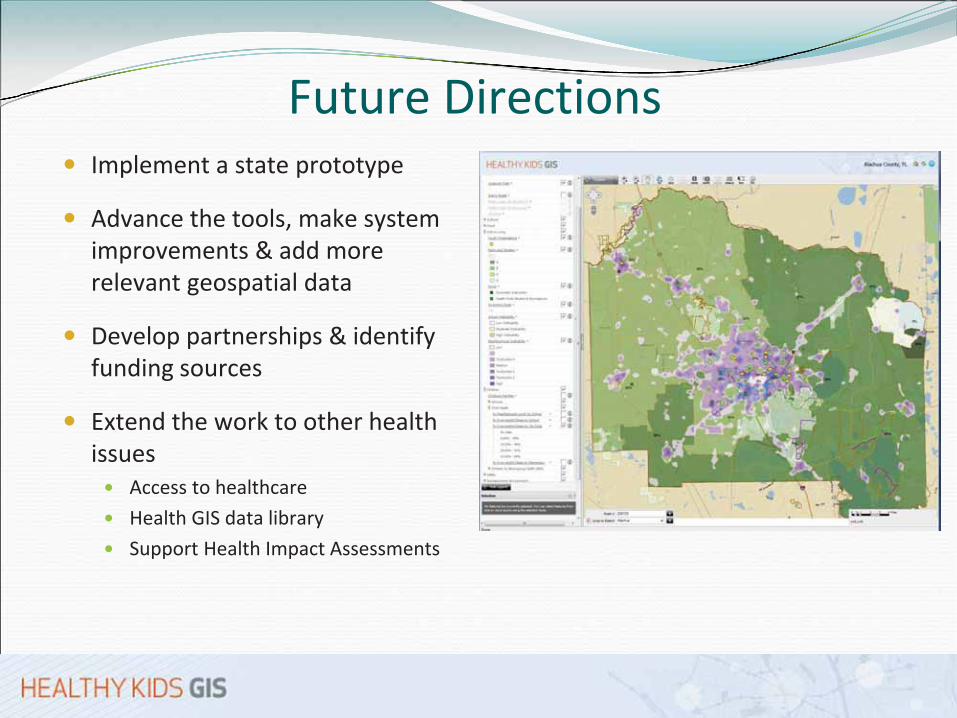
Future Directions Implement a state prototype
Advance the tools, make system improvements & add more relevant geospatial data
Develop partnerships & identify funding sources
Extend the work to other health issues
Access to healthcare Health GIS data library Support Health Impact Assessments

Suggestions? Any Questions? For additional information contact:
Dr. Ilir Bejleri, [email protected] Dr. Ruth Steiner, [email protected]
Jennifer Cannon, [email protected] Project website: www.healthykidsgis.org
University of Florida College of Design, Construction, and Planning & the College of Medicine Collaborating Centers:
Geo-Facilities Planning & Information Research Center (GeoPlan)
Center for Health and the Built Environment (CHBE)
Family Data Center (or MCHERDC)
Top Related