


Languages
Pages
Legal

Hawthorne Elementary School
Review of DataSchool Improvement Process
Fall, 2009

Why use data? How should we use it?
• Data isn’t meant to replace our knowledge, experience, insights, and intuitions.
• Data complements each of these, helping us avoid “blind spots” or generalizations that need a more sophisticated understanding.
• Data is best used as a source of information that leads to reflection. Numbers are numbers, but their meanings are determined through reflective analysis and thoughtful discussion.

How will we respond to the data we review today?
• As we approach each data source, consider your state of mind: what assumptions do you bring to the data? What predictions are you making?
• After reviewing sets of data, ask yourself:
– What important points seem to “pop out?”
– What are some of the patterns and trends that emerge?
– What seems to be surprising or unexpected?
• Then consider the information that’s missing? What other information should be gathered? In what directions do we need to examine the data in greater detail or from another perspective?

and remember…
As we examine the data, there are two tendencies that sometimes occur:
1) To focus on only the negative or the needs that are apparent and to ignore strengths and positive “assets” in the school.
2) To be offended or get defensive with data that points out needs, challenges, or concerns.

We’ll begin with student demographic data.

How has the overall enrollment changed across time?
347
420
319 318 322 339 322 335
0
100
200
300
400
500
600
2003-04 2004-05 2005-06 2006-07 2007-08 2008-09 2009-10 2010-11
Hawthorne:all students

What do we know about our students?ENROLLMENT BY LOW INCOME AT HAWTHORNE

How does Hawthorne’s level of economically disadvantaged students compare to the District and State?
64.3
46.9
37.6
0 20 40 60 80 100
% ofeconomically
disadvantagedstudents -
2008-09
WI
MMSD
Hawthorne

This Year’s Enrollment by Low Income: MMSDSeptember, 2009
0
10
20
30
40
50
60
70
80
90
100
% Low Income
District Elementary Avg. = 49%

This Year’s Enrollment by Low Income: MMSDSeptember, 2009
0
10
20
30
40
50
60
70
80
90
100
% Low Income
District Elementary Avg. = 49%

Data on our students…RACIAL/ETHNIC DIVERSITY AT HAWTHORNE

How does Hawthorne’s diversity of students compare to the District and State?
25
48
74
31
24
12
21
17
10 4
11
23
0% 20% 40% 60% 80% 100%
Hawthorne
MMSD
WI
White
Afr-Amer
Hispanic
Asian
2008-09 School Year

Data on our students…
30
ELL Students
Non-ELLStudents
CURRENT ENGLISH LANGUAGE LEARNER
(ELL) DENSITY
12
SpecialEducationStudents
Non-SpecialEducationStudents
CURRENT SPECIAL EDUCATION DENSITY
2009-10 School Year Data

What about student engagement data?

What do we know about how our students are engaged?
90
91
92
93
94
95
96
97
98
2006-07 2007-08 2008-09
Hawthorne
MMSD ElementarySchools
ATTENDANCE RATES FOR ALL STUDENTS:
HAWTHORNE AND MMSD ELEMENTARY SCHOOLS
The District’s goal is 94% attendance rate for all students…

What about student learning data?

How do our students’ primary reading test scores compare to the District averages?
73
5863
71 70 70
0
10
20
30
40
50
60
70
80
90
100
PLAA: KindergartenTRL
PLAA: First GradeTRL
PLAA: SecondGrade TRL
Hawthorne %Proficient/Advanced
MMSD % Proficient/Advanced
PRIMARY READING TESTS, SPRING 2008

Adequate Yearly Progress
Reading Math
Starting Point 2001-02 61% 37%
2002-03 61% 37%
2003-04 61% 37%
Intermediate Goal 2004-05 67.5% 47.5%
(Begin new 3-8 tests) 2005-06 67.5% 47.5%
2006-07 67.5% 47.5%
Intermediate Goal 2007-08 74% 58%
2008-09 74% 58%
2009-10 74% 58%
Intermediate Goal 2010-11 80.5% 68.5%
Intermediate Goal 2011-12 87% 79%
Intermediate Goal 2012-13 93.5% 89.5%
Goal: All Proficient 2013-14 100% 100%
Annual Measurable Objectives
% P
rofi
cie
nt/
Ad
van
ced

How do our Proficiency/Advanced levels compare to the District and State?
78
90
6772
76 7479 82 81
0
10
20
30
40
50
60
70
80
90
100
Third Grade %Prof/Adv
Fourth Grade %Prof/Adv
Fifth Grade %Prof/Adv
Hawthorne
MMSD
WI
WKCE – Reading, 2008: Proficiency/Advanced %
Criteria that determines a school’s status (AYP):
Reading – 74%

What have been the long-term trends in reading achievement?
6269 69
90
0
10
20
30
40
50
60
70
80
90
100
Fourth Grade % Prof/Adv
2005
2006
2007
2008
WKCE - Reading, 2005-08: Fourth Grade Proficiency/Advanced %
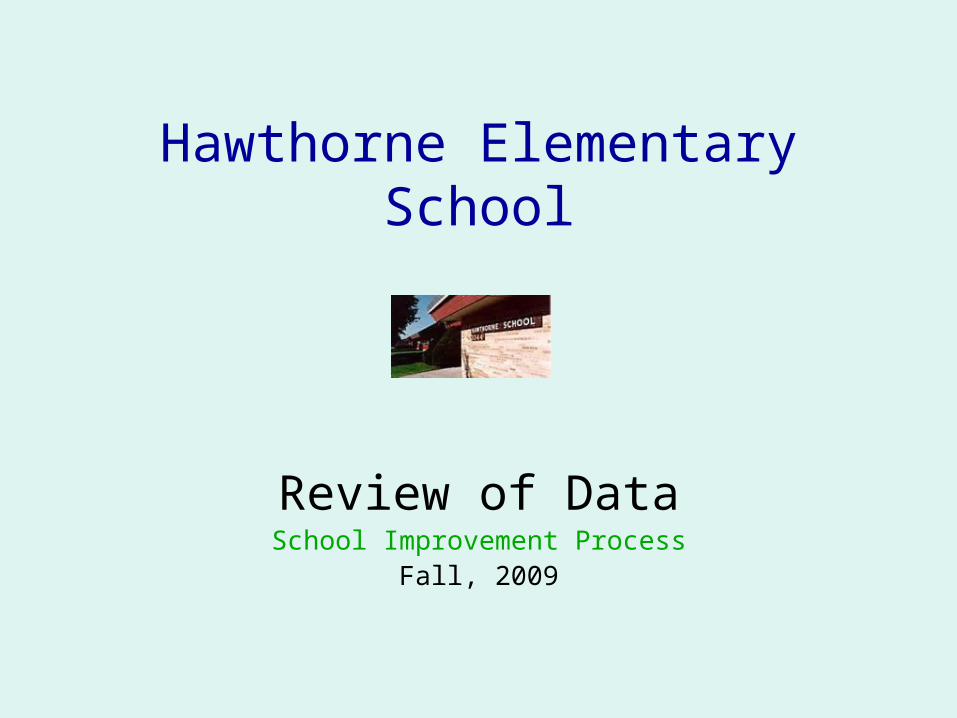
When we disaggregate the reading data by various groups of students, what are our Proficiency/Advanced levels ? We’ll start with language…
77
88
53
78
91
73
0
10
20
30
40
50
60
70
80
90
100
Third Grade %Prof/Adv
Fourth Grade %Prof/Adv
Fifth Grade %Prof/Adv
ELL
Non-ELL
WKCE - Reading, 2008: Proficiency/Advanced %

Then we’ll look at race/ethnicity…
66
93
53
100
82
60
78
59
90
77
95
0
10
20
30
40
50
60
70
80
90
100
Third Grade %Prof/Adv
Fourth Grade% Prof/Adv
Fifth Grade %Prof/Adv
Asian
Hispanic
African-American
White
Other-Combined
WKCE - Reading, 2008: Proficiency/Advanced %
When student groups are too small, they aren’t counted as a distinct group in the data.

…and Economic Status.
70
88
55
8894
86
0
10
20
30
40
50
60
70
80
90
100
Third Grade %Prof/Adv
Fourth Grade% Prof/Adv
Fifth Grade %Prof/Adv
EconomicallyDisadvantaged
Not EconomicallyDisadvantaged
WKCE – Reading, 2008: Proficiency/Advanced %

When we compare the students that we could instructionally impact (FAY) to Wisconsin schools with similar levels of economic disadvantage, how did we do in bringing our students up to proficiency in reading?

Hawthorne compared to other cty schools?

How do our Proficiency/Advanced levels compare to the District and State?
7583
6472
76 737681 79
0
10
20
30
40
50
60
70
80
90
100
Third Grade %Prof/Adv
Fourth Grade %Prof/Adv
Fifth Grade %Prof/Adv
Hawthorne
MMSD
WI
WKCE - Mathematics, 2008: Proficiency/Advanced %
Criteria that determines a school’s status (AYP):
Math – 58%

What have been the long-term trends in mathematics achievement?
6861
53
83
0
10
20
30
40
50
60
70
80
90
100
Fourth Grade % Prof/Adv
2005
2006
2007
2008
WKCE - Mathematics, 2005-08

When we disaggregate the math data by various groups of students, what are our Proficiency/Advanced levels ? We’ll start with language…
85 88
6570
80
65
0
10
20
30
40
50
60
70
80
90
100
Third Grade %Prof/Adv
Fourth Grade %Prof/Adv
Fifth Grade %Prof/Adv
ELL
Non-ELL
WKCE – Mathematics, 2008: Proficiency/Advanced %

Then we’ll look at race/ethnicity…
8892
6971
91
6064
47
80
62
90
0
10
20
30
40
50
60
70
80
90
100
Third Grade %Prof/Adv
Fourth Grade% Prof/Adv
Fifth Grade %Prof/Adv
Asian
Hispanic
African-American
White
Other-Combined
WKCE - Mathematics, 2008: Proficiency/Advanced %
When student groups are too small, they aren’t counted as a distinct group in the data.

…and Economic Status.
7078
51
81
94
85
0
10
20
30
40
50
60
70
80
90
100
Third Grade %Prof/Adv
Fourth Grade% Prof/Adv
Fifth Grade %Prof/Adv
EconomicallyDisadvantaged
Not EconomicallyDisadvantaged
WKCE – Mathematics, 2008: Proficiency/Advanced %

When we compare the students that we could instructionally impact (FAY) to Wisconsin schools with similar levels of economic disadvantage, how did we do in bringing our students up to proficiency in math?

Although not yet factored into AYP and other considerations, the importance of science achievement measured through the WKCE will soon increase. How do our Proficiency/Advanced levels compare to the District and State?
6568.4
76.1
0
10
20
30
40
50
60
70
80
90
100
Fourth Grade % Prof/Adv
Hawthorne
MMSD
WI
WKCE - Science, 2008: Proficiency/Advanced %

Hawthorne’s Six Trait Writing Scores
• Administered in grades 3 and 5
• Compared to District averages
• Scores by Trait, compared to previous year

Feb 2009 (08-09) Six Trait Writing Test Results - School to District ComparisonSchool: Hawthorne Elementary, Class: Gr. 03

Feb 2009 (08-09) Six Trait Writing Test Results – 3 Year ComparisonHawthorne Elementary, Class: Gr. 03

Feb 2009 (08-09) Six Trait Writing Test Results - School to District ComparisonHawthorne Elementary, Class: Gr. 05

Feb 2009 (08-09) Six Trait Writing Test Results – 3 Year ComparisonHawthorne Elementary, Class: Gr. 05

Finally, what relationships data do
we have?

When it comes to measurements of relationships…
School Climate Survey• Responses from all students (grades 3-5), parents, and all staff.
• Comparisons to District, to previous year, and internally between demographic groups.

Significant Findings from the Climate Survey
100% of parents responding to the survey agreed or strongly agreed with the statement:
I feel welcome at my child's school.

Hawthorne Elementary School Parent Survey Categorical Averages
Commitment to Learning 2.95 Hawthorne 2.86 District
Engagement 2.82 Hawthorne 2.69 District
Relationships: Staff-Family
2.89 Hawthorne 2.88 District
Relationships: Student-Student
2.57 Hawthorne 2.56 District

Significant Findings from Climate Survey
100% of parents responding to the survey agreed or strongly agreed with the statements:
• I believe the school’s rules are stated clearly and enforced fairly.
• I feel comfortable contacting my child's teacher(s).

Significant Findings from Students Climate Survey
93% of Hawthorne students agree with the following statements:
• My teachers really care about me and how well I do in school.
• I respect my classroom teacher.
• All students in my school are expected to do their best.

Significant FindingsStudent Climate Survey
17% of students disagree with the following statement:
• In our school, students are free from name calling based on the color of their skin.
15.94% of students disagree with the following statement:
• In our school, students are free from name calling based upon their looks.

What Conclusions can be drawn from this Data?
* Hawthorne Elementary School is wonderfully rich, diverse learning community.
* Hawthorne students, families, & staff have positive working relationships with one another.
* A high percentage of Hawthorne students are performing well in Literacy & Mathematics.
* An achievement gap continues in Literacy & Mathematics performance among Hawthorne students.
* Some students do not feel free from harassment based on the color of their skin or their appearance.

What are our Next Steps…
Hawthorne School Improvement Plan ’09-’10
Goal #1:
Increase Student Achievement in Mathematics
Objective A: Through continued embedded Professional Developmentaround mathematics instruction, including implementing BalancedMath and utilizing a wider variety of assessment tools, teachers willincrease their ability to determine student’s individual performancelevels in key areas of mathematics (i.e. fact fluency, number sense, problemsolving skills, analyzing equations & other key areas such as geometry, measurement,
data & prob. etc.) & will increase their repertoire of best practices to assiststudents in developing at their next level of challenge in each of theseareas of mathematics.

Ways we’ll measure progress:
75 % of students will be Proficient on the identified Report Card items targeted for improvement :
- solving story probs. K-5
- fact fluency 1 – 5
- measurement K-5
All students will show improvement in same targeted Report Card items
75% of students will be Prof. or Adv. WKCE - MA

Goal # 2 Increase Student Achievement in Literacy
• Objective B: Through continued professional development, classroom & support teachers will increase their ability to assess & determine students’ individual performance skills & next levels of challenge in each area of Reading: (phonemic awareness, phonics, vocab, fluency & comp.) & Writing (6 traits, planning & composing narrative, expository & persuasive text, writing in the content areas, lang. arts components)
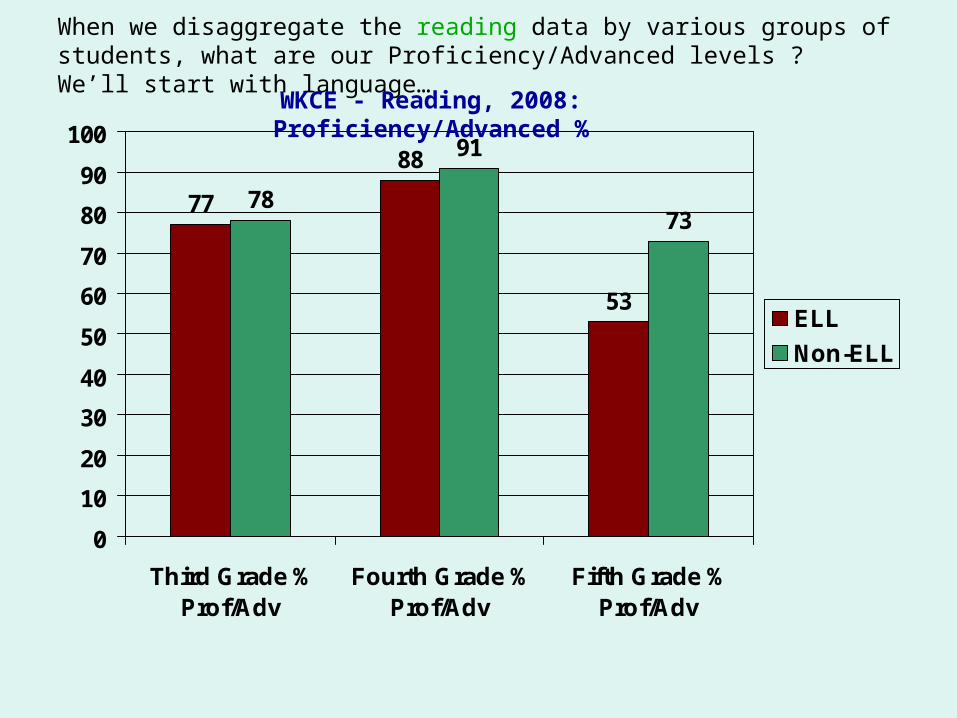
Ways we’ll measure progress:
80% of students will be Proficient on identified Report Card items targeted for improvement:
- TRL K-5
- Revision of Writing 1 – 5
- Conventions 3 – 5
All students show improvement in same targeted
Report Card items
80% Prof. or Adv. 3rd – 5th WKCE - RE

Hawthorne Elementary School PBS School ’09-’10
Joining the PBS – Positive Behavior Support systems/plans @ the middle school level, Hawthorne will:
• Establish a Hawthorne PBS Team• Hawthorne PBS Team attend Universal Training• Hawthorne PBS Team collaborate w/ Hawthorne
staff around PBS initiatives for ’09-’10 to address ’08-’09 Climate Survey results & current needs.
Top Related