


Languages
Pages
Legal


Harmful Algal Bloom Research at Stone
Lab: Monitoring Blooms and Determining
Drivers of Bloom Toxicity Justin Chaffin, PhD
Stone Laboratory, Ohio Sea Grant
WMAO/OWRC Luncheon October 12, 2016

OHIO SEA GRANT AND STONE LABORATORY
Most algae are not “bad” for lakes •Algae are tiny plant-like organisms
•50% of Earth’s oxygen produced by algae • Every other breath you take, thank algae
•Base of the lake food web • “Good” Algae are food for zooplankton • Zooplankton are food for small fish
Food
Oxygen
Algae Zooplankton (small shrimp-like creatures)
Small fish
Large fish
OHIO SEA GRANT AND STONE LABORATORY
There are hundreds of species of algae in lakes
Algae need: Sunlight, fertilizers, carbon dioxide
OHIO SEA GRANT AND STONE LABORATORY
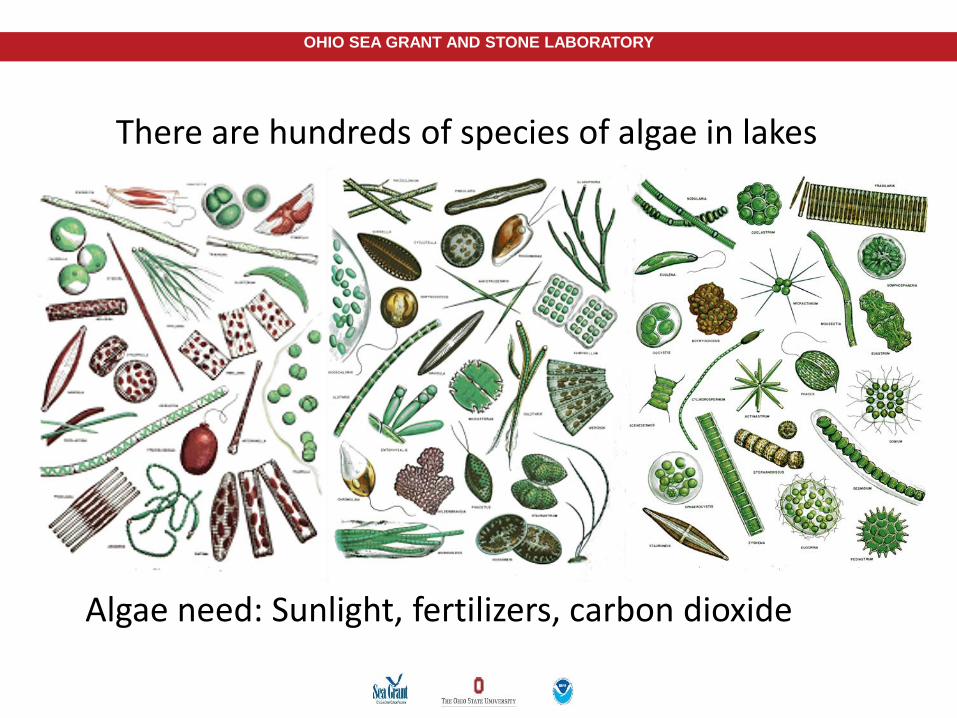
Lake Erie produces the most fish of all the Great Lakes because it has
the most algae •Highest nutrient concentrations
•Warmest water temperature
• Lake Erie • 50% of fish • 2% of the water
• Lake Superior • 2% of fish • 50% of water

OHIO SEA GRANT AND STONE LABORATORY
Too much of the wrong kind of algae is harmful
•Harmful = •Has the potential to produce toxins. •Harmful impacts on ecosystems
•Algal = •Blue-green algae (cyanobacteria) •Red tide (dinoflagellates)
•Bloom = •Biomass that far exceed normal
Hungeree.com
geology.com

OHIO SEA GRANT AND STONE LABORATORY
Lake Erie harmful algal blooms
•Lake Erie blooms are a type of Cyanobacteria called Microcystis • Also called “blue-green algae” • Technically true bacteria • Require sunlight like algae
•Microcystis produces the toxin microcystin that was responsible for Toledo’s 2014 water crisis.
•Other HABs in Lake Erie • Sandusky Bay • Central Basin
J.Chaffin

OHIO SEA GRANT AND STONE LABORATORY
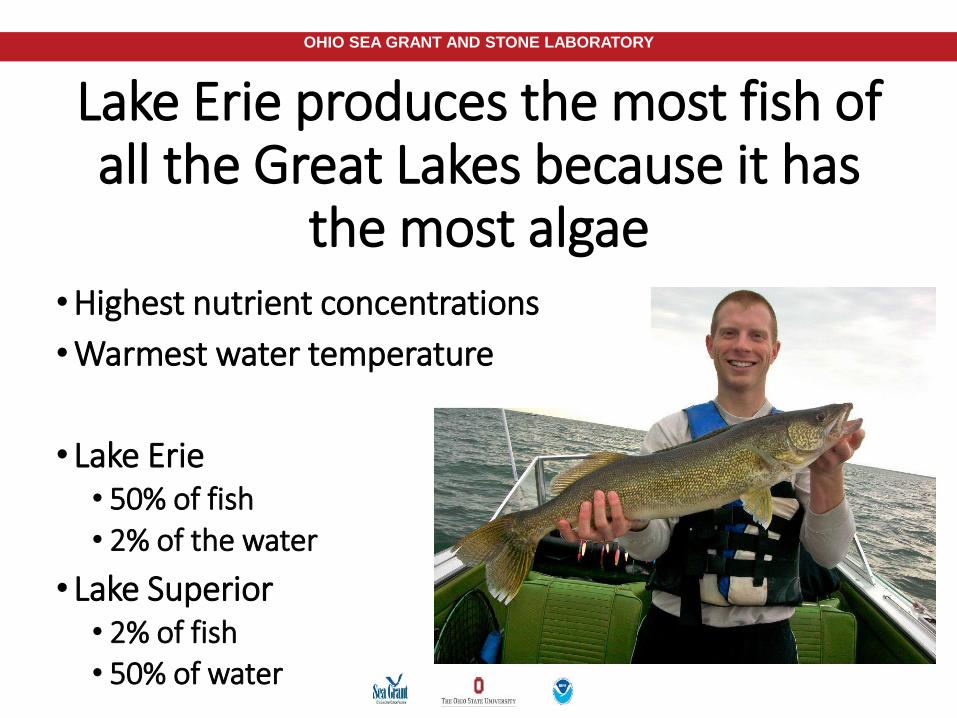
Tracking blooms requires multiple scales of monitoring •Blooms visible (and quantifiable) from space
• NOAA HAB bulletin • Entire lake once or twice a week • But: No information on toxicity, nutrients, species

OHIO SEA GRANT AND STONE LABORATORY
Tracking blooms requires multiple scales of monitoring •Blooms visible (and quantifiable) from space
• NOAA HAB bulletin • Entire lake once or twice a week • But: No information on toxicity, nutrients, species
•Water samples from boats • A lot of information on toxicity, nutrients, species, molecular
• But: Few locations and low frequency. Lab analysis time lag
•Buoys equipped with sensors • Real-time data. “Early warning of a bloom” • Potential issues: Infrequent calibration, Zebra mussel clogging,
Variable fluorescence per chlorophyll. Do sensors work?

OHIO SEA GRANT AND STONE LABORATORY
• HABs hurt charter captain business. • 30% less business in 2015 • Trips cancelled due to bloom • Customers not returning
• In 2012 (after large 2011 bloom), captains asked “How can we help?”
• Funded by Ohio EPA • Surface water in 2014 • Environmental Education in 2013,
2015, 2016
Charter boat captains monitor western basin water quality

OHIO SEA GRANT AND STONE LABORATORY
Charter boat captains sampling kit

OHIO SEA GRANT AND STONE LABORATORY
• Captains record: • Lat/Long, Depth, Surface temp
• Measure Secchi Disk depth • Sample surface water with 0-2m
intergraded tube sampler • Drop off cooler at designated bait
shops/marinas. • 7 samples per week • Captains receive data updates
each week. • Answer “How is the lake doing this
year?”
Charter boat captains monitor western basin water quality Basspro.com
Eriehopper.com

• Total algae levels have remained lower in September and October than August.
• Highest algae levels were recorded in early May during a diatom bloom.
• Microcystin levels slightly
increased in late September and October. This increase was associated with an increase of cyanobacteria (a.k.a. blue-green algae).
• 2016 overall has had much less algae and microcystin than previous years.
Charter boat sampling data update

• Phosphorus is the main nutrient that limits algae growth.
• Phosphorus levels were greater in August and September than in May, June, and July.
• Recent phosphorus levels have been similar to levels measured in previous years.
• The phosphorus target for the western basin is 15 ppb. During late May and early June the western basin was below that target level.
• Nitrogen is the second most important nutrient for algae. Nitrate is the most common form on nitrogen in Lake Erie.
• Nitrate levels have steadily decreased since very high levels were measured in April.
Charter boat sampling data update

The map shows where the captains have collected samples by month during 2016. There has been a good coverage of the entire western basin. Captains have collected 145 samples as of October 3.

OHIO SEA GRANT AND STONE LABORATORY
Gibraltar Buoy
•Fixed monitoring stations
•Records biological, physical, chemical, and meteorological variables
•Continuous, real-time data
•Data can be utilized by lake managers, researchers, water treatment plant operators, tourists and the general public
Data buoys provide real-time data

OHIO SEA GRANT AND STONE LABORATORY
HABs Real-Time Monitoring
Slide courtesy of Ed Verhamme

OHIO SEA GRANT AND STONE LABORATORY
Lake bottom
Data buoys measure water quality 0.7 meter from the surface.
• Buoy parameters (15 min) • Dissolved Oxygen • Temperature • pH • Specific Conductivity • Water clarity (NTU) • Total algae (chlorophyll
fluorescence) • Cyanobacteria (phycocyanin
fluorescence)

OHIO SEA GRANT AND STONE LABORATORY
Potential issues with the sensors?
• Infrequent calibration • Sensor drift throughout
deployment? • Algae biomass is not measured
• Sensors measure fluorescence, which can change with physiological status of the cell
• Clogging from Dreissena mussels • Low water exchange

OHIO SEA GRANT AND STONE LABORATORY
• Deployed May – October in 2015 and 2016
• Water samples next to the buoy throughout summer using 0-2 meter integrated tube sampler (several samples /week) • Microcystin (total and extracellular) • Chlorophyll and phycocyanin • Phytoplankton biovolume data • FluoroProbe (chlorophyll a associated with green algae, diatoms, and
cyanobacteria) • Nitrate, ammonium, TKN, TP, DRP, Si • TSS & NVSS • Secchi disk depth • 125 samples
Water samples collected next to the buoy

OHIO SEA GRANT AND STONE LABORATORY
2015 large bloom at Stone Lab buoy B
UO
Y W
ater
Sam
ple
July 24, 2015
Chaffin unpublished

OHIO SEA GRANT AND STONE LABORATORY
2016 bloom just above detection limit B
UO
Y W
ater
Sam
ple
Chaffin unpublished

OHIO SEA GRANT AND STONE LABORATORY
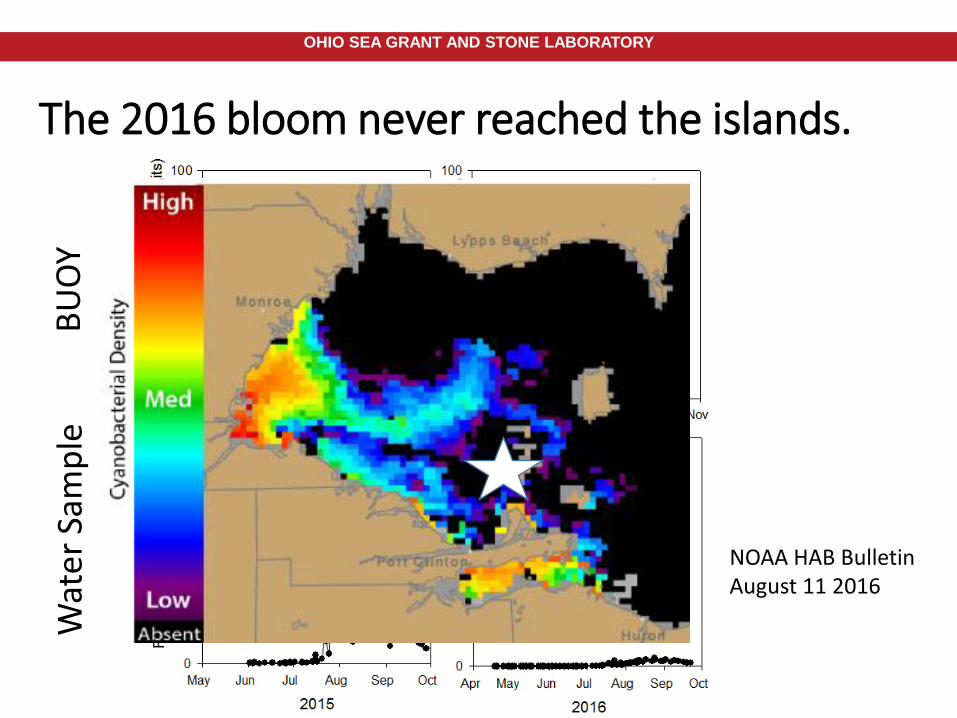
The 2016 bloom never reached the islands. B
UO
Y W
ater
Sam
ple
NOAA HAB Bulletin August 11 2016
OHIO SEA GRANT AND STONE LABORATORY
The 2016 bloom never reached the islands. B
UO
Y W
ater
Sam
ple
NOAA HAB Bulletin August 11 2016
OHIO SEA GRANT AND STONE LABORATORY
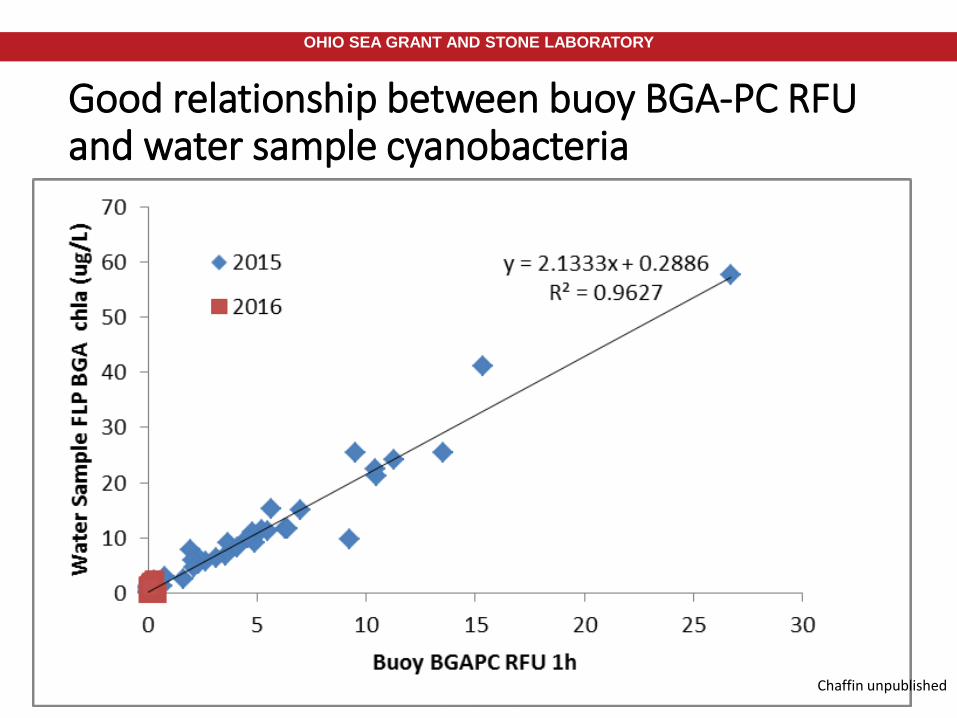
Good relationship between buoy BGA-PC RFU and water sample cyanobacteria
Chaffin unpublished

OHIO SEA GRANT AND STONE LABORATORY
Total Chlorophyll: Different trends between the two years and low correlation
Chaffin unpublished

OHIO SEA GRANT AND STONE LABORATORY
Buoy NTU sensor good indicator of water clarity.
Chaffin unpublished

OHIO SEA GRANT AND STONE LABORATORY
Microcystin concentration tracked with buoy data
Chaffin unpublished

OHIO SEA GRANT AND STONE LABORATORY
Can buoy sensor data be used to predict water quality?
•Cyanobacteria: Yes. R2 = 0.96 •Total chlorophyll: No. R2 <0.50; different relationship between the years •Water clarity: Yes. R2 = 0.86 for TSS
Yes. R2 = 0.81 for Secchi Disk •Microcystin concentration tracked the buoy cyanobacteria fluorescence data.

OHIO SEA GRANT AND STONE LABORATORY
Cyanobacterial blooms just not western basin problem.
NOAA HAB bulletin, July 15 2015
Microcystis in western basin • A lot of research ongoing • Many research groups
Dolichospermum (Anabaena) in central basin • Research focus on hypoxia • Little known about phytoplankton
Planktothrix in Sandusky Bay • See: Davis et al. 2016 ES&T

OHIO SEA GRANT AND STONE LABORATORY
Dolichospermum in the central basin •Formally called Anabaena
•Nitrogen fixing cyanobacterium • Typically found in low N and high P waters.
•Not believed to be a microcystin producer in Lake Erie (Rinta-Kanto et al. 2009)
•Early July blooms 4 of last 5 years D. lemmermannii D. circinale D. planctonicum

OHIO SEA GRANT AND STONE LABORATORY
Central basin Dolichospermum bloom occurred in high nitrate and high TN:TP ratios.
July 7, 2016: Brian Fowler, Lake Co Metroparks
• DRP was below detection in all samples.
• A N-fixer HAB in high N waters could indicate that Fe was limiting growth.
BLOOM
2013 bloom: NOAA
Chaffin unpublished

OHIO SEA GRANT AND STONE LABORATORY
Role of nitrogen in bloom growth and toxicity
•Human activities are increasing the amount of nitrogen available to
ecosystems.
Gilbert et al. 2014

OHIO SEA GRANT AND STONE LABORATORY
Research question: How will the increase use of nitrogen affect cyanobacterial blooms in terms of growth and toxicity?
?
Experiment addressed: • Forms of nitrogen
• Nitrate, Ammonium, Urea • Loading rate
• Single high: Storm pulsed • Low sustained: Internal recycling
• Light level • Interaction with N

OHIO SEA GRANT AND STONE LABORATORY
Control +P +N +P&N
Nitrogen limits Lake Erie cyanobacteria abundance in August and September
See: Chaffin, Bridgeman, Bade. 2013. Nitrogen constrains the growth of late summer cyanobacterial blooms in Lake Erie. Advances in Microbiology. 6: 16-26
OHIO SEA GRANT AND STONE LABORATORY
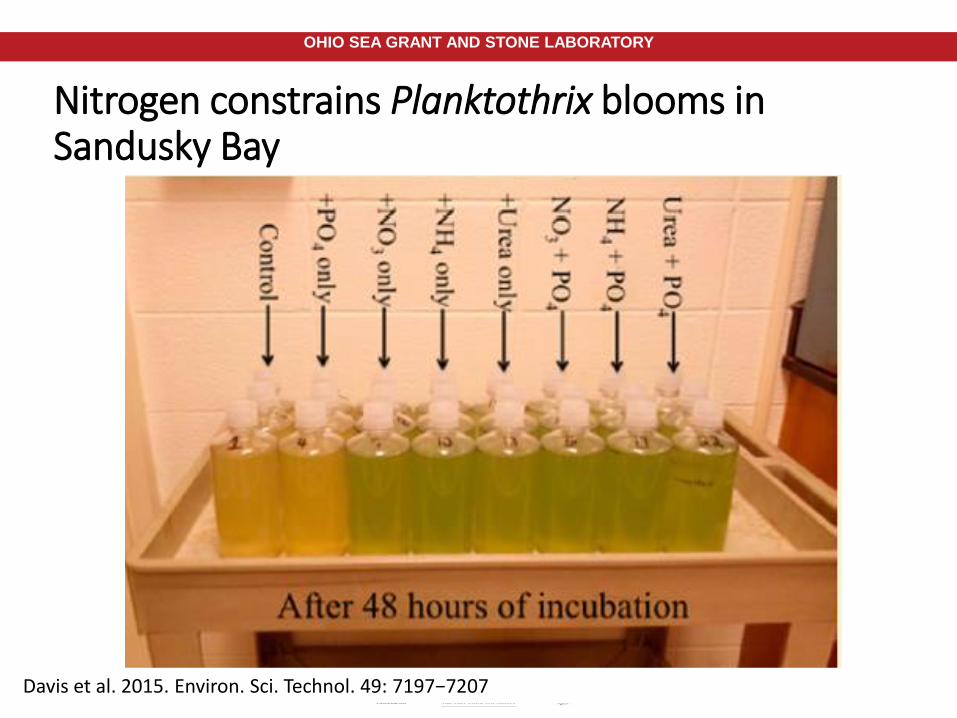
Nitrogen constrains Planktothrix blooms in Sandusky Bay
Davis et al. 2015. Environ. Sci. Technol. 49: 7197−7207

OHIO SEA GRANT AND STONE LABORATORY
• Non-nitrogen fixing cyanobacteria dominate the toxic blooms in Lake Erie • Microcystis in the main lake
• Planktothrix near river mouths and Sandusky Bay
• Microcystin-LR is 14% nitrogen by mass. • Microcystis is only 7% nitrogen by mass (Chaffin et
al. 2011).
• Thus, making microcystin is expensive in terms of nitrogen.
• Microcystis and Planktothrix cannot grow or make microcystin without combined nitrogen. • Nitrate, Ammonium, Urea
Is nitrogen important for cyanobacteria toxin production?

OHIO SEA GRANT AND STONE LABORATORY
Combined nitrogen enters a lake through rivers and by recycling in sediments and water column
NO3, NH4, Organic N Particulate N
NH4 and Urea
NO3
Sediment Nitrogen
NH4 and Urea
• Following storms, near shore nitrate concentrations in Lake Erie exceed 100 µmol/L (Chaffin et al. 2013)
• Ammonium is recycled at a rate of 2.5 µmol/L/h in Taihu (Paerl et al. 2011)
OHIO SEA GRANT AND STONE LABORATORY
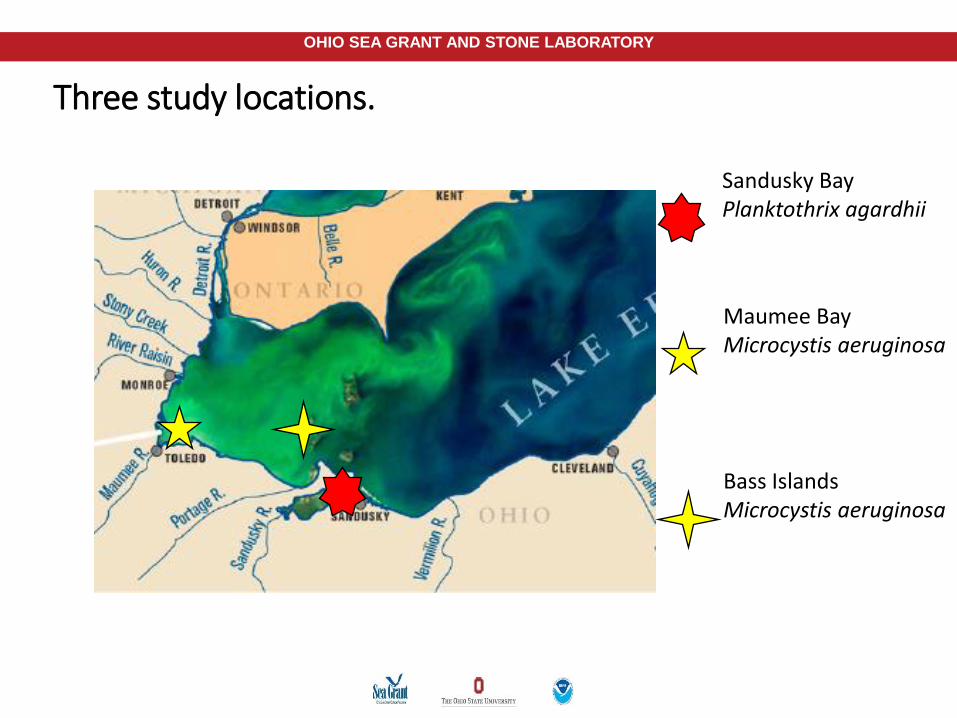
Three study locations.
Sandusky Bay Planktothrix agardhii
Maumee Bay Microcystis aeruginosa
Bass Islands Microcystis aeruginosa

OHIO SEA GRANT AND STONE LABORATORY
Maumee Bay August 6 2014 Microcystis aeruginosa [chla] = 68 µg/L
Data shown in today’s presentation is from Maumee Bay experiments
Three study locations.
OHIO SEA GRANT AND STONE LABORATORY
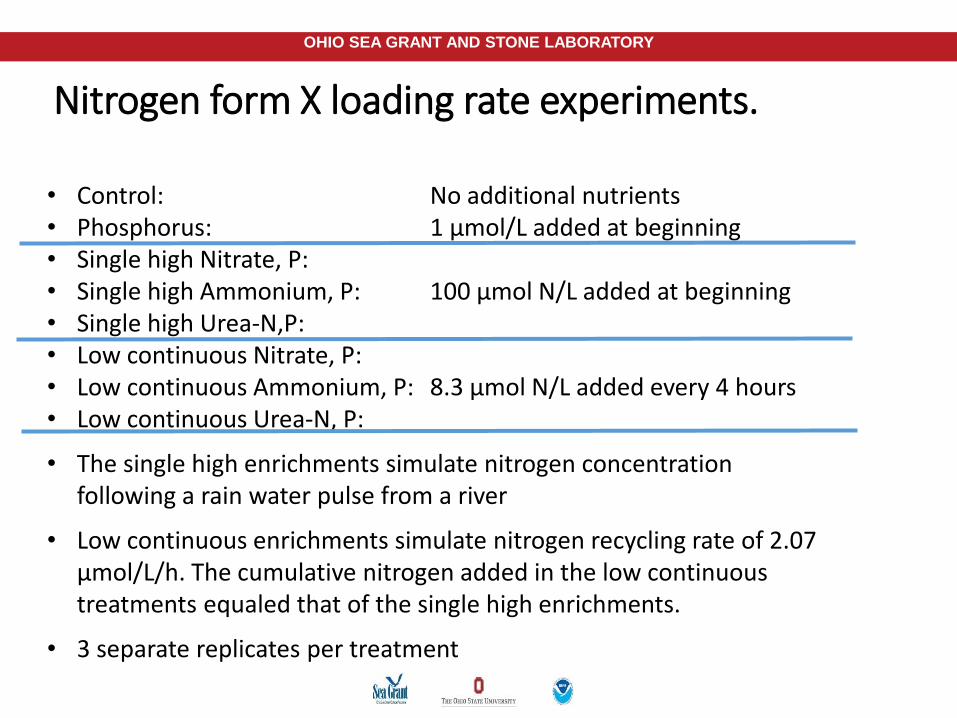
Nitrogen form X loading rate experiments.
• Control: No additional nutrients • Phosphorus: 1 µmol/L added at beginning • Single high Nitrate, P: • Single high Ammonium, P: 100 µmol N/L added at beginning • Single high Urea-N,P: • Low continuous Nitrate, P: • Low continuous Ammonium, P: 8.3 µmol N/L added every 4 hours • Low continuous Urea-N, P:
• The single high enrichments simulate nitrogen concentration following a rain water pulse from a river
• Low continuous enrichments simulate nitrogen recycling rate of 2.07 µmol/L/h. The cumulative nitrogen added in the low continuous treatments equaled that of the single high enrichments.
• 3 separate replicates per treatment

OHIO SEA GRANT AND STONE LABORATORY
Experiment methods • Add N and P every 4
hours

OHIO SEA GRANT AND STONE LABORATORY
Experiment methods

OHIO SEA GRANT AND STONE LABORATORY
Experiment methods

OHIO SEA GRANT AND STONE LABORATORY
Experiment methods

OHIO SEA GRANT AND STONE LABORATORY
Measurements from bottles
• Microcystin Hour 0, 48 • Total and extracellular
• Chlorophyll Hour 0, 48 • Dissolved nutrients Hour 0, 48
• Nitrate, ammonium, urea, phosphate
• Phytoplankton biovolume Hour 0, 48
• Gene expression Hour 0, 4, and 48 • mcyD • RPOC1 (RNA polymerase gamma subunit) • The 4 hour sample will show how quick genes are up- or down-
regulated
OHIO SEA GRANT AND STONE LABORATORY
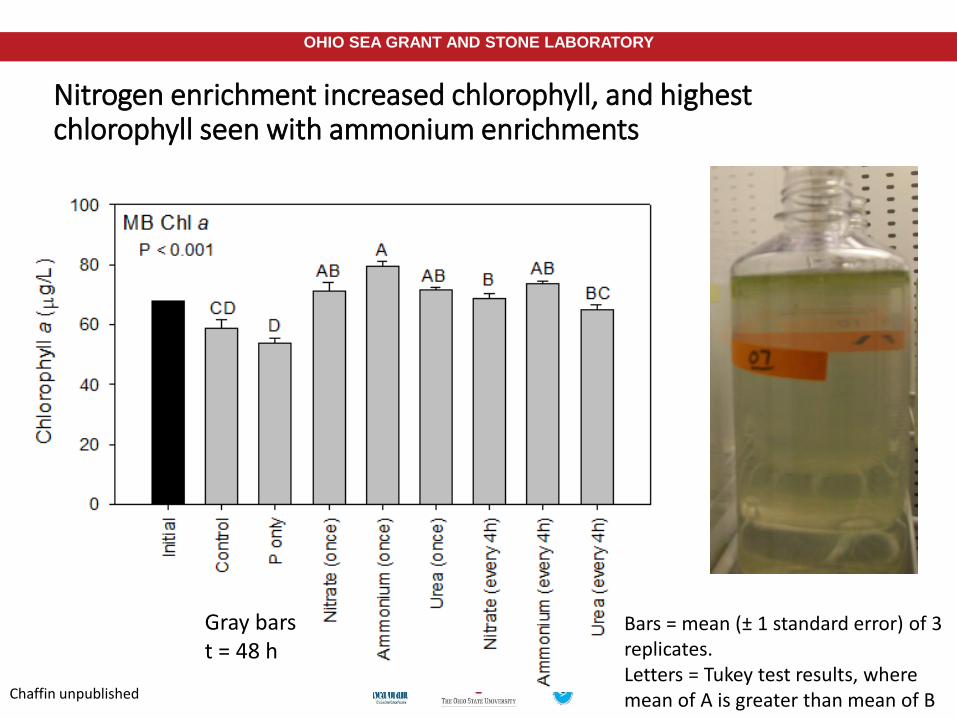
Nitrogen enrichment increased chlorophyll, and highest chlorophyll seen with ammonium enrichments
Bars = mean (± 1 standard error) of 3 replicates. Letters = Tukey test results, where mean of A is greater than mean of B
Gray bars t = 48 h
Chaffin unpublished

OHIO SEA GRANT AND STONE LABORATORY
Nitrogen increased microcystin concentration and highest microcystin with increased nitrate and urea
Bars = mean (± 1 standard error) of 3 replicates. Letters = Tukey test results, where mean of A is greater than mean of B
Gray bars t = 48 h
Chaffin unpublished

OHIO SEA GRANT AND STONE LABORATORY
-
0.02
0.04
0.06
0.08
0.10
0.12
0.14
0.16
0.18
t=0
t=4,C
ontrol
t=4,P
only
t=4,N
itrate(once)
t=4,A
mmonium(once)
t=4,U
rea(once)
t=4,N
itrate(every4h)
t=4,A
mmonium(every4h)
t=4,U
rea(every4h)
t=48,C
ontrol
t=48,P
only
t=48,N
itrate(once)
t=48,A
mmonium(once)
t=48,U
rea(once)
t=48,N
itrate(every4h)
t=48,A
mmonium(every4h)
t=48,U
rea(every4h)
Rel
ativ
e ex
pre
ssio
n (
mcy
D:R
PO
C1
)
A
B B
B B
A
A
B
Microcystin synthesis genes up-regulated within 4 hours of exposure to 100 µM ammonium and urea* but not nitrate.
Bars = Mean ± SE; A and B = significantly up-regulated (p < 0.05)
t = 4 h Chaffin unpublished

OHIO SEA GRANT AND STONE LABORATORY
-
0.02
0.04
0.06
0.08
0.10
0.12
0.14
0.16
0.18
t=0
t=4,C
ontrol
t=4,P
only
t=4,N
itrate(once)
t=4,A
mmonium(once)
t=4,U
rea(once)
t=4,N
itrate(every4h)
t=4,A
mmonium(every4h)
t=4,U
rea(every4h)
t=48,C
ontrol
t=48,P
only
t=48,N
itrate(once)
t=48,A
mmonium(once)
t=48,U
rea(once)
t=48,N
itrate(every4h)
t=48,A
mmonium(every4h)
t=48,U
rea(every4h)
Rel
ativ
e ex
pre
ssio
n (
mcy
D:R
PO
C1
)
A
B B
B B
A
A
B
Microcystin synthesis genes expression was similar between 100 µM and 8.3 µM nitrogen 4 hours after exposure
Bars = Mean ± SE; A and B = significantly up-regulated (p < 0.05)
Small and large pulses of reduced nitrogen increased microcystin synthesis gene expression.
100 µM 8.3 µM
Chaffin unpublished

OHIO SEA GRANT AND STONE LABORATORY
-
0.02
0.04
0.06
0.08
0.10
0.12
0.14
0.16
0.18
t=0
t=4,C
ontrol
t=4,P
only
t=4,N
itrate(once)
t=4,A
mmonium(once)
t=4,U
rea(once)
t=4,N
itrate(every4h)
t=4,A
mmonium(every4h)
t=4,U
rea(every4h)
t=48,C
ontrol
t=48,P
only
t=48,N
itrate(once)
t=48,A
mmonium(once)
t=48,U
rea(once)
t=48,N
itrate(every4h)
t=48,A
mmonium(every4h)
t=48,U
rea(every4h)
Rel
ativ
e ex
pre
ssio
n (
mcy
D:R
PO
C1
)
A
B B
B B
A
A
B
Bars = Mean ± SE; A and B = significantly up-regulated (p < 0.05)
mcy expression maintained 48 hours after N exposure.
Chaffin unpublished

OHIO SEA GRANT AND STONE LABORATORY
-
0.02
0.04
0.06
0.08
0.10
0.12
0.14
0.16
0.18
t=0
t=4,C
ontrol
t=4,P
only
t=4,N
itrate(once)
t=4,A
mmonium(once)
t=4,U
rea(once)
t=4,N
itrate(every4h)
t=4,A
mmonium(every4h)
t=4,U
rea(every4h)
t=48,C
ontrol
t=48,P
only
t=48,N
itrate(once)
t=48,A
mmonium(once)
t=48,U
rea(once)
t=48,N
itrate(every4h)
t=48,A
mmonium(every4h)
t=48,U
rea(every4h)
Rel
ativ
e ex
pre
ssio
n (
mcy
D:R
PO
C1
)
A
B B
B B
A
A
B
Bars = Mean ± SE; A and B = significantly up-regulated (p < 0.05)
After 48 hours, nitrate and P-only increased expression. No difference between single dose and every 4 hour doses.
Chaffin unpublished

OHIO SEA GRANT AND STONE LABORATORY
Overall summary
• Charter captains augment existing water quality monitoring programs • Citizen science. Public education
•Data buoys can be used to predict cyanobacteria and water clarity. • But not total chlorophyll
•Dolichospermum (Anabaena) blooms in the central basin despite high N:P ratios • Blooms 4 of last 5 summers
•Nitrogen enrichment stimulates microcystin production by Microcystis and Planktothrix. • Low pulses and large pulses triggered same responses. • Does not down play the role of phosphorus

OHIO SEA GRANT AND STONE LABORATORY
Acknowledgements • Ohio EPA (Charter captain sampling) • Ohio Water Resources Center (Buoy project) • Ohio Department Higher Education (Central Basin) • Ohio Sea Grant (Nitrogen and toxicity)
• Collaborators: The Captains, Tim Davis, Doug Kane, Darren Bade,
George Bullerjahn, Mike McKay, Rick Stumpf, Heather Raymond
• Fondriest Environmental
• Stone Lab REU students and Friends of Stone Lab
• Stone Lab staff

OHIO SEA GRANT AND STONE LABORATORY
Questions & Discussion
MODIS. October 2011
Top Related