


Languages
Pages
Legal


NTCC REPORT
ON
VALUATION OF A NON-GREEN BUILDING (EROS CORPORATETOWER) IN COMPARISON TO A GREEN BUILDING (GREEN
BOULEVARD) LOCATED IN NOIDA MBA-REUI
2013-2015
To
RICS School of Built Environment
By
Akash Gupta
(A13558913055)
Under the guidance of
Prof. Saurabh Verma
In Partial Fulfillment of the Requirements for the Degree ofMaster of Business Administration
AtRICS SCHOOL OF BUILT ENVIRONMENT
AMITY UNIVERSITY UTTAR PRADESHSECTOR 125, NOIDA – 201303, UTTAR PRADESH, INDIA

DECLARATION
I hereby declare, this Dissertation Report “Valuation Of A Non Green
Building In Comparision With A Green Building” which is submitted
for partial time fulfillment of the requirement for the award of degree of
Masters of Business Administration (MBA)-Urban Infrastructure and
Real estate to RICS School of Built Environment, Amity University as
my own work and no part of my report has been copied from other
reports or directly from websites except where due reference has been
made.
AKASH GUPTA MR. Saurabh Verma Roll Number –A13558913055 (Faculty Guide)MBA (REUI)Batch 2013-2015
3

ACKNOWLEDGEMENT
First of all, I would like to thank almighty, whose generous blessings made the
internship a success and I want to thank my supportive parents from whom I learned
the value of writing succinct sentences.
I am very thankful to my Faculty Mentor- Mr. Saurabh Verma for giving me an
opportunity to carry out dissertation on “Valuation Of A Non Green Building
In Comparision With A Green Building”
Last but not the least; I would like to thank all the interviews and respondents
without whom it was impossible to complete my research.
AKASH GUPTA MR. SAURABH VERMARoll No. A135589113055 (Faculty Guide)MBA (REUI)Batch 2013-2015
4
CERTIFICATE
This is to certify that the dissertation done on “Valuation Of A Non
Green Building In Comparision With A Green Building” submitted to
RICS School of Built Environment, Amity School by Mr. AKASH GUPTA
a student of post graduate Degree in MBA (REUI), Batch 2013-2015), is
the student’s own work carried out under my supervision. The matter
present in this dissertation report has not been submitted anywhere else for
the award of any other degree.
AKASH GUPTA MR. SAURABH VERMARoll No. A135589113055 (Faculty Guide)MBA (REUI)Batch 2013-2015
5

Table of ContentsGreen Buildings & India............................................................................................................8
Introduction..........................................................................................................................8
The Growing Crises...............................................................................................................9
Green Rating Systems.........................................................................................................11
Green Buildings in India......................................................................................................12
Costs & benefits of Green Buildings in India.......................................................................13
Cost Premium of Green Buildings.......................................................................................14
Paharpur Business Centre......................................................................................................16
PRODUCTIVITY ANALYSIS.......................................................................................................17
Valuation............................................................................................................................22
Eros Corporate Tower............................................................................................................23
Productivity Analysis..............................................................................................................24
Location Analysis................................................................................................................27
Valuation................................................................................................................................30
Comparative Analysis.............................................................................................................31
Conclusion..............................................................................................................................32
6

Figure 1: Constituent parts of Sustainability.............................................................................5Figure 2: Performance of Green Buildings in India...................................................................9Figure 3: Paharpur Business Centre........................................................................................11Figure 4: Location Map of Paharpur Business Centre.............................................................12Figure 5: Catchment Areas of Paharpur Business Centre.......................................................13Figure 6: Eros Corporate Tower..............................................................................................14
7

Green Buildings & India...
Introduction
The tremendous growth in economic activity across the globe is placing pressure on
natural and environmental resources. There is increasing evidence that human
activities are causing an irreversible damage to the global environment, which will
have an adverse impact on the quality of life of future generations. The rising
concern for the environment in response to global warming is driving thinkers to
seek sustainable solutions.
The real estate industry is a significant contributor to the global warming due to
extensive emissions of greenhouse gases (GHGs) from the energy use in buildings. In
some countries, the built environment accounts for about 40% of the energy used.
Therefore, there is an imperative for the industry to develop sustainable building
technologies and green buildings.
The construction industry in India is growing rapidly at a rate of 10% compared with
the world average of 5.2%. It is observed that buildings in India consume about 20%
of the total electricity in the country. Hence, real estate activity in India has a
significant impact on the environment and resources. This indicates that there is a
real opportunity to develop green buildings in the country.
However, developers face a major challenge in the development of green buildings
as in some cases this increases construction costs. Developers find it difficult to opt
for green buildings due to price constraints, difficulty in sourcing green building
materials, technologies and service providers or facilitators in India.
8

The Growing Crises
Global warming is the increase in the average measured temperature of the Earth’s
near-surface air and oceans since the mid-20th century. Global warming can cause a
20% recession in the world’s GDP as this phenomenon increases the possibility of
occurrence of natural disasters altering the world’s GDP. It threatens the melting of
glacial ice, increasing the seawater level and causing devastating effects on the
coastal world. It is learnt that GHGs, which are produced and emitted due to human
activity, are responsible for global warming.
The world is taking action in addressing the issues leading to global warming. The
first step in this regard was the United Nations Framework Convention on Climate
Change (UNFCCC) treaty in 1992. UNFCCC was formalised as the Kyoto Protocol on
11 December 1997, with the objective of reducing GHG emissions to prevent the
man-made global warming process. The Kyoto Protocol aims to be a holistic
guideline restricting and reducing emissions in developed countries and at the same
time facilitating emission reduction in the developing world. GHG emission in
developed countries is capped with a fixed quota. However, if countries or
companies exceed their quota of emission, they can still earn carbon reduction
credits either by buying credits in the international carbon credit market and/or
through clean development mechanisms (CDMs).
Global warming can cause a 20% recession in the world’s GDP as
this phenomenon increases the possibility of occurrence of
natural disasters altering the world’s GDP
The framework provided by UNFCCC has revived the concept of sustainability and
placed the focus squarely on GHGs emissions. It has also given a fillip to the green
industry movement such as renewable energy production and the efficient usage of
energy resources and other resources.
9

Sustainable Real Estate Development & Green Buildings
Sustainable development is defined as ‘Meeting the needs of the present generation
without compromising the ability of future generations to meet their needs’.
The field of sustainable development can be conceptually broken into three
constituent parts - social sustainability, environmental sustainability and economic
sustainability (Figure 1). The performance of the industrial economy has always been
measured through single bottom-line (financial) results. However, striking a balance
between environmental, social and economic performance is a key to achieving
sustainable outcomes. This has given rise to the concept of triple bottom line.
The real estate industry is one the major
energy consumers and GHG emitters.
According to a report by the
Intergovernmental Panel on Climate Change
(IPCC) in 1996, the real estate industry is
expected to consume 38% of the global
energy and emit 3,800 mega tonnes of GHGs
every year. This does not include the usage of
other resources such as water. Therefore, the increasing crises of global warming,
depleting resources and consumer pressures have pushed the agenda of
sustainability in the real estate sector.
Growing human activity has increased the concern for sustainability even more in
recent times. Sustainability in the real estate context is not only limited to energy
conservation, but also includes resource usage, impact on the neighbouring
environment and working conditions for tenants. This concern has led to the
development of green buildings. The green building concept broadly integrates many
interests and aspects of sustainability emphasising reduction of environmental
impacts through a holistic approach to land and building uses and construction
strategies.
10
Figure 1: Constituent parts of Sustainability

A green building uses less energy, water and natural resources than a conventional
building. It also creates less waste and provides a healthier living environment for
people living inside it compared to a conventional building. Green buildings
incorporate several sustainable features such as efficient use of water, energy-
efficient and eco-friendly environment, use of renewable energy and
recycled/recyclable materials, effective use of landscapes, effective control and
building management systems and improved indoor quality for health and comfort.
Sustainability is not just limited to energy conservation, but it has
also been expanded to resource usage, the neighbouring
environment and working conditions for tenants. This concern has
led to the development of green buildings.
The overall benefits of green buildings mostly depend on the extent to which the
sustainable features are addressed during the initial planning and design. A green
building is most likely to succeed in its objective if sustainable features are
envisioned and incorporated right at the design stage. The design has to take into
consideration the entire supply chain—from material sourcing, energy modelling,
resource reuse, civic amenities & waste disposal to tenant education.
Green Rating Systems
The green building movement has led to the emergence of various green rating
systems. The predominant ones are:
11
BREEAM Building Research Establishment Environmental Assessment MethodWidely used in UK
LEEDLeadership in Energy & Environmental DesignDeveloped by US Green Building CouncilUsed in the US
Green Star
Developed by the Green Building Council of Australia and used in AustraliaNew Zealand GBC have their own version of Green Star
CASBEEComprehensive Assessment System for Building Environmental EfficiencyDeveloped by Japan Sustainable Building ConsortiumUsed in Japan
Green Mark
Used in SingaporeMandated by the Building & Construction Authority for all new development and retrofit works
NABERSNational Australian Built Environment Rating SystemManaged by NSW Dept. of Environment & Climate ChangeOnly rating system to measure ongoing operational performance

The green rating systems followed in India are:
LEED India - administered by the Indian Green Building Council (IGBC);
GRIHA - Green Rating for Integrated Habitat Assessment developed by TERI (The
Energy and Research Institute).
These tools are relatively new and have not fully evolved. There is no doubt that
more and more developers are resorting to these systems to get their buildings
certified. Rating systems provide a tool to enable comparison of buildings on their
sustainability credentials. Many occupiers and investors are using these tools as a
guide to selecting properties for lease or acquisition. Meanwhile, these systems are
also being constantly improved. Therefore, the entire green building ecosystem is
getting in place. Among all these rating systems, LEED has emerged as the most
popular and is followed across 24 countries across the globe, including India.
A green building is most likely to succeed in its objective if
sustainable features are envisioned and incorporated right at the
design stage.
Green Buildings in India
The green building movement in India started with the establishment of the IGBC in
2001, which was an initiative of the Confederation of Indian Industries (CII) along
with the World Green Building Council and the USGBC. The first green building in
India, CII-Sohrabji Godrej Green Business Centre in Hyderabad, was inaugurated on
14 July 2004. This was a great symbolic achievement. Since then, the number and
volume of green buildings in India has been phenomenal. The movement started
with 20,000 sq. ft. in 2004 and has grown exponentially, with an expected green
building footprint of 15 million sq. ft. by end-2008. There are 18 LEED certified
buildings with a total area of about 8.5 million sq. ft. and 195 projects registered for
LEED certification with a total area of about 110 million sq. ft. as of year-end 2007.
12

The real estate industry is one of the biggest emitter of GHGs in India. According to a
report by the Ministry of Power in June 2004, 20–25% of the electricity consumed in
government buildings is wasted due to inefficient design. ‘The scenario is almost the
same in the private sector.
It is heartening to know that the green building concept is widely being adopted in
the Indian real estate industry. However, efforts are not enough and a greater push
is required to make real estate development sustainable. In the next 3-4 years about
200 million sq. ft. of commercial space and 45 million of retail space is expected to
be constructed across the major cities of India which indicates that there is a great
opportunity for developers and occupiers to promote green buildings.
Costs & benefits of Green Buildings in India
In terms of appearance or use, there is no difference between green buildings and
conventional ones. The major differences are that green buildings have improved
indoor environment and they offer operational savings. Green buildings have been
observed to have tangible and intangible benefits. The tangible benefits such as the
economic advantages are not immediately visible. However, the lifetime payback is
much higher compared with that of conventional buildings, which mainly accrue
from operational cost savings, reduced carbon emission credits and potentially
higher rental or capital values.
The intangible benefits such as social advantages are due to the positive impact of
green buildings in the neighbourhood environment. Moreover, due to better
working conditions, the productivity of occupier increases and health problems
decreases.
The tangible benefits such as the economic advantages are not
immediately visible. However, the lifetime payback is much
higher compared with that of conventional buildings, which
mainly accrue from operational cost savings, reduced carbon
emission credits and probably higher rental or capital values.
13

Figure 2: Performance of Green Buildings in India
The performance of green buildings in India, as mentioned in Table 2 below,
indicates that platinum-rated buildings have a higher payback period of five to seven
years, while gold-rated and silver-rated buildings have a payback period of three to
four years. These tangible and intangible benefits define the triple-bottom-line
returns of green buildings.
Cost Premium of Green Buildings
The general sentiment among the developer community is that green buildings cost
higher than similar conventional buildings, and it is difficult to get positive returns on
this extra investment. This issue is mainly due to:
The still-evolving nature of green buildings;
The lack of technical information;
The incomplete/inefficient execution of green projects;
The short-term view on returns, instead of focusing on lifetime return on
investment (ROI) of these buildings.
In mature markets the cost premium range from 1-6%. Cost premium in India is in
the range of 6–18% (Table 2) depending on the level of rating. This can be attributed
to lack of technical know-how, immaturity of the market and lack of resources. We
foresee the cost premium in India to realign to the mature markets with the increase
in awareness and availability of resources.
Scope / Nature of Work
14

Our major objective throughout this project would remain to test the credibility and
credentials of various reports suggesting that green rated buildings accrue benefits
not only to the occupants and the environment, but also to owners of green rated
buildings. We would be working towards judging these very points and draw
conclusions based on the results we procure based on our study of the chosen
buildings in the region of Delhi NCR. Our main area of focus would remain the
owner’s perspective and his financial gains, if there are any.
The whole project entails the comparable required to compare the green building
with a conventional one. The way forward would be enlist various parameters for
comparison between the 2 buildings.
The buildings for the purpose of study have been chosen. The green building which
we are looking at is Paharpur Business Centre & the conventional buildings which
would act as comparable building is EROS Commercial Tower.
The above mentioned buildings have been visited and analysed for further research,
the facilities management team of the various buildings have been met in order to
procure the relevant information.
15

Figure 3: Paharpur Business Centre
Paharpur Business Centre
Paharpur Business Centre &
Software Technology Incubator
Park started its serviced office
business in 1990. Paharpur
Business Centre is a trusted
brand for many corporate &
multinationals. It has and is
delivering quality service to its
customers for over two
decades. It is the only business centre in Delhi meeting five international quality
standards.
Located in Nehru Place, a prime commercial centre, Paharpur Business Centre is easy
to approach.
Key Points:
Indoor Air Quality system confirms to ASHRAE Standards, ensuring fresh air in
the facility ultimately resulting to increased productivity
Accessible 24/7 and 365 days open, Business Hours: 9a.m - 7p.m (Monday to
Friday). Option available for late working, extendable to 24 hours as per
requirement
Dedicated Parking facilities for our customers
Insurance to cover immediate relocation in case of disaster (fire, earthquake,
etc.)
Paharpur Business Centre is also a signatory to UN Global Compact &
Women’s Empowerment Principles (WEP). It is a Government recognized
private STIP unit
Paharpur Business Centre is a registered Software Technology Park with
Government of India
16

PRODUCTIVITY ANALYSISCertifications-
ISO 9001:2008 for Quality Management System
ISO 14001:2004 for Environment Management System
ISO 22000:2005 for Food Safety Management System
ISO 50001:2011 for Energy Management Services
OHSAS 18001:2007 for Occupational Health & Safety
SA 8000:2008 for Social Accountability
TOTAL BUILT UP AREA 50,400 SQ.FTNO. OF FLOORS B+G+6FLOOR PLATE AREA 6300 SQ.FTLEASED UP AREA 15000 SQ.FTVACANT AREA 35,400 SQ.FTNO. OF PARKINGS 3PARKING COST 4000/CAR/MONTHCONFERENCE ROOM 20VIRTUAL OFFICE SPACE YESMEMBERSHIP CHARGES RS.4000 /LIFETIME
TENANT DETAILS
FLOOR NO TENANT NAME AREA OCCUPIED(SQ.FT)
RENT
G CAFETERIA 1500RESTURANT 2500
1ST FLIPKART 3000 RS.200/SQ.FT- 3200
2ND EMC 1500 RS.200/SQ.FTSHELL 1500 RS.200/SQ.FTHALLMARK 2000 RS.200/SQ.FT- 1300
3RD FIRELLI 6300 RS.350/SQ.FT4TH MICROSOFT 1000 RS.350/SQ.FT5TH - 6300 RS.350/SQ.FT6TH - 6300 RS.350/SQ.FT
OTHER INCOME
20 CONFERENCE ROOMS
17

4 PERSON TO 100 PERSON – RS400 / PER PERSON / PER HOUR
VIRTUAL ROOMS
PLAN 1 - RS.3000/MONTH PLAN 2 - RS.6000/MONTH PLAN 3 - RS.9000/MONTH
OPERATION AND MAINTENANCE COSTS
MAINTENANCE COST RS.100/SQ.FTSINKING FUND RS.50/SQFT/YEARINSURANCE COST RS.1 PER SQ.FT/YEARLEASE AND MANAGEMENT CHARGES RS.1/SQ.FT/YEAR
FACILITIES
TRAINING ROOM
Training room with a capacity of 15 to 20 person Equipped with state-of-the-art computers networked with AT & T, CAT 5E Cabling XGA compatible LCD projector with laser Pointer. Internet access
CONFERENCE FACILITY
My conferencetm - Capacity 6 to 25 persons Interview cabins Meeting rooms, Video conferencing, Audio conferencing, Web conferencing
OFFICE FACILITIES
Instant fully serviced offices - modules for 2 to 150 persons Combinations of modules with areas per person ranging from 50 to 200 sq. Ft .:. 1200 nodes
on LAN
COMMON AREAS
Reception Waiting area Lounges
TRANSPORTATION FACILITY
DELHI METRO CAR POOLING SERVICES DTC BUS SERVICE
18

TAXI SERVICE AUTO STAND
EXTERNAL ENVIRONMENT
6 ACRE SURROUNDING PARKS CAR PARKING ON 3 SIDES OF THE BUILDING MAIN ROAD ON THE FRONT SIDE PETROL PUMP ON THE BACK SIDE
Lighting levels
Meets lux level requirements as per DIN 5035 part 2 - International Standard Lighting conservation initiatives 5 stars rated electrical appliances are used. Installed motion sensors to control the misuse of electricity. . Replaced all the desktops with laptops. Noise level meeting IS notification in respect of noise as per the gazette of India extraordinaire
of Feb 14, 2000. LEDs use only 2-10 watts of electricity (1/3rd to 1/30th of Incandescent or Compact
Fluorescent Lights) and last up to 10 times as long as CFL's. • Replaced CFLs with LED lights.
• Upgraded HVAC, electrical system and cooling towers that have a payback period of 8-14 years.
Noise level
Meets Indian standard notification in respect of noise, as per the Gazette of India extraordinary of Feb. 14, 2000
Security & Fire Safety
24 hours security on each floor. Access control and screening of all visitors. Closed circuit TV security systems. Fire clearance certificate from Delhi Fire Department. Fully automatic fire alarm system, smoke sensors, firefighting equipment Staff trained in the use of fire fighting and
evacuation procedures. Special diesel engine driven pump for fire wet riser, with underground 200,000 litre storage tank for fire emergency
Air Quality
It uses patented technology to detoxify indoor air and
grow mountain fresh air. They grow fresh air with the help of more than 1200 toxin-removing indoor plants.
WATER CONSERVATION TECHNIQUES
19

Sensor Taps Use of Soap Free Water for Gardening Installation of cistern based 4/2 Liter Water Closet (WC) Rain Water Harvesting
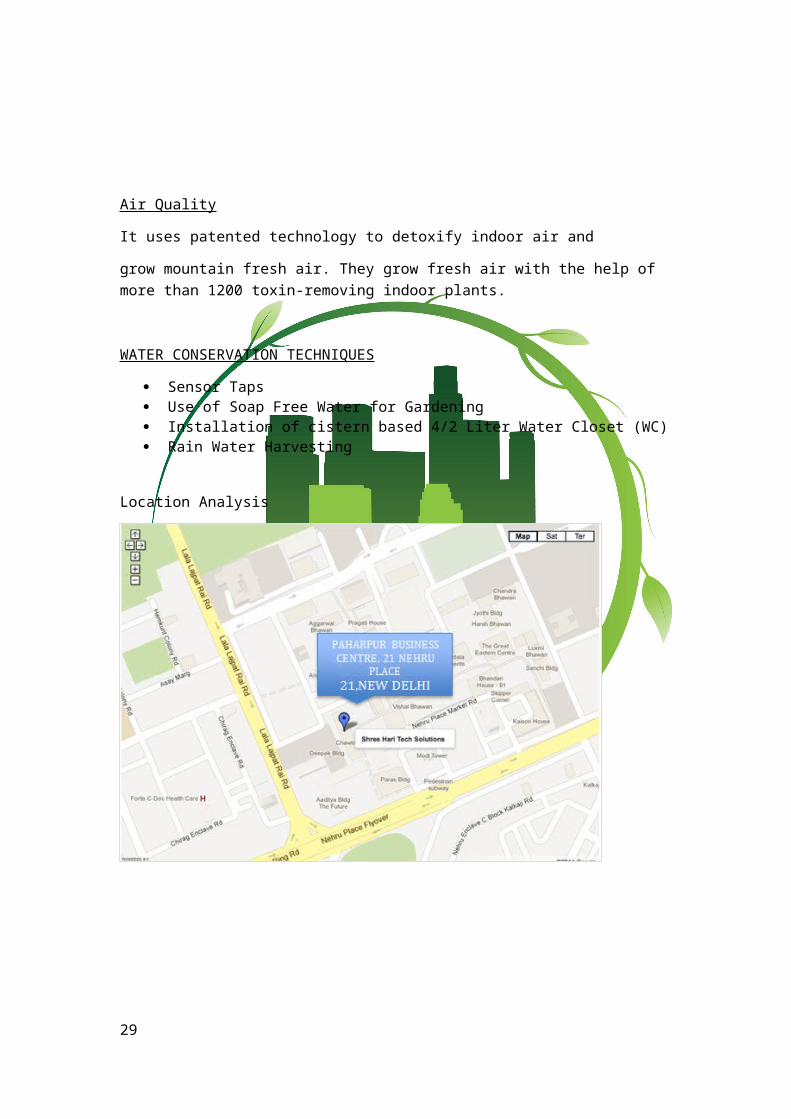
Location Analysis
Proximities Distance
Bus Stop 150 m
Metro Station 380 m
Airport 15 km
Delhi CBD 7.5 km
Paharpur Business Centre is located in Nehru Place, South Delhi, which is the most
elite location to be in. It thus, holds a high capital value as among other locations
throughout Delhi.
Catchment Area
20

Primary Catchment Area covers most of the South Delhi Area as the tenants looking
for an office in this area will give their first preference to Nehru Place.
Secondary Catchment Area covers almost all of Delhi as prospects wanting to have
an office in Delhi will give their first preference to Nehru Place too.
Tertiary Catchment Area covers the areas of Gurgaon, Faridabad & NOIDA, including
the major area of NCR. The prospects of this area will have South Delhi as their
preferable option.
21
Figure 4: Catchment Areas of Paharpur Business Centre

ValuationYear 1 Year 2 Year 3 Year 4 Year 5 Year 6 Year 7 Year 8 Year 9 Year 10
Gross Income (GI) 59460000.00 62433000.00 65554650.00 68832382.50 72274001.63 75887701.71 79682086.79 83666191.13 87849500.69 92241975.72Outflows 23721400 24515956 25349916.52 26225245.23 27144003.85 28108357.05 29120577.6 30183051.74 31298284.92 32468907.68
Net Operating Income (NOI) 357,38,600.00 379,17,044.00 402,04,733.48 426,07,137.27 451,29,997.77 477,79,344.65 505,61,509.19 534,83,139.39 565,51,215.76 597,73,068.04 Year 1 Year 2 Year 3 Year 4 Year 5 Year 6 Year 7 Year 8 Year 9 Year 10
Gross Income (GI) 59460000.00 62433000.00 65554650.00 68832382.50 72274001.63 75887701.71 79682086.79 83666191.13 87849500.69 92241975.72Outflows 23721400 24515956 25349916.52 26225245.23 27144003.85 28108357.05 29120577.6 30183051.74 31298284.92 32468907.68
Net Operating Income (NOI) 357,38,600.00 379,17,044.00 402,04,733.48 426,07,137.27 451,29,997.77 477,79,344.65 505,61,509.19 534,83,139.39 565,51,215.76 597,73,068.04
Inflow Escalation
VIRTUAL ROOM CHARGES ESCLATION 3%RENT ESCALATION 5%
PARKING CHARGES ESCLATION 2%INCREASE IN CONFERENCE FACILITY CHARGES 5%
Insurance Expenses 0.50% of cost of constructionCAM Charges 100 Rs. Per sq ft per monthLease and asset management charges 1% of basic rent & parking chargesMarketing Expenses 50,00,000.00 per yearSINKING FUND 50 /SQ.FT/YEAR
Outflows
By following the DCF method under Income Approach, the value of the building is
same as its NPV.
From the above calculations, the Value of the building is ₹ 2517,56,381.96
22
Eros Corporate Tower
Eros Corporate Tower is strategically located in the Nehru Place District Centre
situated opposite to Nehru Place Metro Station. The tower is one of the world class
premium addresses in the business
world.
Many leading multinational companies
like Microsoft, Barclays Bank, ENI India,
Jetro, BT India Pvt. Ltd., Sinosteel India,
Suzlon, Finmeccanica, Sjitz India, HDFC
Ergo, Axis Bank, Russell Reynold, Regus,
Korean Exim Bank, OOCL India, Royal
China etc., have chosen to operate
their businesses from this tower with
its perfect location.
It is a sixteen storey commercial
tower with interconnected seven storey car parking which can accommodate 1000
cars and 50 buses, thus being just one of its kind to match international quality
standards.
The complex has a built-up area of approx. 6,50,000 sq ft. (60,400 sq mtr.). The
commercial tower offers approx. 14,000 sq.ft. (1300 sq.mtr.) per floor.
23
Figure 5: Eros Corporate Tower

Productivity AnalysisThe Location: South Delhi
Sub Location Name: Nehru Place
Developer Name: Eros Group
Property Type: Commercial Properties
Property Sub Type High Rise (Campus type)
Property Status: Functional Building
Floor Available: Office space is subject to the availability
Total Floors in Building Ground + 16 Floors
Building Facing North East
Internal Emenities
Air Conditioned Intercom Facility Internet / Wi-Fi Connectivity RO Water System
External Emenities
Power Back Lift Reserved Parking Security Water Storage Service/Goods Lift Visitor Parking Cafeteria/Food Court Conference Room 24 HRS SECURITY
24

Area specifications
AREA CALCULATION AREA(SQ.FT)
LAND AREA 196,020TOTAL BUILT UP AREA 650,000COMMERCIAL TOWER AREA 247,337PARKING AREA 372,663SOLDOUT AREA 46,243SELF OCCUPIED 23,377LEASED UP AREA 156,263VACANT AREA 21454RETAIL SHOPS 30,000
FLOOR PLATE AREA 13740.94444
CONSTRUCTION COST 445206600
CAR PARKING
TOTAL BUILT UP AREA 3,72,663 SQ.FTTOTAL CARS PARKED 1000 CARSTOTAL BUSSES 50 BUSESSPACE ACQUIRED BY 1 CAR- 372 SQ.FT
TOTAL CARS IN A DAY 700 CARSIN A YEAR 2,10,000 CARSAVERAGE RENT/CAR RS.30/CARFIXED CARS RENTAL RS.5000/ MONTHNO. OF FIXED CARS 200TOTAL RENT FROM FIXED CARS 1,20,00,000INCOME RS.2,04,00,000/- ANNUALLY
OPERATING AND MAINTENANCE COSTS
INSURANCE COST RS.1/SQ.FT ANNUALLYSINKING FUND RS.24/SQ.FT/ANNUALLYMAINTENANCE CHARGES RS.25/SQ.FT/MONTHLEASE AND ASSET MANAGEMENT CHARGES RS.1/SQ.FT ANNUALLY
Key tenants
25

FLOOR NO
TENANT NAME
GROUND BARCLAYS BANK PLCHDFC ERGO GENERAL INSURANCE CO.LTD
1 BARCLAYS BANK PLC2 FINMECCANICA
AGUSTA WESTLANDFINCANTIERI
3 ABC CONSULTANTS PVT.LTDVRACKAL TRADINGOOCL LOGISTICSINABENSA BHARAT PVT.LTD
4 JAPAN EXTERNAL TRADE ORGANISATIONINTERNATIONAL ENTERPRISE SINGAPOREBELTECHINDUSTRIAL KOREAWESTERN DIGITAL
5 MICROSOFT CORPORATION INDIA PVT LTDTRANSASIA INFRASTRUCTURE INDIA PVT.LTSALEXES INDIA PVT.LTD
6 KYOSON INDIA PVT.LTDANDRITZ INDIA PVT.LTDIDEMITSUEFACEC INDIA PVT.LTDJETRO
7 SOJITZ INDIA PVT.LTDSOJITZINDIA PVT.LTD
8 EROS OFFICE9 SUZLO.N ENERGY LTD
FIRST SOLAR POWER INDIA PVT. LTDSINGAPORE TOURISM
10 TREND MICRO INDIA LTDSTEVEN ROCKEROS OFFICE
11 YANMAR INDIA PVT. LTDDT INDIA PVT.LTD
12 ST ENGINEERINGVOSSLOHSINO Steel India Pvt.LtdHITACHI
14 LINTECINDRAEni India ltd
15 Regus
Space available for rent
26

Figure 6: Location Map of Eros Corporate Tower
Figure 7: Catchment areas of Eros Corporate Tower
FLOOR NO. SPACE AVAILABLE
rent/sq.ft total rent CONTACT PERSON
CONTACT NO.
1 6000 250 15,00,000 Sanjeet Sharma
9810069114
5 7500 175 13,12,5007 2500 200 5,00,00012 5500 175 9,62,500
Location Analysi s
Proximities Distance
Bus Stop 150 m
Metro Station 380 m
Airport 15 km
Delhi CBD 7.5 km
Eros Corporate
Tower is located in
Nehru Place, South Delhi, which is the most elite location to be in. It thus, holds a
high capital value as among other locations throughout Delhi.
Catchment Area
27

Primary Catchment Area covers most of the South Delhi Area as the tenants looking
for an office in this area will give their first preference to Paharpur Business Centre.
Secondary Catchment Area covers almost all of Delhi as prospects wanting to have
an office in Delhi will give their first preference to Nehru Place.
Tertiary Catchment Area covers the areas of Gurgaon, Faridabad & NOIDA, including
the major area of NCR. The prospects of this area will have South Delhi as their
preferable option.
Areas near Nehru Place Chirag Delhi Okhla Kalkaji Sarita Vihar Govindpuri Jasola Vihar Chittaranjan Park Siri Fort
NEARBY COMMERCIAL BUILDINGS
International Trade Tower Eros Corporate Tower IFCI Tower Devika Tower Chiranjeevi Tower Ansal Tower Hemkunt Tower Paharpur Business Centre
RENT IN NEARBY BUILDINGS
1. ANSAL TOWER- RS100/SQFT2. DEVIKA TOWER- RS 80/SQFT3. MODI TOWER- RS 100/SQFT4. INTERNATIONAL TRADE TOWER- RS125/SQF
28
ValuationInflowsRent Offi ce Space:
Ground 34,35,236.11 Rest 205,81,569.44 Retail -
Parking 2,04,00,000Other Virtual Rooms 24,00,000.00 Total Inflows 264,16,805.56
OutflowsMaintenance 61,83,425.00 Asset Management 2,40,168.06 Insurance 20,611.42 Total Outflow 64,44,204.47
Net Operating Income Monthly 199,72,601.08 Annual 2396,71,213.00
Offi ce rentals 1-16 FLOOR/MONTH 170 Per Sq FtOffi ce rentals (GF)/MONTH 250 Per Sq FtRetail Rentals/MONTH 300 Per Sq Ft
No. of paid car parking slots occupied 150Parking charges per car per month 5000
Inflows
Insurance Expenses 1 SQ.FT/ANNUMCAM Charges 25 Rs. Per sq ft per monthLease and asset management charges 1% of basic rent & parking chargesSINKING FUND 24 RS/SQ.FT/YEAR
Outflows
Following an Income Approach, the value of the building is assessed by dividing the Net Operating Income of the Building with the Capitalization rate of the Area.
29

In Nehru Place, the Cap. Rate is at 9%
Thus, the value of the building = NOI/Cap. Rate
=23,96,71,213/0.09
= ₹ 26630,13,477.78
Comparative AnalysisEros Corporate Tower is a successful commercial building in the area. It has reputed
clients & is having a good amount of profit. It even has a decent value to itself.
Paharpur Business Centre on the other hand, though being Green, is making a Y-o-Y
loss. It still has a lot of area vacant but has managed to lease out to some reputed
tenants.
The reasons for Paharpur Business Centre not performing as good as Eros Corporate
Tower are:
o Higher Rent because of higher construction cost
o Market not willing to pay for Green
PBC has incurred high construction costs for its LEED Platinum Certification. Which is
why it is demanding higher rent than ECT. Also, the people still think that Green
Buildings are a gimmick & just a marketing strategy, making them unwilling to pay
higher rent for the Green.
However, due to the rise of Green buildings in India, people are becoming aware of
the benefits they can derive from Green Building. Thus, over a few years’ time, PBC is
ought to be able to lease out its vacant space & make higher profits.
Eros Corporate Tower, on the other hand, can benefit by inculcating some green
practices in the building. These can include glazed windows, solar panels, natural
ventilation, efficient equipment, etc. These features will reduce the operating
expenses of the building, thus, making it even more profitable.
30

31

Conclusion
The idea of energy efficient, healthy buildings has been around for a long time, now
that the concept of “green” or “sustainable” building is entering the mainstream and
catching the attention of fortune 500 companies like Wall Mart, Dupont, and Home
Depot etc. There are probably several reasons; Global Warming, rising energy costs,
the growing awareness and liability costs associated with “Sick Building Syndrome”,
declining oil reserves, and concerns about our limited water supply. The list goes on,
but whatever the reason or reasons; sustainable building is a concept whose time
has come.
Green building revolves around four key issues:
1. Designing for energy efficiency including the use of renewal energy sources
such as wind, geothermal, and solar.
2. Creating a healthy indoor air environment with adequate ventilation and
making material choices that minimize volatile organic compound (VOC’s)
outgassing within the home.
3. Specifying building materials and resources that are sustainable, have low
embodied energy, and produce a minimal amount of upstream environmental
impact.
4. Providing for the efficient use of water via appliance, faucet, and shower head
choices and in arid climates by xeriscaping and recycling grey water and
capturing rain water for landscaping and other non-potable uses.
All these above features can exactly be seen in AECOM building whereas Oberthur
Company does not stand for any of these features.
A green building costs less than a conventional building. Despite public perception to
the contrary, today here is no statistically significant difference in construction cost
between LEED and non LEED building. And the LEED building will have energy cost
savings, on average, of more than 33% compared with the non LEED building.
32

The green building market has matured such that we can today, state with certainty
the hard data on performance proves that when first costs of green building are
considered with direct energy savings, a green building costs less than a
conventional building.
Though the AECOM building cost much more than the Oberthur building if area is
taken into consideration also the initial cost of building is very high but when the
other benefits of the building are seen than the cost is really low and benefits are
many of a green building.
33
Top Related