


Languages
Pages
Legal


Graphs of Other Trigonometric Functions

Copyright © 2012 Pearson Education, Inc. Publishing as
Prentice Hall.
6
We are interested in the graph of y = tan x
Start with a "t" chart and let's choose values from our unit circle and find the tangent values. Tangent has a period of so it will repeat every .
x y = tan x
3
2
undefined
73.13
4
1
6
58.0
3
3
x
y
2
3
2
3
6
would mean there is a vertical asymptote here

6
y = tan xLet's choose more values.
x y = tan x
6
0 0
73.13
4
1
3
58.03
3
x
y
2
3
2
3
6
would mean there is a vertical asymptote here2
undefined
Since we went from we have one complete period 2
to2

y
x
2
3
2
32
2
period:
The Unit Circle and Tangent Applet
The red vertical lines are not part of the graph but are the asymptotes.
Let's see what the graph would look like for y = tan x for 3 complete periods.

Copyright © 2012 Pearson Education, Inc. Publishing as Prentice Hall.

Copyright © 2012 Pearson Education, Inc. Publishing as Prentice Hall.

Steps in Graphing
1. Find two consecutive vertical asymptotes by finding an interval containing one period. Solve for x.
2. Sketch the two vertical asymptotes found in Step 1.
4. Find the points on the graph and of the way between the consecutive asymptotes. These points have y-coordinates of and , respectively.
5. Join the points with a smooth curve, approaching the vertical asymptotes. Indicate additional asymptotes and periods of the graph to the left or right as needed.
3. Identify an x-intercept, midway between the consecutive asymptotes.

Graph for
Step 1: Find two consecutive asymptotes.
Since , we will set up the following:
An interval containing one period is . Two consecutive asymptotes occur at and

Step 2: Identify an x-intercept, midway between the consecutive asymptotes.
Midway between and is . An x-intercept is 0, and the graph passes through .
Step 3: Find points on the graph and of the way between the consecutive asymptotes. These points have y-coordinates of and .
The coefficient, , of the function is 2. Therefore the y-coordinates are and . The graph passes through and .
Step 4: Use steps 1 – 3 to graph one full period of the function. In order to graph for , we continue the pattern and extend the graph another full period to the right.
See figure 4.79 on page 539.

Copyright © by Houghton Mifflin Company, Inc. All rights reserved. 12
1. Find consecutive vertical asymptotes by solving for x:
5. Sketch one branch and repeat.
Find the period and asymptotes and sketch the graph
of xy 2tan3
1
2. Vertical asymptotes are and
x
xy 2tan3
1
8
3
1 0
08
3
18
3
3
1
y
x2
8
3
4
x
4
x
3
1,
8
3
1,
8
3
1,
8
3
4. Find points on the graph and of the way between the consecutive asymptotes.
3. Identify an x-intercept, midway between the consecutive asymptotes: x-intercept =

Graph xy4
1tan2
Vertical asymptotes are
24
1
24
1 xandx
22 xandx
Divide the interval from - 2 to 2 into four equal parts and plot points.
y
x
x = - 2 x = 2
x
2 0
0
2 2
3
xy4
1tan2
The midway x-intercept is

Copyright © 2012 Pearson Education, Inc. Publishing as Prentice Hall.

y = cot x
Again the vertical lines are not part of the graph but are the asymptotes.
Let's look at the tangent graph again to compare these.
Notice vertical asymptotes of one are zeros of the other.
y = tan x

Copyright © by Houghton Mifflin Company, Inc. All rights reserved. 16
Graph of the Cotangent Function
2. range: (–, +) 3. period: 4. vertical asymptotes:
kkx
1. domain : all real #’s kkx
Properties of y = cot x
y
x
2
2
2
32
3
2
xy cot
0xvertical asymptotes xx 2x
To graph y = cot x, use the identity .x
xx
sin
coscot
At values of x for which sin x = 0, the cotangent function is undefined and its graph has vertical asymptotes.

Steps in Graphing
1. Find two consecutive vertical asymptotes by finding an interval containing one period. Solve for x.
2. Sketch the two vertical asymptotes found in Step 1.
4. Find the points on the graph and of the way between the consecutive asymptotes. These points have y-coordinates of and , respectively.
5. Join the points with a smooth curve, approaching the vertical asymptotes. Indicate additional asymptotes and periods of the graph to the left or right as needed.
3. Identify an x-intercept, midway between the consecutive asymptotes.
0<𝐵𝑥−𝐶<𝜋

Graph
Step 1: Find two consecutive asymptotes.
An interval containing one period is . The two consecutive asymptotes are and .
Step 2: Identify an x-intercept midway between the consecutive asymptotes.
The x-intercept midway between is . The x-intercept is .

Step 3: Find points on the graph and of the way between the consecutive asymptotes. These points have y-coordinates of and .
The coefficient, , of the function is 3. Therefore the y-coordinates are and 3. The graph passes through and (
Step 4: Use steps 1 – 3 to graph one full period of the function.
See figure 4.81 on page 542.
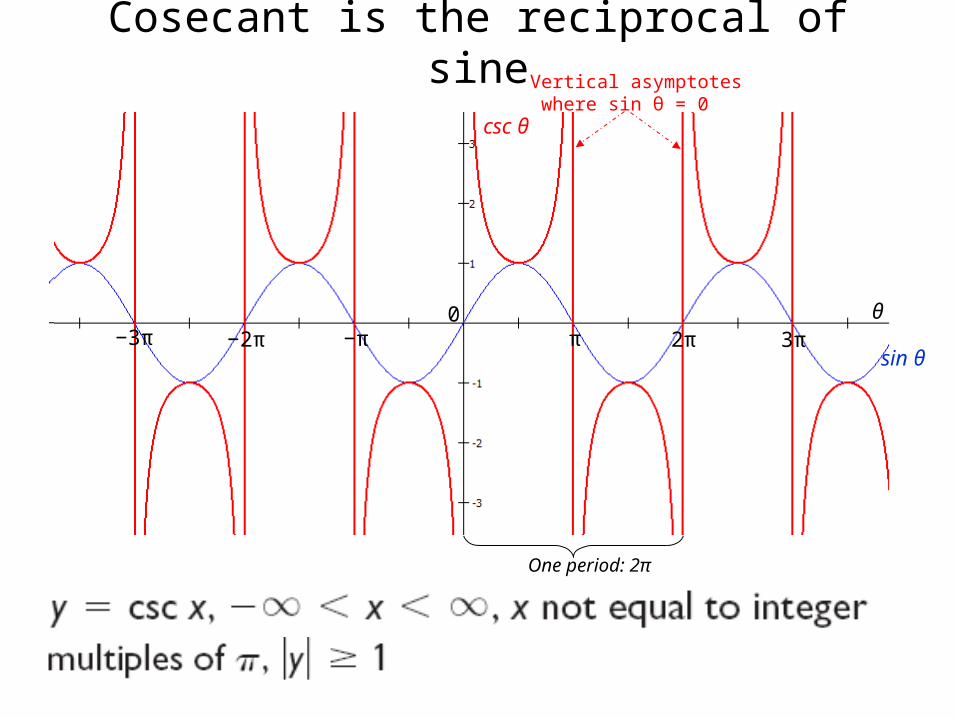
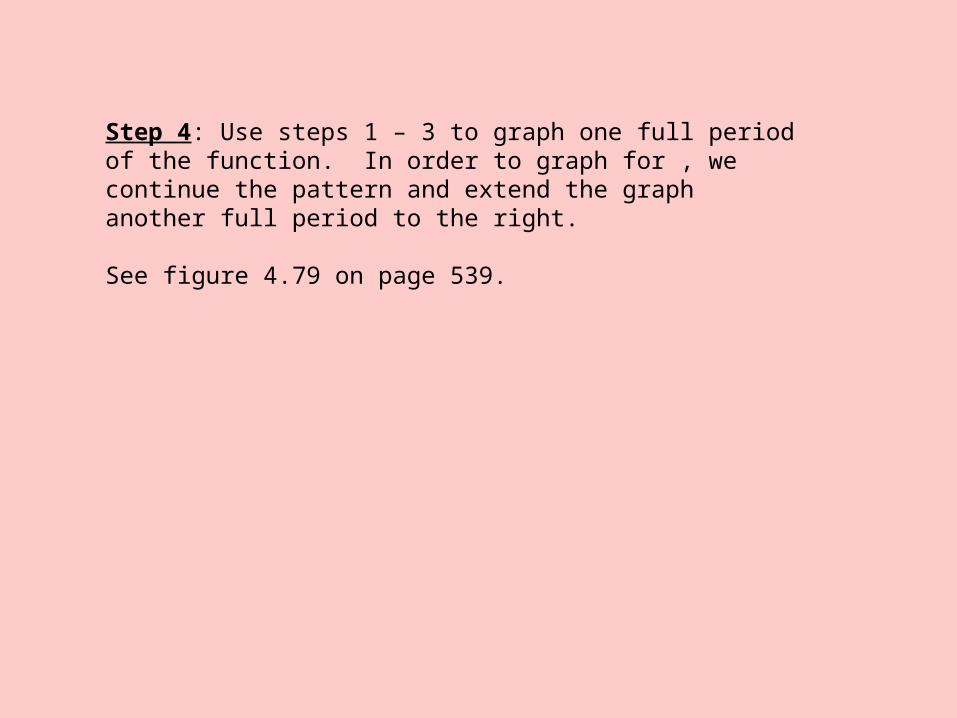
Cosecant is the reciprocal of sine
One period: 2π
π 2π 3π0
−π−2π−3π
Vertical asymptotes where sin θ = 0
θ
csc θ
sin θ
2
3
x
2
2
2
2
5
y
4
4
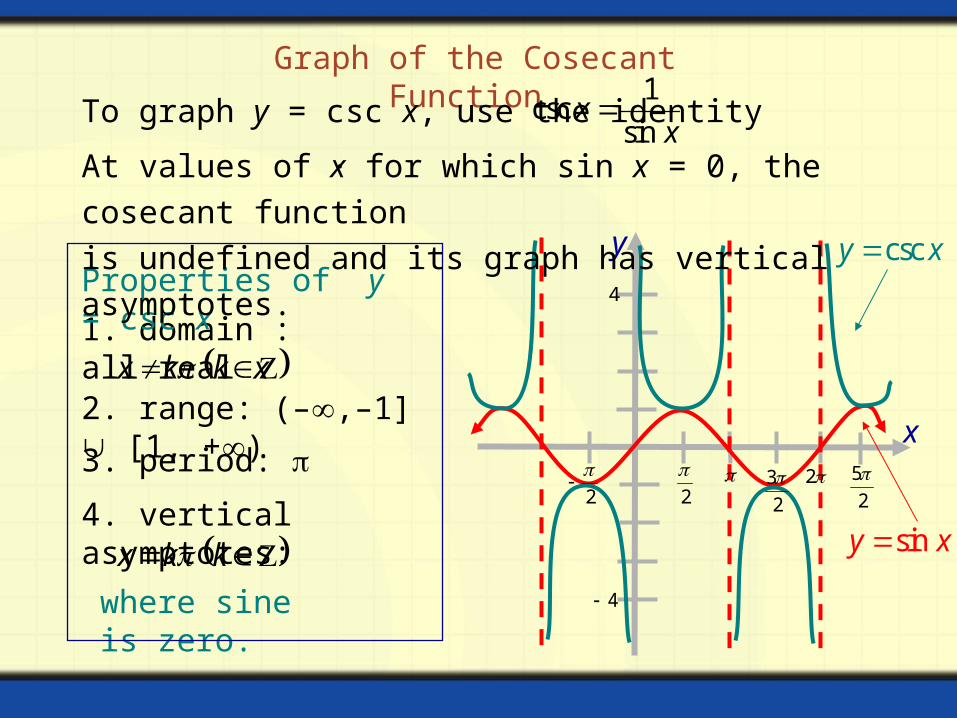
Graph of the Cosecant Function
2. range: (–,–1] [1, +)
3. period:
where sine is zero.
4. vertical asymptotes: kkx
1. domain : all real x kkx
sin
1csc
xx To graph y = csc x, use the identity .
Properties of y = csc x xy csc
xy sin
At values of x for which sin x = 0, the cosecant function
is undefined and its graph has vertical asymptotes.

For the graph of y = f(x) = csc x, we'll take the reciprocals of the sine values.
x sin x y = cosec x
6
0 0
2
1
2
1
6
5
When we graph these rather than plot points after we see this, we'll use the sine graph as a sketching aid and then get the cosecant graph.
x
y
1
- 1
undefined
2
1
2
12
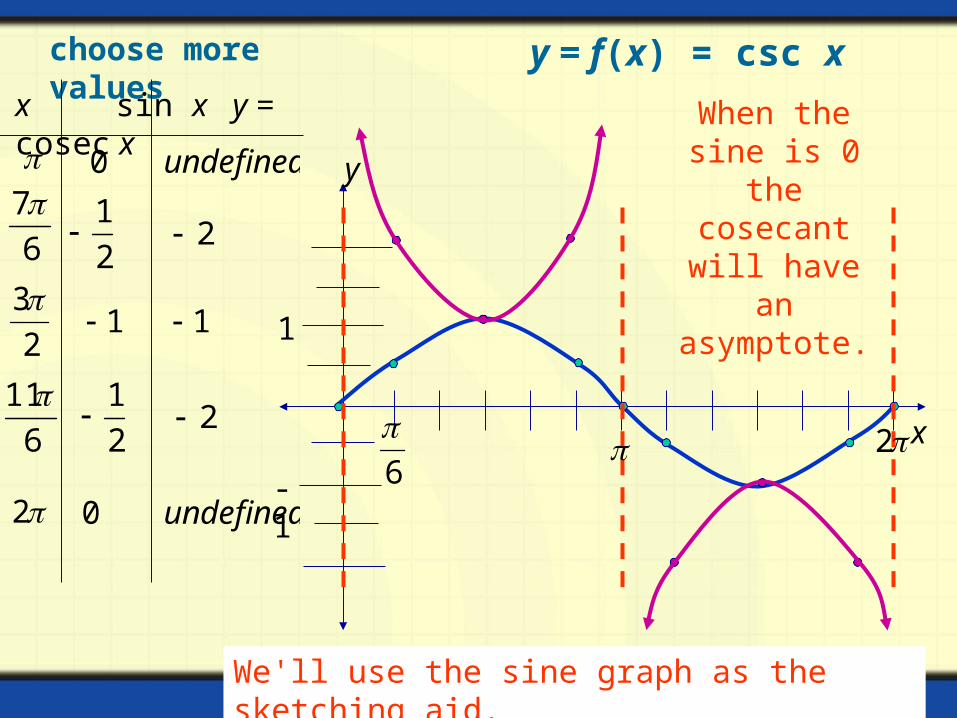
y = f(x) = csc xchoose more values
x sin x y = cosec x
6
7 0
2
1
2
31
6
112
1
We'll use the sine graph as the sketching aid.
x
y
1
- 12 0
6
2
undefined
2
1
2
undefined
When the sine is 0 the cosecant will have an asymptote.
Using a Sine Curve to Obtain a Cosecant Curve
Graph
Step 1: Graph
Use dash lines (color is preferred) to represent the sine graph.
Step 2: Use the x-intercepts to represent the vertical asymptotes of the cosecant graph.
Step 3: Sketch the graph as shown in figure 4.84 on page 543.

Secant is the reciprocal of cosine
One period: 2π
π 3π−2π 2π−π−3π 0θ
sec θ
cos θ
Vertical asymptotes where cos θ = 0

Copyright © by Houghton Mifflin Company, Inc. All rights reserved. 26
2
3
y
x
2
2
2 3
2
5
4
4
xy cos
Graph of the Secant Function
2. range: (–,–1] [1, +) 3. period: 4. vertical asymptotes:
kkx 2
1. domain : all real x)(
2 kkx
cos
1sec
xx The graph y = sec x, use the identity .
Properties of y = sec x
xy sec
At values of x for which cos x = 0, the secant function is undefined and its graph has vertical asymptotes.

Graph for
Step 1: Graph
This equation is in the form .
The amplitude,
The period
Divide into 4 quarter-periods for the five key points. Starting with , the five x-values are .
So the coordinates for the key points are .
Use these key points to graph the cosine equation, using dashed lines.

Step 2: Use the x-intercepts to represent the vertical asymptotes of the secant graph.
Step 3: Sketch the graph as shown in figure 4.85 on page 544.

Top Related