

![Neo4j Graph Analytics 3 Neo4j Graph Analytics The major areas of Artificial Intelligence are, “speech, NLP, computer vision, machine learning, [and] knowledge](https://static.fdocuments.us/doc/165x107/5b4035527f8b9a4b3f8d0f0b/neo4j-graph-analytics-3-neo4j-graph-analytics-the-major-areas-of-artificial-intelligence.jpg)

Languages
Pages
Legal

Copyright © 2017 Oracle and/or its affiliates. All rights reserved. |
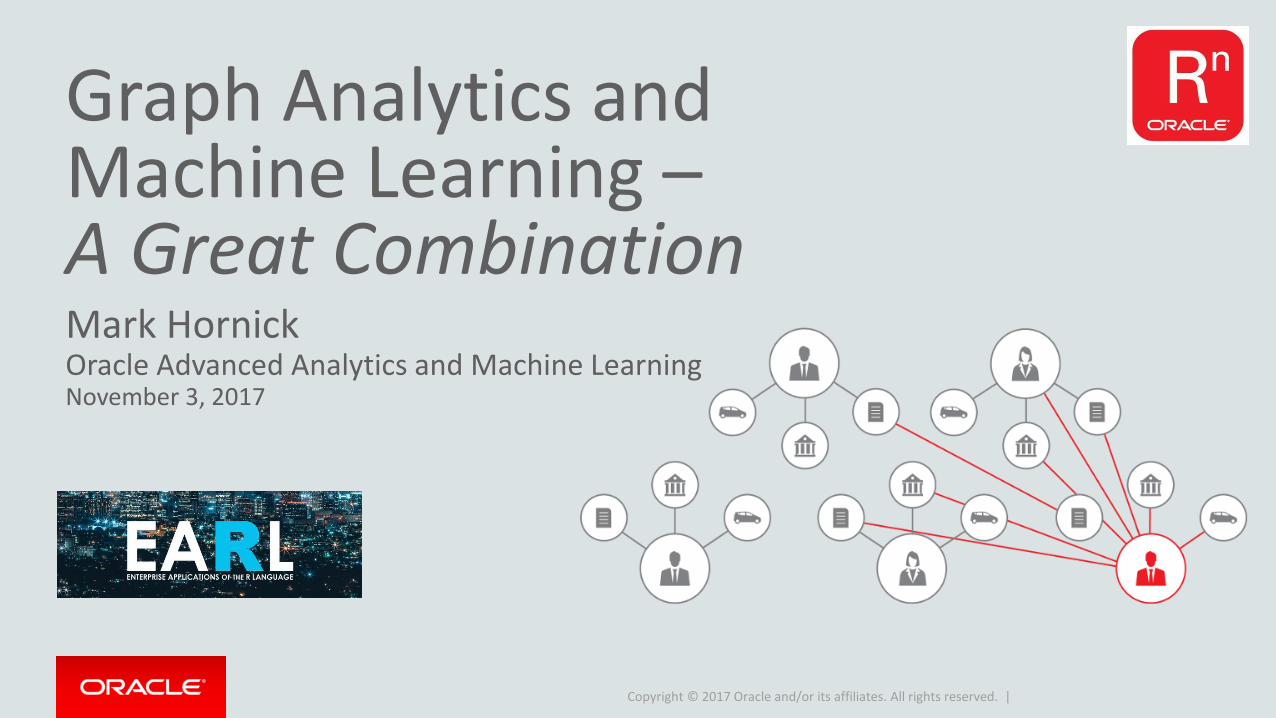
Graph Analytics and Machine Learning –A Great CombinationMark HornickOracle Advanced Analytics and Machine LearningNovember 3, 2017
Copyright © 2017 Oracle and/or its affiliates. All rights reserved. |
Safe Harbor Statement
The following is intended to outline our research activities and general product direction. It is intended for information purposes only, and may not be incorporated into any contract. It is not a commitment to deliver any material, code, or functionality, and should not be relied upon in making purchasing decisions. The development, release, and timing of any features or functionality described for Oracle’s products remains at the sole discretion of Oracle.
Copyright © 2017 Oracle and/or its affiliates. All rights reserved. |
Insights
Copyright © 2017 Oracle and/or its affiliates. All rights reserved. |
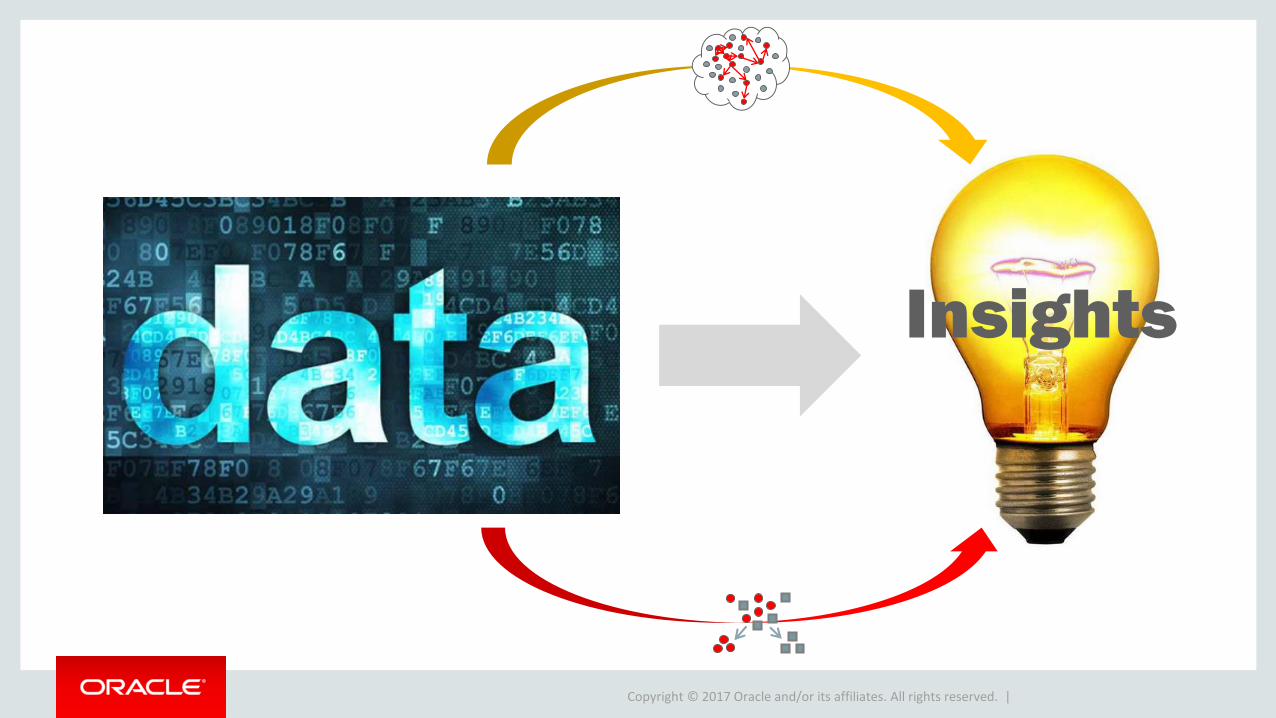
Insights
Copyright © 2017 Oracle and/or its affiliates. All rights reserved. |
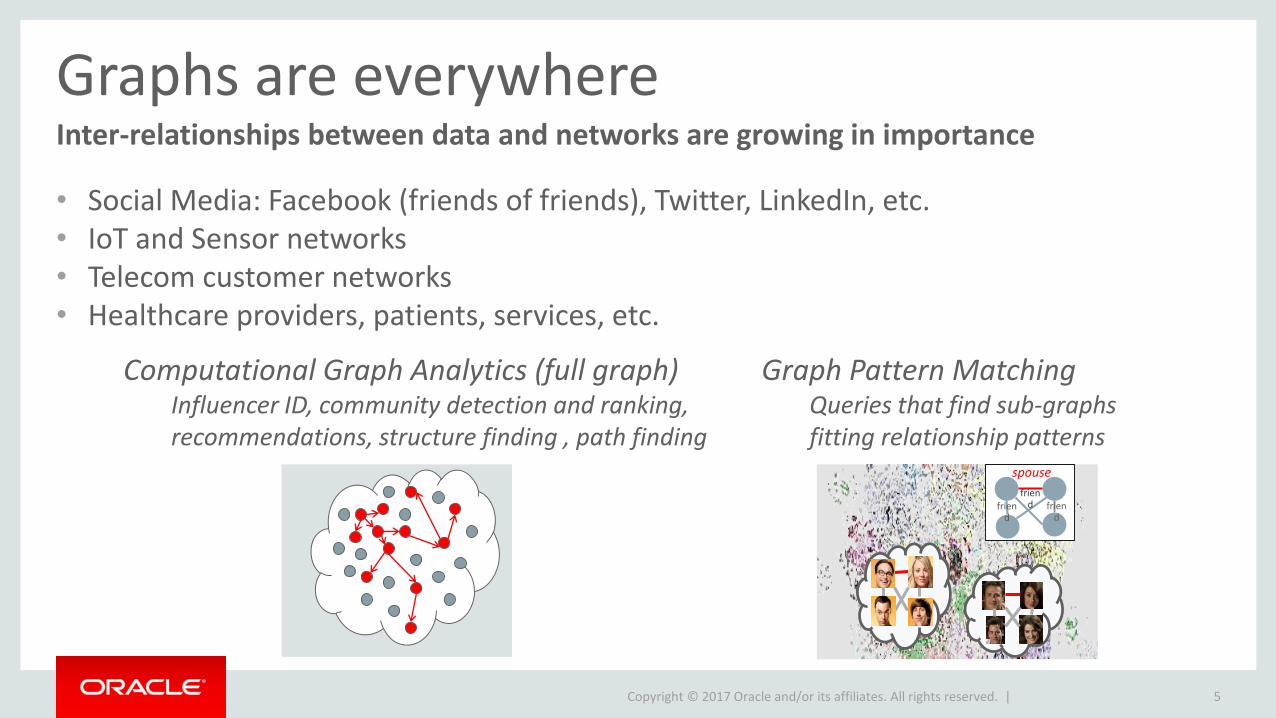
Graphs are everywhere
• Social Media: Facebook (friends of friends), Twitter, LinkedIn, etc.• IoT and Sensor networks• Telecom customer networks• Healthcare providers, patients, services, etc.
5
Inter-relationships between data and networks are growing in importance
spouse
friend
friend frien
d
Computational Graph Analytics (full graph)Influencer ID, community detection and ranking, recommendations, structure finding , path finding
Graph Pattern MatchingQueries that find sub-graphs fitting relationship patterns
Copyright © 2017 Oracle and/or its affiliates. All rights reserved. |
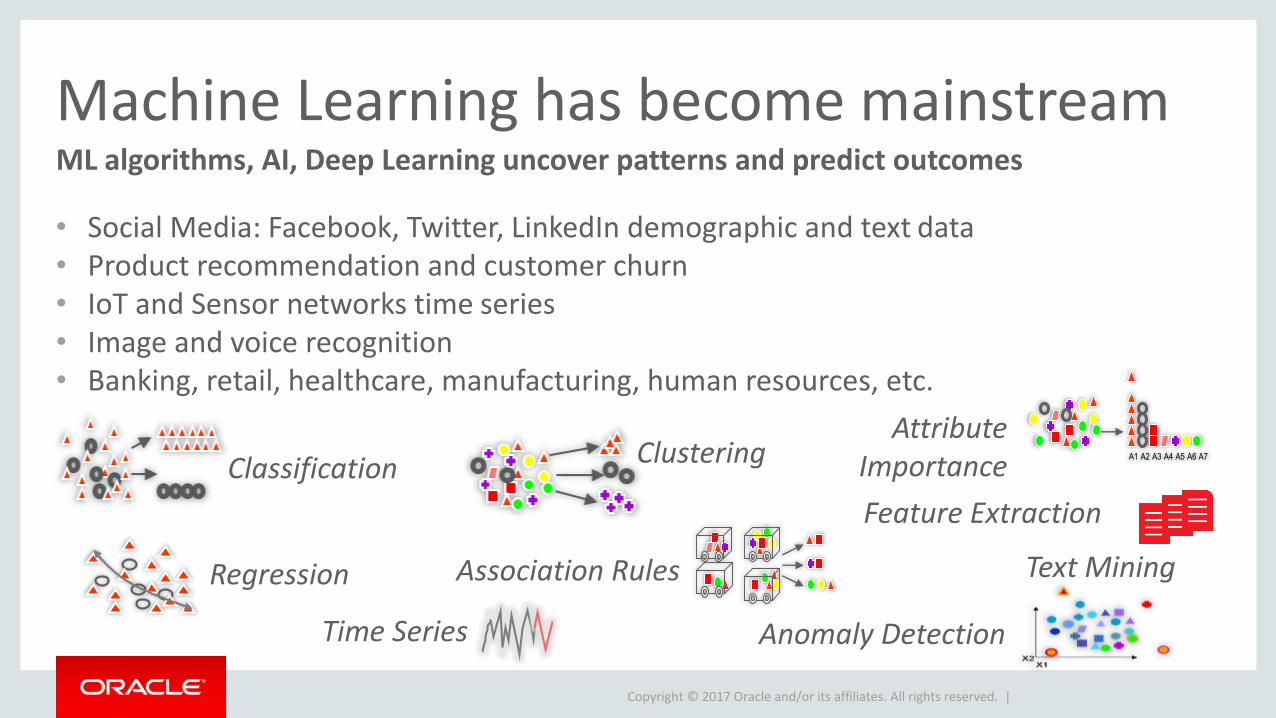
Machine Learning has become mainstream
• Social Media: Facebook, Twitter, LinkedIn demographic and text data• Product recommendation and customer churn• IoT and Sensor networks time series• Image and voice recognition• Banking, retail, healthcare, manufacturing, human resources, etc.
ML algorithms, AI, Deep Learning uncover patterns and predict outcomes
Classification
Regression
Clustering
Feature Extraction
Anomaly DetectionTime Series
Association Rules
A1 A2 A3 A4 A5 A6 A7
Attribute Importance
Text Mining
Copyright © 2017 Oracle and/or its affiliates. All rights reserved. |
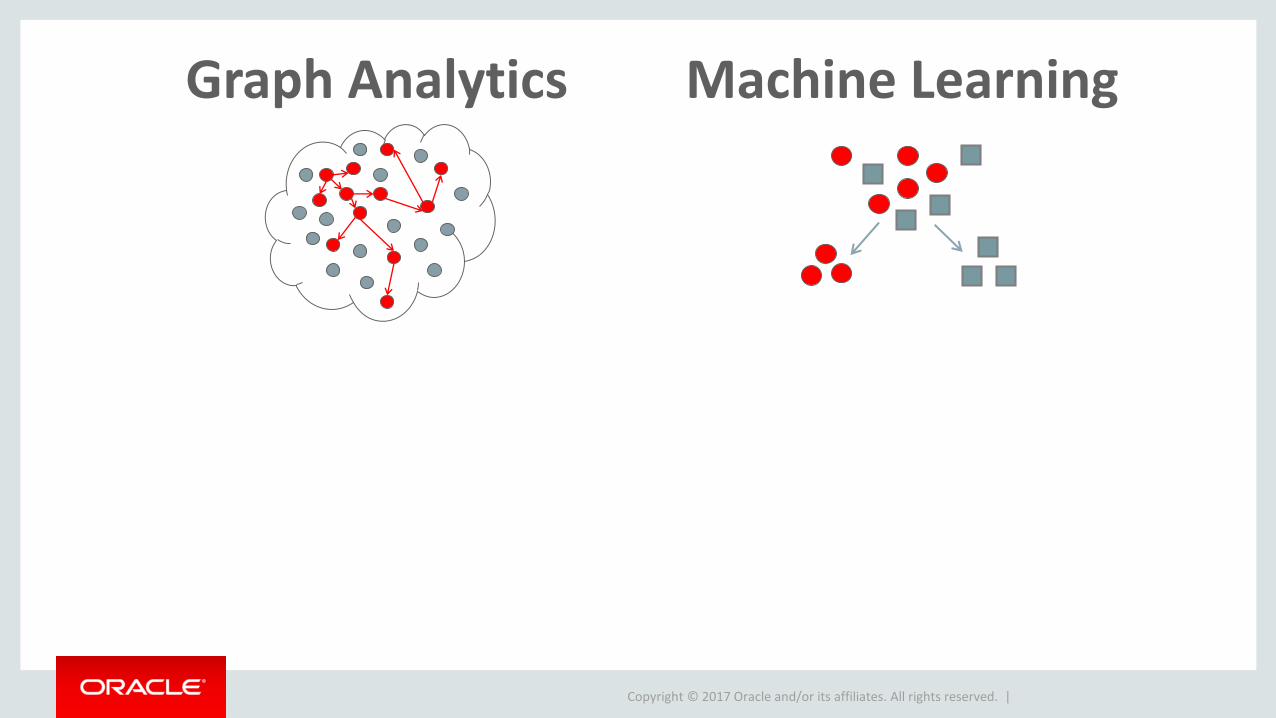
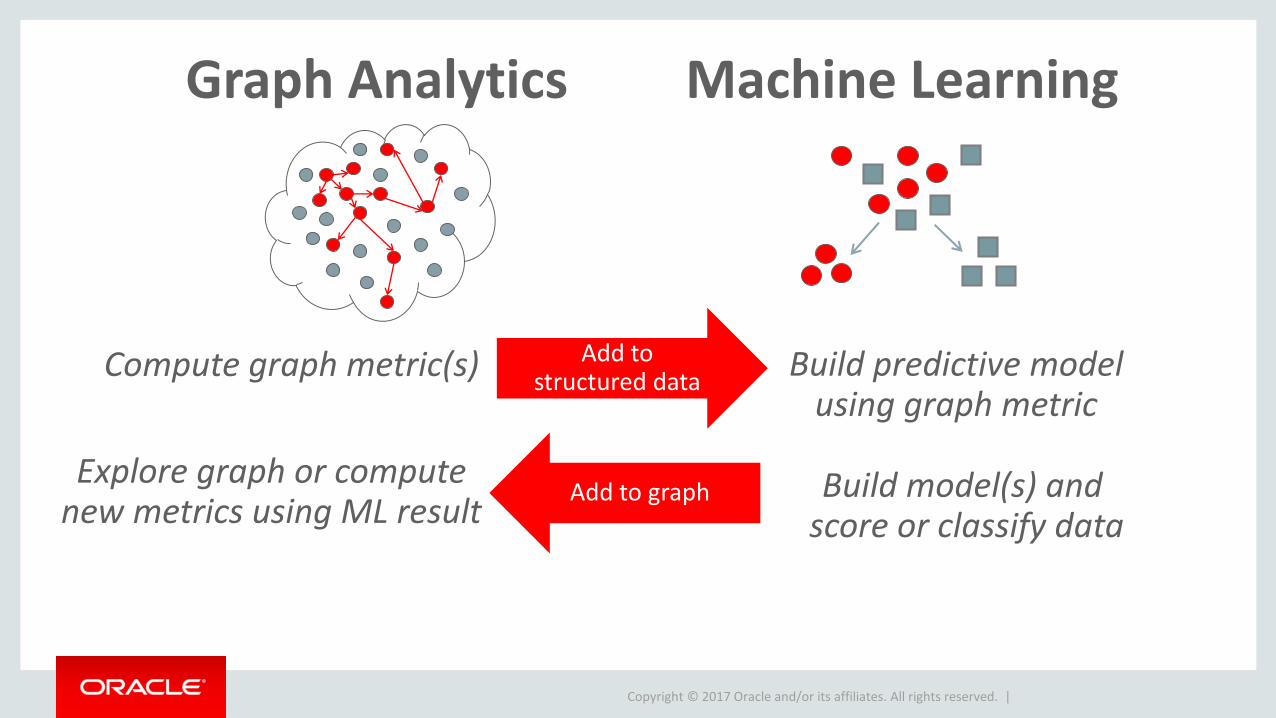
Graph Analytics Machine Learning
Copyright © 2017 Oracle and/or its affiliates. All rights reserved. |
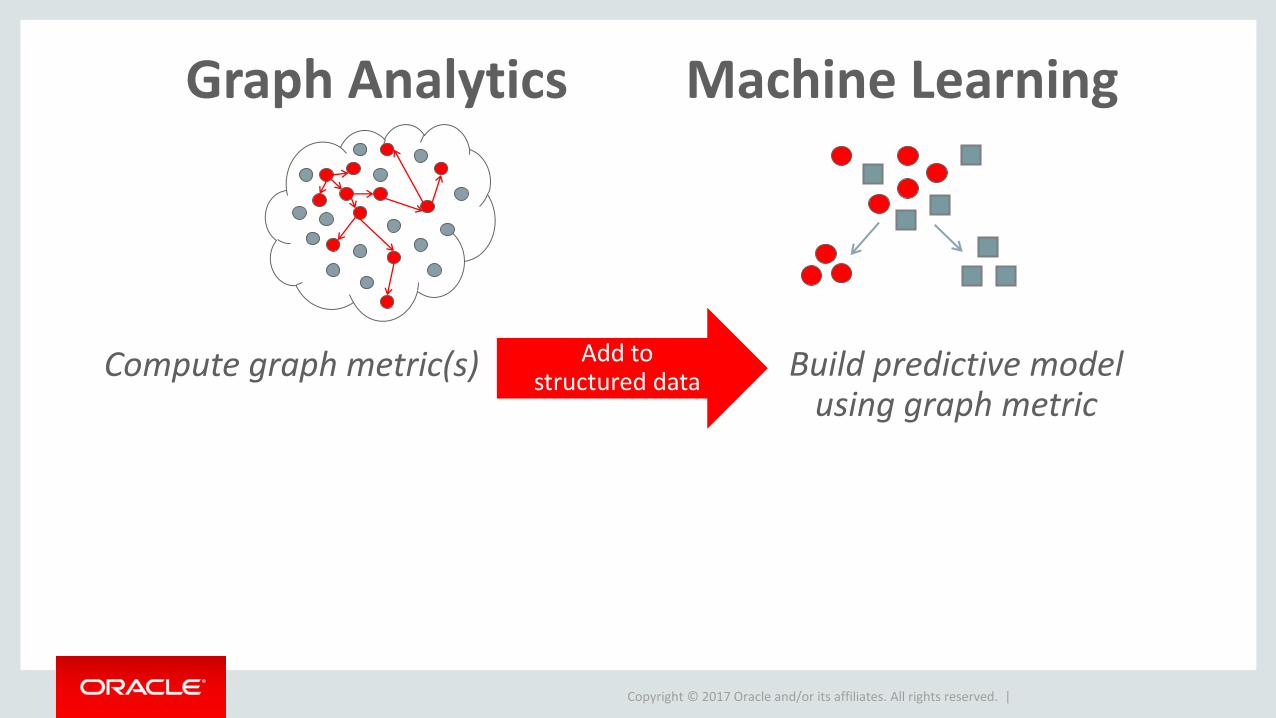
Graph Analytics Machine Learning
Compute graph metric(s) Add to structured data
Build predictive modelusing graph metric
Copyright © 2017 Oracle and/or its affiliates. All rights reserved. |
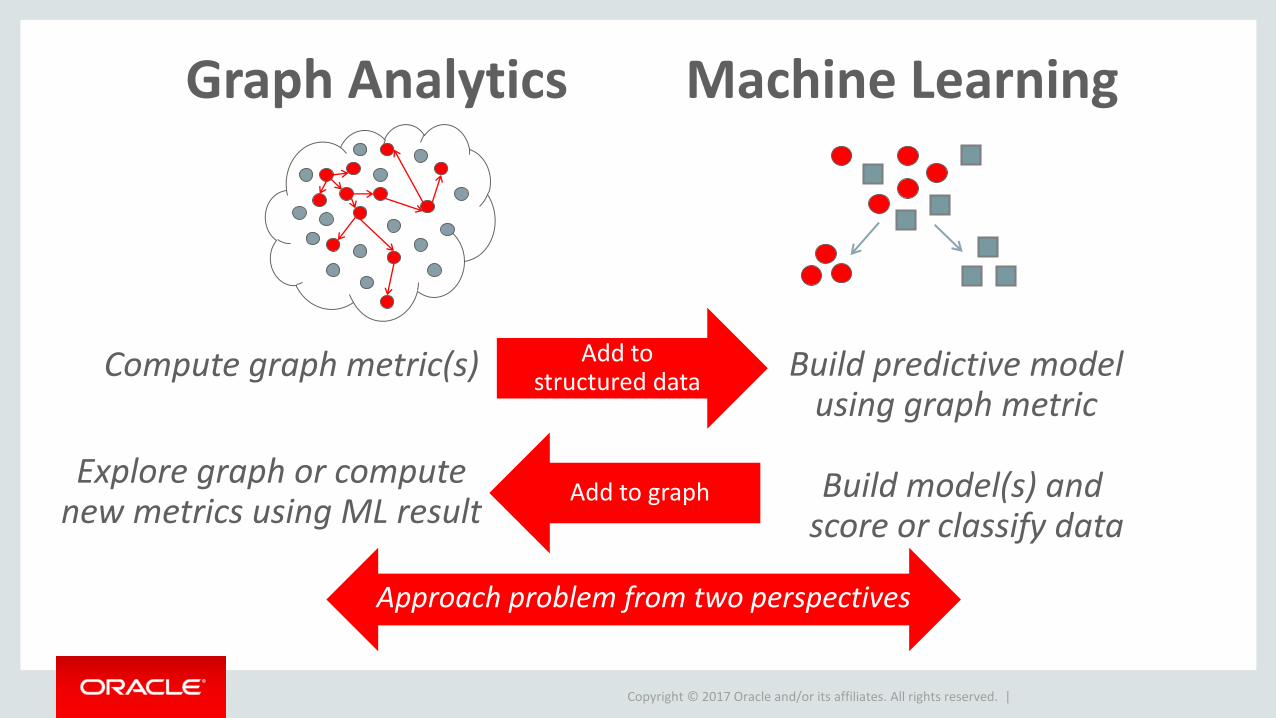
Graph Analytics Machine Learning
Compute graph metric(s) Add to structured data
Build predictive modelusing graph metric
Build model(s) and score or classify data
Add to graphExplore graph or compute
new metrics using ML result
Copyright © 2017 Oracle and/or its affiliates. All rights reserved. |
Graph Analytics Machine Learning
Compute graph metric(s) Add to structured data
Build predictive modelusing graph metric
Build model(s) and score or classify data
Add to graphExplore graph or compute
new metrics using ML result
Approach problem from two perspectives
Copyright © 2017 Oracle and/or its affiliates. All rights reserved. |
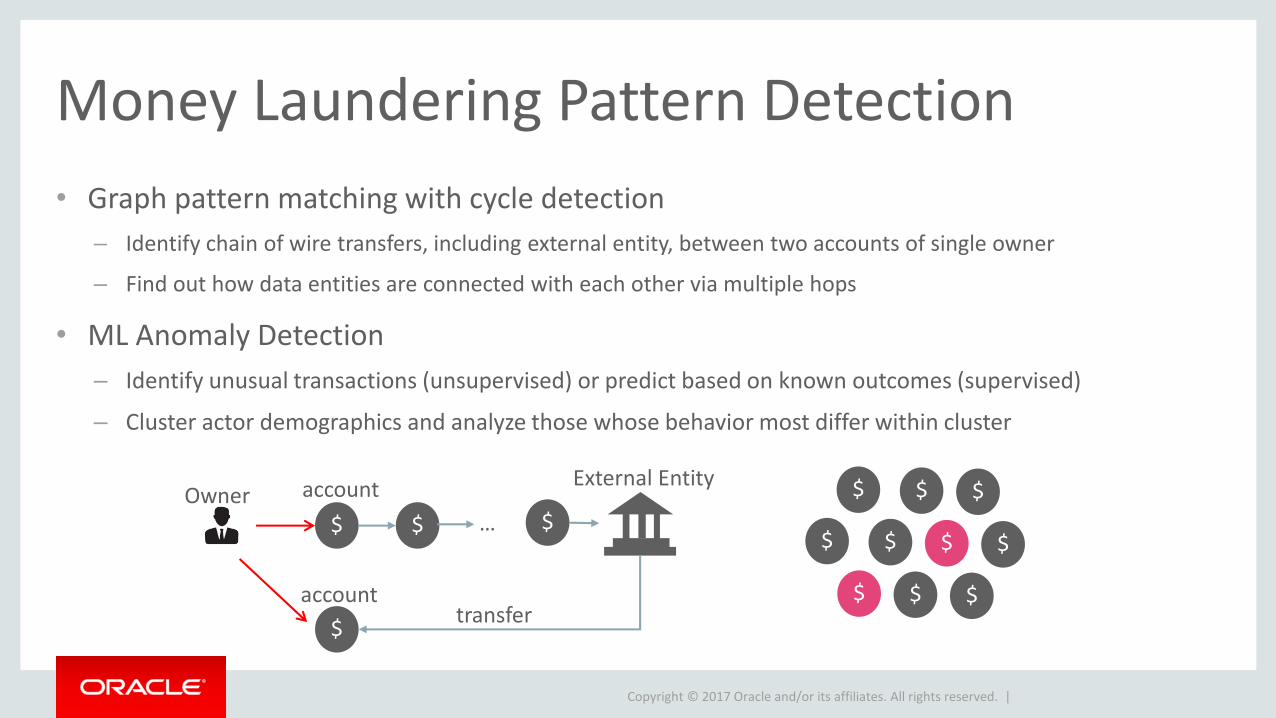
Money Laundering Pattern Detection
• Graph pattern matching with cycle detection
– Identify chain of wire transfers, including external entity, between two accounts of single owner
– Find out how data entities are connected with each other via multiple hops
• ML Anomaly Detection
– Identify unusual transactions (unsupervised) or predict based on known outcomes (supervised)
– Cluster actor demographics and analyze those whose behavior most differ within cluster
$ $ $
$
…Owner account
account
External Entity
transfer
$
$
$
$
$
$
$
$
$
$
Copyright © 2017 Oracle and/or its affiliates. All rights reserved. |
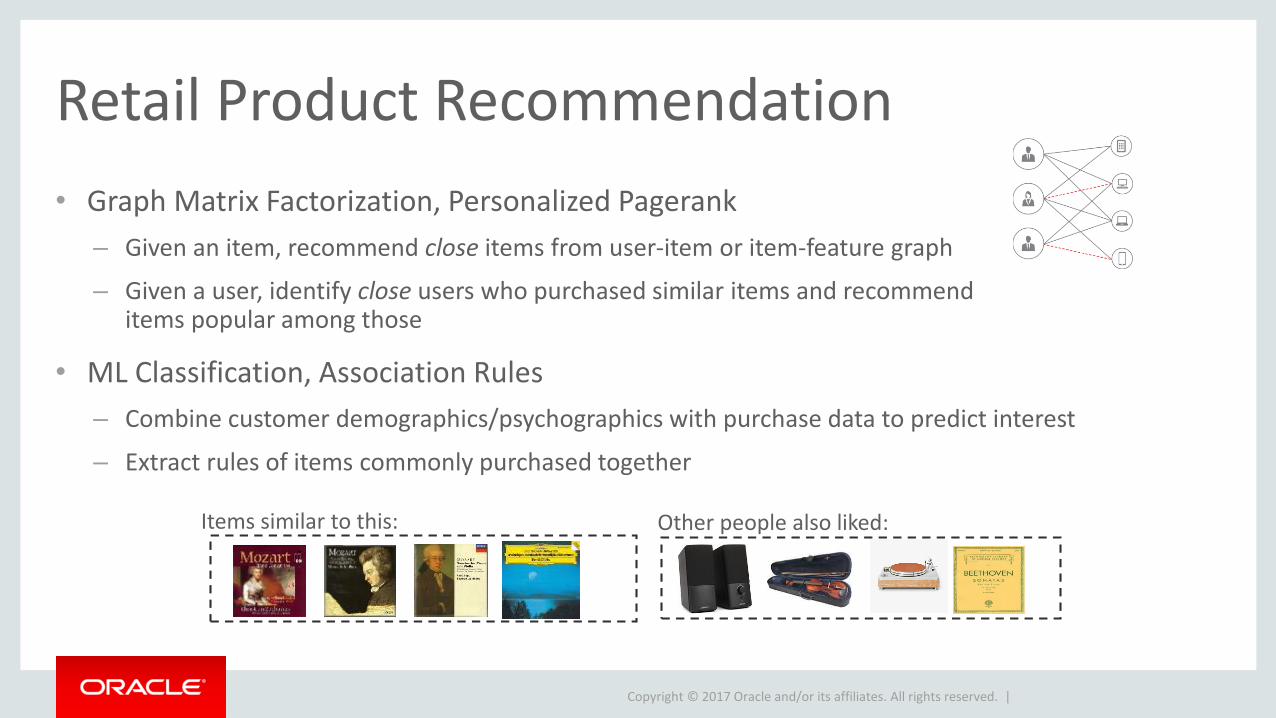
Retail Product Recommendation
• Graph Matrix Factorization, Personalized Pagerank
– Given an item, recommend close items from user-item or item-feature graph
– Given a user, identify close users who purchased similar items and recommend items popular among those
• ML Classification, Association Rules
– Combine customer demographics/psychographics with purchase data to predict interest
– Extract rules of items commonly purchased together
Items similar to this: Other people also liked:
Copyright © 2017 Oracle and/or its affiliates. All rights reserved. |
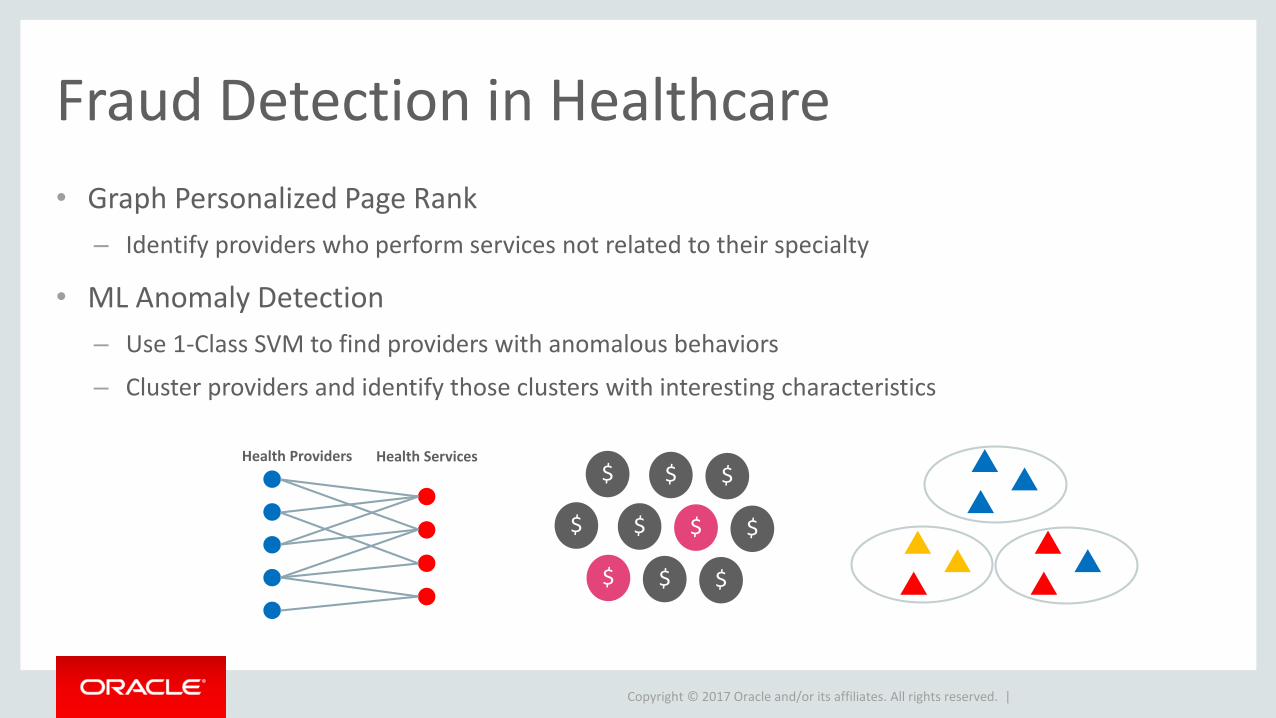
Fraud Detection in Healthcare
• Graph Personalized Page Rank
– Identify providers who perform services not related to their specialty
• ML Anomaly Detection
– Use 1-Class SVM to find providers with anomalous behaviors
– Cluster providers and identify those clusters with interesting characteristics
$
$
$
$
$
$
$
$
$
$
Health Providers Health Services
Copyright © 2017 Oracle and/or its affiliates. All rights reserved. |
Graph Analytics and Machine Learning
• has packages for both
• Minimize impedance mismatch with integrated API
• For big data, need scalable and performant tools
Copyright © 2017 Oracle and/or its affiliates. All rights reserved. |
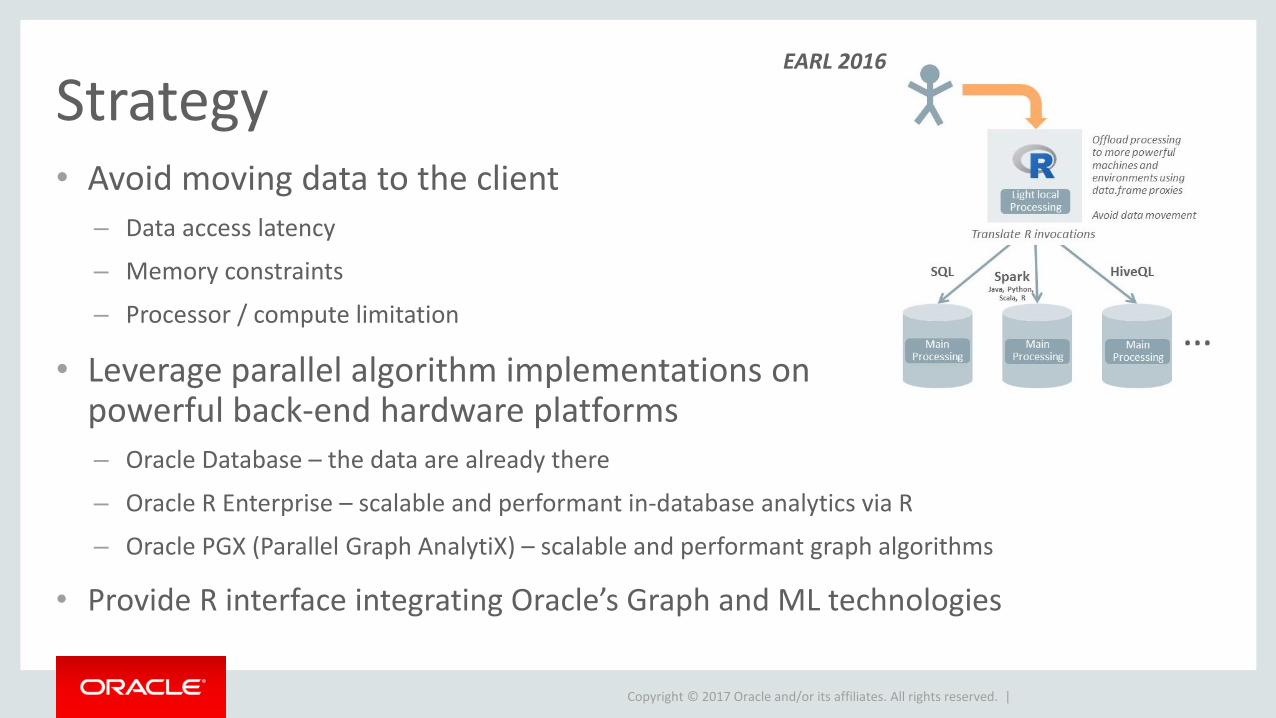
Strategy• Avoid moving data to the client
– Data access latency
– Memory constraints
– Processor / compute limitation
• Leverage parallel algorithm implementations on powerful back-end hardware platforms– Oracle Database – the data are already there
– Oracle R Enterprise – scalable and performant in-database analytics via R
– Oracle PGX (Parallel Graph AnalytiX) – scalable and performant graph algorithms
• Provide R interface integrating Oracle’s Graph and ML technologies
EARL 2016
Copyright © 2017 Oracle and/or its affiliates. All rights reserved. | 16
OAAgraph• An R package integrating Parallel Graph AnalytiX with Oracle R Enterprise
• Single, unified interface
– Work with R data.frame proxy objects (ore.frame) for database data and familiar functions across ML and graph
– Results available as R data.frame proxy objects allowing further processing
• R users take advantage of powerful, complementary technologies available with Oracle Database
– Highly scalable PGX engine, part of Oracle Spatial and Graph option
– Integrated with Oracle R Enterprise, part of Oracle Advanced Analytics option
Copyright © 2017 Oracle and/or its affiliates. All rights reserved. |
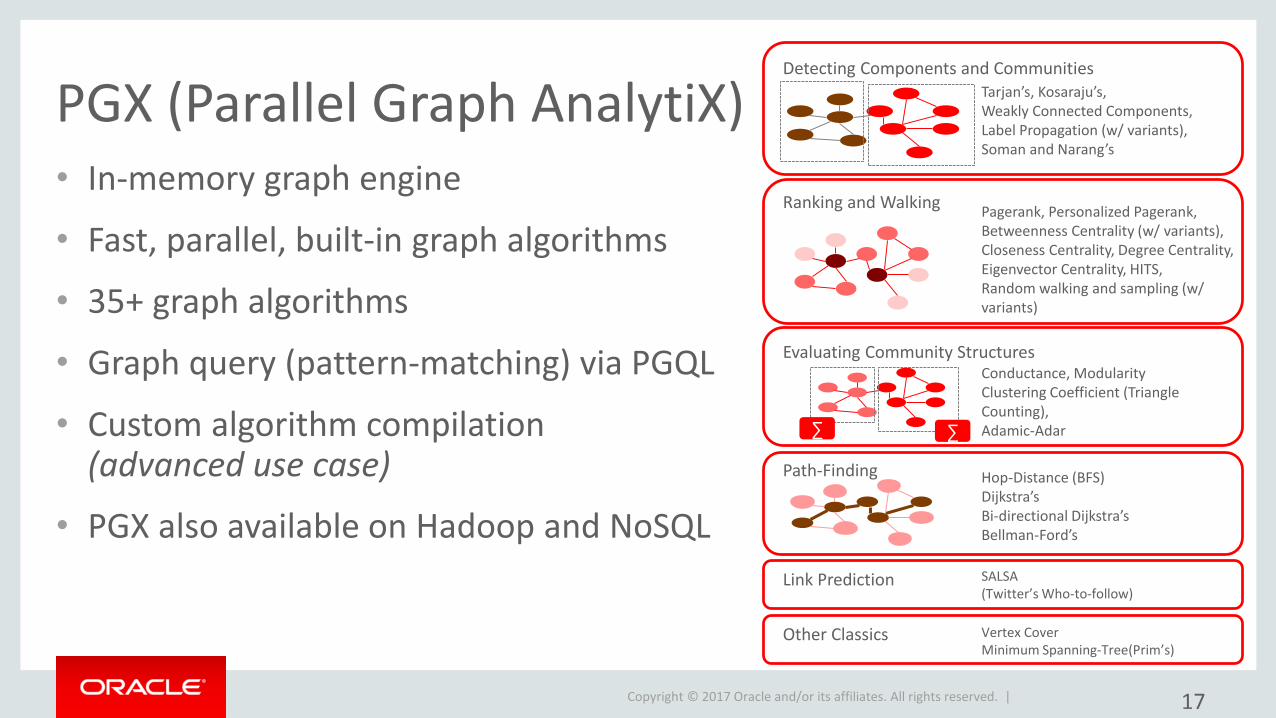
PGX (Parallel Graph AnalytiX)• In-memory graph engine
• Fast, parallel, built-in graph algorithms
• 35+ graph algorithms
• Graph query (pattern-matching) via PGQL
• Custom algorithm compilation (advanced use case)
• PGX also available on Hadoop and NoSQL
17
Detecting Components and CommunitiesTarjan’s, Kosaraju’s, Weakly Connected Components, Label Propagation (w/ variants), Soman and Narang’s
Ranking and WalkingPagerank, Personalized Pagerank,Betweenness Centrality (w/ variants),Closeness Centrality, Degree Centrality,Eigenvector Centrality, HITS,Random walking and sampling (w/ variants)
Evaluating Community Structures
∑ ∑
Conductance, ModularityClustering Coefficient (Triangle Counting), Adamic-Adar
Path-Finding Hop-Distance (BFS)Dijkstra’sBi-directional Dijkstra’sBellman-Ford’s
Link Prediction SALSA (Twitter’s Who-to-follow)
Other Classics Vertex CoverMinimum Spanning-Tree(Prim’s)
Copyright © 2017 Oracle and/or its affiliates. All rights reserved. |
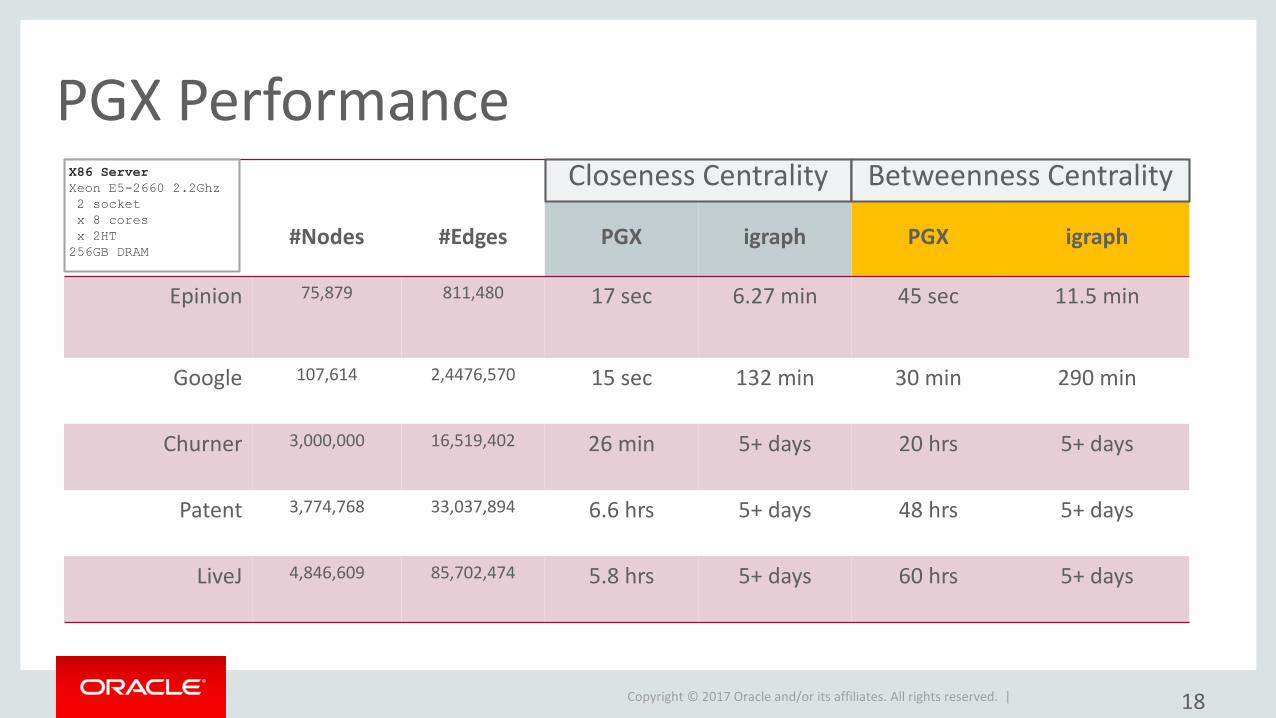
PGX Performance
18
#Nodes #Edges PGX igraph PGX igraph
Epinion 75,879 811,480 17 sec 6.27 min 45 sec 11.5 min
Google 107,614 2,4476,570 15 sec 132 min 30 min 290 min
Churner 3,000,000 16,519,402 26 min 5+ days 20 hrs 5+ days
Patent 3,774,768 33,037,894 6.6 hrs 5+ days 48 hrs 5+ days
LiveJ 4,846,609 85,702,474 5.8 hrs 5+ days 60 hrs 5+ days
X86 Server
Xeon E5-2660 2.2Ghz
2 socket
x 8 cores
x 2HT
256GB DRAM
Closeness Centrality Betweenness Centrality
Copyright © 2017 Oracle and/or its affiliates. All rights reserved. |
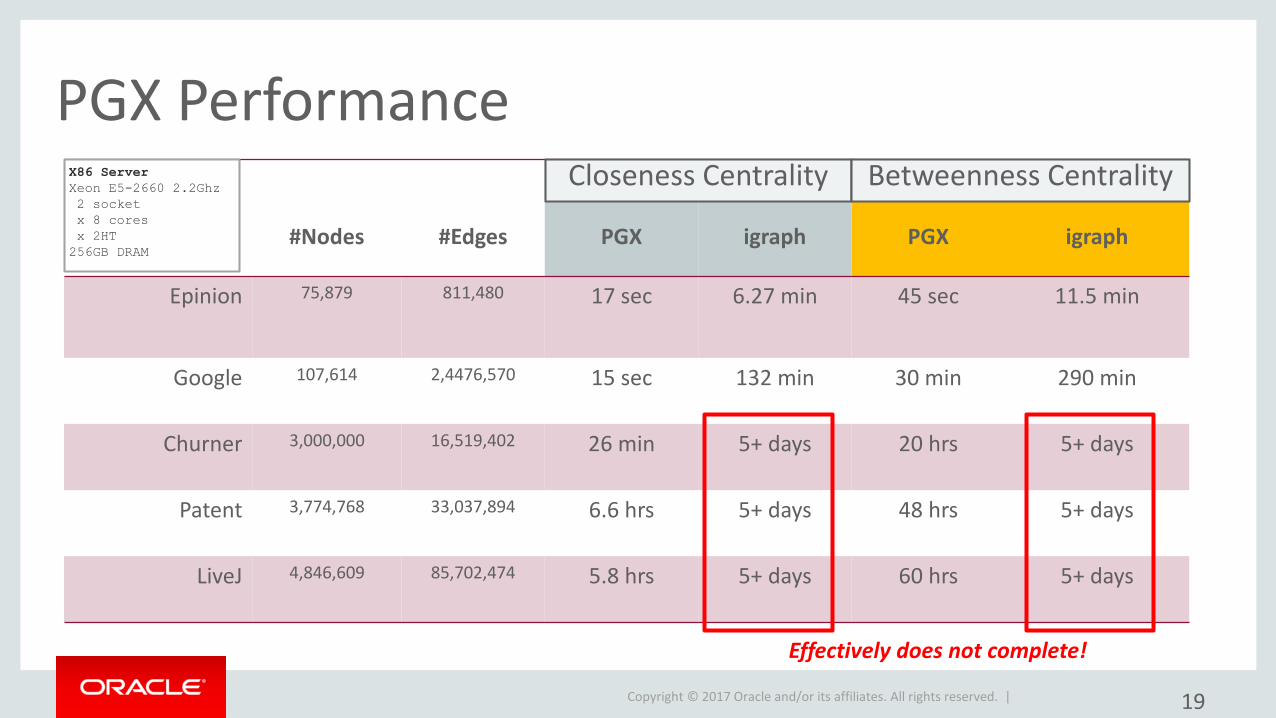
PGX Performance
19
#Nodes #Edges PGX igraph PGX igraph
Epinion 75,879 811,480 17 sec 6.27 min 45 sec 11.5 min
Google 107,614 2,4476,570 15 sec 132 min 30 min 290 min
Churner 3,000,000 16,519,402 26 min 5+ days 20 hrs 5+ days
Patent 3,774,768 33,037,894 6.6 hrs 5+ days 48 hrs 5+ days
LiveJ 4,846,609 85,702,474 5.8 hrs 5+ days 60 hrs 5+ days
X86 Server
Xeon E5-2660 2.2Ghz
2 socket
x 8 cores
x 2HT
256GB DRAM
Effectively does not complete!
Closeness Centrality Betweenness Centrality
Copyright © 2017 Oracle and/or its affiliates. All rights reserved. |
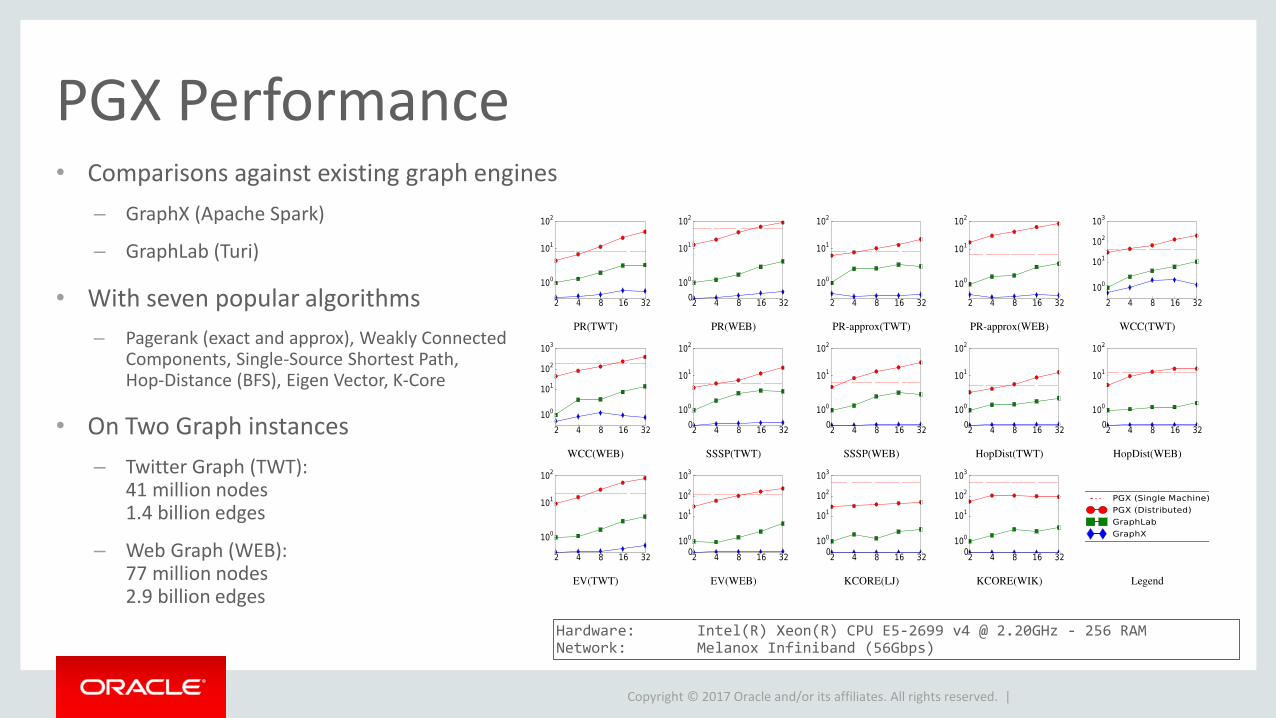
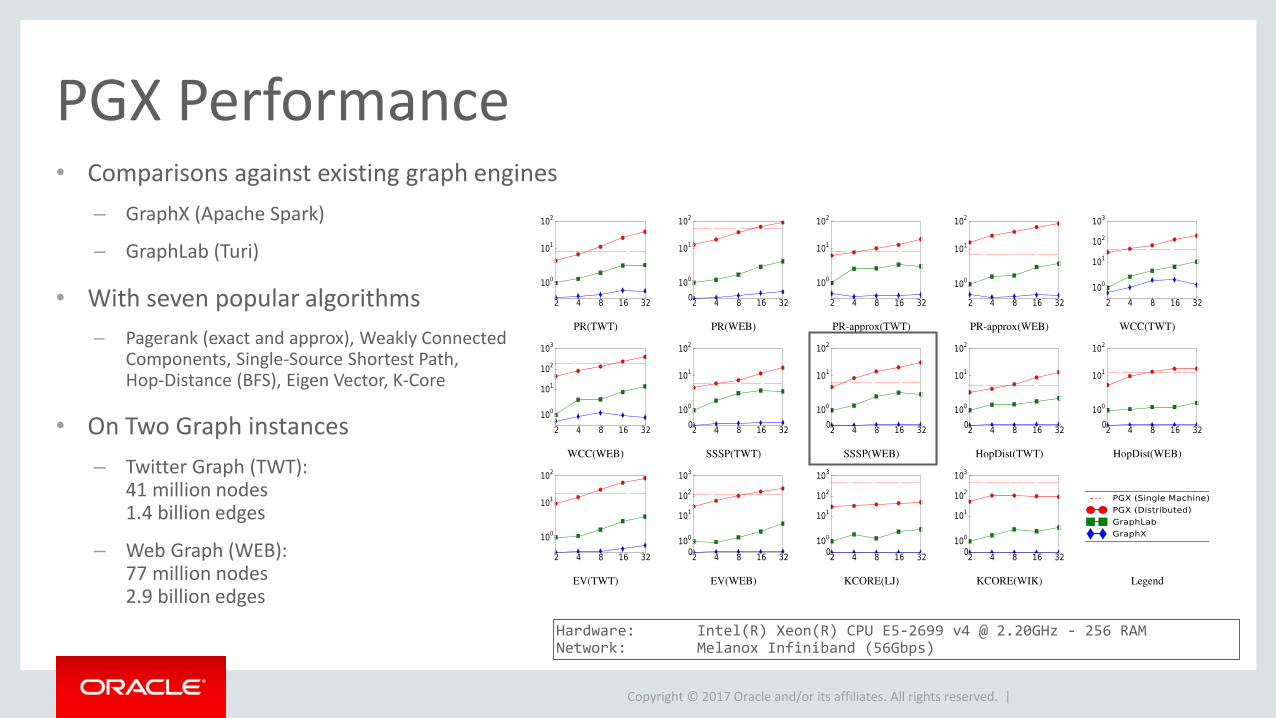
PGX Performance• Comparisons against existing graph engines
– GraphX (Apache Spark)
– GraphLab (Turi)
• With seven popular algorithms
– Pagerank (exact and approx), Weakly Connected Components, Single-Source Shortest Path, Hop-Distance (BFS), Eigen Vector, K-Core
• On Two Graph instances
– Twitter Graph (TWT): 41 million nodes1.4 billion edges
– Web Graph (WEB): 77 million nodes2.9 billion edges
Hardware: Intel(R) Xeon(R) CPU E5-2699 v4 @ 2.20GHz - 256 RAMNetwork: Melanox Infiniband (56Gbps)
Copyright © 2017 Oracle and/or its affiliates. All rights reserved. |
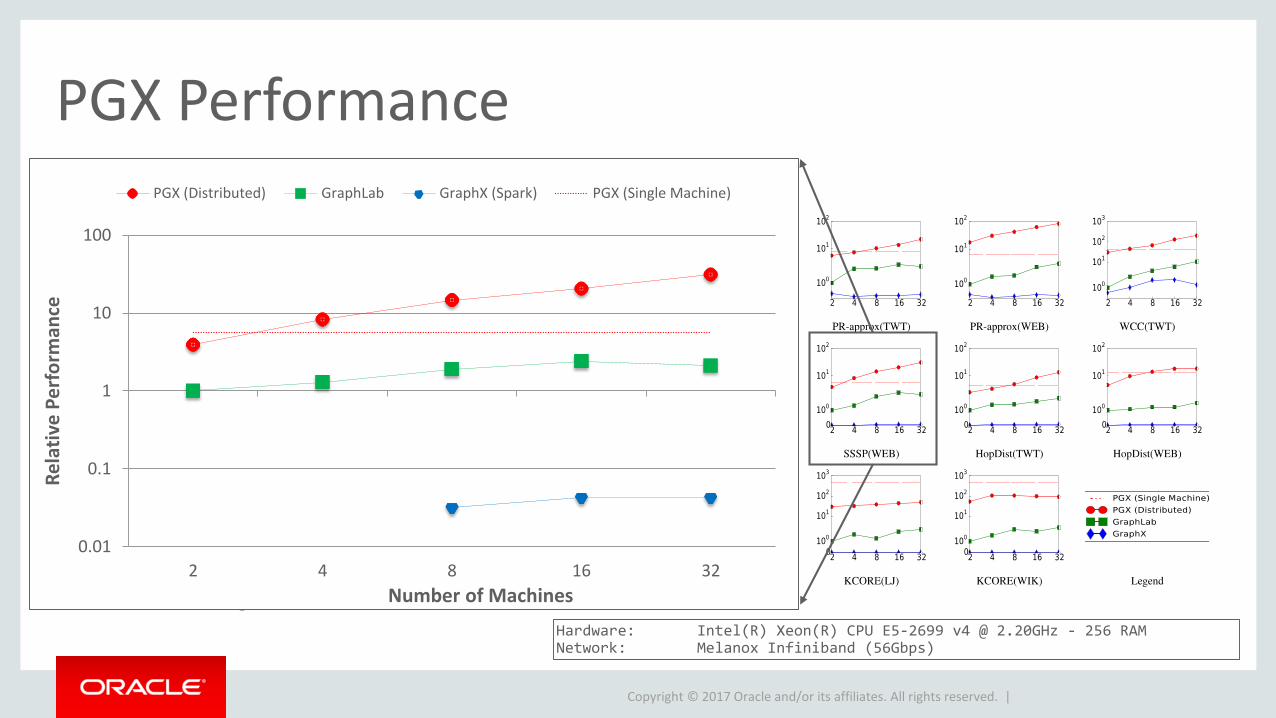
PGX Performance• Comparisons against existing graph
engines
– GraphX (Spark)
– GraphLab (Dato)
• With seven popular algorithms
– Pagerank (exact and approx), Weakly Connected Components , Single-Source Shortest Path, Hop-Distance (BFS), Eigen Vector, K-Core
• On Two Graph instances
– Twitter Graph (TWT): 41 million nodes, 1.4 Billion edges
– Web Graph (WEB): 77 millions nodes, 2.9 Billion edges
Hardware: Intel(R) Xeon(R) CPU E5-2699 v4 @ 2.20GHz - 256 RAMNetwork: Melanox Infiniband (56Gbps)
0.01
0.1
1
10
100
2 4 8 16 32
Re
lati
ve P
erf
orm
ance
Number of Machines
PGX (Distributed) GraphLab GraphX (Spark) PGX (Single Machine)
Copyright © 2017 Oracle and/or its affiliates. All rights reserved. |
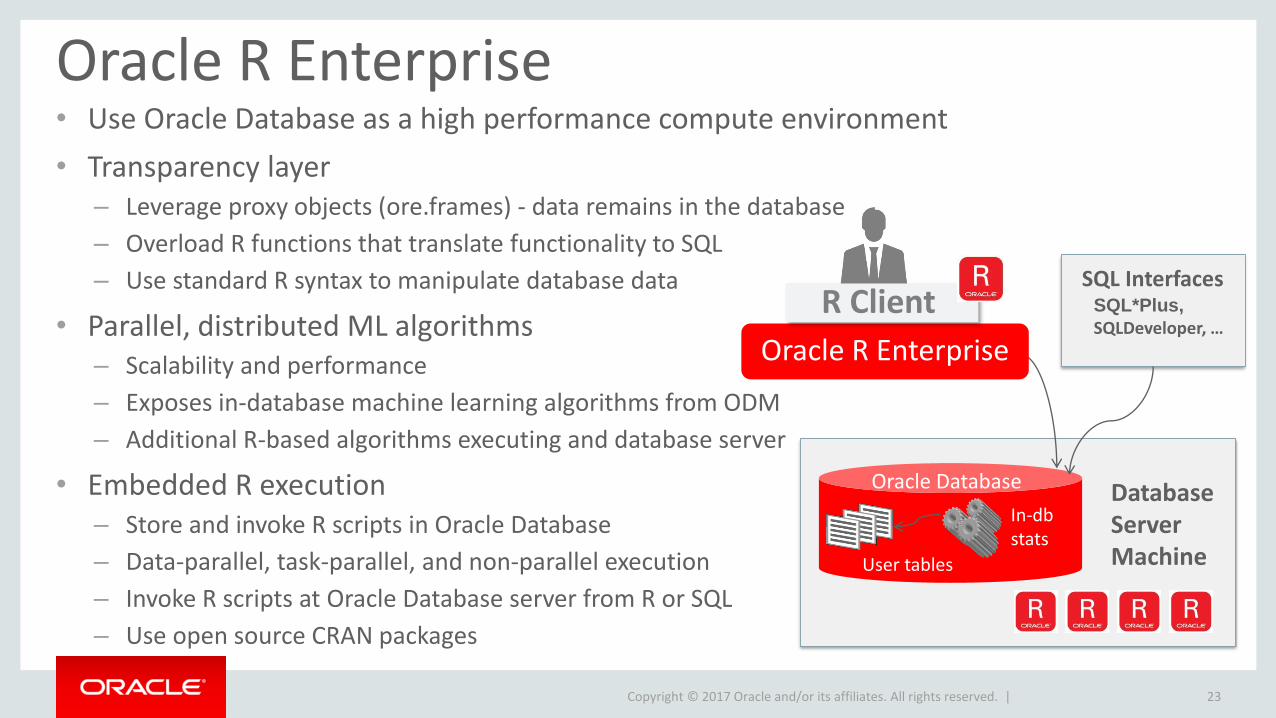
Oracle R Enterprise• Use Oracle Database as a high performance compute environment
• Transparency layer– Leverage proxy objects (ore.frames) - data remains in the database
– Overload R functions that translate functionality to SQL
– Use standard R syntax to manipulate database data
• Parallel, distributed ML algorithms– Scalability and performance
– Exposes in-database machine learning algorithms from ODM
– Additional R-based algorithms executing and database server
• Embedded R execution– Store and invoke R scripts in Oracle Database
– Data-parallel, task-parallel, and non-parallel execution
– Invoke R scripts at Oracle Database server from R or SQL
– Use open source CRAN packages
23
Oracle Database
User tables
In-dbstats
Database ServerMachine
SQL InterfacesSQL*Plus,
SQLDeveloper, …
Oracle R Enterprise
R Client
Copyright © 2017 Oracle and/or its affiliates. All rights reserved. |
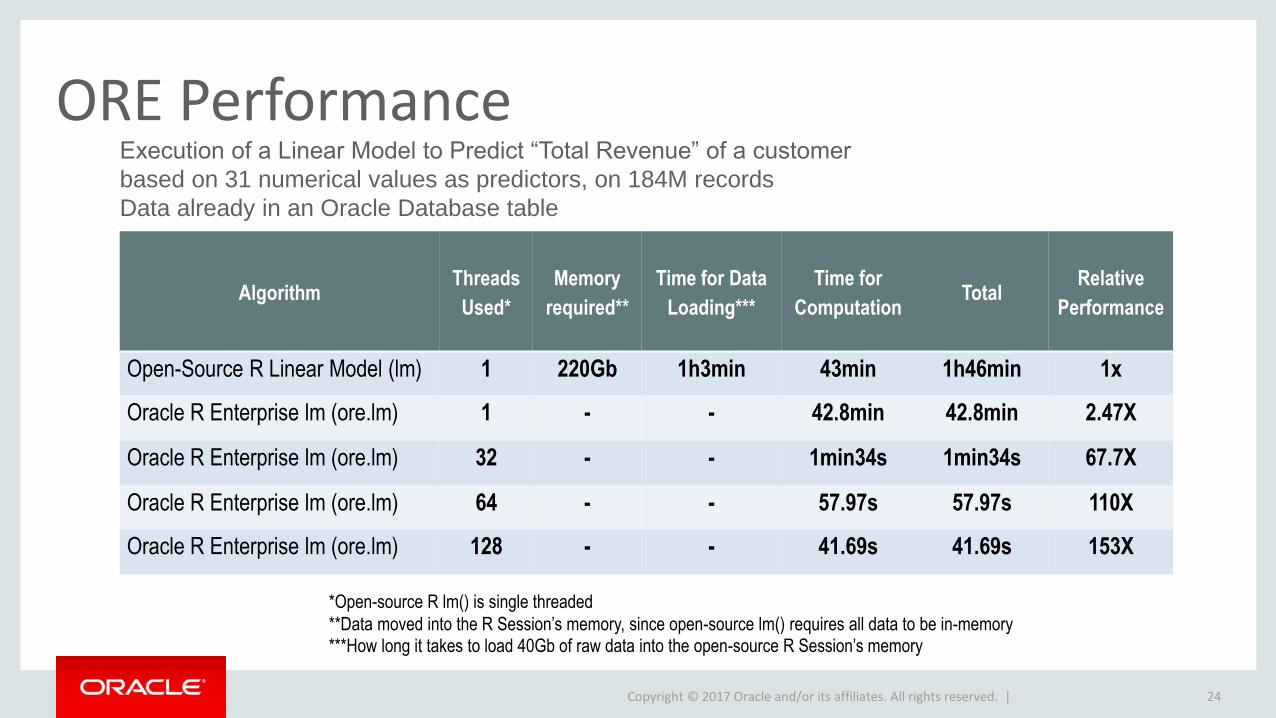
ORE Performance
24
AlgorithmThreads
Used*
Memory
required**
Time for Data
Loading***
Time for
ComputationTotal
Relative
Performance
Open-Source R Linear Model (lm) 1 220Gb 1h3min 43min 1h46min 1x
Oracle R Enterprise lm (ore.lm) 1 - - 42.8min 42.8min 2.47X
Oracle R Enterprise lm (ore.lm) 32 - - 1min34s 1min34s 67.7X
Oracle R Enterprise lm (ore.lm) 64 - - 57.97s 57.97s 110X
Oracle R Enterprise lm (ore.lm) 128 - - 41.69s 41.69s 153X
Execution of a Linear Model to Predict “Total Revenue” of a customer
based on 31 numerical values as predictors, on 184M records
Data already in an Oracle Database table
*Open-source R lm() is single threaded
**Data moved into the R Session’s memory, since open-source lm() requires all data to be in-memory***How long it takes to load 40Gb of raw data into the open-source R Session’s memory
Copyright © 2017 Oracle and/or its affiliates. All rights reserved. |
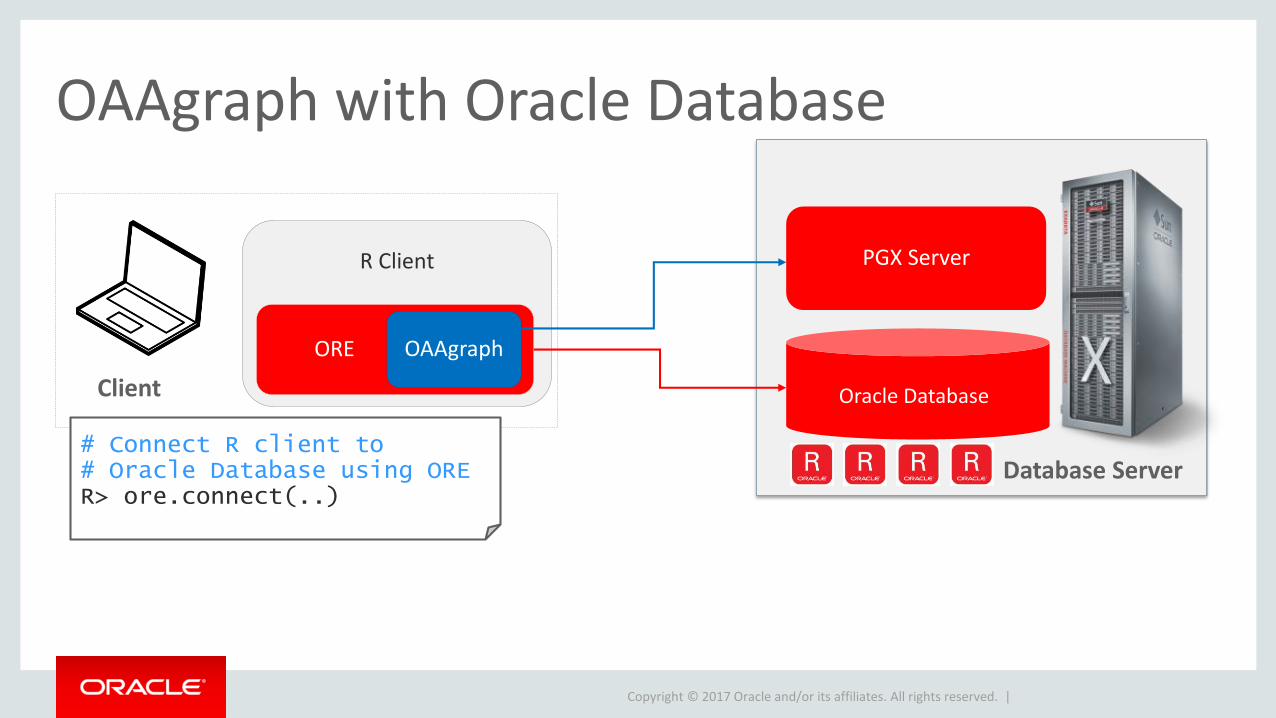
OAAgraph with Oracle Database
Client
Database Server
R Client
ORE
Oracle Database
PGX Server
# Connect R client to # Oracle Database using ORER> ore.connect(..)
OAAgraph
Copyright © 2017 Oracle and/or its affiliates. All rights reserved. |
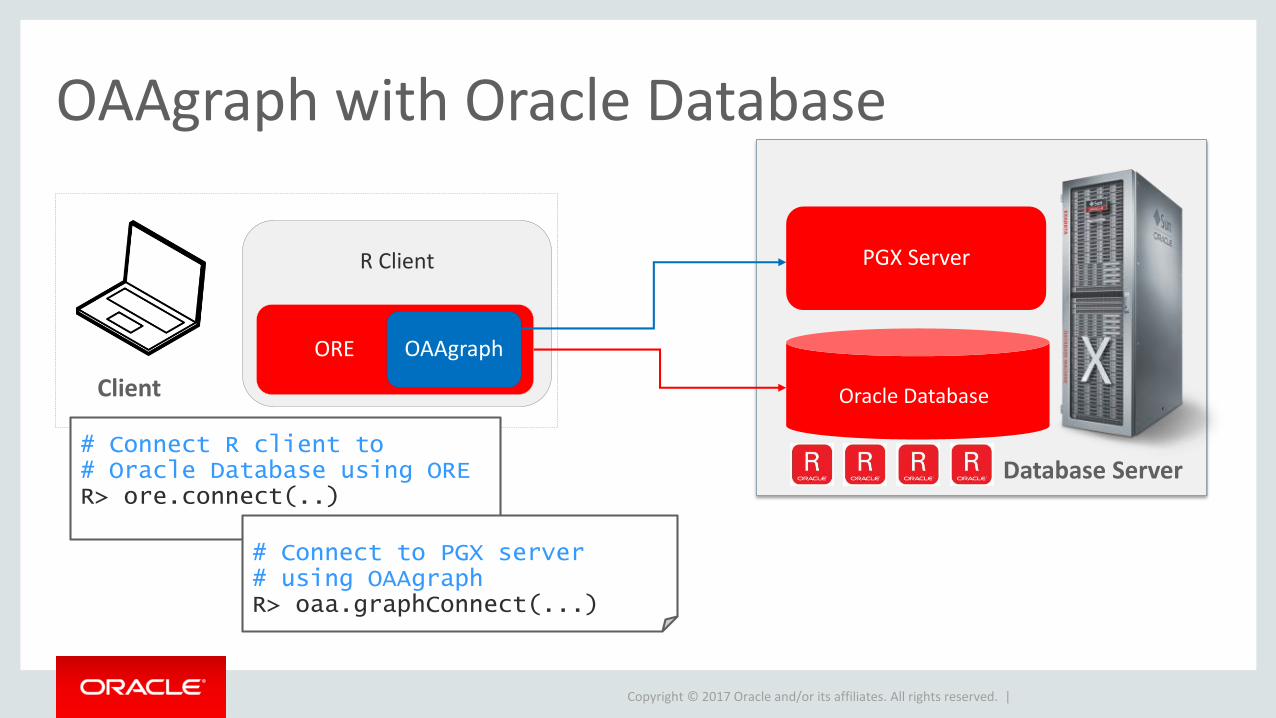
OAAgraph with Oracle Database
Client
Database Server
R Client
ORE
Oracle Database
PGX Server
# Connect R client to # Oracle Database using ORER> ore.connect(..)
# Connect to PGX server # using OAAgraphR> oaa.graphConnect(...)
OAAgraph
Copyright © 2017 Oracle and/or its affiliates. All rights reserved. |
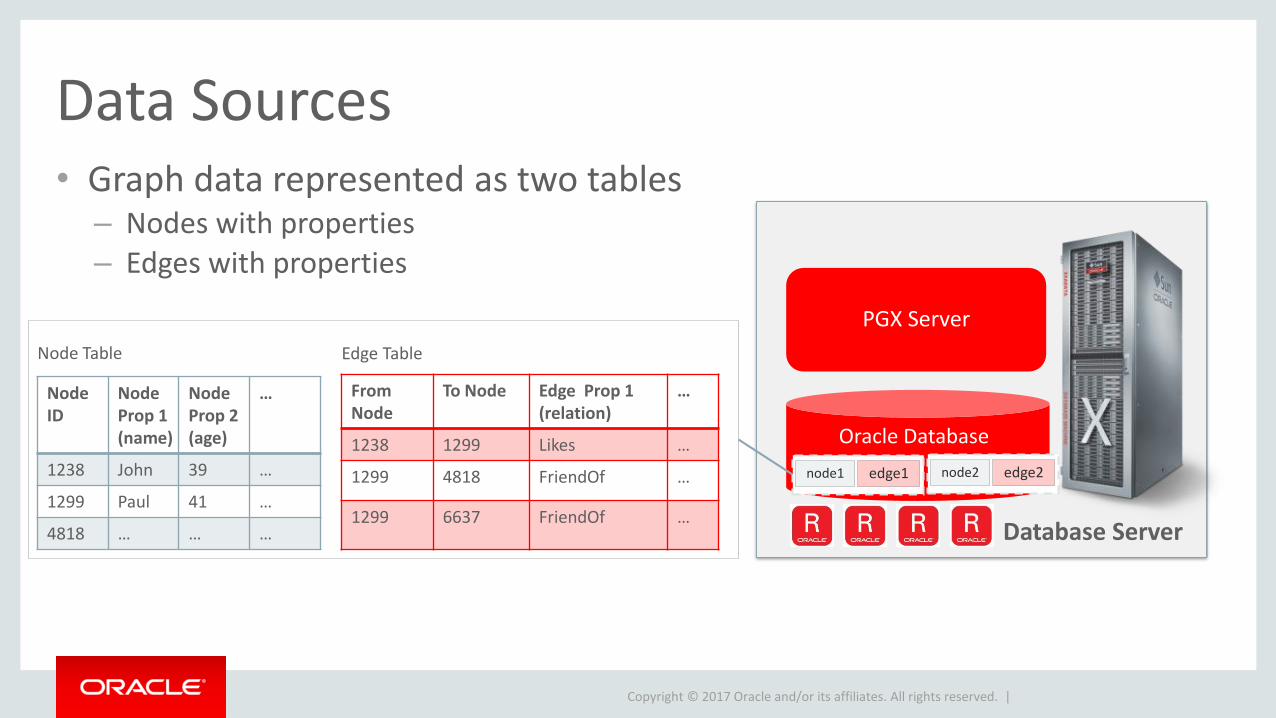
Data Sources• Graph data represented as two tables
– Nodes with properties– Edges with properties
Database Server
Oracle Database
PGX Server
Node ID
Node Prop 1(name)
Node Prop 2(age)
…
1238 John 39 …
1299 Paul 41 …
4818 … … …
From Node
To Node Edge Prop 1(relation)
…
1238 1299 Likes …
1299 4818 FriendOf …
1299 6637 FriendOf …
Node Table Edge Table
edge1node1 edge2node2
Copyright © 2017 Oracle and/or its affiliates. All rights reserved. |
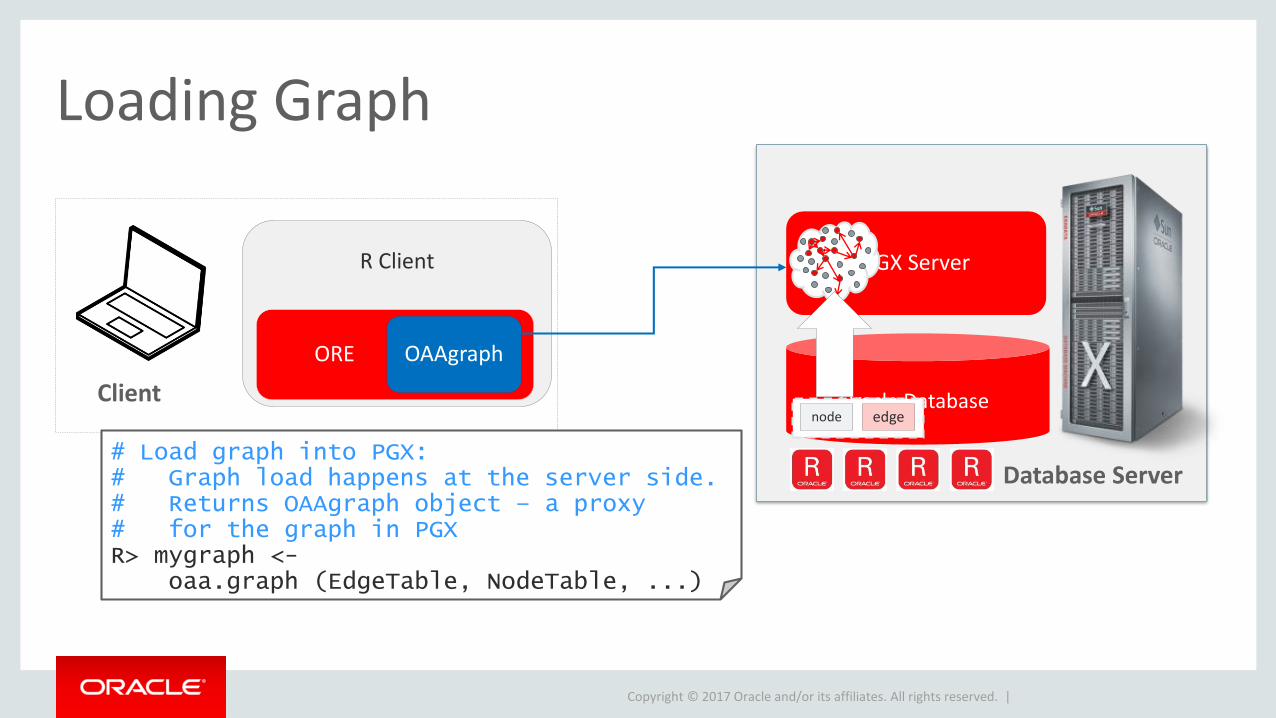
R Client
Loading Graph
Client
Database Server
ORE
Oracle Database
PGX Server
# Load graph into PGX:# Graph load happens at the server side.# Returns OAAgraph object – a proxy # for the graph in PGXR> mygraph <-
oaa.graph (EdgeTable, NodeTable, ...)
edgenode
OAAgraph
Copyright © 2017 Oracle and/or its affiliates. All rights reserved. |
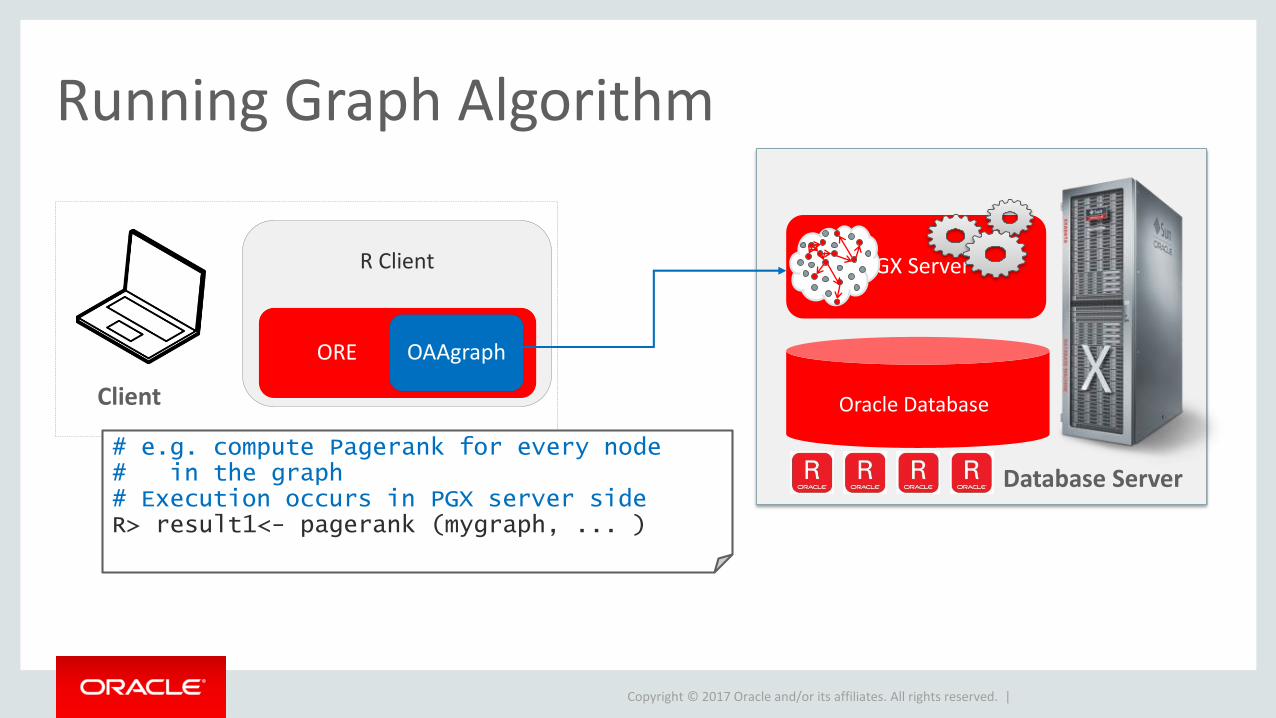
R Client
Running Graph Algorithm
Client
Database Server
ORE
Oracle Database
PGX Server
# e.g. compute Pagerank for every node # in the graph # Execution occurs in PGX server sideR> result1<- pagerank (mygraph, ... )
OAAgraph
Copyright © 2017 Oracle and/or its affiliates. All rights reserved. |
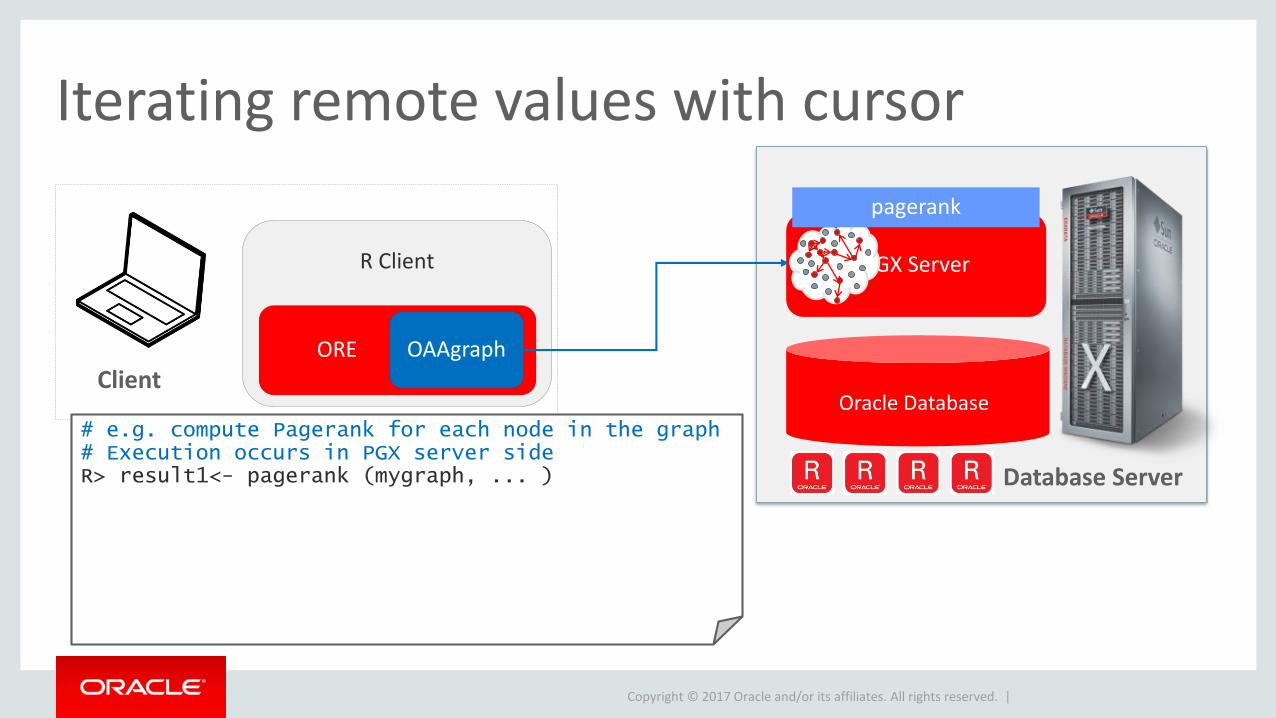
R Client
Iterating remote values with cursor
Client
Database Server
ORE
Oracle Database
PGX Server
pagerank
# e.g. compute Pagerank for each node in the graph# Execution occurs in PGX server sideR> result1<- pagerank (mygraph, ... )
OAAgraph
Copyright © 2017 Oracle and/or its affiliates. All rights reserved. |
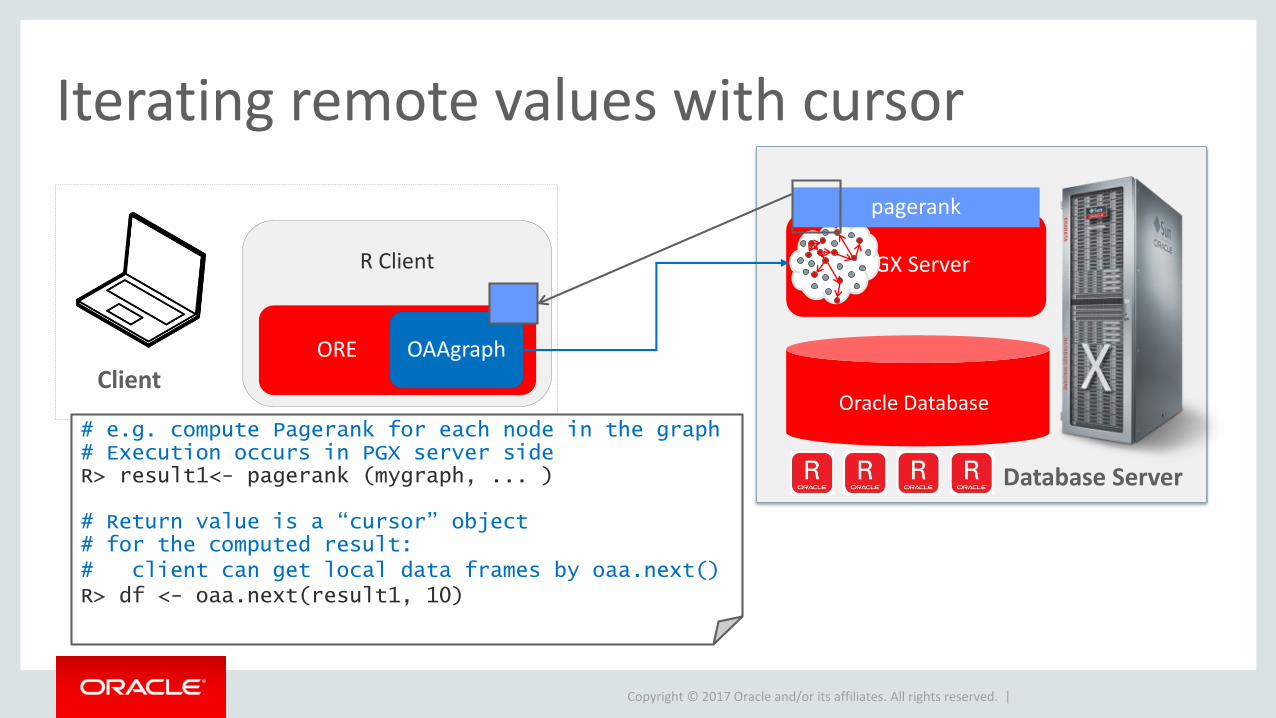
R Client
Iterating remote values with cursor
Client
Database Server
ORE
Oracle Database
PGX Server
pagerank
# e.g. compute Pagerank for each node in the graph# Execution occurs in PGX server sideR> result1<- pagerank (mygraph, ... )
# Return value is a “cursor” object# for the computed result: # client can get local data frames by oaa.next() R> df <- oaa.next(result1, 10)
OAAgraph
Copyright © 2017 Oracle and/or its affiliates. All rights reserved. |
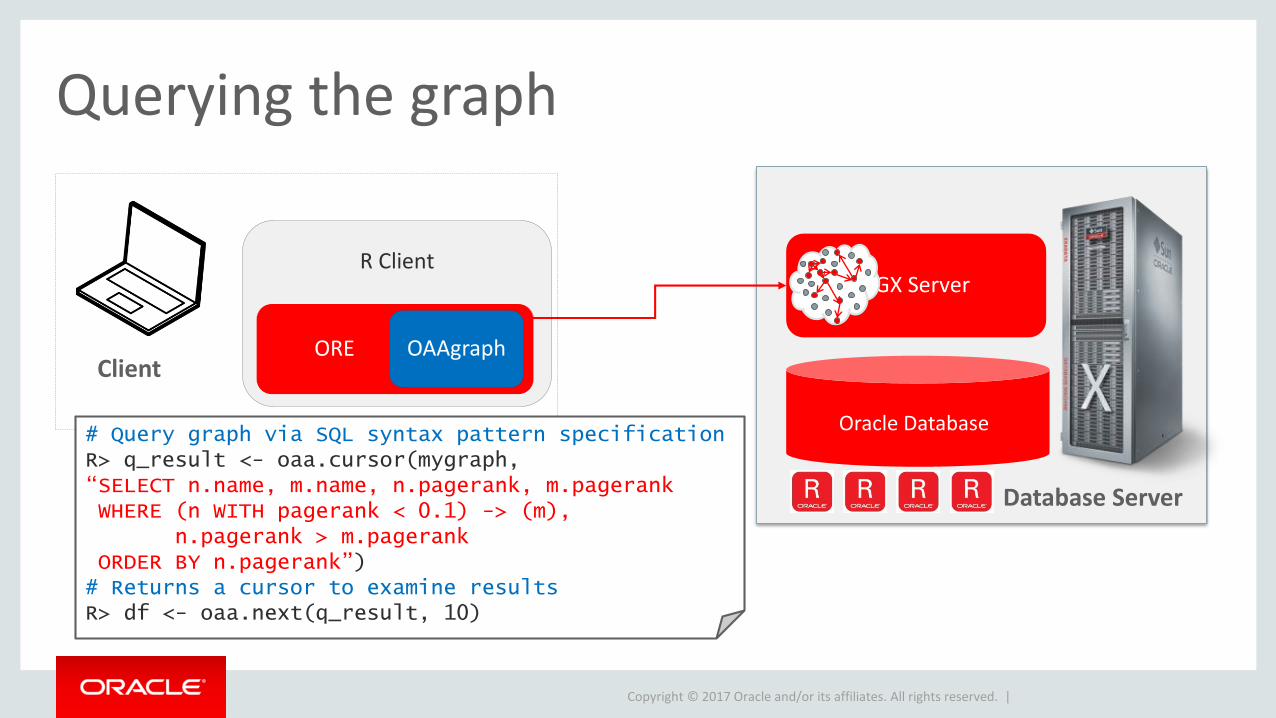
R Client
Querying the graph
Client
Database Server
ORE
Oracle Database
PGX Server
# Query graph via SQL syntax pattern specificationR> q_result <- oaa.cursor(mygraph, “SELECT n.name, m.name, n.pagerank, m.pagerankWHERE (n WITH pagerank < 0.1) -> (m),
n.pagerank > m.pagerankORDER BY n.pagerank”)# Returns a cursor to examine resultsR> df <- oaa.next(q_result, 10)
OAAgraph
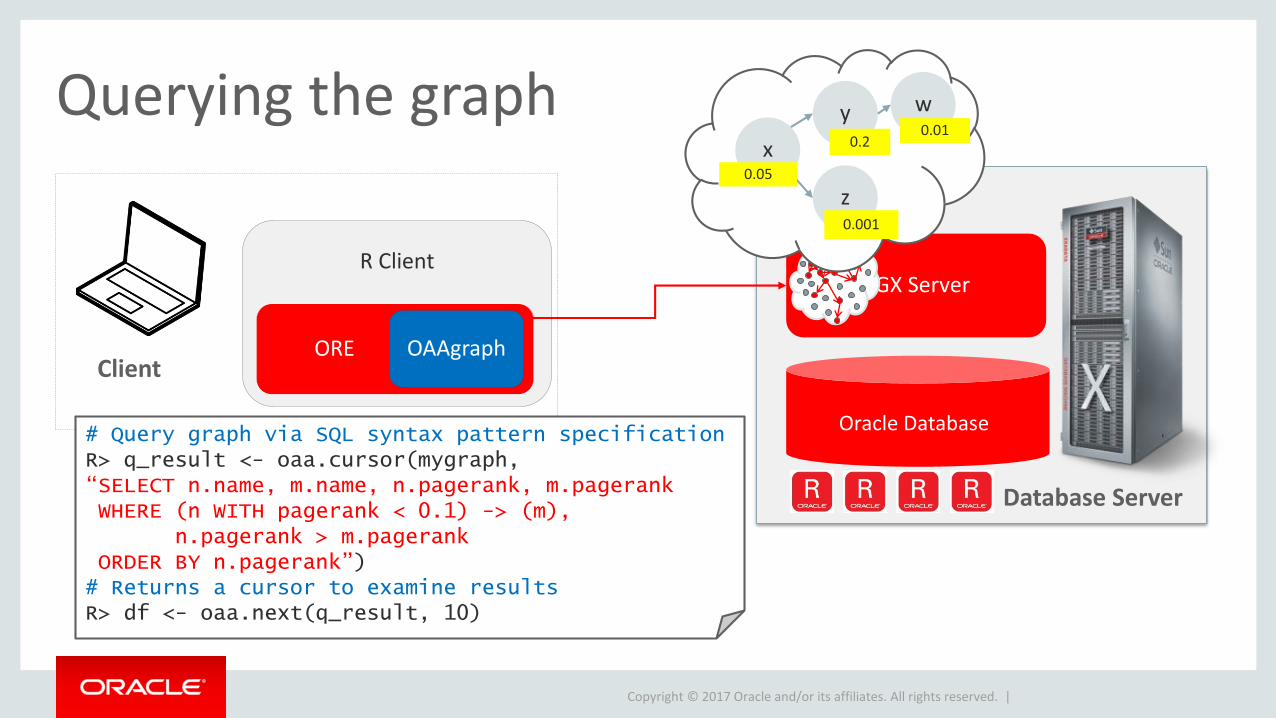
Copyright © 2017 Oracle and/or its affiliates. All rights reserved. |
R Client
Querying the graph
Client
Database Server
ORE
Oracle Database
PGX Server
# Query graph via SQL syntax pattern specificationR> q_result <- oaa.cursor(mygraph, “SELECT n.name, m.name, n.pagerank, m.pagerankWHERE (n WITH pagerank < 0.1) -> (m),
n.pagerank > m.pagerankORDER BY n.pagerank”)# Returns a cursor to examine resultsR> df <- oaa.next(q_result, 10)
x
z
y0.2
0.05
0.001
w0.01
OAAgraph
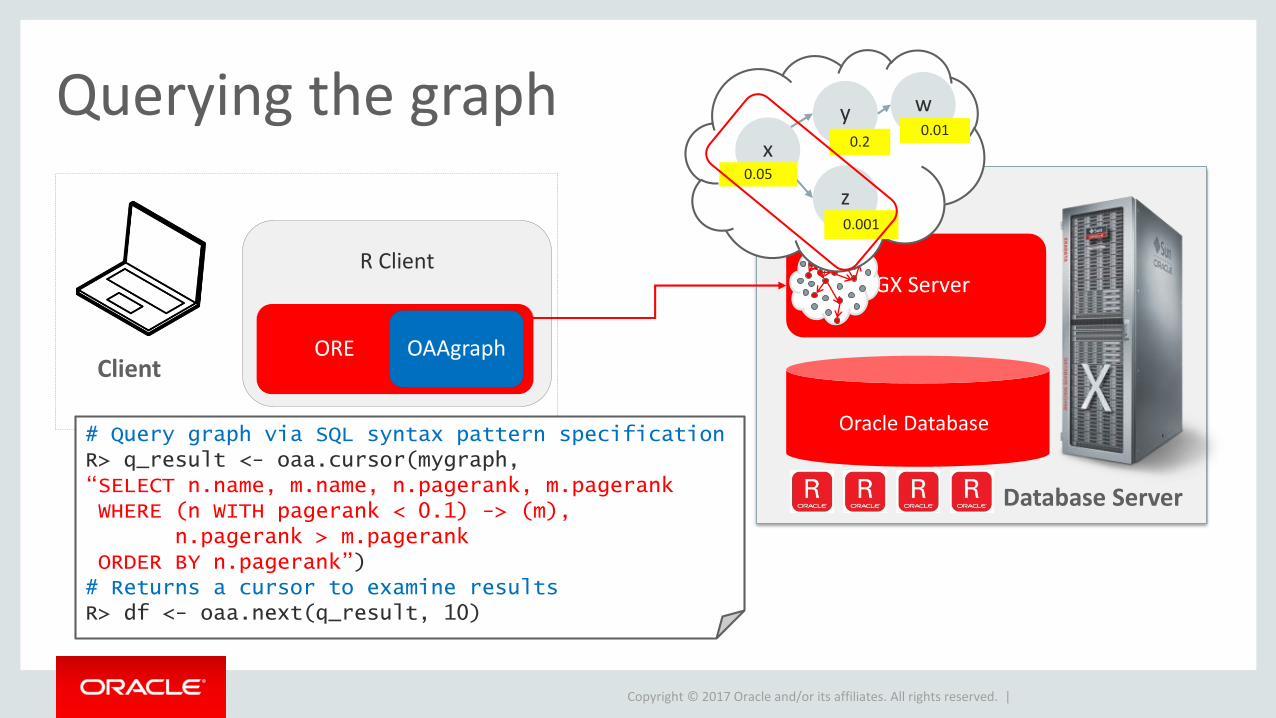
Copyright © 2017 Oracle and/or its affiliates. All rights reserved. |
R Client
Querying the graph
Client
Database Server
ORE
Oracle Database
PGX Server
# Query graph via SQL syntax pattern specificationR> q_result <- oaa.cursor(mygraph, “SELECT n.name, m.name, n.pagerank, m.pagerankWHERE (n WITH pagerank < 0.1) -> (m),
n.pagerank > m.pagerankORDER BY n.pagerank”)# Returns a cursor to examine resultsR> df <- oaa.next(q_result, 10)
x
z
y0.2
0.05
0.001
w0.01
OAAgraph
Copyright © 2017 Oracle and/or its affiliates. All rights reserved. |
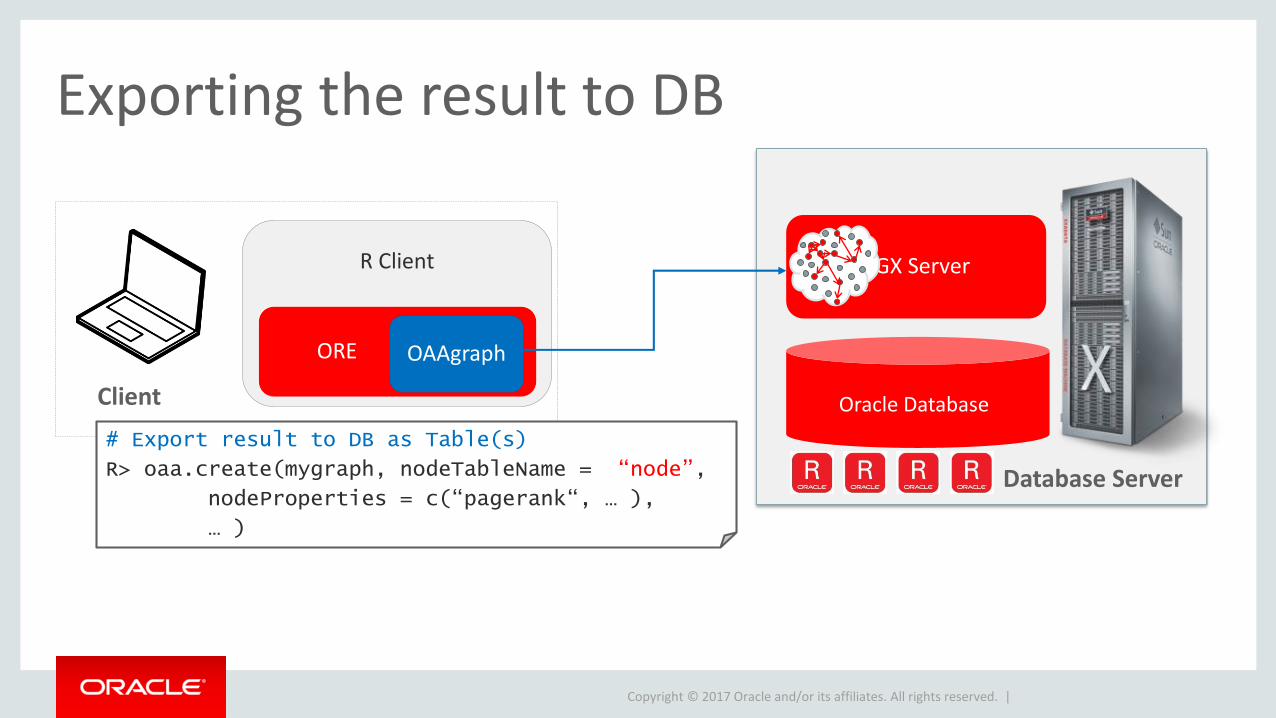
R Client
Exporting the result to DB
Client
Database Server
ORE
Oracle Database
PGX Server
# Export result to DB as Table(s)
R> oaa.create(mygraph, nodeTableName = “node”,
nodeProperties = c(“pagerank“, … ),
… )
OAAgraph
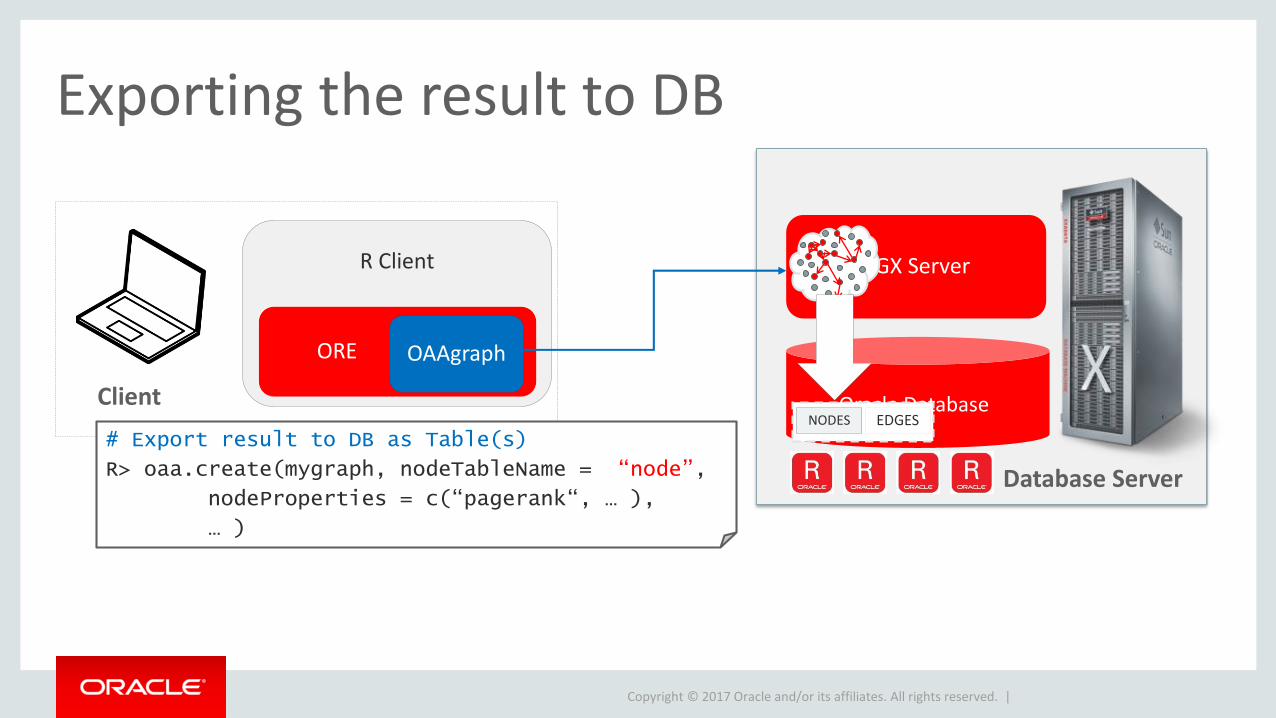
Copyright © 2017 Oracle and/or its affiliates. All rights reserved. |
R Client
Exporting the result to DB
Client
Database Server
ORE
Oracle Database
PGX Server
# Export result to DB as Table(s)
R> oaa.create(mygraph, nodeTableName = “node”,
nodeProperties = c(“pagerank“, … ),
… )
EDGESNODES
OAAgraph
Copyright © 2017 Oracle and/or its affiliates. All rights reserved. |
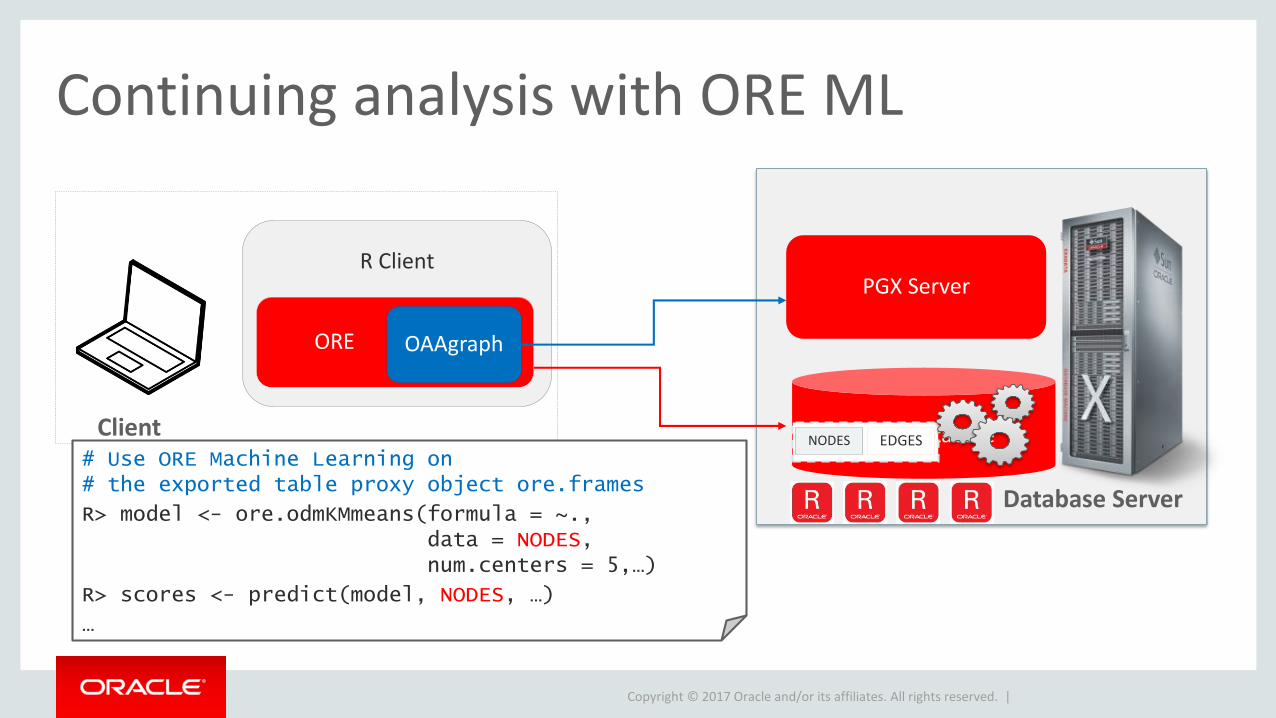
R Client
Continuing analysis with ORE ML
Client
Database Server
ORE
Oracle Database
PGX Server
# Use ORE Machine Learning on# the exported table proxy object ore.frames
R> model <- ore.odmKMmeans(formula = ~., data = NODES, num.centers = 5,…)
R> scores <- predict(model, NODES, …)
…
EDGESNODES
OAAgraph
Copyright © 2017 Oracle and/or its affiliates. All rights reserved. |
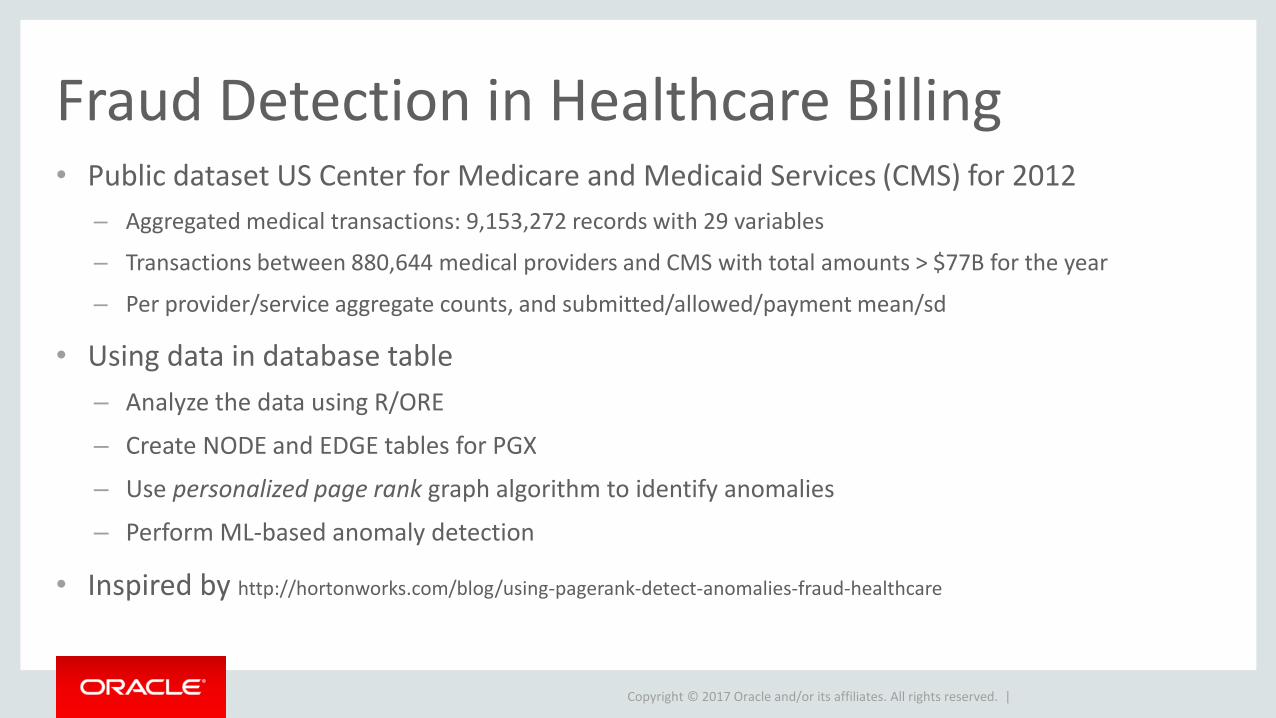
Fraud Detection in Healthcare Billing• Public dataset US Center for Medicare and Medicaid Services (CMS) for 2012
– Aggregated medical transactions: 9,153,272 records with 29 variables
– Transactions between 880,644 medical providers and CMS with total amounts > $77B for the year
– Per provider/service aggregate counts, and submitted/allowed/payment mean/sd
• Using data in database table
– Analyze the data using R/ORE
– Create NODE and EDGE tables for PGX
– Use personalized page rank graph algorithm to identify anomalies
– Perform ML-based anomaly detection
• Inspired by http://hortonworks.com/blog/using-pagerank-detect-anomalies-fraud-healthcare
Copyright © 2017 Oracle and/or its affiliates. All rights reserved. |
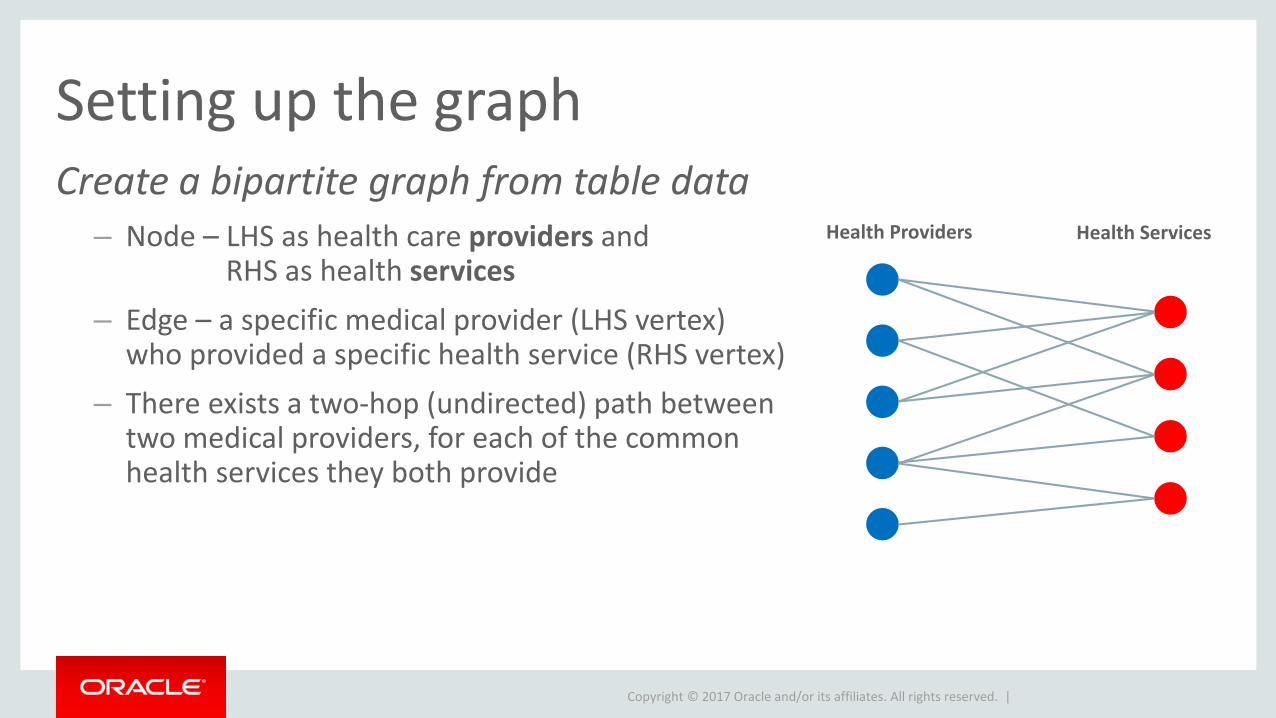
Setting up the graphCreate a bipartite graph from table data
– Node – LHS as health care providers and RHS as health services
– Edge – a specific medical provider (LHS vertex) who provided a specific health service (RHS vertex)
– There exists a two-hop (undirected) path between two medical providers, for each of the common health services they both provide
Health Providers Health Services
Copyright © 2017 Oracle and/or its affiliates. All rights reserved. |
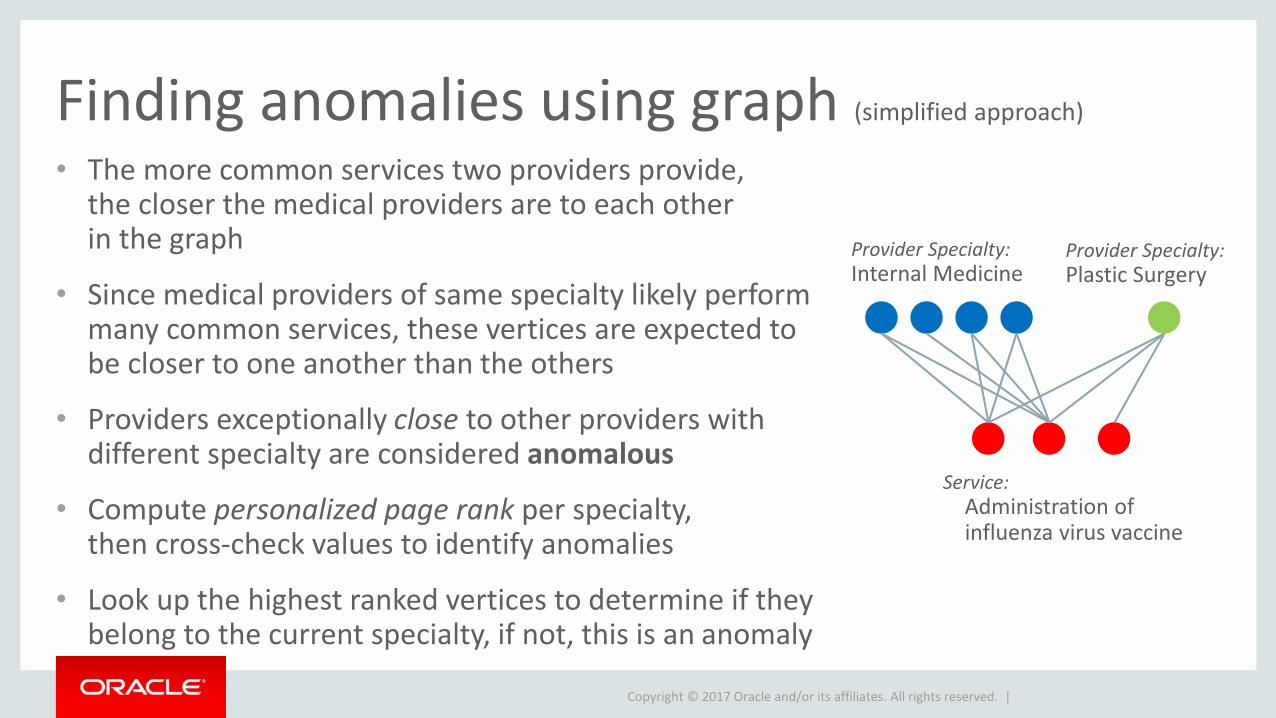
Finding anomalies using graph (simplified approach)
• The more common services two providers provide, the closer the medical providers are to each other in the graph
• Since medical providers of same specialty likely perform many common services, these vertices are expected to be closer to one another than the others
• Providers exceptionally close to other providers with different specialty are considered anomalous
• Compute personalized page rank per specialty, then cross-check values to identify anomalies
• Look up the highest ranked vertices to determine if they belong to the current specialty, if not, this is an anomaly
Provider Specialty: Internal Medicine
Provider Specialty: Plastic Surgery
Service: Administration of influenza virus vaccine
Copyright © 2017 Oracle and/or its affiliates. All rights reserved. |
DemoOAAgraph
Copyright © 2017 Oracle and/or its affiliates. All rights reserved. |
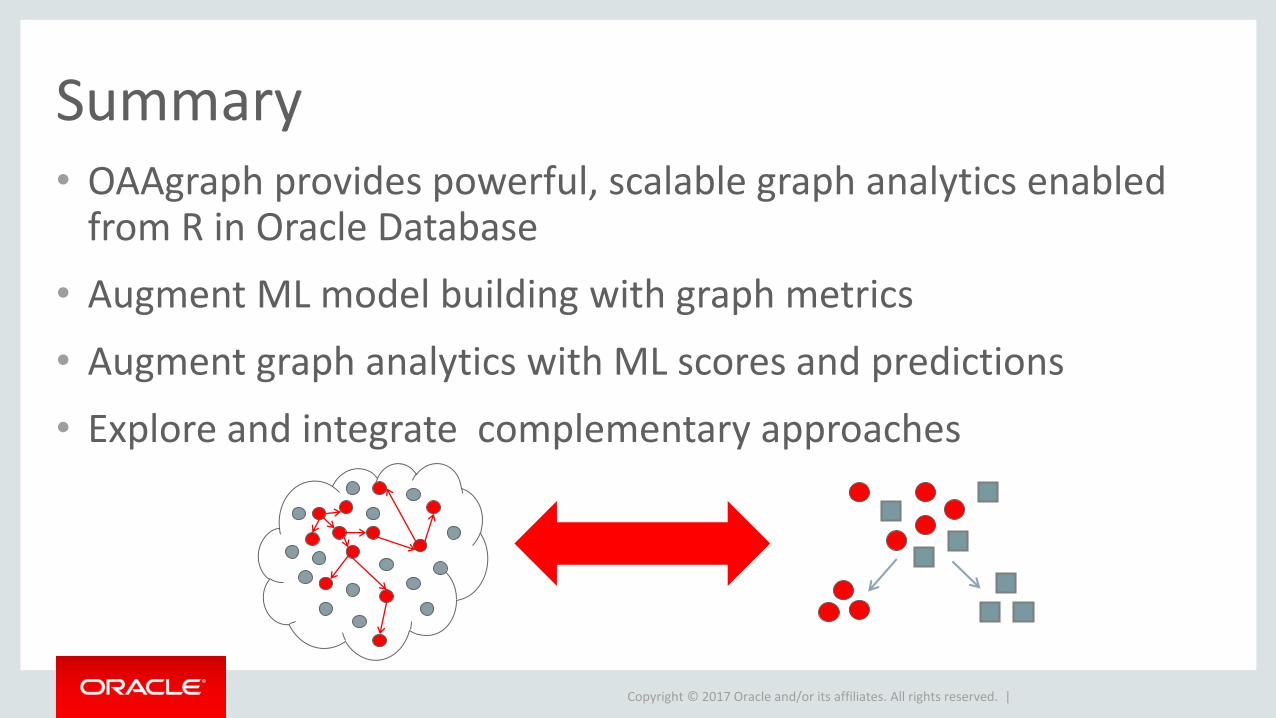
Summary• OAAgraph provides powerful, scalable graph analytics enabled
from R in Oracle Database
• Augment ML model building with graph metrics
• Augment graph analytics with ML scores and predictions
• Explore and integrate complementary approaches
Copyright © 2017 Oracle and/or its affiliates. All rights reserved. | 43
Learn More about Oracle’s R Technologies…
http://oracle.com/goto/R
Top Related