


Languages
Pages
Legal


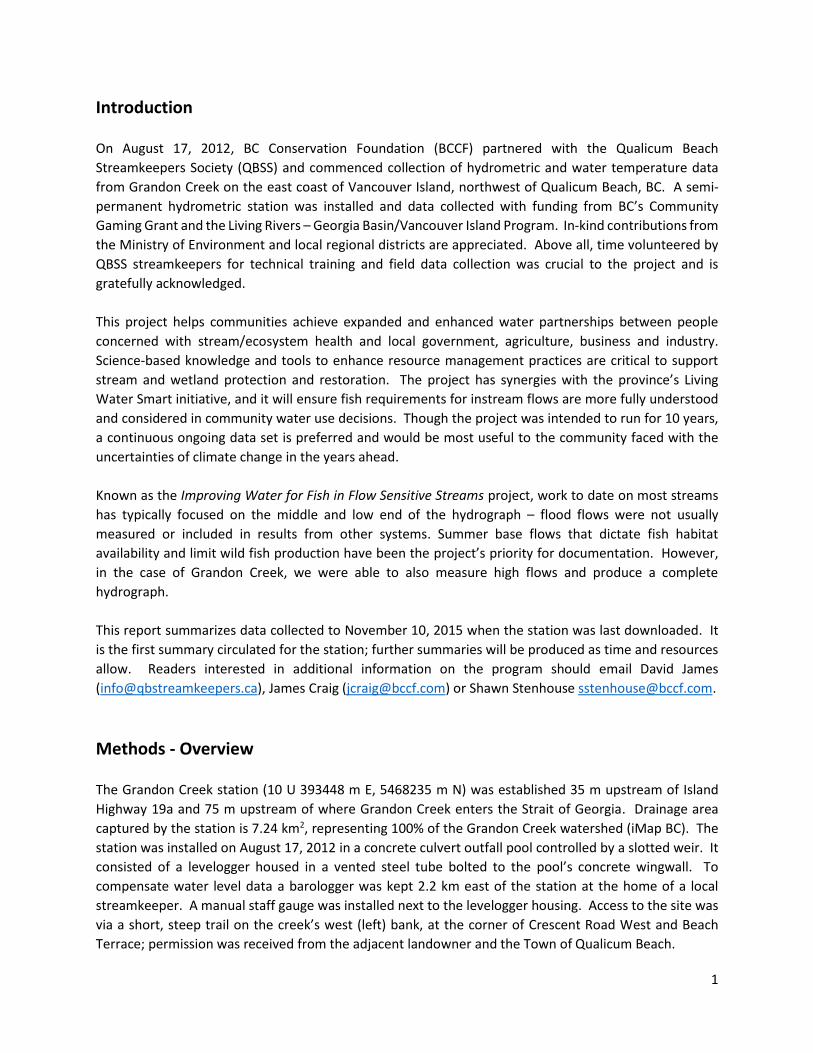
Grandon Creek, Qualicum Beach, Vancouver Island, BC
Hydrometric & Water Temperature Data Report, 2012-2015
Funded by BC Community Gaming Grants and Living Rivers – Georgia Basin/Vancouver Island
Grandon Creek watershed showing station location.
February 2016
1
Introduction
On August 17, 2012, BC Conservation Foundation (BCCF) partnered with the Qualicum Beach
Streamkeepers Society (QBSS) and commenced collection of hydrometric and water temperature data
from Grandon Creek on the east coast of Vancouver Island, northwest of Qualicum Beach, BC. A semi-
permanent hydrometric station was installed and data collected with funding from BC’s Community
Gaming Grant and the Living Rivers – Georgia Basin/Vancouver Island Program. In-kind contributions from
the Ministry of Environment and local regional districts are appreciated. Above all, time volunteered by
QBSS streamkeepers for technical training and field data collection was crucial to the project and is
gratefully acknowledged.
This project helps communities achieve expanded and enhanced water partnerships between people
concerned with stream/ecosystem health and local government, agriculture, business and industry.
Science-based knowledge and tools to enhance resource management practices are critical to support
stream and wetland protection and restoration. The project has synergies with the province’s Living
Water Smart initiative, and it will ensure fish requirements for instream flows are more fully understood
and considered in community water use decisions. Though the project was intended to run for 10 years,
a continuous ongoing data set is preferred and would be most useful to the community faced with the
uncertainties of climate change in the years ahead.
Known as the Improving Water for Fish in Flow Sensitive Streams project, work to date on most streams
has typically focused on the middle and low end of the hydrograph – flood flows were not usually
measured or included in results from other systems. Summer base flows that dictate fish habitat
availability and limit wild fish production have been the project’s priority for documentation. However,
in the case of Grandon Creek, we were able to also measure high flows and produce a complete
hydrograph.
This report summarizes data collected to November 10, 2015 when the station was last downloaded. It
is the first summary circulated for the station; further summaries will be produced as time and resources
allow. Readers interested in additional information on the program should email David James
([email protected]), James Craig ([email protected]) or Shawn Stenhouse [email protected].
Methods - Overview
The Grandon Creek station (10 U 393448 m E, 5468235 m N) was established 35 m upstream of Island
Highway 19a and 75 m upstream of where Grandon Creek enters the Strait of Georgia. Drainage area
captured by the station is 7.24 km2, representing 100% of the Grandon Creek watershed (iMap BC). The
station was installed on August 17, 2012 in a concrete culvert outfall pool controlled by a slotted weir. It
consisted of a levelogger housed in a vented steel tube bolted to the pool’s concrete wingwall. To
compensate water level data a barologger was kept 2.2 km east of the station at the home of a local
streamkeeper. A manual staff gauge was installed next to the levelogger housing. Access to the site was
via a short, steep trail on the creek’s west (left) bank, at the corner of Crescent Road West and Beach
Terrace; permission was received from the adjacent landowner and the Town of Qualicum Beach.
2
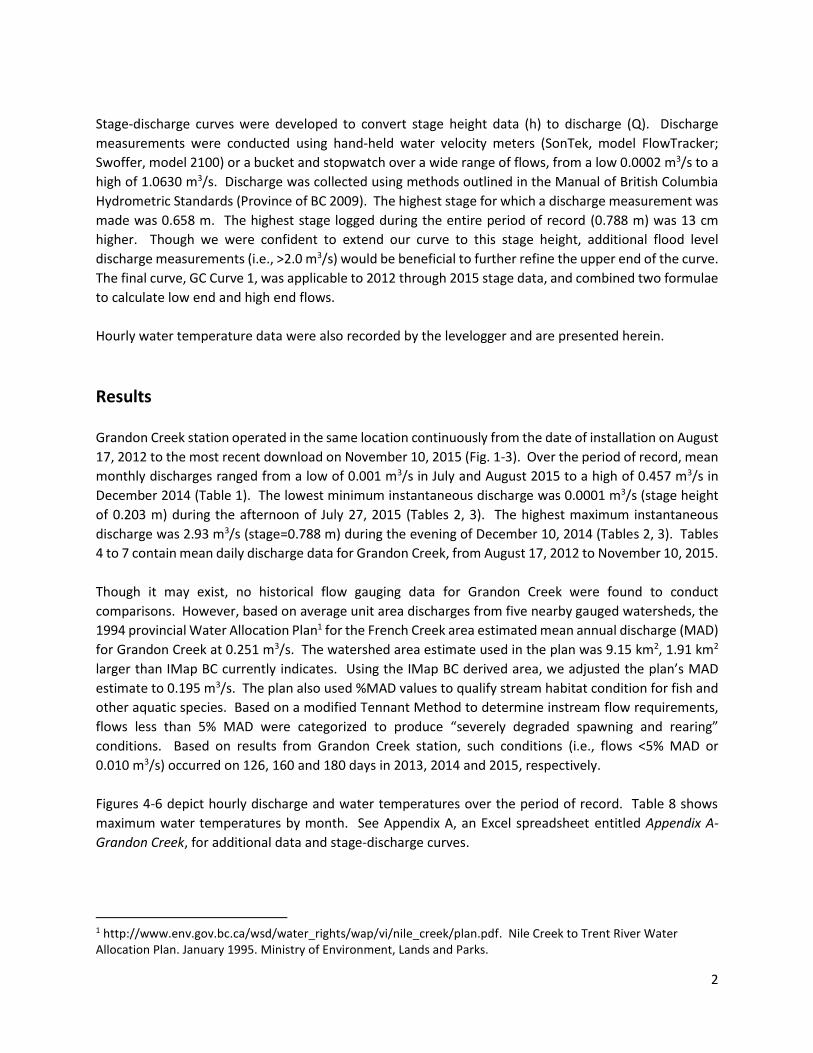
Stage-discharge curves were developed to convert stage height data (h) to discharge (Q). Discharge
measurements were conducted using hand-held water velocity meters (SonTek, model FlowTracker;
Swoffer, model 2100) or a bucket and stopwatch over a wide range of flows, from a low 0.0002 m3/s to a
high of 1.0630 m3/s. Discharge was collected using methods outlined in the Manual of British Columbia
Hydrometric Standards (Province of BC 2009). The highest stage for which a discharge measurement was
made was 0.658 m. The highest stage logged during the entire period of record (0.788 m) was 13 cm
higher. Though we were confident to extend our curve to this stage height, additional flood level
discharge measurements (i.e., >2.0 m3/s) would be beneficial to further refine the upper end of the curve.
The final curve, GC Curve 1, was applicable to 2012 through 2015 stage data, and combined two formulae
to calculate low end and high end flows.
Hourly water temperature data were also recorded by the levelogger and are presented herein.
Results
Grandon Creek station operated in the same location continuously from the date of installation on August
17, 2012 to the most recent download on November 10, 2015 (Fig. 1-3). Over the period of record, mean
monthly discharges ranged from a low of 0.001 m3/s in July and August 2015 to a high of 0.457 m3/s in
December 2014 (Table 1). The lowest minimum instantaneous discharge was 0.0001 m3/s (stage height
of 0.203 m) during the afternoon of July 27, 2015 (Tables 2, 3). The highest maximum instantaneous
discharge was 2.93 m3/s (stage=0.788 m) during the evening of December 10, 2014 (Tables 2, 3). Tables
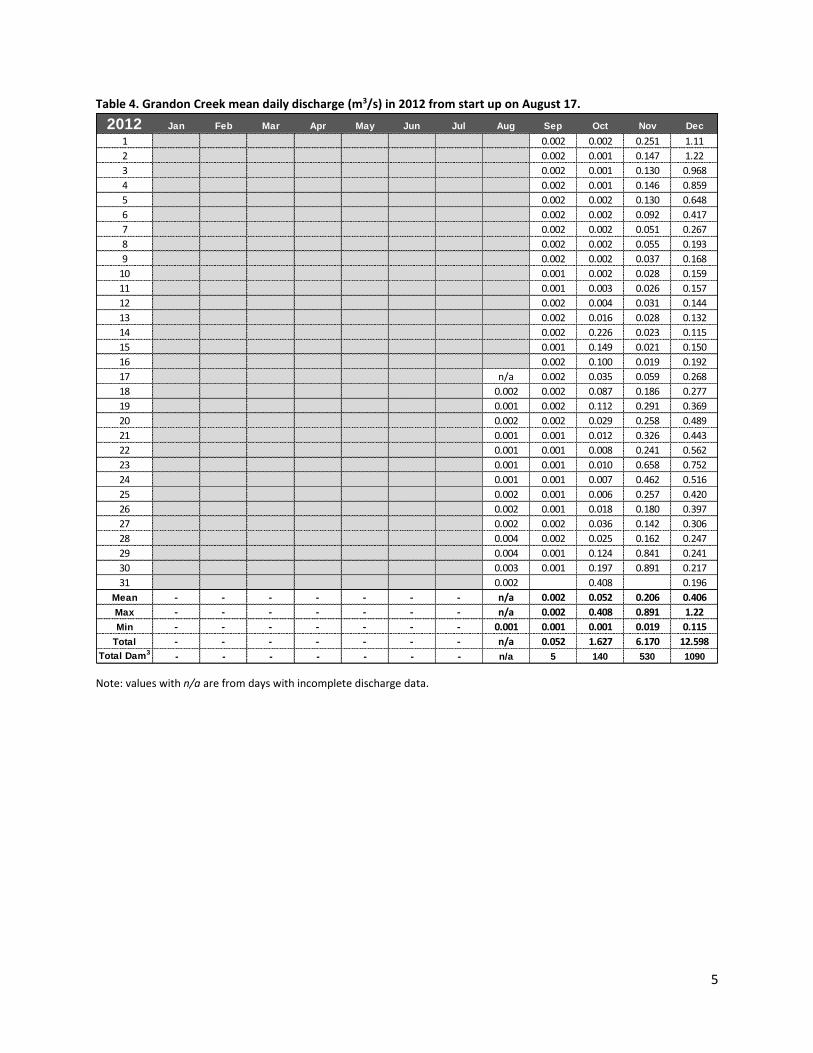
4 to 7 contain mean daily discharge data for Grandon Creek, from August 17, 2012 to November 10, 2015.
Though it may exist, no historical flow gauging data for Grandon Creek were found to conduct
comparisons. However, based on average unit area discharges from five nearby gauged watersheds, the
1994 provincial Water Allocation Plan1 for the French Creek area estimated mean annual discharge (MAD)
for Grandon Creek at 0.251 m3/s. The watershed area estimate used in the plan was 9.15 km2, 1.91 km2
larger than IMap BC currently indicates. Using the IMap BC derived area, we adjusted the plan’s MAD
estimate to 0.195 m3/s. The plan also used %MAD values to qualify stream habitat condition for fish and
other aquatic species. Based on a modified Tennant Method to determine instream flow requirements,
flows less than 5% MAD were categorized to produce “severely degraded spawning and rearing”
conditions. Based on results from Grandon Creek station, such conditions (i.e., flows <5% MAD or
0.010 m3/s) occurred on 126, 160 and 180 days in 2013, 2014 and 2015, respectively.
Figures 4-6 depict hourly discharge and water temperatures over the period of record. Table 8 shows
maximum water temperatures by month. See Appendix A, an Excel spreadsheet entitled Appendix A-
Grandon Creek, for additional data and stage-discharge curves.
1 http://www.env.gov.bc.ca/wsd/water_rights/wap/vi/nile_creek/plan.pdf. Nile Creek to Trent River Water Allocation Plan. January 1995. Ministry of Environment, Lands and Parks.
3
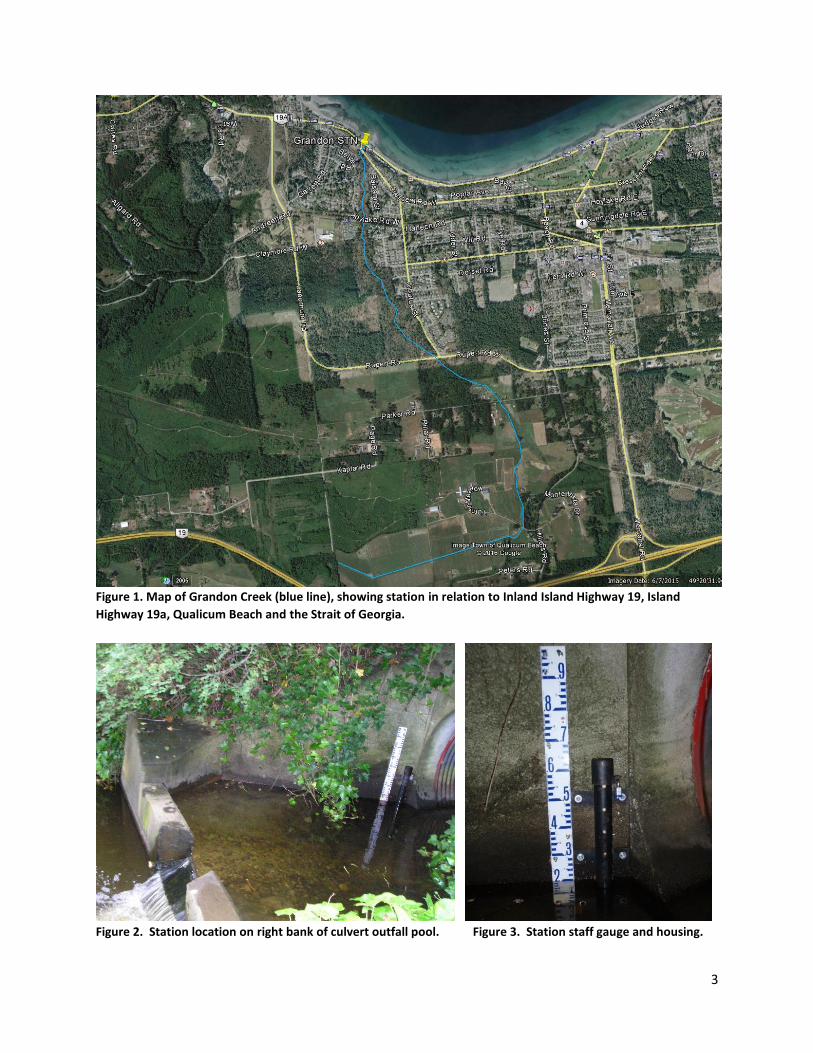
Figure 1. Map of Grandon Creek (blue line), showing station in relation to Inland Island Highway 19, Island
Highway 19a, Qualicum Beach and the Strait of Georgia.
Figure 2. Station location on right bank of culvert outfall pool. Figure 3. Station staff gauge and housing.

4
Table 1. Mean monthly discharge (m3/s), August 2012 to November 2015.
Values with n/a are from months with incomplete discharge data.
Table 2. Extreme Discharges, August 2012 to November 2015.
Values in italics are from years with incomplete records.
Table 3. Measured Extreme Stage Heights, August 2012 to October 2015.
Values in italics are from years with incomplete records.
Jan Feb Mar Apr May Jun Jul Aug Sep Oct Nov Dec
2012 n/a 0.002 0.052 0.206 0.406
2013 0.183 0.095 0.188 0.031 0.037 0.021 0.003 0.003 0.012 0.014 0.060 0.019
2014 0.151 0.259 0.382 0.074 0.006 0.003 0.006 0.004 0.004 0.126 0.232 0.459
2015 0.197 0.369 0.115 0.045 0.004 0.003 0.001 0.001 0.005 0.008 n/a
Mean 0.177 0.241 0.228 0.050 0.016 0.009 0.003 0.003 0.006 0.050 0.166 0.295
Maximum Instantaneous
Discharge (m3/s)
Minimum Instantaneous
Discharge (m3/s)
Maximum Daily Discharge
(m3/s)
Minimum Daily Discharge
(m3/s)
2012 1.56 at 0:00 PST on Dec 2 0.0003 at 0:00 PST on Oct 3 1.22 on Dec 2 0.0009 on Aug 22
2013 1.19 at 22:00 PST on Jan 8 0.0003 at 13:00 PST on Aug 14 0.961 on Jan 9 0.0010 on Sep 12
2014 2.93 at 17:00 PST on Dec 10 0.0002 at 19:00 PST on Sep 9 2.48 on Dec 10 0.0010 on Sep 9
2015 2.16 at 12:00 PST on Feb 6 0.0001 at 13:00 PST on Jul 27 1.75 on Feb 6 0.0003 on Aug 4
Maximum Instantaneous Stage
(m)
Minimum Instantaneous Stage
(m)
Maximum Daily Stage
(m)
Minimum Daily Stage
(m)
2012 0.701 at 0:00 PST on Dec 2 0.208 at 0:00 PST on Oct 3 0.670 on Dec 2 0.219 on Aug 22
2013 0.667 at 22:00 PST on Jan 8 0.209 at 13:00 PST on Aug 14 0.640 on Jan 9 0.220 on Sep 12
2014 0.788 at 17:00 PST on Dec 10 0.206 at 19:00 PST on Sep 9 0.764 on Dec 10 0.221 on Sep 9
2015 0.745 at 12:00 PST on Feb 6 0.203 at 13:00 PST on Jul 27 0.715 on Feb 6 0.209 on Aug 4
5
Table 4. Grandon Creek mean daily discharge (m3/s) in 2012 from start up on August 17.
Note: values with n/a are from days with incomplete discharge data.
2012 Jan Feb Mar Apr May Jun Jul Aug Sep Oct Nov Dec
1 0.002 0.002 0.251 1.11
2 0.002 0.001 0.147 1.22
3 0.002 0.001 0.130 0.968
4 0.002 0.001 0.146 0.859
5 0.002 0.002 0.130 0.648
6 0.002 0.002 0.092 0.417
7 0.002 0.002 0.051 0.267
8 0.002 0.002 0.055 0.193
9 0.002 0.002 0.037 0.168
10 0.001 0.002 0.028 0.159
11 0.001 0.003 0.026 0.157
12 0.002 0.004 0.031 0.144
13 0.002 0.016 0.028 0.132
14 0.002 0.226 0.023 0.115
15 0.001 0.149 0.021 0.150
16 0.002 0.100 0.019 0.192
17 n/a 0.002 0.035 0.059 0.268
18 0.002 0.002 0.087 0.186 0.277
19 0.001 0.002 0.112 0.291 0.369
20 0.002 0.002 0.029 0.258 0.489
21 0.001 0.001 0.012 0.326 0.443
22 0.001 0.001 0.008 0.241 0.562
23 0.001 0.001 0.010 0.658 0.752
24 0.001 0.001 0.007 0.462 0.516
25 0.002 0.001 0.006 0.257 0.420
26 0.002 0.001 0.018 0.180 0.397
27 0.002 0.002 0.036 0.142 0.306
28 0.004 0.002 0.025 0.162 0.247
29 0.004 0.001 0.124 0.841 0.241
30 0.003 0.001 0.197 0.891 0.217
31 0.002 0.408 0.196
Mean - - - - - - - n/a 0.002 0.052 0.206 0.406
Max - - - - - - - n/a 0.002 0.408 0.891 1.22
Min - - - - - - - 0.001 0.001 0.001 0.019 0.115
Total - - - - - - - n/a 0.052 1.627 6.170 12.598
Total Dam3- - - - - - - n/a 5 140 530 1090

6
Table 5. Grandon Creek mean daily discharge (m3/s) in 2013.
2013 Jan Feb Mar Apr May Jun Jul Aug Sep Oct Nov Dec
1 0.194 0.042 0.445 0.024 0.009 0.084 0.007 0.002 0.003 0.101 0.011 0.031
2 0.162 0.040 0.549 0.022 0.009 0.059 0.005 0.002 0.002 0.064 0.292 0.022
3 0.136 0.037 0.318 0.023 0.008 0.030 0.005 0.002 0.003 0.035 0.132 0.016
4 0.130 0.038 0.217 0.042 0.008 0.024 0.004 0.002 0.002 0.024 0.080 0.013
5 0.128 0.080 0.167 0.051 0.007 0.022 0.004 0.002 0.002 0.018 0.054 0.012
6 0.133 0.161 0.164 0.053 0.006 0.015 0.004 0.001 0.002 0.015 0.044 0.010
7 0.138 0.175 0.133 0.038 0.005 0.013 0.003 0.001 0.002 0.016 0.176 0.008
8 0.436 0.144 0.130 0.025 0.005 0.010 0.003 0.001 0.002 0.014 0.149 0.006
9 0.961 0.112 0.105 0.028 0.005 0.009 0.003 0.001 0.001 0.011 0.100 0.006
10 0.508 0.095 0.091 0.098 0.005 0.009 0.003 0.001 0.001 0.012 0.075 0.007
11 0.290 0.071 0.085 0.097 0.007 0.034 0.003 0.002 0.001 0.010 0.057 0.008
12 0.207 0.058 0.247 0.058 0.027 0.022 0.002 0.003 0.001 0.010 0.051 0.014
13 0.169 0.043 0.190 0.040 0.021 0.013 0.002 0.002 0.001 0.008 0.069 0.016
14 0.153 0.073 0.273 0.030 0.012 0.011 0.003 0.002 0.004 0.007 0.059 0.018
15 0.144 0.076 0.403 0.023 0.014 0.010 0.002 0.002 0.003 0.007 0.055 0.020
16 0.140 0.063 0.253 0.018 0.014 0.009 0.002 0.004 0.011 0.006 0.037 0.019
17 0.133 0.072 0.171 0.016 0.067 0.011 0.002 0.003 0.002 0.006 0.028 0.017
18 0.116 0.059 0.132 0.022 0.027 0.029 0.002 0.002 0.002 0.005 0.034 0.022
19 0.106 0.113 0.136 0.047 0.021 0.012 0.002 0.002 0.002 0.005 0.064 0.017
20 0.100 0.083 0.362 0.043 0.060 0.010 0.002 0.002 0.017 0.005 0.035 0.020
21 0.091 0.062 0.274 0.026 0.108 0.009 0.002 0.001 0.008 0.005 0.024 0.023
22 0.089 0.081 0.209 0.019 0.057 0.010 0.002 0.001 0.012 0.004 0.021 0.035
23 0.121 0.065 0.168 0.015 0.153 0.010 0.002 0.001 0.004 0.004 0.020 0.041
24 0.147 0.077 0.141 0.014 0.074 0.032 0.002 0.001 0.005 0.004 0.019 0.028
25 0.147 0.260 0.124 0.011 0.043 0.019 0.002 0.001 0.004 0.004 0.017 0.024
26 0.133 0.170 0.104 0.010 0.046 0.023 0.002 0.001 0.003 0.006 0.016 0.021
27 0.118 0.142 0.081 0.011 0.047 0.039 0.002 0.002 0.016 0.005 0.015 0.021
28 0.103 0.168 0.058 0.010 0.044 0.019 0.002 0.003 0.021 0.004 0.014 0.020
29 0.092 0.044 0.014 0.061 0.014 0.002 0.016 0.112 0.003 0.016 0.022
30 0.093 0.035 0.010 0.075 0.010 0.002 0.012 0.117 0.003 0.030 0.024
31 0.066 0.031 0.089 0.002 0.004 0.003 0.020
Mean 0.183 0.095 0.188 0.031 0.037 0.021 0.003 0.003 0.012 0.014 0.060 0.019
Max 0.961 0.260 0.549 0.098 0.153 0.084 0.007 0.016 0.117 0.101 0.292 0.041
Min 0.066 0.037 0.031 0.010 0.005 0.009 0.002 0.001 0.001 0.003 0.011 0.006
Total 5.684 2.659 5.839 0.939 1.133 0.621 0.084 0.084 0.366 0.426 1.796 0.582
Total Dam3490 230 500 80 100 50 7 7 30 40 160 50
7
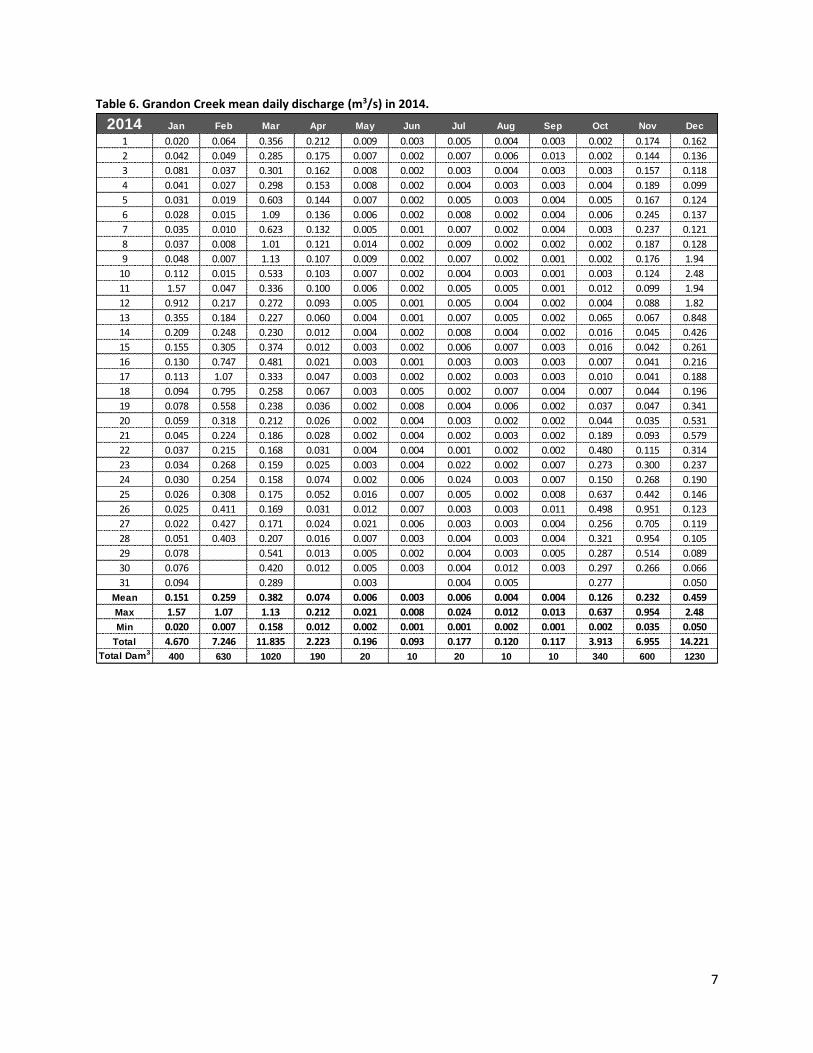
Table 6. Grandon Creek mean daily discharge (m3/s) in 2014.
2014 Jan Feb Mar Apr May Jun Jul Aug Sep Oct Nov Dec
1 0.020 0.064 0.356 0.212 0.009 0.003 0.005 0.004 0.003 0.002 0.174 0.162
2 0.042 0.049 0.285 0.175 0.007 0.002 0.007 0.006 0.013 0.002 0.144 0.136
3 0.081 0.037 0.301 0.162 0.008 0.002 0.003 0.004 0.003 0.003 0.157 0.118
4 0.041 0.027 0.298 0.153 0.008 0.002 0.004 0.003 0.003 0.004 0.189 0.099
5 0.031 0.019 0.603 0.144 0.007 0.002 0.005 0.003 0.004 0.005 0.167 0.124
6 0.028 0.015 1.09 0.136 0.006 0.002 0.008 0.002 0.004 0.006 0.245 0.137
7 0.035 0.010 0.623 0.132 0.005 0.001 0.007 0.002 0.004 0.003 0.237 0.121
8 0.037 0.008 1.01 0.121 0.014 0.002 0.009 0.002 0.002 0.002 0.187 0.128
9 0.048 0.007 1.13 0.107 0.009 0.002 0.007 0.002 0.001 0.002 0.176 1.94
10 0.112 0.015 0.533 0.103 0.007 0.002 0.004 0.003 0.001 0.003 0.124 2.48
11 1.57 0.047 0.336 0.100 0.006 0.002 0.005 0.005 0.001 0.012 0.099 1.94
12 0.912 0.217 0.272 0.093 0.005 0.001 0.005 0.004 0.002 0.004 0.088 1.82
13 0.355 0.184 0.227 0.060 0.004 0.001 0.007 0.005 0.002 0.065 0.067 0.848
14 0.209 0.248 0.230 0.012 0.004 0.002 0.008 0.004 0.002 0.016 0.045 0.426
15 0.155 0.305 0.374 0.012 0.003 0.002 0.006 0.007 0.003 0.016 0.042 0.261
16 0.130 0.747 0.481 0.021 0.003 0.001 0.003 0.003 0.003 0.007 0.041 0.216
17 0.113 1.07 0.333 0.047 0.003 0.002 0.002 0.003 0.003 0.010 0.041 0.188
18 0.094 0.795 0.258 0.067 0.003 0.005 0.002 0.007 0.004 0.007 0.044 0.196
19 0.078 0.558 0.238 0.036 0.002 0.008 0.004 0.006 0.002 0.037 0.047 0.341
20 0.059 0.318 0.212 0.026 0.002 0.004 0.003 0.002 0.002 0.044 0.035 0.531
21 0.045 0.224 0.186 0.028 0.002 0.004 0.002 0.003 0.002 0.189 0.093 0.579
22 0.037 0.215 0.168 0.031 0.004 0.004 0.001 0.002 0.002 0.480 0.115 0.314
23 0.034 0.268 0.159 0.025 0.003 0.004 0.022 0.002 0.007 0.273 0.300 0.237
24 0.030 0.254 0.158 0.074 0.002 0.006 0.024 0.003 0.007 0.150 0.268 0.190
25 0.026 0.308 0.175 0.052 0.016 0.007 0.005 0.002 0.008 0.637 0.442 0.146
26 0.025 0.411 0.169 0.031 0.012 0.007 0.003 0.003 0.011 0.498 0.951 0.123
27 0.022 0.427 0.171 0.024 0.021 0.006 0.003 0.003 0.004 0.256 0.705 0.119
28 0.051 0.403 0.207 0.016 0.007 0.003 0.004 0.003 0.004 0.321 0.954 0.105
29 0.078 0.541 0.013 0.005 0.002 0.004 0.003 0.005 0.287 0.514 0.089
30 0.076 0.420 0.012 0.005 0.003 0.004 0.012 0.003 0.297 0.266 0.066
31 0.094 0.289 0.003 0.004 0.005 0.277 0.050
Mean 0.151 0.259 0.382 0.074 0.006 0.003 0.006 0.004 0.004 0.126 0.232 0.459
Max 1.57 1.07 1.13 0.212 0.021 0.008 0.024 0.012 0.013 0.637 0.954 2.48
Min 0.020 0.007 0.158 0.012 0.002 0.001 0.001 0.002 0.001 0.002 0.035 0.050
Total 4.670 7.246 11.835 2.223 0.196 0.093 0.177 0.120 0.117 3.913 6.955 14.221
Total Dam3400 630 1020 190 20 10 20 10 10 340 600 1230
8
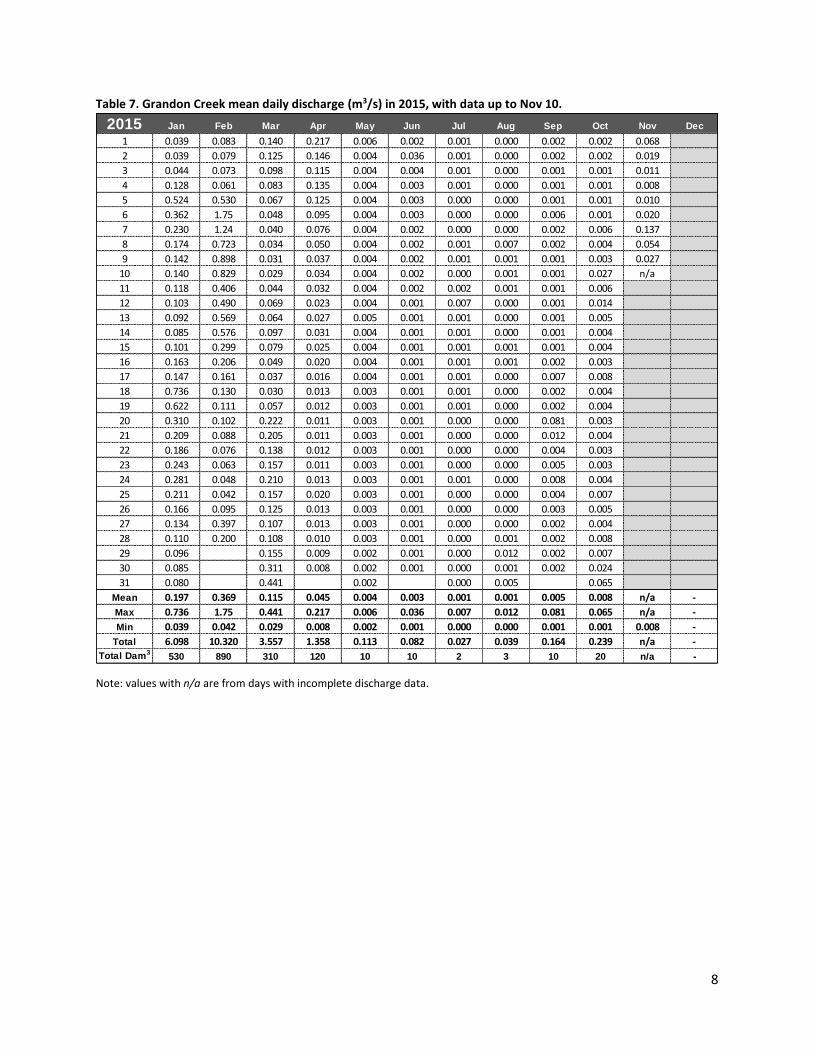
Table 7. Grandon Creek mean daily discharge (m3/s) in 2015, with data up to Nov 10.
Note: values with n/a are from days with incomplete discharge data.
2015 Jan Feb Mar Apr May Jun Jul Aug Sep Oct Nov Dec
1 0.039 0.083 0.140 0.217 0.006 0.002 0.001 0.000 0.002 0.002 0.068
2 0.039 0.079 0.125 0.146 0.004 0.036 0.001 0.000 0.002 0.002 0.019
3 0.044 0.073 0.098 0.115 0.004 0.004 0.001 0.000 0.001 0.001 0.011
4 0.128 0.061 0.083 0.135 0.004 0.003 0.001 0.000 0.001 0.001 0.008
5 0.524 0.530 0.067 0.125 0.004 0.003 0.000 0.000 0.001 0.001 0.010
6 0.362 1.75 0.048 0.095 0.004 0.003 0.000 0.000 0.006 0.001 0.020
7 0.230 1.24 0.040 0.076 0.004 0.002 0.000 0.000 0.002 0.006 0.137
8 0.174 0.723 0.034 0.050 0.004 0.002 0.001 0.007 0.002 0.004 0.054
9 0.142 0.898 0.031 0.037 0.004 0.002 0.001 0.001 0.001 0.003 0.027
10 0.140 0.829 0.029 0.034 0.004 0.002 0.000 0.001 0.001 0.027 n/a
11 0.118 0.406 0.044 0.032 0.004 0.002 0.002 0.001 0.001 0.006
12 0.103 0.490 0.069 0.023 0.004 0.001 0.007 0.000 0.001 0.014
13 0.092 0.569 0.064 0.027 0.005 0.001 0.001 0.000 0.001 0.005
14 0.085 0.576 0.097 0.031 0.004 0.001 0.001 0.000 0.001 0.004
15 0.101 0.299 0.079 0.025 0.004 0.001 0.001 0.001 0.001 0.004
16 0.163 0.206 0.049 0.020 0.004 0.001 0.001 0.001 0.002 0.003
17 0.147 0.161 0.037 0.016 0.004 0.001 0.001 0.000 0.007 0.008
18 0.736 0.130 0.030 0.013 0.003 0.001 0.001 0.000 0.002 0.004
19 0.622 0.111 0.057 0.012 0.003 0.001 0.001 0.000 0.002 0.004
20 0.310 0.102 0.222 0.011 0.003 0.001 0.000 0.000 0.081 0.003
21 0.209 0.088 0.205 0.011 0.003 0.001 0.000 0.000 0.012 0.004
22 0.186 0.076 0.138 0.012 0.003 0.001 0.000 0.000 0.004 0.003
23 0.243 0.063 0.157 0.011 0.003 0.001 0.000 0.000 0.005 0.003
24 0.281 0.048 0.210 0.013 0.003 0.001 0.001 0.000 0.008 0.004
25 0.211 0.042 0.157 0.020 0.003 0.001 0.000 0.000 0.004 0.007
26 0.166 0.095 0.125 0.013 0.003 0.001 0.000 0.000 0.003 0.005
27 0.134 0.397 0.107 0.013 0.003 0.001 0.000 0.000 0.002 0.004
28 0.110 0.200 0.108 0.010 0.003 0.001 0.000 0.001 0.002 0.008
29 0.096 0.155 0.009 0.002 0.001 0.000 0.012 0.002 0.007
30 0.085 0.311 0.008 0.002 0.001 0.000 0.001 0.002 0.024
31 0.080 0.441 0.002 0.000 0.005 0.065
Mean 0.197 0.369 0.115 0.045 0.004 0.003 0.001 0.001 0.005 0.008 n/a -
Max 0.736 1.75 0.441 0.217 0.006 0.036 0.007 0.012 0.081 0.065 n/a -
Min 0.039 0.042 0.029 0.008 0.002 0.001 0.000 0.000 0.001 0.001 0.008 -
Total 6.098 10.320 3.557 1.358 0.113 0.082 0.027 0.039 0.164 0.239 n/a -
Total Dam3530 890 310 120 10 10 2 3 10 20 n/a -

9
Figure 4. Grandon Creek hourly discharge, August 17, 2012 to November 10, 2015.
Figure 5. Grandon Creek hourly discharge, August 17, 2012 to November 10, 2015 (logarithmic scale).

10
Figure 6. Grandon Creek mean daily water temperature, August 17, 2012 to November 10, 2015.
Table 8. Maximum water temperature (oC) recorded by month, August 17, 2012 to November 10, 2015. Hourly data.
Note: values in italics are from incomplete months. Values in red are maximum temperatures reached annually.
2012 2013 2014 2015
January 5.6 6.2 8.2
February 6.5 5.3 9.5
March 9.7 8.9 10.7
April 10.8 10.9 11.3
May 13.6 14.0 14.1
June 16.9 14.5 16.9
July 16.8 16.9 17.4
August 17.1 18.2 18.4 17.6
September 14.2 16.8 15.8 14.7
October 12.6 11.7 13.7 13.7
November 11.1 9.6 11.5 10.5
December 7.7 7.2 8.8
Top Related