


Languages
Pages
Legal

Research performed by
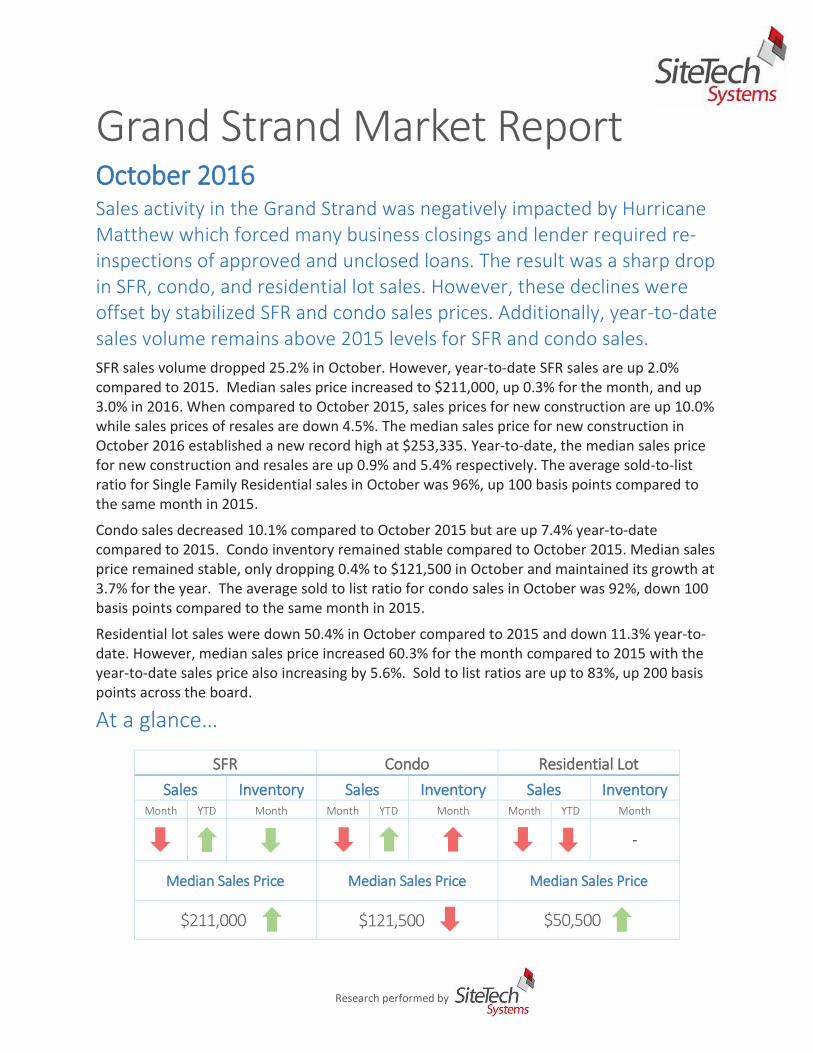
Grand Strand Market Report October 2016 Sales activity in the Grand Strand was negatively impacted by Hurricane Matthew which forced many business closings and lender required re-inspections of approved and unclosed loans. The result was a sharp drop in SFR, condo, and residential lot sales. However, these declines were offset by stabilized SFR and condo sales prices. Additionally, year-to-date sales volume remains above 2015 levels for SFR and condo sales.
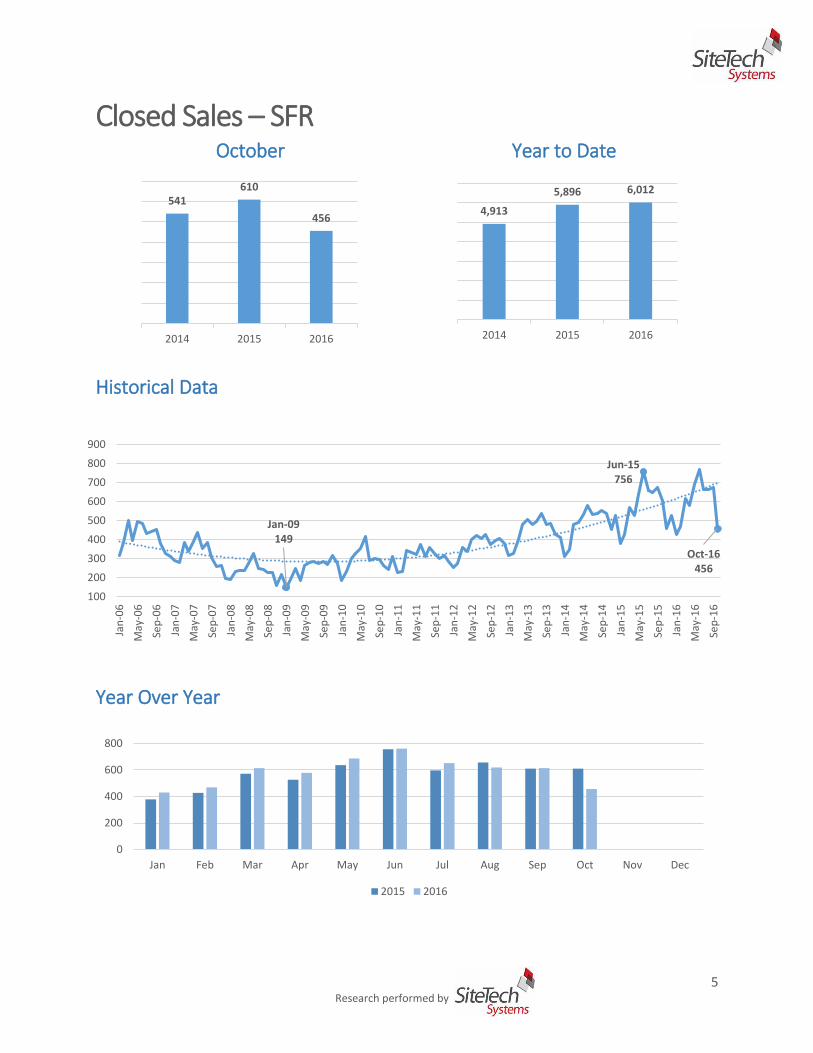
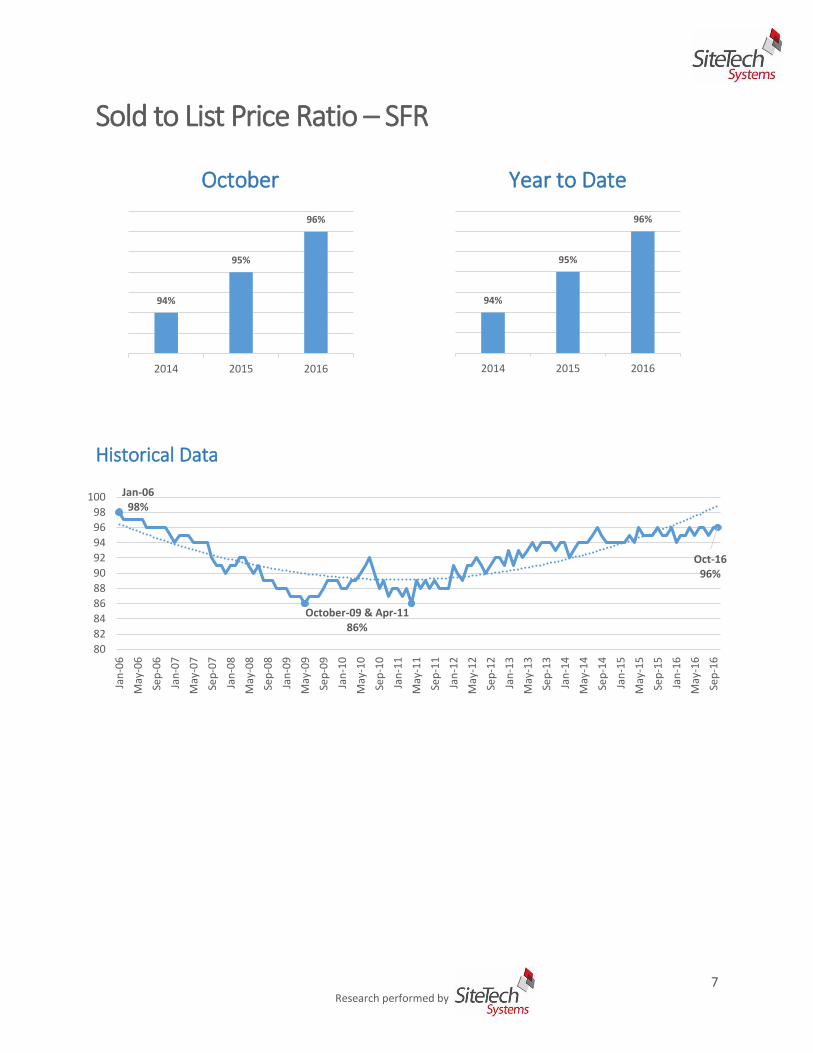
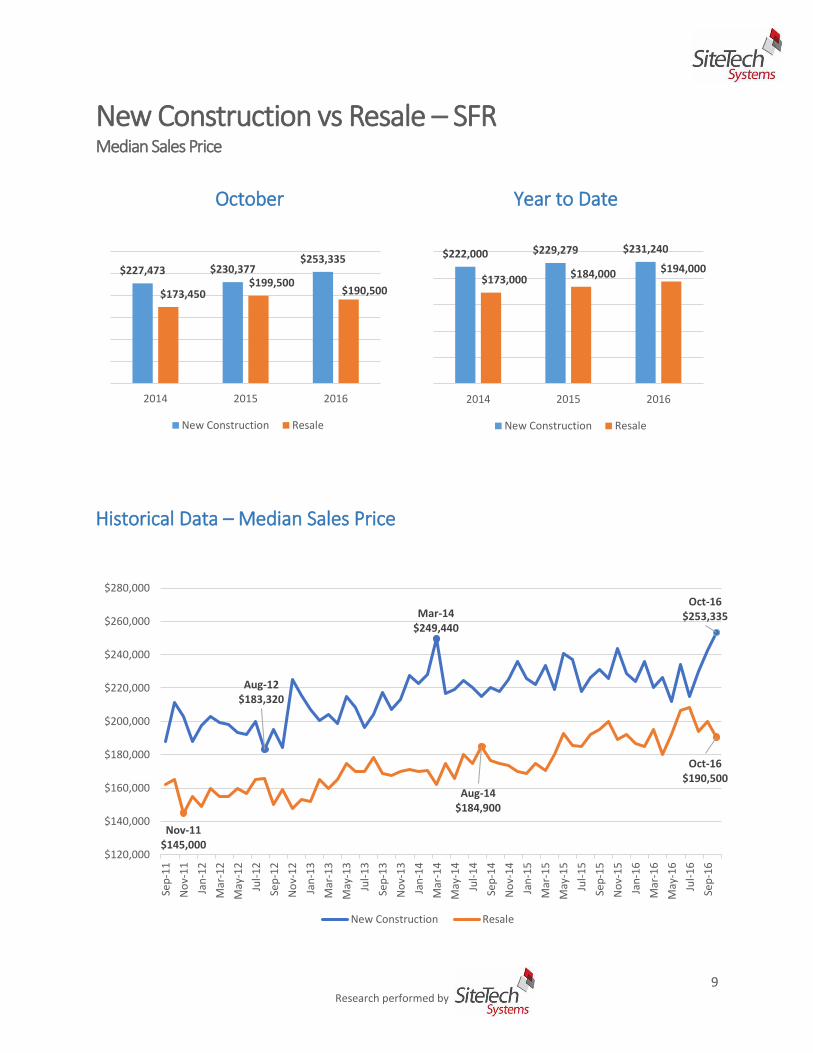
SFR sales volume dropped 25.2% in October. However, year-to-date SFR sales are up 2.0% compared to 2015. Median sales price increased to $211,000, up 0.3% for the month, and up 3.0% in 2016. When compared to October 2015, sales prices for new construction are up 10.0% while sales prices of resales are down 4.5%. The median sales price for new construction in October 2016 established a new record high at $253,335. Year-to-date, the median sales price for new construction and resales are up 0.9% and 5.4% respectively. The average sold-to-list ratio for Single Family Residential sales in October was 96%, up 100 basis points compared to the same month in 2015.
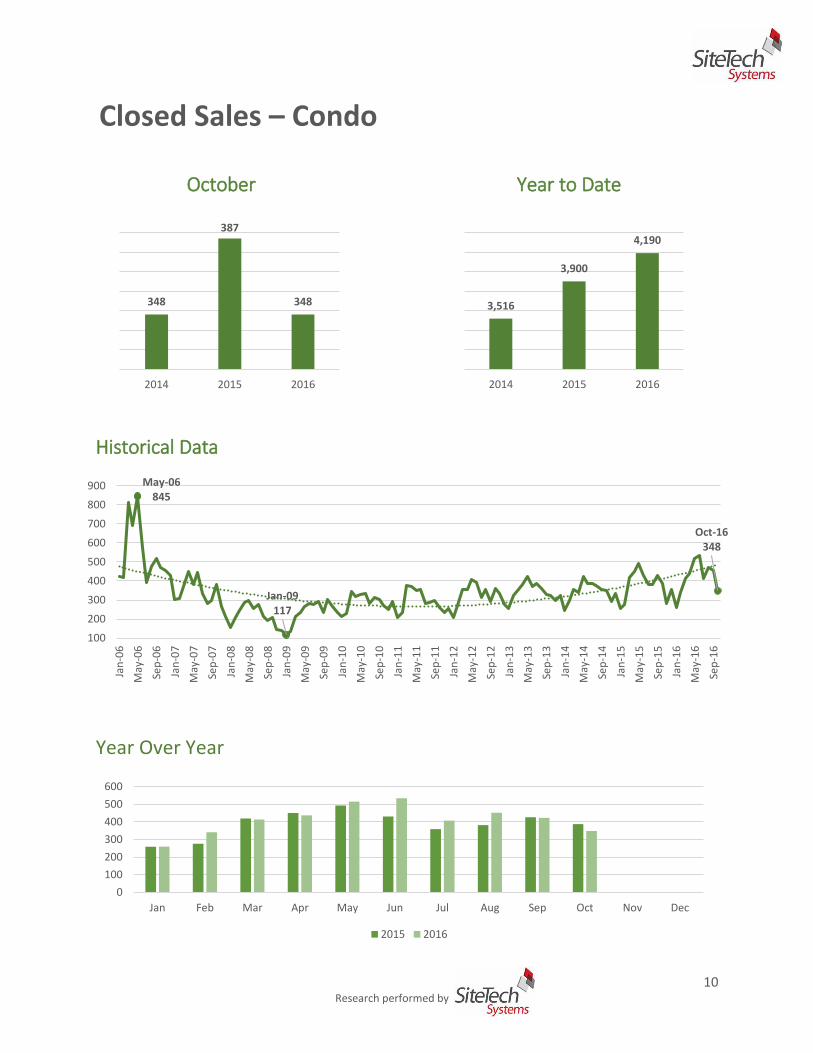
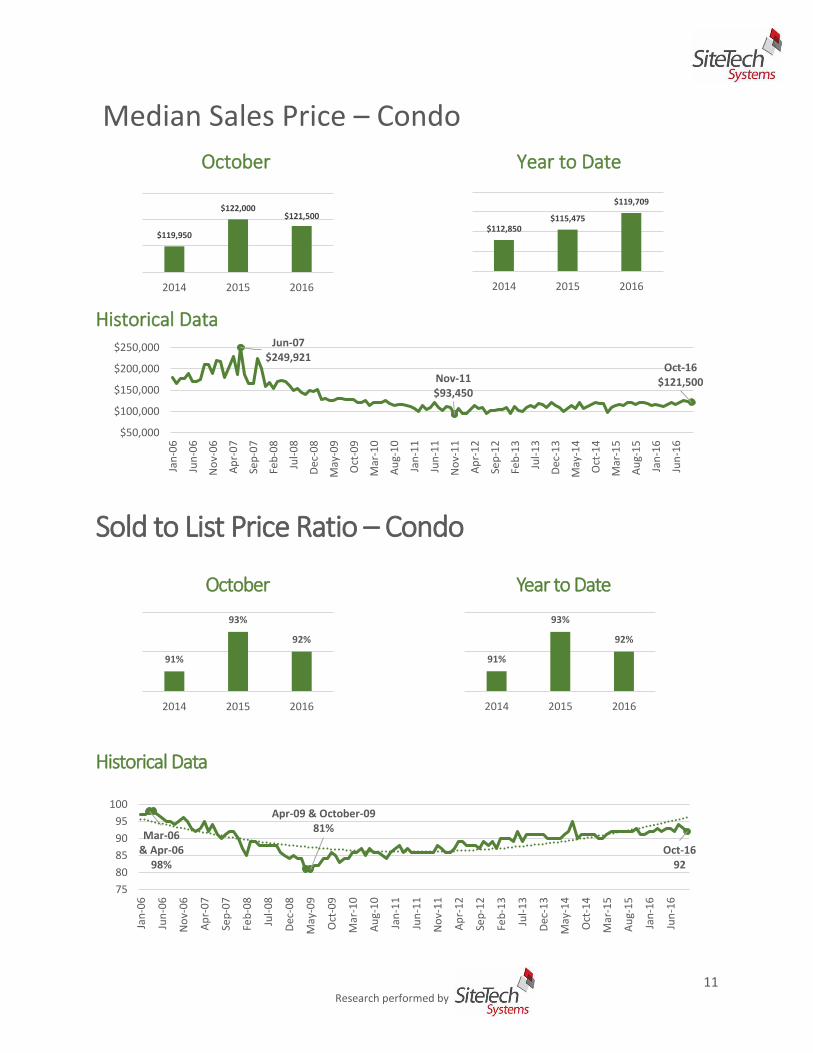
Condo sales decreased 10.1% compared to October 2015 but are up 7.4% year-to-date compared to 2015. Condo inventory remained stable compared to October 2015. Median sales price remained stable, only dropping 0.4% to $121,500 in October and maintained its growth at 3.7% for the year. The average sold to list ratio for condo sales in October was 92%, down 100 basis points compared to the same month in 2015.
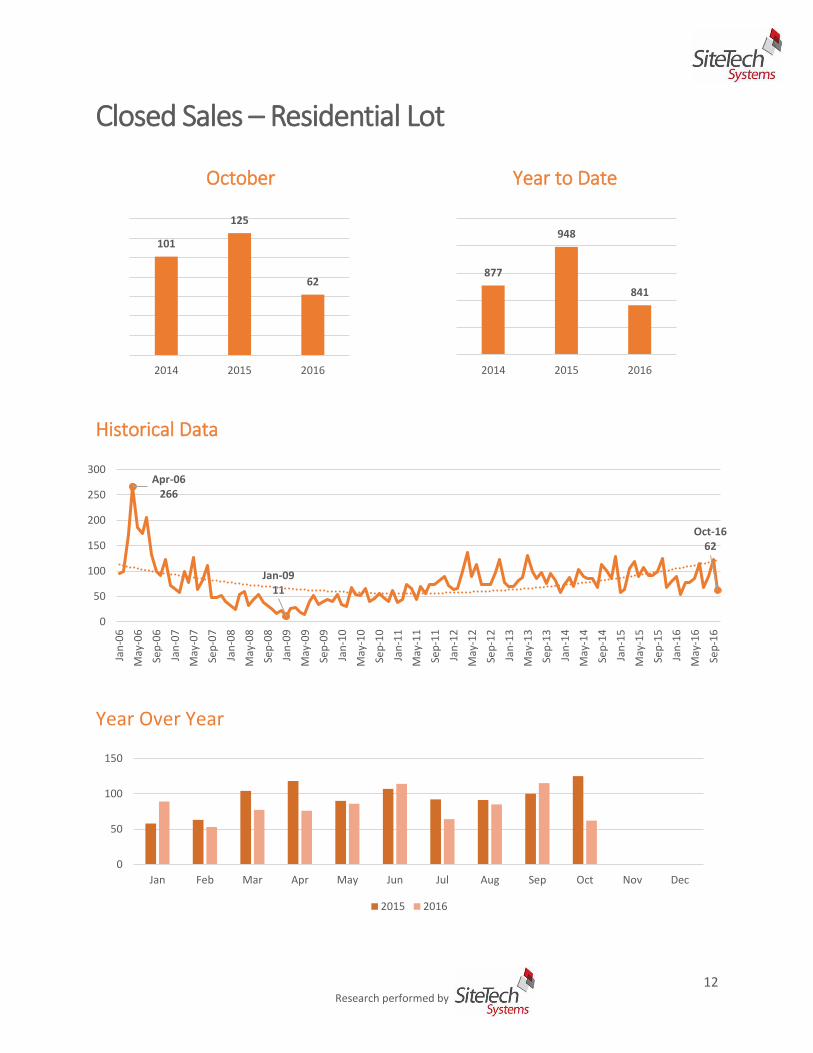
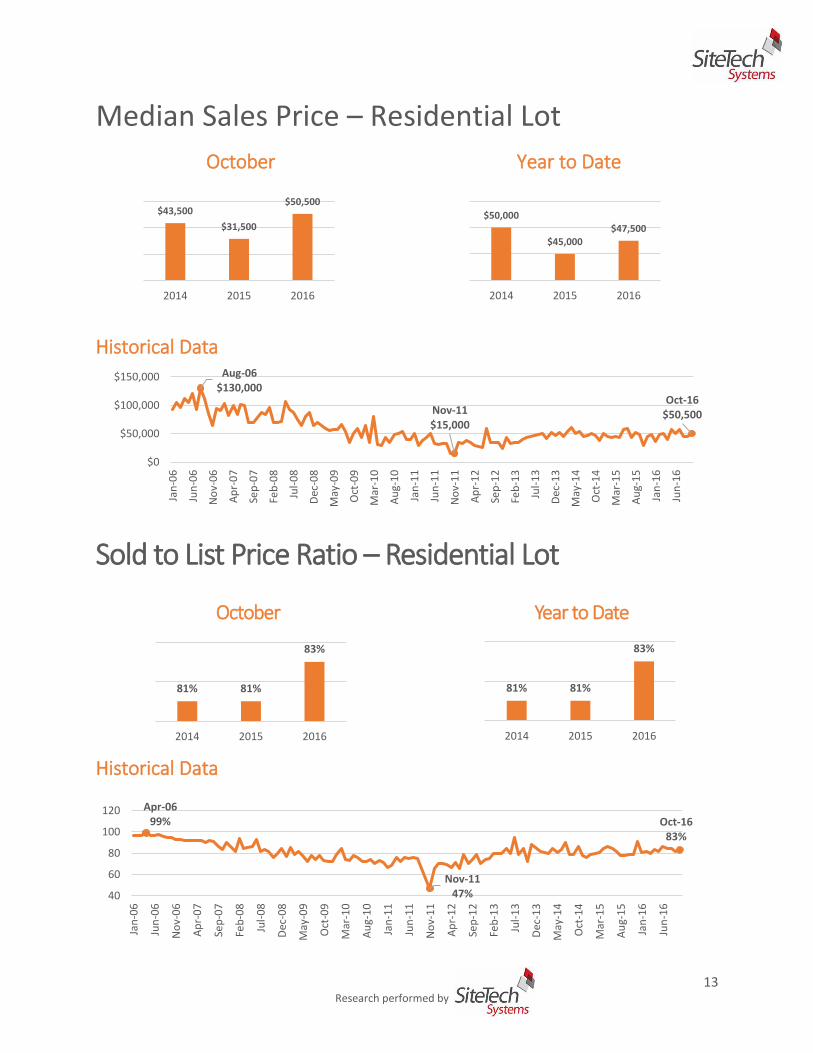
Residential lot sales were down 50.4% in October compared to 2015 and down 11.3% year-to-date. However, median sales price increased 60.3% for the month compared to 2015 with the year-to-date sales price also increasing by 5.6%. Sold to list ratios are up to 83%, up 200 basis points across the board.
At a glance…
SFR Condo Residential Lot
Sales Inventory Sales Inventory Sales Inventory Month YTD Month Month YTD Month Month YTD Month
-
Median Sales Price Median Sales Price Median Sales Price
$211,000 $121,500 $50,500
2 Research performed by
Contents
Active Inventory 3
Inventory Trends – SFR & Condo 4
Closed Sales – SFR 5
Median Sales Price – SFR 6
Sold to List Price Ratio – SFR 7
New Construction vs Resale – SFR
% of Total Sales 8
Median Sales Price 9
Closed Sales – Condo 10
Median Sales Price – Condo 11
Sold to List Price Ratio – Condo 11
Closed Sales – Residential Lot 12
Median Sales Price – Residential Lot 13
Sold to List Price Ratio – Residential Lot 13
Be sure to check out our website for daily updates and breaking news in the real estate and financial markets, also…
“Like” us on Facebook – www.facebook.com/SiteTechSystems
Follow us on Twitter – @SiteTechSystems
www.sitetechsystems.com
3 Research performed by
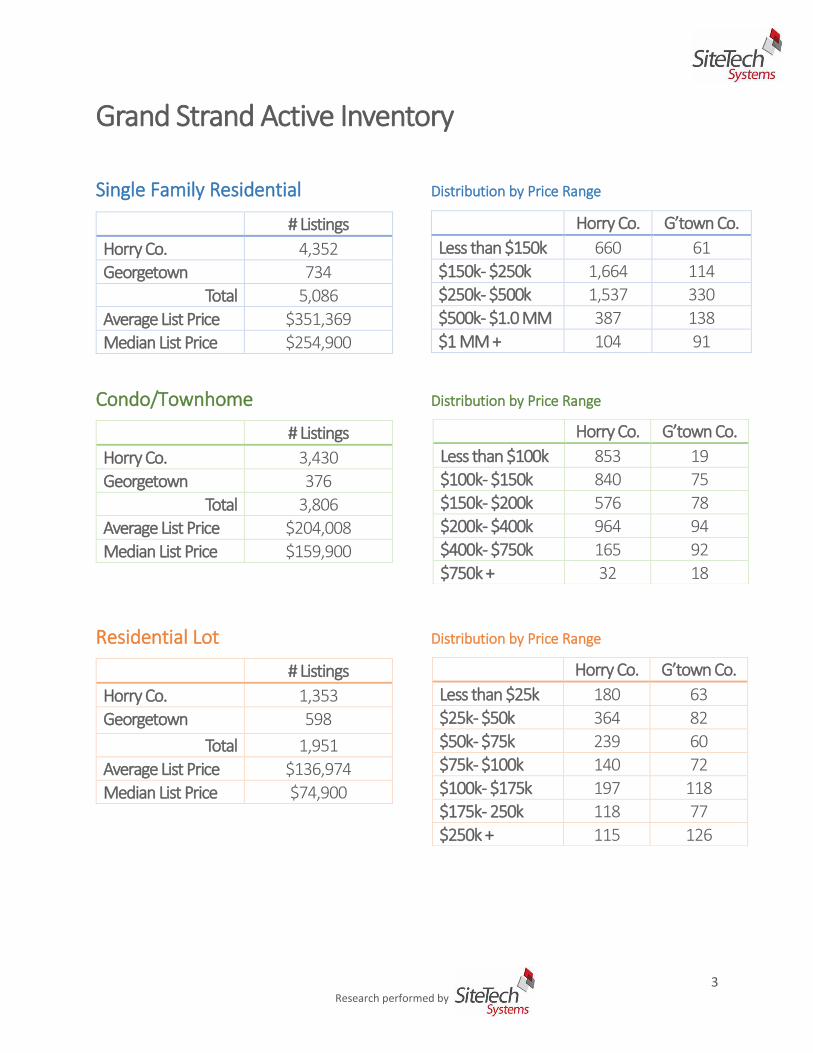
Grand Strand Active Inventory Single Family Residential Distribution by Price Range
Condo/Townhome Distribution by Price Range
Residential Lot Distribution by Price Range
Horry Co. G’town Co.
Less than $150k 660 61
$150k - $250k 1,664 114 $250k - $500k 1,537 330
$500k - $1.0 MM 387 138
$1 MM + 104 91
# Listings
Horry Co. 4,352 Georgetown 734
Total 5,086
Average List Price $351,369 Median List Price $254,900
Horry Co. G’town Co.
Less than $100k 853 19 $100k - $150k 840 75
$150k - $200k 576 78 $200k - $400k 964 94
$400k - $750k 165 92
$750k + 32 18
# Listings
Horry Co. 3,430
Georgetown 376
Total 3,806 Average List Price $204,008
Median List Price $159,900
Horry Co. G’town Co.
Less than $25k 180 63
$25k - $50k 364 82
$50k - $75k 239 60 $75k - $100k 140 72
$100k - $175k 197 118 $175k - 250k 118 77
$250k + 115 126
# Listings
Horry Co. 1,353
Georgetown 598
Total 1,951
Average List Price $136,974
Median List Price $74,900
4 Research performed by
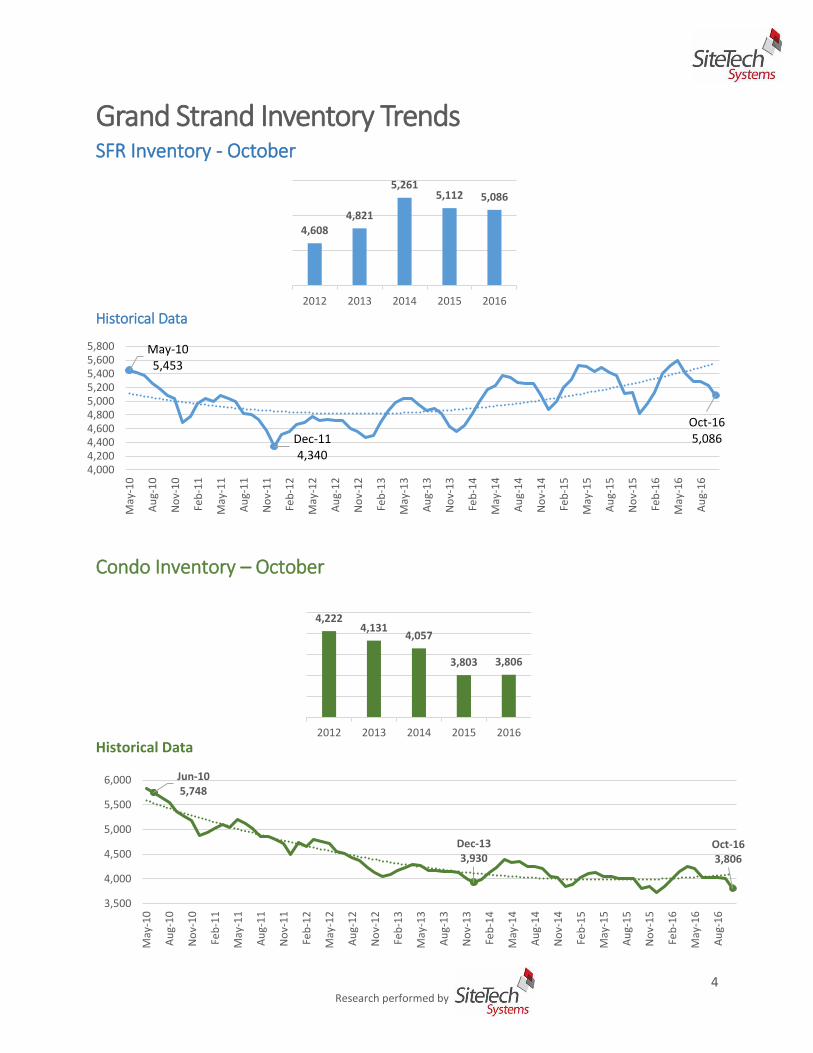
Grand Strand Inventory Trends SFR Inventory - October
Historical Data
Condo Inventory – October
Historical Data
May-105,453
Dec-114,340
Oct-165,086
4,0004,2004,4004,6004,8005,0005,2005,4005,6005,800
May
-10
Au
g-1
0
No
v-1
0
Feb
-11
May
-11
Au
g-1
1
No
v-1
1
Feb
-12
May
-12
Au
g-1
2
No
v-1
2
Feb
-13
May
-13
Au
g-1
3
No
v-1
3
Feb
-14
May
-14
Au
g-1
4
No
v-1
4
Feb
-15
May
-15
Au
g-1
5
No
v-1
5
Feb
-16
May
-16
Au
g-1
6
4,2224,131
4,057
3,803 3,806
2012 2013 2014 2015 2016
Jun-105,748
Dec-133,930
Oct-163,806
3,500
4,000
4,500
5,000
5,500
6,000
May
-10
Au
g-1
0
No
v-1
0
Feb
-11
May
-11
Au
g-1
1
No
v-1
1
Feb
-12
May
-12
Au
g-1
2
No
v-1
2
Feb
-13
May
-13
Au
g-1
3
No
v-1
3
Feb
-14
May
-14
Au
g-1
4
No
v-1
4
Feb
-15
May
-15
Au
g-1
5
No
v-1
5
Feb
-16
May
-16
Au
g-1
6
4,6084,821
5,2615,112 5,086
2012 2013 2014 2015 2016
5 Research performed by
Closed Sales – SFR October Year to Date
Historical Data
Year Over Year
541610
456
2014 2015 2016
4,913
5,896 6,012
2014 2015 2016
Jan-09149
Jun-15756
Oct-16456
100
200
300
400
500
600
700
800
900
Jan
-06
May
-06
Sep
-06
Jan
-07
May
-07
Sep
-07
Jan
-08
May
-08
Sep
-08
Jan
-09
May
-09
Sep
-09
Jan
-10
May
-10
Sep
-10
Jan
-11
May
-11
Sep
-11
Jan
-12
May
-12
Sep
-12
Jan
-13
May
-13
Sep
-13
Jan
-14
May
-14
Sep
-14
Jan
-15
May
-15
Sep
-15
Jan
-16
May
-16
Sep
-16
0
200
400
600
800
Jan Feb Mar Apr May Jun Jul Aug Sep Oct Nov Dec
2015 2016

6 Research performed by
Median Sales Price – SFR
October Year to Date
Historical Data
$190,000
$210,425 $211,000
2014 2015 2016
$190,000
$202,095
$208,062
2014 2015 2016
Jun-06$242,310
Sep-12$160,163
Oct-16$211,000
$150,000
$160,000
$170,000
$180,000
$190,000
$200,000
$210,000
$220,000
$230,000
$240,000
$250,000
Jan
-06
Jun
-06
No
v-0
6
Ap
r-0
7
Sep
-07
Feb
-08
Jul-
08
Dec
-08
May
-09
Oct
-09
Mar
-10
Au
g-1
0
Jan
-11
Jun
-11
No
v-1
1
Ap
r-1
2
Sep
-12
Feb
-13
Jul-
13
Dec
-13
May
-14
Oct
-14
Mar
-15
Au
g-1
5
Jan
-16
Jun
-16
7 Research performed by
Sold to List Price Ratio – SFR
October Year to Date
Historical Data
94%
95%
96%
2014 2015 2016
94%
95%
96%
2014 2015 2016
Jan-0698%
October-09 & Apr-1186%
Oct-1696%
80
82
84
86
88
90
92
94
96
98
100
Jan
-06
May
-06
Sep
-06
Jan
-07
May
-07
Sep
-07
Jan
-08
May
-08
Sep
-08
Jan
-09
May
-09
Sep
-09
Jan
-10
May
-10
Sep
-10
Jan
-11
May
-11
Sep
-11
Jan
-12
May
-12
Sep
-12
Jan
-13
May
-13
Sep
-13
Jan
-14
May
-14
Sep
-14
Jan
-15
May
-15
Sep
-15
Jan
-16
May
-16
Sep
-16
8 Research performed by
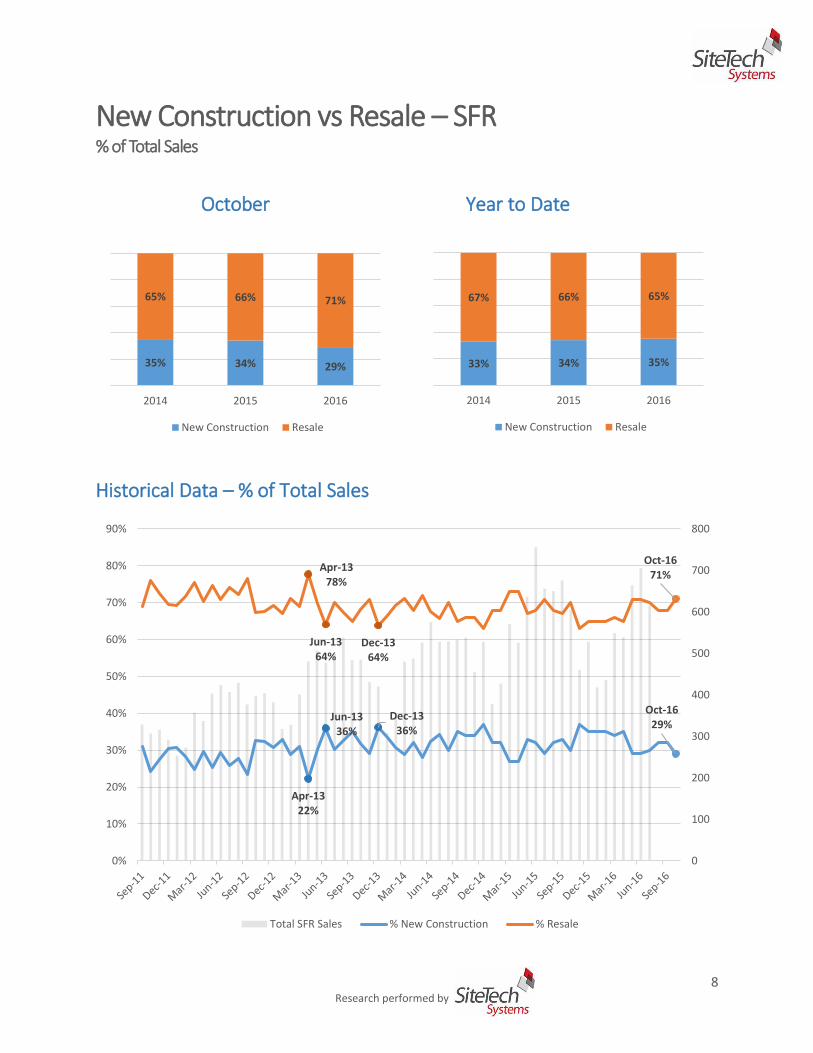
New Construction vs Resale – SFR % of Total Sales
October Year to Date
Historical Data – % of Total Sales
33% 34% 35%
67% 66% 65%
2014 2015 2016
New Construction Resale
35% 34% 29%
65% 66% 71%
2014 2015 2016
New Construction Resale
Apr-1322%
Jun-1336%
Dec-1336%
Oct-1629%
Apr-1378%
Jun-1364%
Dec-1364%
Oct-1671%
0
100
200
300
400
500
600
700
800
0%
10%
20%
30%
40%
50%
60%
70%
80%
90%
Total SFR Sales % New Construction % Resale
9 Research performed by
New Construction vs Resale – SFR Median Sales Price
October Year to Date
Historical Data – Median Sales Price
$222,000 $229,279 $231,240
$173,000 $184,000 $194,000
2014 2015 2016
New Construction Resale
$227,473 $230,377$253,335
$173,450$199,500
$190,500
2014 2015 2016
New Construction Resale
Aug-12$183,320
Mar-14$249,440
Oct-16$253,335
Nov-11$145,000
Aug-14$184,900
Oct-16$190,500
$120,000
$140,000
$160,000
$180,000
$200,000
$220,000
$240,000
$260,000
$280,000
Sep
-11
No
v-1
1
Jan
-12
Mar
-12
May
-12
Jul-
12
Sep
-12
No
v-1
2
Jan
-13
Mar
-13
May
-13
Jul-
13
Sep
-13
No
v-1
3
Jan
-14
Mar
-14
May
-14
Jul-
14
Sep
-14
No
v-1
4
Jan
-15
Mar
-15
May
-15
Jul-
15
Sep
-15
No
v-1
5
Jan
-16
Mar
-16
May
-16
Jul-
16
Sep
-16
New Construction Resale
10 Research performed by
Closed Sales – Condo
October Year to Date
Historical Data
Year Over Year
348
387
348
2014 2015 2016
3,516
3,900
4,190
2014 2015 2016
May-06845
Jan-09117
Oct-16348
100
200
300
400
500
600
700
800
900
Jan
-06
May
-06
Sep
-06
Jan
-07
May
-07
Sep
-07
Jan
-08
May
-08
Sep
-08
Jan
-09
May
-09
Sep
-09
Jan
-10
May
-10
Sep
-10
Jan
-11
May
-11
Sep
-11
Jan
-12
May
-12
Sep
-12
Jan
-13
May
-13
Sep
-13
Jan
-14
May
-14
Sep
-14
Jan
-15
May
-15
Sep
-15
Jan
-16
May
-16
Sep
-16
0
100
200
300
400
500
600
Jan Feb Mar Apr May Jun Jul Aug Sep Oct Nov Dec
2015 2016
11 Research performed by
Median Sales Price – Condo
October Year to Date
Historical Data
Sold to List Price Ratio – Condo October Year to Date
Historical Data
$119,950
$122,000 $121,500
2014 2015 2016
$112,850 $115,475
$119,709
2014 2015 2016
91%
93%
92%
2014 2015 2016
91%
93%
92%
2014 2015 2016
Mar-06& Apr-06
98%
Apr-09 & October-0981%
Oct-1692
75
80
85
90
95
100
Jan
-06
Jun
-06
No
v-0
6
Ap
r-0
7
Sep
-07
Feb
-08
Jul-
08
Dec
-08
May
-09
Oct
-09
Mar
-10
Au
g-1
0
Jan
-11
Jun
-11
No
v-1
1
Ap
r-1
2
Sep
-12
Feb
-13
Jul-
13
Dec
-13
May
-14
Oct
-14
Mar
-15
Au
g-1
5
Jan
-16
Jun
-16
Jun-07$249,921
Nov-11$93,450
Oct-16$121,500
$50,000
$100,000
$150,000
$200,000
$250,000
Jan
-06
Jun
-06
No
v-0
6
Ap
r-0
7
Sep
-07
Feb
-08
Jul-
08
Dec
-08
May
-09
Oct
-09
Mar
-10
Au
g-1
0
Jan
-11
Jun
-11
No
v-1
1
Ap
r-1
2
Sep
-12
Feb
-13
Jul-
13
Dec
-13
May
-14
Oct
-14
Mar
-15
Au
g-1
5
Jan
-16
Jun
-16
12 Research performed by
Closed Sales – Residential Lot
October Year to Date
Historical Data
Year Over Year
0
50
100
150
Jan Feb Mar Apr May Jun Jul Aug Sep Oct Nov Dec
2015 2016
101
125
62
2014 2015 2016
877
948
841
2014 2015 2016
Apr-06266
Jan-0911
Oct-1662
0
50
100
150
200
250
300
Jan
-06
May
-06
Sep
-06
Jan
-07
May
-07
Sep
-07
Jan
-08
May
-08
Sep
-08
Jan
-09
May
-09
Sep
-09
Jan
-10
May
-10
Sep
-10
Jan
-11
May
-11
Sep
-11
Jan
-12
May
-12
Sep
-12
Jan
-13
May
-13
Sep
-13
Jan
-14
May
-14
Sep
-14
Jan
-15
May
-15
Sep
-15
Jan
-16
May
-16
Sep
-16
13 Research performed by
Median Sales Price – Residential Lot
October Year to Date
Historical Data
Sold to List Price Ratio – Residential Lot
October Year to Date
Historical Data
$43,500
$31,500
$50,500
2014 2015 2016
$50,000
$45,000 $47,500
2014 2015 2016
Aug-06$130,000
Nov-11$15,000
Oct-16$50,500
$0
$50,000
$100,000
$150,000
Jan
-06
Jun
-06
No
v-0
6
Ap
r-0
7
Sep
-07
Feb
-08
Jul-
08
Dec
-08
May
-09
Oct
-09
Mar
-10
Au
g-1
0
Jan
-11
Jun
-11
No
v-1
1
Ap
r-1
2
Sep
-12
Feb
-13
Jul-
13
Dec
-13
May
-14
Oct
-14
Mar
-15
Au
g-1
5
Jan
-16
Jun
-16
81% 81%
83%
2014 2015 2016
81% 81%
83%
2014 2015 2016
Apr-0699%
Nov-1147%
Oct-1683%
40
60
80
100
120
Jan
-06
Jun
-06
No
v-0
6
Ap
r-0
7
Sep
-07
Feb
-08
Jul-
08
Dec
-08
May
-09
Oct
-09
Mar
-10
Au
g-1
0
Jan
-11
Jun
-11
No
v-1
1
Ap
r-1
2
Sep
-12
Feb
-13
Jul-
13
Dec
-13
May
-14
Oct
-14
Mar
-15
Au
g-1
5
Jan
-16
Jun
-16
Top Related