


Languages
Pages
Legal


Government- University-Industry Roundtable National Academy of Sciences
February 10, 2015
Smart Grids need Smart People
Department of Energy, Office of Electricity Delivery and Energy Reliability
Deputy Assistant Secretary Hank Kenchington

Office of Electricity Delivery and Energy Reliability
Smart Grid enables grid modernization with advanced communications and controls
Source: Florida Power and Light
Generic Smart Grid Communications Architectures
2
…provides seamless, secure communications across multiple interconnected domains and platforms

Office of Electricity Delivery and Energy Reliability
Recovery Act Grid Modernization Programs
3
Originally authorized by the Energy Infrastructure Security Act 2007, EISA 1306 and EISA 1304
One-Time Appropriation: $4.5 Billion Recovery Act Funds

Office of Electricity Delivery and Energy Reliability
SGIG projects accelerate industry investment to achieve a modern grid
ARRA Spending
EPRI Estimate
Brattle Group Estimate
$7.9 billion with cost share to be spent through 2015
$338 - $476 billion needed through 2030
$880 billion needed through
2030
Chupka, M.W. Earle, R., Fox-Penner, P., Hledik, R. Transforming America’s power industry: The investment challenge 2010 – 2030. Edison Electric Institute, Washington D.C.,: 2008.
EPRI. Estimating the costs and benefits of the smart grid: A preliminary estimate of the investment requirements and the resultant benefits of a fully functioning smart grid. EPRI, Palo Alto, CA; 2011.
Grid Modernization Investments
4

Office of Electricity Delivery and Energy Reliability
Key Technologies and Systems for Smarter Grids
5

Office of Electricity Delivery and Energy Reliability
Smart Grid Technologies Provide a Wide Range of Benefits
Benefits Smart Grid Technology Applications
Consumer-Based Demand
Management Programs (AMI-
Enabled)
Advanced Metering
Infrastructure (AMI) Applied to
Operations
Fault Location, Isolation and
Service Restoration
Equipment Health
Monitoring
Improved Volt/VAR
Management
Synchrophasor Technology
Applications
• Time-based pricing
• Customer devices (information and control systems)
• Direct load control (does not require AMI)
* *Shifting peak demand may or may not lower emissions
• Meter services • Outage management • Volt-VAR management • Tamper detection • Back-Office systems
support (e.g., billing and customer service)
• Automated feeder switching
• Fault location • AMI and outage
management
• Condition-based maintenance
• Stress reduction on equipment
• Peak demand reduction
• Conservation Voltage Reduction
• Reactive power compensation
• Real-time and off-line applications
Capital expenditure reduction – enhanced utilization of G,T & D assets
✔ ✔ ✔ ✔
Energy use reduction ✔ ✔ ✔ ✔ ✔
Reliability improvements ✔ ✔ ✔ ✔
O&M cost savings ✔ ✔ ✔
Reduced electricity costs to consumers
✔* ✔
Lower pollutant emissions ✔ ✔ ✔ ✔ ✔
Enhanced system flexibility – to meet resiliency needs and accommodate all generation and demand resources
✔ ✔ ✔ ✔ ✔ ✔
6

Office of Electricity Delivery and Energy Reliability
Total Funds Planned Installations Expected Benefit
Transmission
$537 million > 800 phasor measurement units
Real-time voltage and frequency fluctuations visible across the system
Distribution
$2.06 billion
>7,500 automated switches ~18,500 automated capacitors
Outage management, improved reliability, and VAR control
AMI
$4.50 billion
>15.5 million smart meters
Operational savings: fewer truck rolls, automated readings, reduced outage time
Customer Systems
$0.80 billion ~365,000 direct control devices ~240,000 PCTs ~8,000 in-home displays
Increased customer control; reduced peak demand
7

Office of Electricity Delivery and Energy Reliability
SGIG projects span the nation
8
99 Projects involving 228 Utilities and other Organizations

Office of Electricity Delivery and Energy Reliability
ARRA Cyber Security Website
www.ARRAsmartgridcyber.net
Cybersecurity Built-in to ARRA Smart Grid
• Cyber security requirements developed by interagency team (DOE, NIST, FERC, DHS, CIA)
• Each project required to develop Cybersecurity Plans (CSP) – approved/monitored by DOE & signed by Recipient Corporate Officer
– Held two Cybersecurity Information Exchange Workshops
– Progress monitored during annual site visits
• Risk assessment and mitigations required across engineering life cycle of project
9

Office of Electricity Delivery and Energy Reliability
SGIG Deployment Status - Sept 30, 2014
$4,318
$669
$2,050
$499
$4,506
$771
$2,086
$537 $0
$1,000
$2,000
$3,000
$4,000
$5,000
AMI Customer Systems Distribution Transmission
SGIG
Pro
ject
Exp
end
itu
res
($M
M)
Reported as of September 2014 Estimated at Completion
1,360 networked
PMUs, exceeding
800 expected at
completion
8,939 automated
switches, exceeding
7,500 expected at
completion, and
12,915 of 18,500
automated
capacitors expected
at completion
16.3 million smart
meters,
exceeding 15.5
million expected
at completion
677,000 direct load
control devices,
programmable
communicating
thermostats, and in-
home displays

Office of Electricity Delivery and Energy Reliability
Early Results Show Tangible Benefits
Transmission
Western Electricity Coordinating Council
18 transmission owners installing and connecting 393 PMUs and 57 PDCs and
synchrophasor data was used in forensic analysis of the September 2011 Southwest
outage
Distribution
Electric Power Board of Chattanooga
Advanced automated circuit smart switches and sensor equipment will enable 40%
reduction in customer outage minutes – worth $35 million/year to customers
AMI
Talquin Electric Cooperative
In 2011 and 2012, smart meters avoided 6,000 truck rolls for service connections and disconnections and 9,000 for non-
payments saving more than $640,000. In 2013, they avoided an additional 18,640
truck rolls for meter operations and saved an additional $1,016,510.
Customer Systems
Oklahoma Gas and Electric
Time-of-use and variable peak / critical peak pricing with in-home customer device
use enabled up to 30% peak demand reduction (which could offset a new
peaking plant) and lowered customer bills by up to $150
11

Office of Electricity Delivery and Energy Reliability
Equipment Health Monitoring With AMI - FPL Transformer Project
• FPL used smart meter data to identify transformer voltage shifts, indicating deteriorations in transformer performance and potential equipment failure.
• This approach allows for pro-active transformers replacement (shifting from schedule-based maintenance to condition-based maintenance).
• Through Q3 2014, FPL had replaced more than 1,000 distribution transformers, preventing potential unplanned outages for an estimated 10,000 customers.
Damage to primary winding of high-voltage transformer identified through smart meters
• Average outage time is 93 minutes shorter than an unplanned transformer replacement
• Costs are 25% lower than unplanned replacements
• Can improve customer perceptions • Reduces potential for customer claims
Benefits of Proactive High-voltage Transformer Replacement
Sources: http://www.ieee-pes.org/presentations/gm2014/FPL-IEEE-Presentation-Big-Data-July-2014.pdf https://www.smartgrid.gov/sites/default/files/doc/files/B2-Master-File-with-edits_120114.pdf
Voltage shift indicating possible equipment degradation

Office of Electricity Delivery and Energy Reliability
Consumer Behavior Studies
13
CEIC DECO GMP
Lake
land MMLD
MN
Power
Nevada
Power
Sierra
Pacific
Power OG&E SMUD VEC Total
Rate Treatments
CPP 8
TOU 7
VPP 2
CPR 2
Non-Rate Treatments
IHD 5
PCT 5
Education 2
Web 1
Recruitment Method
Opt In 11
Opt Out 3

Office of Electricity Delivery and Energy Reliability
Peak Demand Reduction from AMI, Pricing, and Customer Systems
Selected examples from SGIG projects reporting initial results
Project Elements OG&E 770,000 customers
MMLD 11,000 customers
SVE 18,000 customers
Customers Tested 6,000 residential 500 residential 600 mostly residential
Time-Based Rate (s) TOU and VPP, w/CPP CPP CPP
Customer Systems IHDs, PCTs, and Web
Portals Web Portals Web Portals
Peak Demand Reduction
Up to 30% 1.3 kW/customer
(1.8kW/customer w/CPP)
37% 0.74 kW/customer
Up to 25% 0.85 kW/customer
Outcome Deferral of 170 MW of peak capacity by 2016 with 20% participation
Lowers total purchase of peak electricity
Lowers total purchase of peak electricity
Customer Acceptance
Positive experience, many reduced electricity bills
Positive Experience, but did not use the web
portals often
Interested in continued participation, many
reduced electricity bills
14

Office of Electricity Delivery and Energy Reliability
• Reduced the number of customers interrupted for partial-feeder outages (by about 55%) and full-feeder interruptions (by about 37%).
• Reduced the number of customer minutes of interruption for partial-feeder outages (by about 50%) and full-feeder outages (by about 51%).
15
FLISR - Fault Location Isolation and System Restoration Technologies Show Fewer and Shorter Outages
Data from CenterPoint Energy, Duke Energy, NSTAR Electric Company, Pepco Holdings, Inc., Southern Company, Alabama Power, Georgia Power, Gulf Power, and Mississippi Power

Office of Electricity Delivery and Energy Reliability
Intelligent Switches and Advanced Communications Improve Reliability
Index* Description Weighted Average (Range)
SAIFI System Average Interruption Frequency Index (outages) -22 % (-11% to -49%)
MAIFI Momentary Average Interruption Frequency Index (interruptions)
-22 % (-13% to -35%)
SAIDI System Average Interruption Duration Index (minutes) -18 % (+4% to -56%)
CAIDI Customer Average Interruption Duration Index (minutes)
+8 % (+29% to -15%)
Selected examples from SGIG projects reporting initial results
4 Projects involving 1,250 feeders April 1, 2011 through March 31, 2012
Weighted average based on numbers of feeders
*Voluntary indices to measure reliability
16

Office of Electricity Delivery and Energy Reliability
Smart Grid Technologies Enhance Resilience
Electric Power Board (EPB) of Chattanooga • power outages were costing community $100 million/yr • Installed automated fault isolation and service restoration
technology (FLISR) (more than 1200 automated feeder switches)
2011 Labor Day Storm (20% technology configured):
• 63,000 homes interrupted; however, 16,000 (25%) experienced no outage and 9,000 (7%) experienced a 2-second interruption
• Utility avoided 1,917,000 customer minutes of interruption
July 2012 wind storm:
• EPB estimates that due to automated feeder switching with AMI they were able to avoid 500 truck rolls and reduce total restoration time by 1.5 days
• Represents $1.4 million in operational savings
February 2014 snow storm:
• Avoided sustained outage for 37,000 customers • Restored power about 36 hours earlier, 16 hours due to self healing smart switches and 20
hours due to smart meter’s ability to verify outage status and redirect crews efficiently. • Saved $1.4 million in overtime costs for field crews.
17

Office of Electricity Delivery and Energy Reliability
EPB July 5, 2012 Storm Response
0
10000
20000
30000
40000
50000
60000
70000
80000
90000
1 5 9
13
17
21
25
29
33
37
41
45
49
53
57
61
65
69
73
77
81
85
89
93
97
10
1
10
5
10
9Actual Response
Projected Response withoutSmart Grid
17 hours
Time (hours)
Nu
mb
er o
f cu
sto
mer
s ex
per
ien
cin
g su
stai
ned
ou
tage
s
Avoided costs to customers
Eliminated 500 Truck Rolls
Restoration Complete 1 ½ Days Earlier
$1.4 Million Cost Reduction
18

Office of Electricity Delivery and Energy Reliability
Electric Transmission System PMU Deployment Progress by Project
Progress of SGIG PMU Deployments by the Synchrophasor Projects (based on recipient reporting data as of September 2014) – 1360 PMUs
7
8
31
41
45
49
49
73
103
260
301
393
0 100 200 300 400
Midwest Energy
Idaho Power Company
Lafayette
New York Independent System Operator
Florida Power & Light
Entergy Services
American Transmission Co.
ISO New England
Duke Energy Carolinas
Midwest Ind. Transmission Sys. Operator
PJM Interconnection
Western Electricity Coordinating Council
Number of PMUs Deployed

Office of Electricity Delivery and Energy Reliability
ARRA Smart Grid investments create nationwide sensor network to better detect grid disturbances
20
As of October 2013, almost 1,700 PMUs are in service. Most are networked, and most were funded by Smart Grid Investment Grant funds
and matching private sector funds.
April 2007 October 2013

Office of Electricity Delivery and Energy Reliability
Oscillation Detection with PMUs
21
Examples: • WECC – Oscillation at wind plant discovered • ISO-NE – Identified oscillation mode at 0.12 Hz, which reached 100MW peak-to-peak • Idaho Power Company – Identified oscillation modes at 0.2, 0.6, 1.4 and 1.6 Hz • Duke Energy Carolinas detected oscillation of hydropower unit
PMU Data
Comparison between voltage signal from the event as captured by SCADA vs. PMU data for WECC wind farm oscillations
End of oscillations
SCADA Data
Oscillatory behavior (invisible to SCADA) is indicative of improperly set controls, inadequately modeled generation or load, or malfunctioning equipment (or
other issues) that can lead to catastrophic system failure

Office of Electricity Delivery and Energy Reliability
ARRA awards $100 Million for Smart Grid Workforce Training and Development
“The percentage of the lineworker workforce expected to retire within the next five to ten years could approach 50% in some organizations “ “Report to Congress: Workforce Trends in the Electric Utility Industry” DOE, 2006
Three Subject Areas: 31 Community College and
University Projects Awarded Grants Program Area #Awards Total Value
Developing and Enhancing
Workforce Training Programs
21 $13,756,289
Strategic Training and
Education in Power Systems
11 $27,346,317
Smart Grid Workforce Training
Projects
17 $52,552,741
Totals 49 $93,655,347

Office of Electricity Delivery and Energy Reliability
• Power Systems Engineering Research Center (PSERC) – University collaboration to address challenges facing the electric power industry – ASU, Carnegie Mellon, CO School of Mines, Cornell, Georgia Tech, Howard, Iowa
State, Texas A&M, Wash State, Wichita State, UC Berkeley, Univ IL Urb.‐Cham, Univ WI‐Madison
• Synchrophasor Engineering Education Program – Academic-Industry Collaboration to augment engineering education in process
simulation, dynamics, control, and safety – Washington State, NC State, IIT, Univ WY, VA Tech, Texas Tech, Clemson
• Trustworthy Cyber Infrastructure for the Power Grid (TCIPG) – Architecture for End-to-End Resilient, Trustworthy & Real-time Power Grid Cyber
Infrastructure – Cornell, University of Illinois, UC Davis, Dartmouth College, Washington State
• Center for Ultra-Wide-Area Resilient Electric Energy Transmission Networks (CURENT) – ERC collaboration with academia, industry, and national laboratories – transmission grid that is fully monitored and dynamically controlled in real-time for
high efficiency, high reliability, low cost, better accommodate renewables, storage and responsive load.
– Univ of Tennessee, Northeastern, RPI, Tuskegee
Universities play a critical role in grid modernization

Office of Electricity Delivery and Energy Reliability
• A broad solicitation for University research in Power Systems Engineering is anticipated later this year (PSERC)
• Potential for additional R&D and collaborations with universities focusing on cybersecurity issues for energy delivery in the coming year
• Continued funding of CURENT research
• OE’s Advanced Modeling Grid Research FY16 Budget includes $4.4M for expansion of university research in mathematics for power systems, and a competitive solicitation focused on maturing basic research into industry applications to improve operational reliability and security
2015 Opportunities
Office of Electricity Delivery and Energy Reliability
For more information
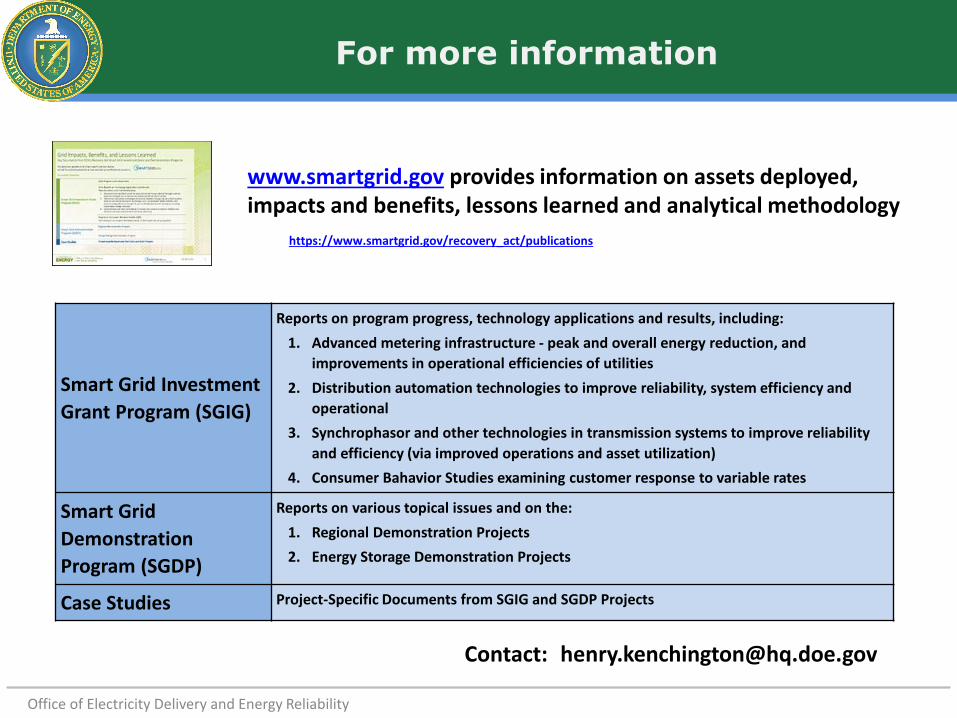
www.smartgrid.gov provides information on assets deployed, impacts and benefits, lessons learned and analytical methodology
Smart Grid Investment
Grant Program (SGIG)
Reports on program progress, technology applications and results, including:
1. Advanced metering infrastructure - peak and overall energy reduction, and
improvements in operational efficiencies of utilities
2. Distribution automation technologies to improve reliability, system efficiency and
operational
3. Synchrophasor and other technologies in transmission systems to improve reliability
and efficiency (via improved operations and asset utilization)
4. Consumer Bahavior Studies examining customer response to variable rates
Smart Grid
Demonstration
Program (SGDP)
Reports on various topical issues and on the:
1. Regional Demonstration Projects
2. Energy Storage Demonstration Projects
Case Studies Project-Specific Documents from SGIG and SGDP Projects
https://www.smartgrid.gov/recovery_act/publications
Contact: [email protected]