


![Government of Telangana Prospectus_16june.pdf · [Type text] Page 1 Government of Telangana Department of Employment and Training Helpline: 79979 73364](https://static.fdocuments.us/doc/165x107/5adb80b77f8b9a4a268b6379/government-of-telangana-prospectus16junepdftype-text-page-1-government-of-telangana.jpg)
Languages
Pages
Legal

Government of Telangana
Horticulture & Sericulture Department
Brief Note on Horticulture & Sericulture
INDEX
Sl. no
Subject Page No.
1 Introduction 1 - 5
2 Micro irrigation 6 - 9
3 Establishment of green houses/ Polyhouses 9 - 11
4 Centers of Excellence 11 - 15
5 Crop colonies 15 - 16
6 Promoting food processing sector 16 - 18
7 Permanent pandals (RKVY): 18 - 19
8 Mission for integrated development of horticulture
19 - 23
9 Oil palm under NFSM 23 - 24
10 Sub-mission on agro-forestry (SMAF) under national mission for sustainable agriculture (NMSA)
24
11 National Bamboo Mission (NBM) 25
12 Horticulture Farms 25 - 26
13 Horticulture Training Institutes 27
14 Government Gardens 27 - 29
15 Introduction of New crops 29 - 31
16 Cadre strength (Horti. & Seri. Department) 31 - 32
17 Departmental Budget during 2018-19 32
18 Awareness programmes 33
19 Sericulture Department 34 - 40
20 Annexures

1
NOTE ON HORTICULTURE & SERICULTURE ACTIVITIES I. INTRODUCTION:
Telangana the newly formed landlocked state is endowed with bountiful
resources, fertile soils and diversified cropping patterns. Agriculture is a
way of life, a tradition that has shaped the culture and economic life of
the people of Telangana.
Higher growth in Agriculture assumes greater importance to achieve
sustained economic growth and overall well being of state's population.
Recognizing the importance of Agriculture, the Government has
emphasized the need to achieve higher growth rate and increased
returns on investment to the farmers.
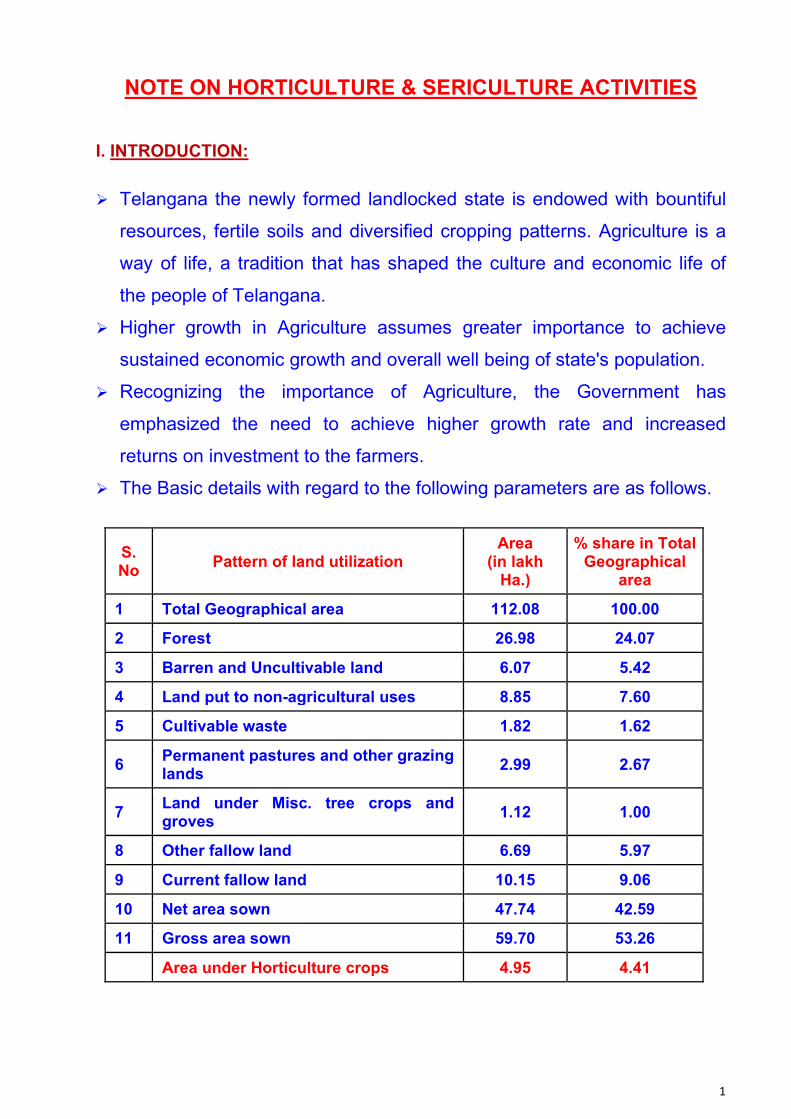
The Basic details with regard to the following parameters are as follows.
S. No
Pattern of land utilization Area
(in lakh Ha.)
% share in Total Geographical
area
1 Total Geographical area 112.08 100.00
2 Forest 26.98 24.07
3 Barren and Uncultivable land 6.07 5.42
4 Land put to non-agricultural uses 8.85 7.60
5 Cultivable waste 1.82 1.62
6 Permanent pastures and other grazing lands
2.99 2.67
7 Land under Misc. tree crops and groves
1.12 1.00
8 Other fallow land 6.69 5.97
9 Current fallow land 10.15 9.06
10 Net area sown 47.74 42.59
11 Gross area sown 59.70 53.26
Area under Horticulture crops 4.95 4.41
2
About Horticulture
The Horticulture sector encompasses a wide range of crops namely fruit
crops, vegetables crops, flower crops, spices and plantation crops.
While the first few Five Year Plans assigned priority to achieving self-
sufficiency in food grain production, over the years, horticulture has
emerged as an indispensable part of agriculture, offering a wide range of
choices to the farmers for crop diversification.
Horticulture & Plantation Sector has received focused attention in our
national planning process from 7th five year plan period onwards; as a
result, there has not only been sustained increase in production of
horticulture & plantation crops but hi‐tech horticulture has also been
recognized as a commercial proposition.
After self-sufficiency in food grain production, there has been an
increasing awareness in India for need to achieve food, nutrition to
counter malnutrition to the most vulnerable section of the society i.e.,
women and children and environment security for the people along with
income security for the farmers.
With increase in emphasis on Horticulture Development, there had been
a felt need to have a separate horticulture division at Centre i.e., ICAR,
Govt of India to perform planning and monitoring & control functions for
horticulture development programme. Horticulture Division was finally
carved out from Crop Division of DAC at the Centre in the year 1981.
In Himachal Pradesh Dr YS Parmar University of Horticulture and
Forestry Nauni, Solan (HP) was established on 1st December, 1985, is
fully determined to undertake quality teaching, research and extension
for socio-economic development of farming community.
Karnataka is the first state in the entire country to have a separate
Horticulture Department, and many other states, at later years, followed
the example of Karnataka. Because of this, the state could achieve
remarkable progress in many fronts of Horticulture, whether Fruits or
Vegetables or Flowers or Plantation crops.
3
The Department of Horticulture in erstwhile Andhra Pradesh has also
been bifurcated from Agriculture Department in the year 1982 duly
recognizing the importance and potentiality for horticulture in the state.
Horticulture sector has been identified as one of the focus sector for
development of Telangana State.
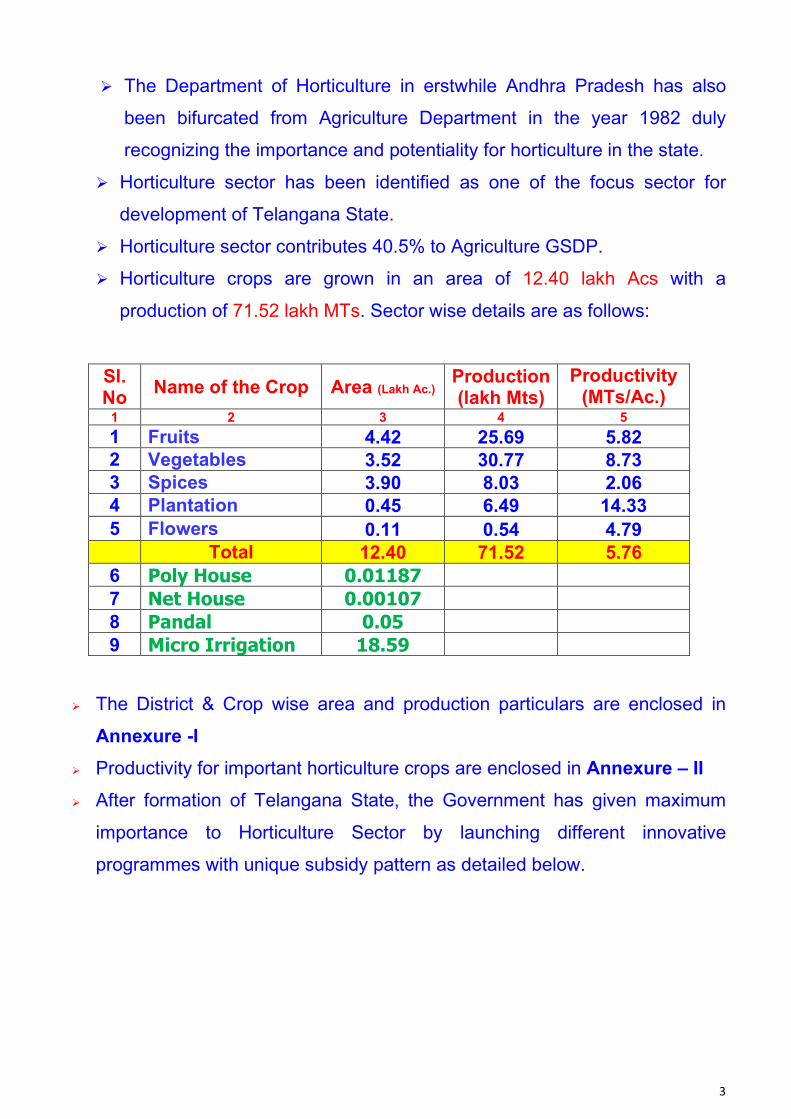
Horticulture sector contributes 40.5% to Agriculture GSDP.
Horticulture crops are grown in an area of 12.40 lakh Acs with a
production of 71.52 lakh MTs. Sector wise details are as follows:
Sl. No
Name of the Crop Area (Lakh Ac.) Production (lakh Mts)
Productivity (MTs/Ac.)
1 2 3 4 5
1 Fruits 4.42 25.69 5.82
2 Vegetables 3.52 30.77 8.73
3 Spices 3.90 8.03 2.06
4 Plantation 0.45 6.49 14.33
5 Flowers 0.11 0.54 4.79
Total 12.40 71.52 5.76
6 Poly House 0.01187
7 Net House 0.00107
8 Pandal 0.05
9 Micro Irrigation 18.59
The District & Crop wise area and production particulars are enclosed in
Annexure -I
Productivity for important horticulture crops are enclosed in Annexure – II
After formation of Telangana State, the Government has given maximum
importance to Horticulture Sector by launching different innovative
programmes with unique subsidy pattern as detailed below.
4
II. Major Schemes Implemented by the Department:
A. Horticulture
Centrally Assisted:
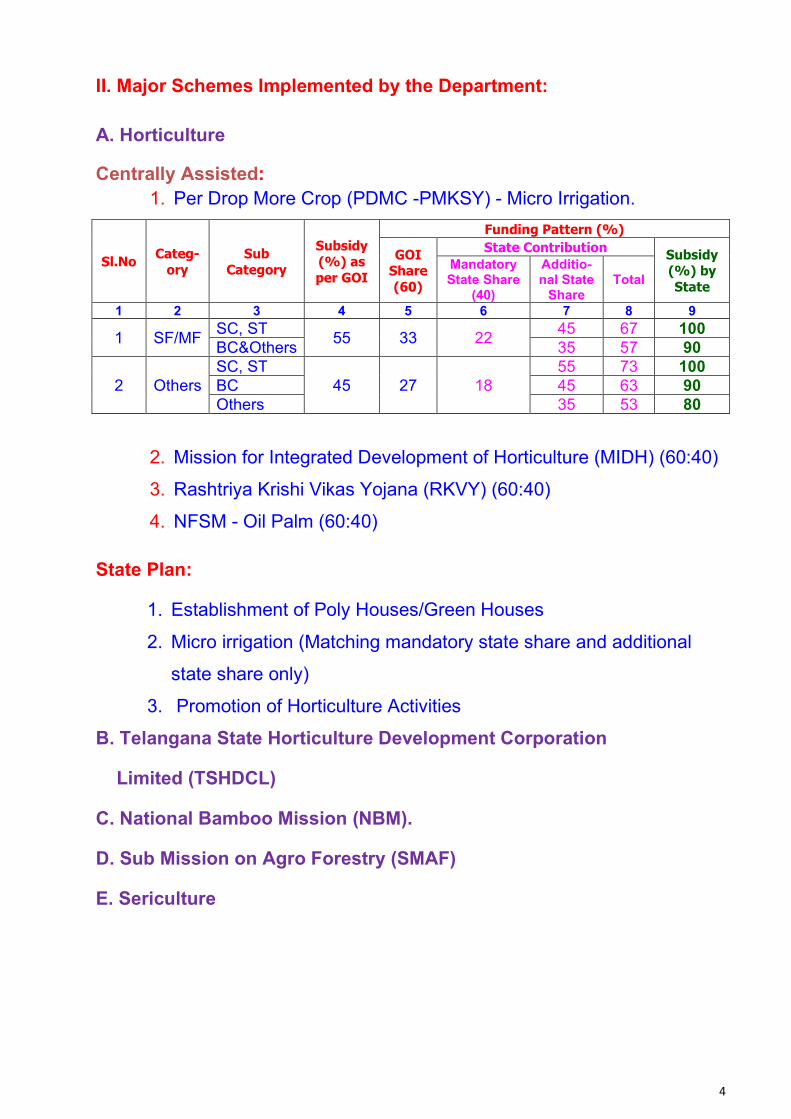
1. Per Drop More Crop (PDMC -PMKSY) - Micro Irrigation.
Sl.No Categ-
ory
Sub
Category
Subsidy (%) as
per GOI
Funding Pattern (%)
GOI Share
(60)
State Contribution Subsidy (%) by
State
Mandatory State Share
(40)
Additio-nal State
Share Total
1 2 3 4 5 6 7 8 9
1 SF/MF SC, ST
55 33 22 45 67 100
BC&Others 35 57 90
2 Others
SC, ST
45 27 18
55 73 100
BC 45 63 90
Others 35 53 80
2. Mission for Integrated Development of Horticulture (MIDH) (60:40)
3. Rashtriya Krishi Vikas Yojana (RKVY) (60:40)
4. NFSM - Oil Palm (60:40)
State Plan:
1. Establishment of Poly Houses/Green Houses
2. Micro irrigation (Matching mandatory state share and additional
state share only)
3. Promotion of Horticulture Activities
B. Telangana State Horticulture Development Corporation
Limited (TSHDCL)
C. National Bamboo Mission (NBM).
D. Sub Mission on Agro Forestry (SMAF)
E. Sericulture
5
III. Major Thrust Areas:
Bringing additional area under Horticulture through introduction of new
crops and high yielding varieties/ hybrid suitable for Telangana
climate.
Saturation of total area available under bore wells / open wells with
Micro Irrigation.
Encourage Protected cultivation (shade net houses / poly houses) to
overcome seasonal barriers and make Vegetables and Flowers
available round the year.
Establishment of Centers of Excellences (COEs) for Vegetables,
Flowers & Fruits to impart training to the Poly House farmers and
Production of high quality and disease free seedlings of vegetables
and plant material of various fruit crops.
For this purpose one Centre of Excellence for Vegetables and flowers
established at Jeedimetla (V), Medchal (D) and for Fruits at Mulugu
(V), Siddipet (D).
Encouraging Pandal cultivation of creeper vegetables like Gourds.
Promotion of Crop Colony concept particularly Vegetables among the
farmers by converging various Departmental programmes in it.
Encouraging value addition and processing sector to provide better
returns to the farmers.
Promotion of Agro Forestry species like Sandal wood, Bamboo,
Casuarina etc., as alternate sources of income to the farmers.
Encouraging Sericulture to realise the full potential of the previously
unrecognised sector in the state.
6
IV. FLAGSHIP PROGRAMMES OF THE GOVERNMENT
IMPLEMENTED BY THE HORTICULTURE DEPARTMENT:
A. MICRO IRRIGATION:
Effective utilization of every drop of water through micro irrigation is
imperative for improving crop productivity, production and to achieve
sustainable improvement in living standards of small and marginal
farmers of State by improving the water use efficiency through micro
irrigation and farmers can get assured additional income.
In Telangana, out of an area of 43.15 lakhs acres irrigated with 13.73
lakhs nos Bore wells and Open wells, an area of 18.60 lakh acres are
only covered under micro irrigation upto 2019-20, leaving a balance
potential area of 24.55 lakh acres for micro irrigation.
Highlights of the Micro Irrigation Project in Telangana State
Subsidy is extended up to 5 ha to all category of farmers with 100%
subsidy to SCs, STs, 90% subsidy to BCs, SF/MF farmers and 80%
subsidy to Other Caste farmers (2-5ha)
Portable sprinklers for all category farmers are eligible for 75% subsidy
limited to 1ha unit only.
At least 25% of the financial target allocated to the State must be
earmarked to Agriculture crop sector in drip including Sugar cane,
Sericulture etc.
Providing of 10 years after sales service to all Beneficiary farmers
instead of 5 years earlier.
Providing of crop wise agronomical manual printed in Telugu to all
farmers.
The Maximum subsidy given to the farmers in Telangana State is
12.50 acres i.e., in terms of Rs.5,61,185/- which is highest in the
country. No other state is giving this much subsidy to farmers.
7
Penalties for Violation of the Guidelines for Micro Irrigation Programme
is being strictly followed in Telangana State.
28 Nos of MI companies were empanelled in Telangana State Micro
Irrigation Project (TSMIP). Selection of MI Company is as per Farmer
Choice.
5% Tax incentive up to a maximum of Rs.5000/- per beneficiary
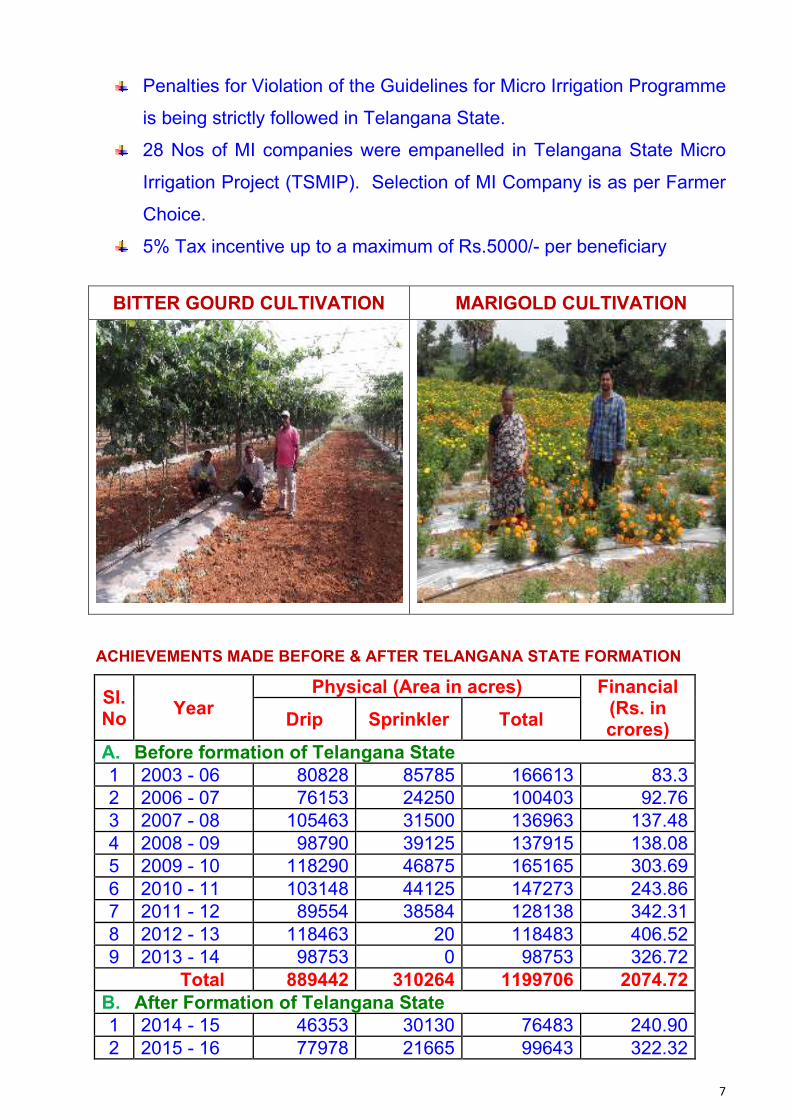
BITTER GOURD CULTIVATION MARIGOLD CULTIVATION
ACHIEVEMENTS MADE BEFORE & AFTER TELANGANA STATE FORMATION
Sl. No
Year Physical (Area in acres) Financial
(Rs. in crores)
Drip Sprinkler Total
A. Before formation of Telangana State
1 2003 - 06 80828 85785 166613 83.3
2 2006 - 07 76153 24250 100403 92.76
3 2007 - 08 105463 31500 136963 137.48
4 2008 - 09 98790 39125 137915 138.08
5 2009 - 10 118290 46875 165165 303.69
6 2010 - 11 103148 44125 147273 243.86
7 2011 - 12 89554 38584 128138 342.31
8 2012 - 13 118463 20 118483 406.52
9 2013 - 14 98753 0 98753 326.72
Total 889442 310264 1199706 2074.72
B. After Formation of Telangana State
1 2014 - 15 46353 30130 76483 240.90
2 2015 - 16 77978 21665 99643 322.32
8
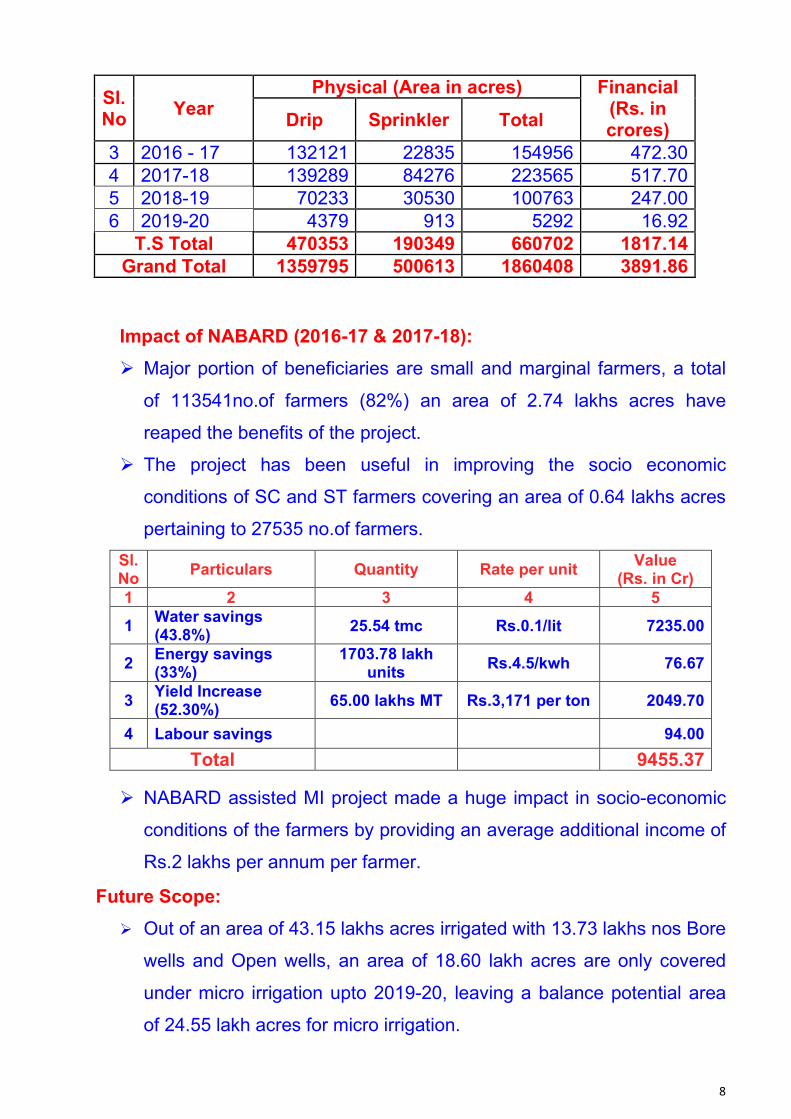
Sl. No
Year Physical (Area in acres) Financial
(Rs. in crores)
Drip Sprinkler Total
3 2016 - 17 132121 22835 154956 472.30
4 2017-18 139289 84276 223565 517.70
5 2018-19 70233 30530 100763 247.00
6 2019-20 4379 913 5292 16.92
T.S Total 470353 190349 660702 1817.14
Grand Total 1359795 500613 1860408 3891.86
Impact of NABARD (2016-17 & 2017-18):
Major portion of beneficiaries are small and marginal farmers, a total
of 113541no.of farmers (82%) an area of 2.74 lakhs acres have
reaped the benefits of the project.
The project has been useful in improving the socio economic
conditions of SC and ST farmers covering an area of 0.64 lakhs acres
pertaining to 27535 no.of farmers.
Sl. No
Particulars Quantity Rate per unit Value
(Rs. in Cr)
1 2 3 4 5
1 Water savings (43.8%)
25.54 tmc Rs.0.1/lit 7235.00
2 Energy savings (33%)
1703.78 lakh units
Rs.4.5/kwh 76.67
3 Yield Increase (52.30%)
65.00 lakhs MT Rs.3,171 per ton 2049.70
4 Labour savings 94.00
Total 9455.37
NABARD assisted MI project made a huge impact in socio-economic
conditions of the farmers by providing an average additional income of
Rs.2 lakhs per annum per farmer.
Future Scope:
Out of an area of 43.15 lakhs acres irrigated with 13.73 lakhs nos Bore
wells and Open wells, an area of 18.60 lakh acres are only covered
under micro irrigation upto 2019-20, leaving a balance potential area
of 24.55 lakh acres for micro irrigation.
9
As per the District Irrigation Plans an area of 5.44 lakh acres is
proposed to be cover under Micro Irrigation during the year 2019-
20.The financial requirement to cover this area is Rs. 1581.92 Cr.,
To meet the immense potential for Micro irrigation and demand from
farmers, it is essential to promote micro irrigation with NABARD
assistance in coming years.
During 2019-20, an area of 2.71 lakh acres (2.00 lakh acres Drip and
0.71 lakhs acres Sprinkler) are proposed with a financial outlay of
Rs.710.18 crores (Rs.294.39 crores as GOI Share and Rs.415.79
crores as State share).
BEs of 2019-20 an amount of Rs.6.71 crores (Rs.2.33 crores as GOI
Share and Rs.4.38 crores as State share) is only allocated to cover an
area of 2812 acres (2112 acres Drip and 700 acres under Sprinkler)
District wise progress under TSMIP since inception is in
Annexure –III(A).
1,06,825 no. of farmers registered in Mee-seva for micro irrigation in
an area of 3.40 lakh acres and are waiting for sanction for Drip and
Sprinkler irrigation systems in Annexure –III(B).
B. ESTABLISHMENT OF GREEN HOUSES/ POLYHOUSES:
Establishment of Green/Polyhouses is a flagship programme in
Telangana launched during 2014-15 with 75% subsidy to promote
cultivation of high value vegetables and flowers. The subsidy was enhanced
to 95% for SC/ST category farmers during 2016-17.
During 2017-18, another component called Flat Roof Net Houses with
Cable purlin was also implemented to promote Vegetable cultivation in off-
season particularly summer.
Objectives of the Scheme:
To enhance productivity per unit area.
10
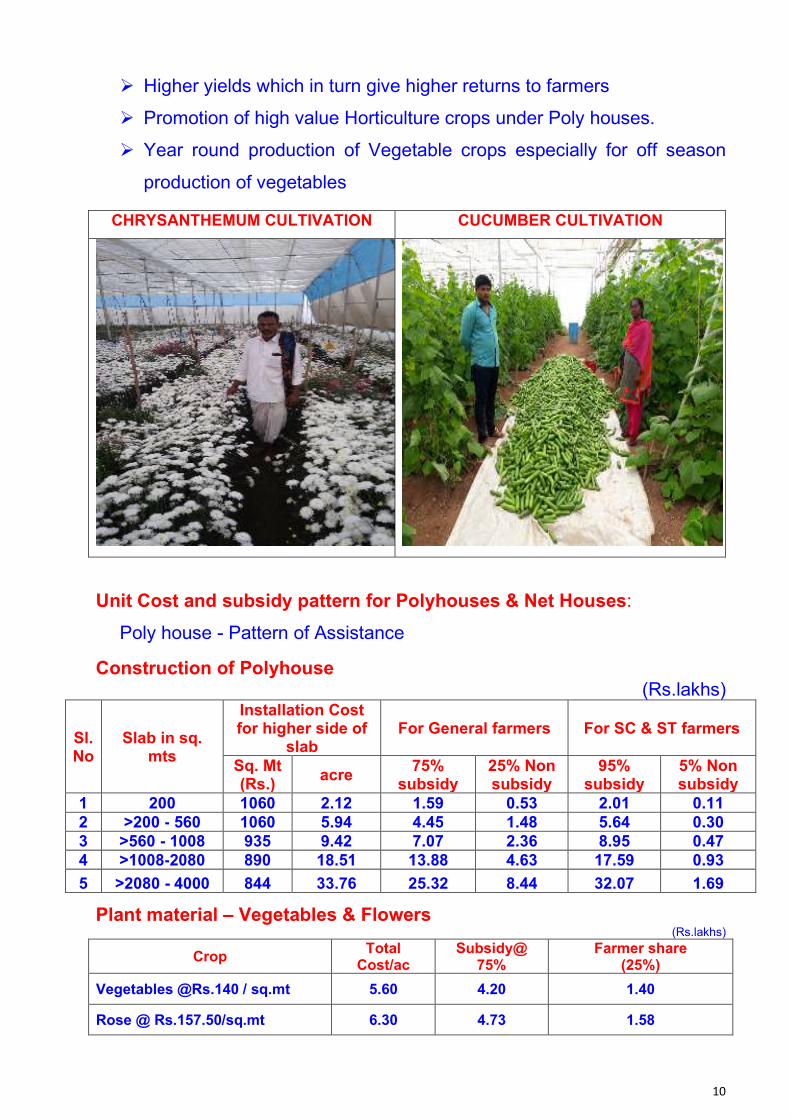
Higher yields which in turn give higher returns to farmers
Promotion of high value Horticulture crops under Poly houses.
Year round production of Vegetable crops especially for off season
production of vegetables
CHRYSANTHEMUM CULTIVATION CUCUMBER CULTIVATION
Unit Cost and subsidy pattern for Polyhouses & Net Houses:
Poly house - Pattern of Assistance
Construction of Polyhouse (Rs.lakhs)
Sl. No
Slab in sq. mts
Installation Cost for higher side of
slab For General farmers For SC & ST farmers
Sq. Mt (Rs.)
acre 75%
subsidy 25% Non subsidy
95% subsidy
5% Non subsidy
1 200 1060 2.12 1.59 0.53 2.01 0.11
2 >200 - 560 1060 5.94 4.45 1.48 5.64 0.30
3 >560 - 1008 935 9.42 7.07 2.36 8.95 0.47
4 >1008-2080 890 18.51 13.88 4.63 17.59 0.93
5 >2080 - 4000 844 33.76 25.32 8.44 32.07 1.69
Plant material – Vegetables & Flowers (Rs.lakhs)
Crop Total
Cost/ac Subsidy@
75% Farmer share
(25%)
Vegetables @Rs.140 / sq.mt 5.60 4.20 1.40
Rose @ Rs.157.50/sq.mt 6.30 4.73 1.58
11
Crop Total
Cost/ac Subsidy@
75% Farmer share
(25%)
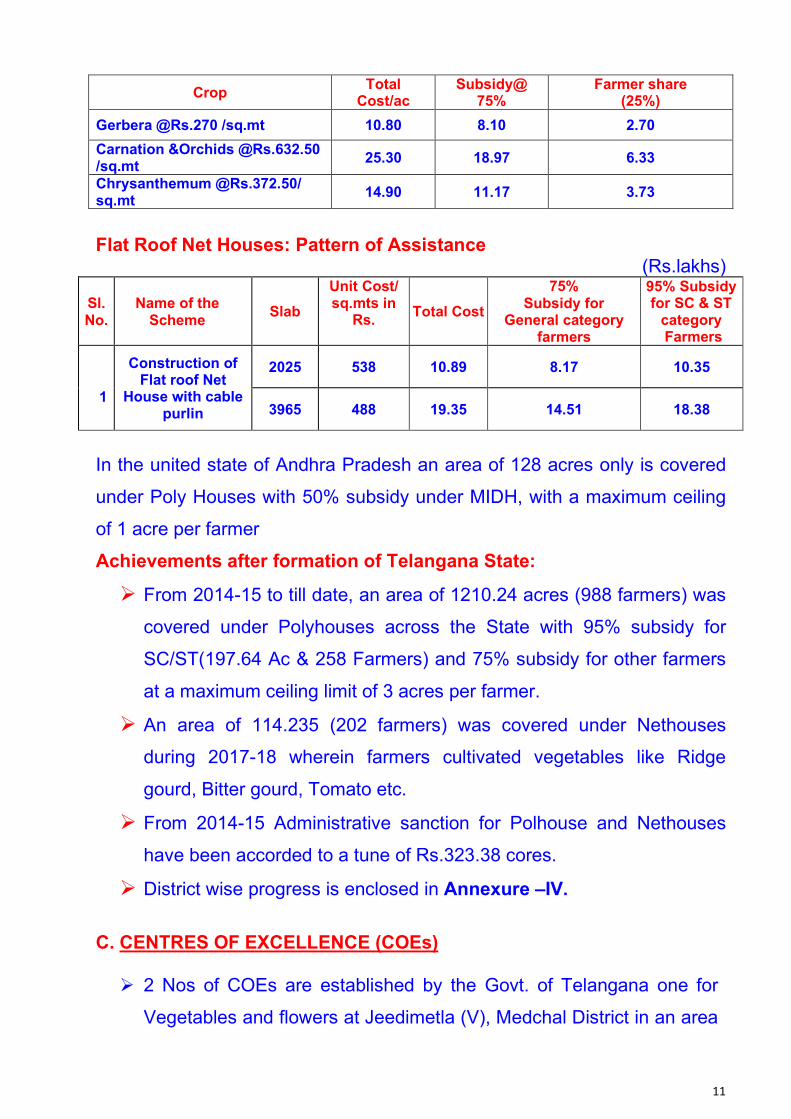
Gerbera @Rs.270 /sq.mt 10.80 8.10 2.70
Carnation &Orchids @Rs.632.50 /sq.mt
25.30 18.97 6.33
Chrysanthemum @Rs.372.50/ sq.mt
14.90 11.17 3.73
Flat Roof Net Houses: Pattern of Assistance
(Rs.lakhs)
Sl. No.
Name of the Scheme
Slab
Unit Cost/ sq.mts in
Rs.
Total Cost
75% Subsidy for
General category farmers
95% Subsidy for SC & ST
category Farmers
1
Construction of Flat roof Net
House with cable purlin
2025 538 10.89 8.17 10.35
3965 488 19.35 14.51 18.38
In the united state of Andhra Pradesh an area of 128 acres only is covered
under Poly Houses with 50% subsidy under MIDH, with a maximum ceiling
of 1 acre per farmer
Achievements after formation of Telangana State:
From 2014-15 to till date, an area of 1210.24 acres (988 farmers) was
covered under Polyhouses across the State with 95% subsidy for
SC/ST(197.64 Ac & 258 Farmers) and 75% subsidy for other farmers
at a maximum ceiling limit of 3 acres per farmer.
An area of 114.235 (202 farmers) was covered under Nethouses
during 2017-18 wherein farmers cultivated vegetables like Ridge
gourd, Bitter gourd, Tomato etc.
From 2014-15 Administrative sanction for Polhouse and Nethouses
have been accorded to a tune of Rs.323.38 cores.
District wise progress is enclosed in Annexure –IV.
C. CENTRES OF EXCELLENCE (COEs)
2 Nos of COEs are established by the Govt. of Telangana one for
Vegetables and flowers at Jeedimetla (V), Medchal District in an area
12
of 10.35 acres and another one for Fruits at Mulugu (V), Siddipet
District in an area of 50 acres.
To serve as demonstration cum training centre to all the farmers who
are cultivating Fruits, Vegetables & Flowers.
I. CoE, Jeedimetla
The Centre is functioning from 2016 onwards.
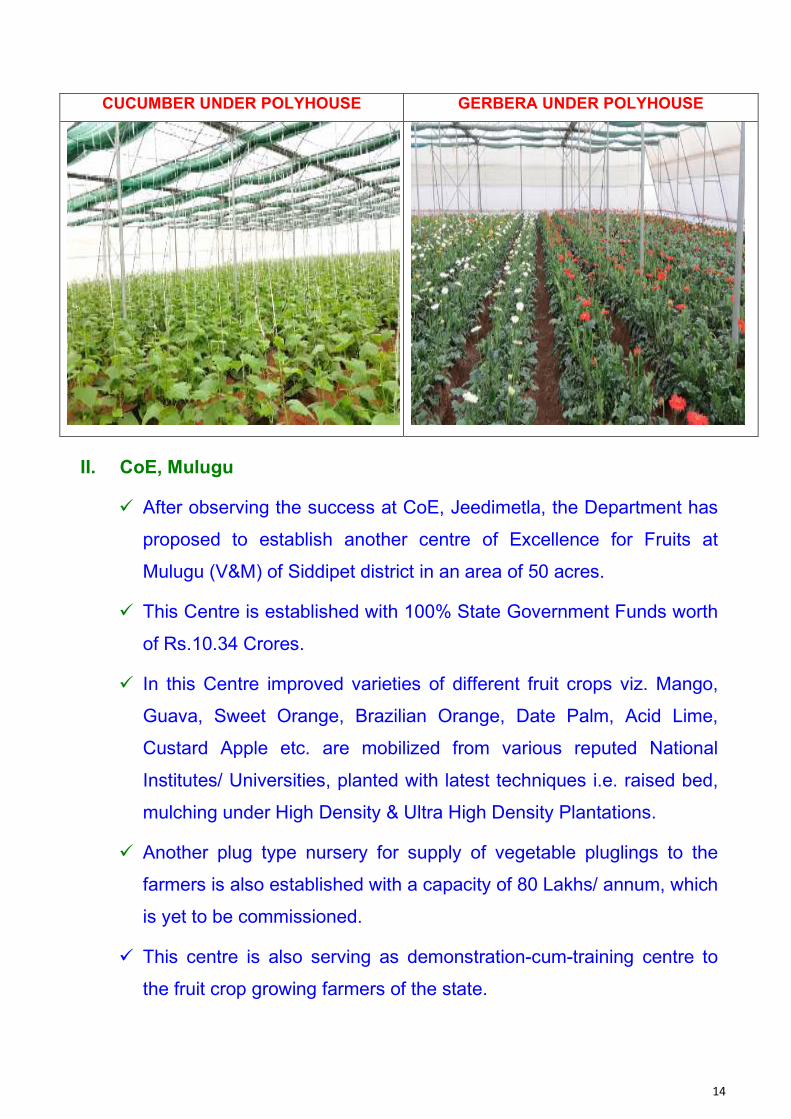
The Centre of Excellence has been established with an objective to
demonstrate cultivation of different exotic Flowers (Gerbera,
Carnation, Chrysanthemum and Orchids) and Vegetables (European
Cucumber, Color Capsicum, Brinjal, Cherry Tomatoes etc.)
The Centre is utilized for imparting training to all the polyhouse
farmers of the state.
This CoE is established with assistance from MIDH of GoI with an
expenditure of Rs. 12.40 Crores.
In addition to the polyhouses, one hi-tech plugling nursery is also
established mainly with the objective to supply high quality, improved
variety seedlings to the farmers on subsidy so that the farmers will
not face several hardships rising out of spurious seed supply &
nursery loss during heavy rains.
The designed capacity of the nursery is 40 Lakhs/ annum of Tomato,
Brinjal and Green Chillies.
Till date, 175.32 Lakh No. of pluglings of Tomato, Brinjal, Chillies,
Capsicum, Bitter Gourd, Marigold and Turmeric were supplied to the
farmers covering an area of 2260 acres on subsidy basis and they
are performing well on the field.
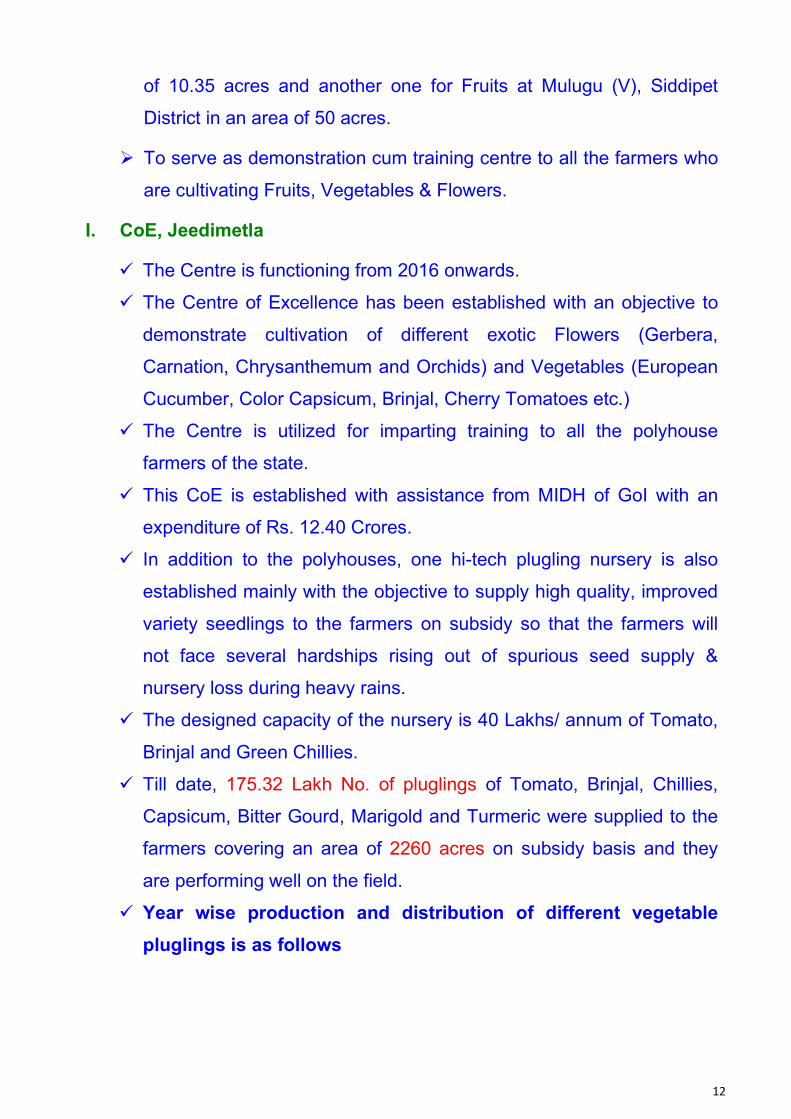
Year wise production and distribution of different vegetable
pluglings is as follows
13
Sl. No
Year Name of the
crop Variety
No. of pluglings produced and distributed (in
lakhs No.)
Area in acres
1 2017-18 Tomato US440 56.80 710
2 2018-19 Tomato US440
PHS448/Kapila 62.33 780
3 2018-19 Green chillies Ujala 14.97 234
4 2018-19 Brinjal Keerthi, Utkarsha 6.54 82
5 2019-20 Tomato US440, PHS448,
Himsona 26.51 332
6 2019-20 Green
Chillies Ujala, VNR145,
PHS941 6.41 100
7 2019-20 Brinjal Keerthi, Utkarsha 1.76 22
Total 175.32 2260
This centre has been visited by eminent personalities from National
and International stature particularly from Scientist, Officials, Farmers
and Public Representatives.
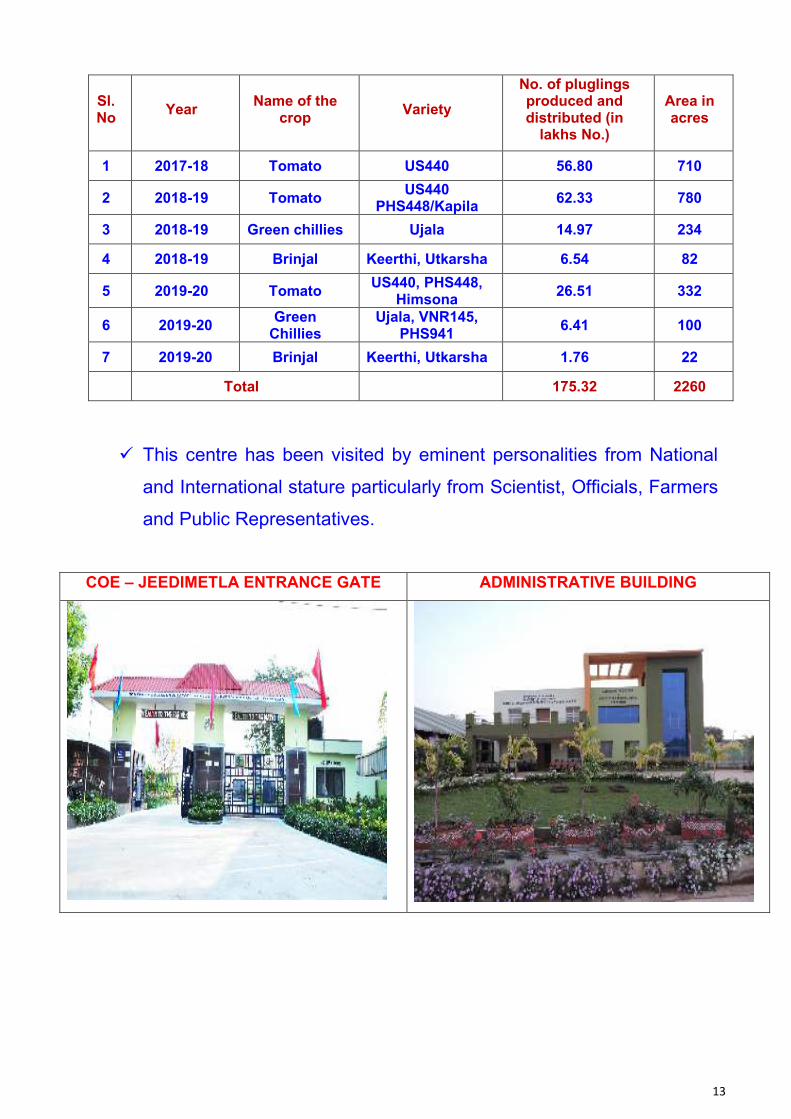
COE – JEEDIMETLA ENTRANCE GATE ADMINISTRATIVE BUILDING
14
CUCUMBER UNDER POLYHOUSE GERBERA UNDER POLYHOUSE
II. CoE, Mulugu
After observing the success at CoE, Jeedimetla, the Department has
proposed to establish another centre of Excellence for Fruits at
Mulugu (V&M) of Siddipet district in an area of 50 acres.
This Centre is established with 100% State Government Funds worth
of Rs.10.34 Crores.
In this Centre improved varieties of different fruit crops viz. Mango,
Guava, Sweet Orange, Brazilian Orange, Date Palm, Acid Lime,
Custard Apple etc. are mobilized from various reputed National
Institutes/ Universities, planted with latest techniques i.e. raised bed,
mulching under High Density & Ultra High Density Plantations.
Another plug type nursery for supply of vegetable pluglings to the
farmers is also established with a capacity of 80 Lakhs/ annum, which
is yet to be commissioned.
This centre is also serving as demonstration-cum-training centre to
the fruit crop growing farmers of the state.
15
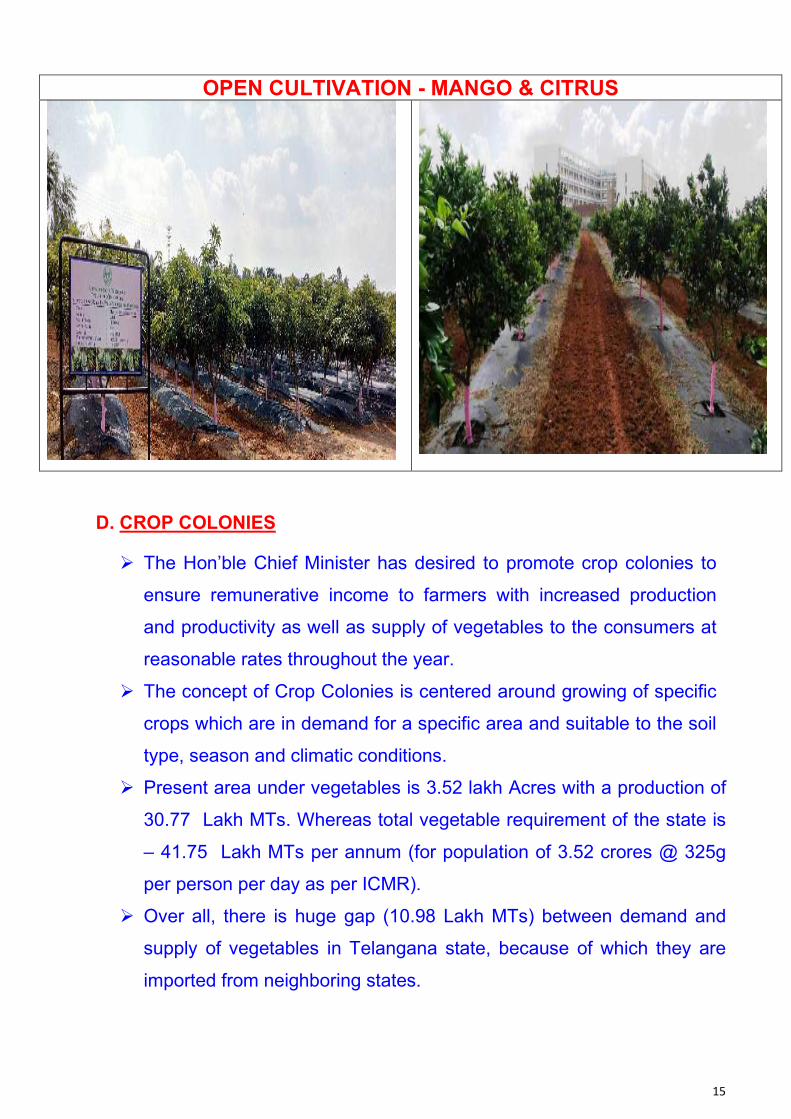
OPEN CULTIVATION - MANGO & CITRUS
D. CROP COLONIES
The Hon’ble Chief Minister has desired to promote crop colonies to
ensure remunerative income to farmers with increased production
and productivity as well as supply of vegetables to the consumers at
reasonable rates throughout the year.
The concept of Crop Colonies is centered around growing of specific
crops which are in demand for a specific area and suitable to the soil
type, season and climatic conditions.
Present area under vegetables is 3.52 lakh Acres with a production of
30.77 Lakh MTs. Whereas total vegetable requirement of the state is
– 41.75 Lakh MTs per annum (for population of 3.52 crores @ 325g
per person per day as per ICMR).
Over all, there is huge gap (10.98 Lakh MTs) between demand and
supply of vegetables in Telangana state, because of which they are
imported from neighboring states.
16
Identified farmers in the crop colony area will be encouraged to take
up staggered sowing which will avoid market glut / shortage so that
neither the farmers nor the consumers are put to loss.
The Department has implemented one crop colony on pilot basis for
vegetables at Ibrahimpatnam of Ranga Reddy Dist. Covering 3562
areas for 2780 farmers of 38 villages in 3 mandals i.e.,
Ibrahimpatnam, Manchal & Yacharam.
An amount of Rs.14.12 crores is incurred towards assistance under
various components (Supply of Improved variety and high-quality
seedlings from COE, Drip Irrigation, Pandals, Mulching & Plastic
crates) due to which the production from the same area is doubled
i.e., from 44000 MTs to 83000 MTs.
With the above success from the pilot crop colony, the department is
proposing to take up new crop colonies mainly in and around Urban
agglomerations (Hyderabad, Nizamabad, Warangal, Khammam and
Karimnagar).
E. PROMOTING FOOD PROCESSING SECTOR:
Telangana State Horticulture Development Corporation Limited” was
established to promote procurement, storage, processing and
marketing of good quality Horticulture Crops and their products and
also to facilitate implementation of water saving technologies like
Micro Irrigation, Modern Machinery etc.
OBJECTIVES:
To enhance the overall income of the farmers by intervening in
promoting Agriculture & Horticulture processing of fruits, vegetables,
flowers and spices at various levels of crop production and
processing.
The Corporation has entered an MoU with CFTRI for Technology to
establish Spice Processing Unit to produce a quantity of 2260 MTs per
17
annum for 8 spice products as detailed below at Dulapally Village,
Dundigal Gandimaisamma Mandal, Medchal District and DPR is
prepared with a project cost of Rs.26.38 crores and works are under
process.
Sl. No.
Products Kg/day Working Days Mt / annum
1 Turmeric powder 2600 250 650
2 Chilli powder 2600 250 650
3 Ginger paste 800 80 64
4 Garlic paste 800 80 64
5 Ginger-garlic paste 800 80 64
6 Tamarind paste 600 80 48
7 Tamarind powder 1000 200 200
8 Coriander powder 2600 200 520 Grand Total 11800 2260
The corporation shall do the marketing of the food products under the
brand name of “Kakateeya Foods”.
Spice Park
After formation of Telangana State, the State Government to ensure
better and remunerative prices to the spice farmers particularly
Turmeric Farmers decided to establish a Spice Park at Padgal Village
of Velpoor Mandal in Nizamabad District.
The objective of establishment of this park is to promote spice
processing units through PPP Mode by creating common
infrastructure, so that the Spice crop growing farmers particularly
Turmeric Farmers should not sell their produce at throw away prices,
when the market situation is dull.
For this purpose, 40.23 acres of land has been purchased and the
place is Centre point of Turmeric Growing Belt, covering the districts of
Nizamabad, Jagityal, Nirmal and Warangal.
A DPR worth of Rs. 30.81 Crores has been prepared by the Spices
Board and approved by the State Government.
18
The execution of the work has been entrusted to TSIIC.
Till date, an amount of Rs.6.28 Crores has been sanctioned from the
State Government and released to TSIIC, out of which Rs.2.91 corers
was incurred by TSIIC towards compound wall construction, internal
roads and borewells.
Construction of Compound Wall is completed and remaining works are
in progress.
Spice Park in Padgal(V) of Valpoor (M) of Nizamabad District
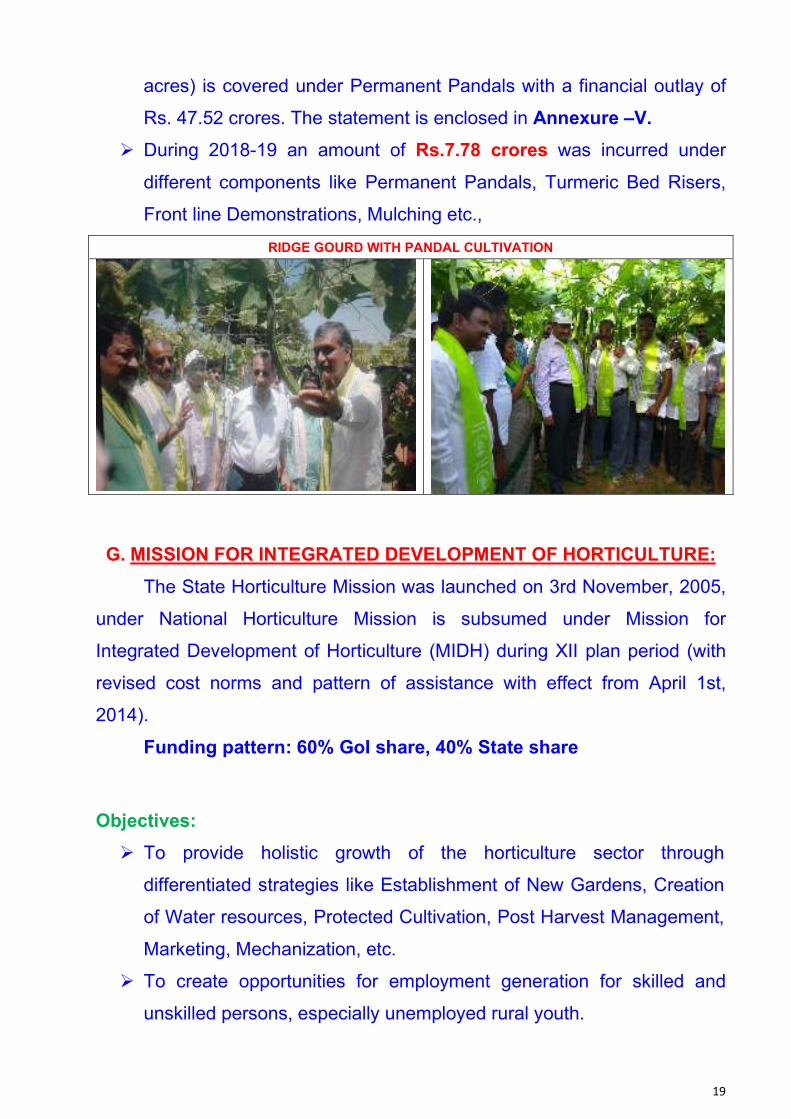
F. PERMANENT PANDALS (RKVY):
To increase the production, productivity and quality of creeper
vegetables, pandal system of cultivation is promoted by the
department under RKVY which has become popular among the
farmers.
In traditional method of cultivation Gourds are allowed to grow on
ground with a yield of 8-10 MT per acre with inferior quality while
under pandal cultivation 20-22 MT per acre of superior quality yields
are obtained.
Totally an area of 5398 acres (since inception including NREGS-371
19
acres) is covered under Permanent Pandals with a financial outlay of
Rs. 47.52 crores. The statement is enclosed in Annexure –V.
During 2018-19 an amount of Rs.7.78 crores was incurred under
different components like Permanent Pandals, Turmeric Bed Risers,
Front line Demonstrations, Mulching etc.,
RIDGE GOURD WITH PANDAL CULTIVATION
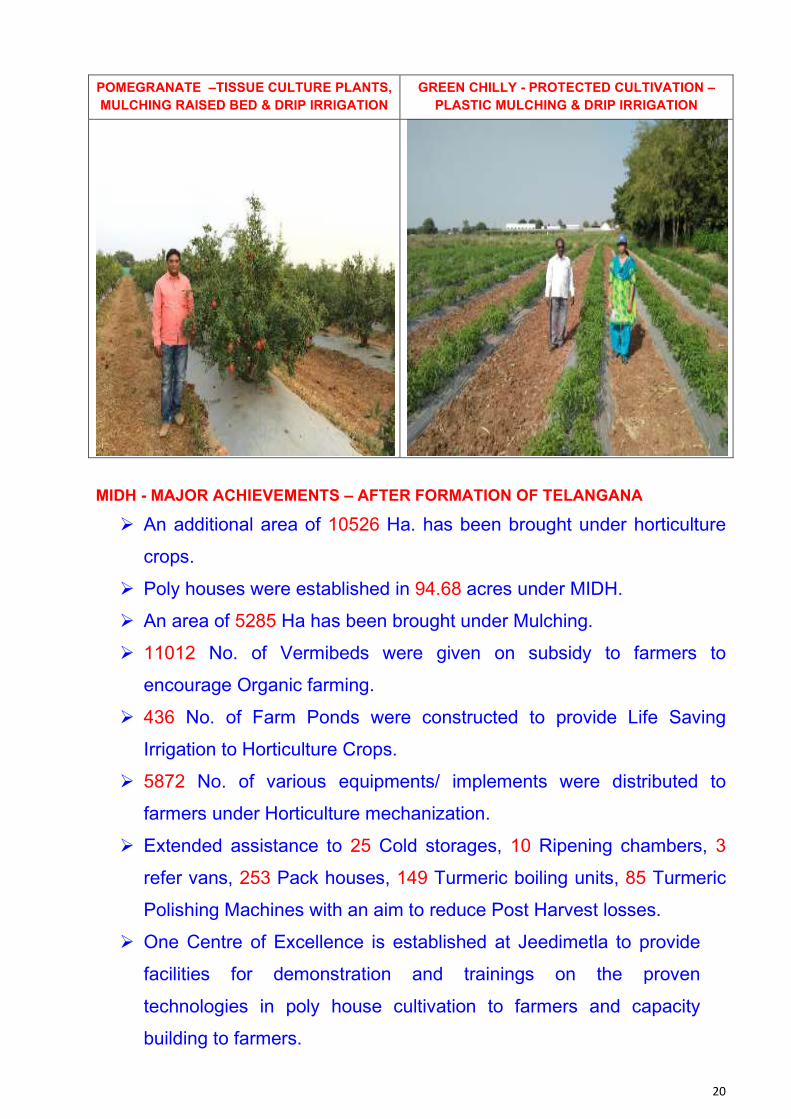
G. MISSION FOR INTEGRATED DEVELOPMENT OF HORTICULTURE:
The State Horticulture Mission was launched on 3rd November, 2005,
under National Horticulture Mission is subsumed under Mission for
Integrated Development of Horticulture (MIDH) during XII plan period (with
revised cost norms and pattern of assistance with effect from April 1st,
2014).
Funding pattern: 60% GoI share, 40% State share
Objectives:
To provide holistic growth of the horticulture sector through
differentiated strategies like Establishment of New Gardens, Creation
of Water resources, Protected Cultivation, Post Harvest Management,
Marketing, Mechanization, etc.
To create opportunities for employment generation for skilled and
unskilled persons, especially unemployed rural youth.
20
POMEGRANATE –TISSUE CULTURE PLANTS,
MULCHING RAISED BED & DRIP IRRIGATION
GREEN CHILLY - PROTECTED CULTIVATION –
PLASTIC MULCHING & DRIP IRRIGATION
MIDH - MAJOR ACHIEVEMENTS – AFTER FORMATION OF TELANGANA
An additional area of 10526 Ha. has been brought under horticulture
crops.
Poly houses were established in 94.68 acres under MIDH.
An area of 5285 Ha has been brought under Mulching.
11012 No. of Vermibeds were given on subsidy to farmers to
encourage Organic farming.
436 No. of Farm Ponds were constructed to provide Life Saving
Irrigation to Horticulture Crops.
5872 No. of various equipments/ implements were distributed to
farmers under Horticulture mechanization.
Extended assistance to 25 Cold storages, 10 Ripening chambers, 3
refer vans, 253 Pack houses, 149 Turmeric boiling units, 85 Turmeric
Polishing Machines with an aim to reduce Post Harvest losses.
One Centre of Excellence is established at Jeedimetla to provide
facilities for demonstration and trainings on the proven
technologies in poly house cultivation to farmers and capacity
building to farmers.
21
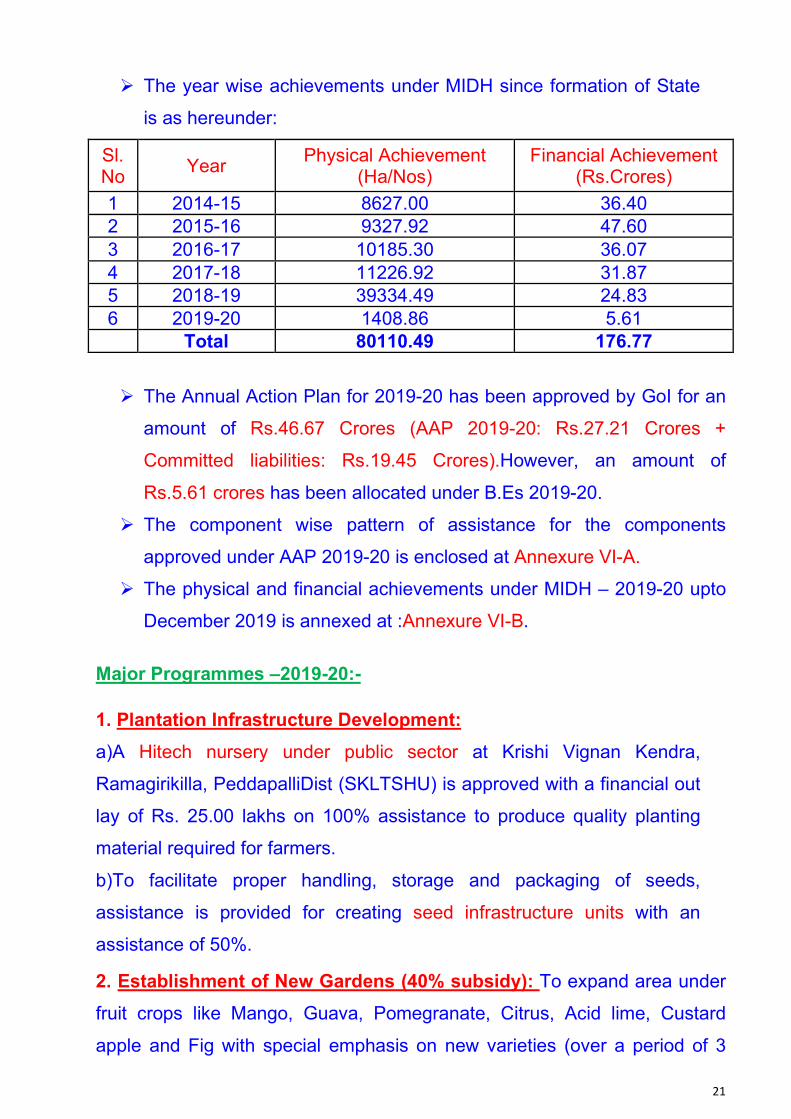
The year wise achievements under MIDH since formation of State
is as hereunder:
Sl. No
Year Physical Achievement
(Ha/Nos) Financial Achievement
(Rs.Crores)
1 2014-15 8627.00 36.40
2 2015-16 9327.92 47.60
3 2016-17 10185.30 36.07
4 2017-18 11226.92 31.87
5 2018-19 39334.49 24.83
6 2019-20 1408.86 5.61
Total 80110.49 176.77
The Annual Action Plan for 2019-20 has been approved by GoI for an
amount of Rs.46.67 Crores (AAP 2019-20: Rs.27.21 Crores +
Committed liabilities: Rs.19.45 Crores).However, an amount of
Rs.5.61 crores has been allocated under B.Es 2019-20.
The component wise pattern of assistance for the components
approved under AAP 2019-20 is enclosed at Annexure VI-A.
The physical and financial achievements under MIDH – 2019-20 upto
December 2019 is annexed at :Annexure VI-B.
Major Programmes –2019-20:-
1. Plantation Infrastructure Development:
a)A Hitech nursery under public sector at Krishi Vignan Kendra,
Ramagirikilla, PeddapalliDist (SKLTSHU) is approved with a financial out
lay of Rs. 25.00 lakhs on 100% assistance to produce quality planting
material required for farmers.
b)To facilitate proper handling, storage and packaging of seeds,
assistance is provided for creating seed infrastructure units with an
assistance of 50%.
2. Establishment of New Gardens (40% subsidy): To expand area under
fruit crops like Mango, Guava, Pomegranate, Citrus, Acid lime, Custard
apple and Fig with special emphasis on new varieties (over a period of 3
22
years (60:20:20) in case of perennials) and vegetable area expansion by
providing seedlings to farmers with 40% subsidy.
3. Farm ponds: In order to address the challenges of depleting water
sources, efficient interventions like Micro Irrigation, Creation of Farm Ponds
are the only options left to the farmers. Hence, 50% assistance is provided
to create individual farm ponds and 100% for community farm ponds.
4. Protected Cultivation: Construction of Naturally ventilated poly houses
with 50% subsidy; Rs. 422/- per Sq.M (>2080 Sq.MtsUpto 4000 Sq.Mts)
based upon the size of the green house and in accordance with MIDH
norms. Assistance for mulching is provided with 50% subsidy, maximum of
Rs.16,000/- per ha. Limited to 2 Ha per beneficiary.
5. Horticulture Mechanization: Mechanization in Horticulture operations
would help in ease of operations and helps in achieving higher efficiency.
Hence, it is proposed to provide assistance to Mini tractors
(25/35%subsidy), Brush cutters (40/50% subsidy), Power saws(40/50%
subsidy)and Tractor mounted sprayers (40/50% subsidy).
6. Post Harvest Management: To reduce the post harvest losses, increase
the consistency, hygiene and integrity of the produce, assistance is being
provided towards establishment of Integrated Pack Houses, Pack houses,
Single Temperature Cold storage units, Ripening Chambers, Cold rooms
(staging), Pre-cooling units, Primary processing units with 35-50%
assistance.
7.Technology dissemination through Frontline Demonstrations: To
demonstrate advanced production technologies like raised bed cultivation,
weedmat & UHDP in Mango and to introduce & promote Seed spices
cultivation in the State, FLDs at farmers’ field are proposed at 75% subsidy.
8. Human Resource Development: Training will be provided to rural
unemployed youth in the field of farm pond lining technician and gardeners.
23
Exposure visits and need based trainings and training on skill development
for rural youth will be organized in the areas of Protected Cultivation, PHM,
agronomic practices of Horticulture and market orientation to farmers and
also to the technical staff.
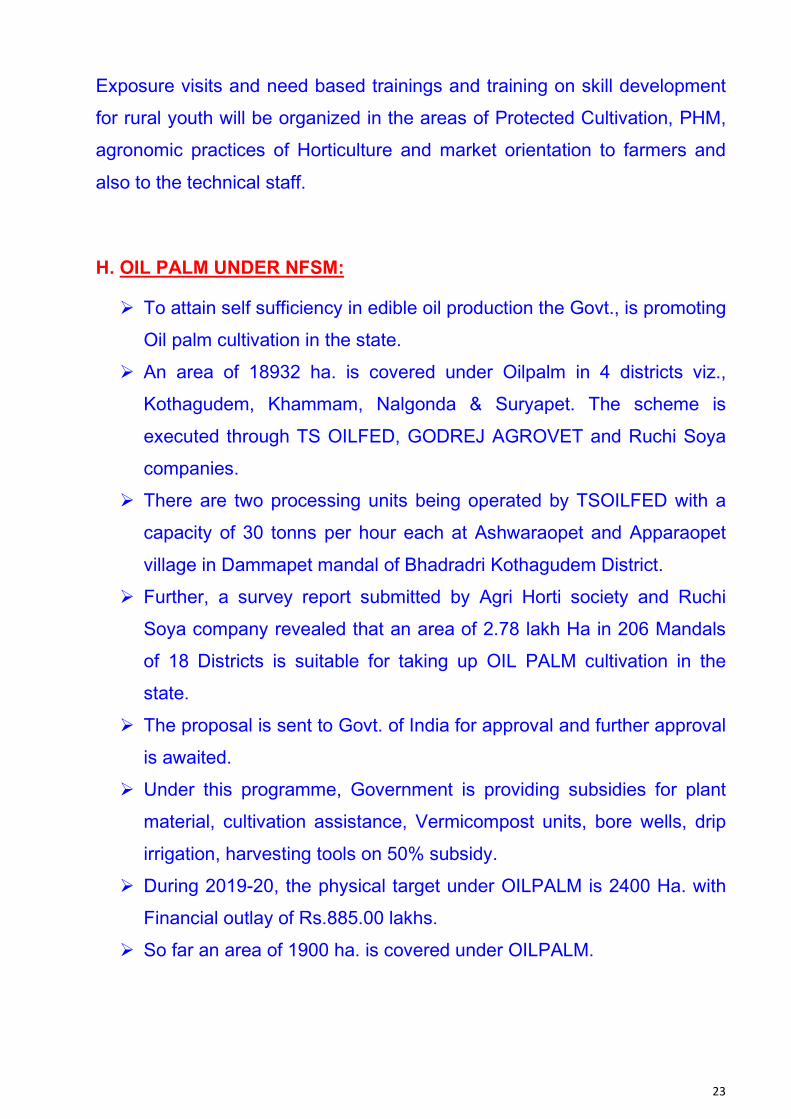
H. OIL PALM UNDER NFSM:
To attain self sufficiency in edible oil production the Govt., is promoting
Oil palm cultivation in the state.
An area of 18932 ha. is covered under Oilpalm in 4 districts viz.,
Kothagudem, Khammam, Nalgonda & Suryapet. The scheme is
executed through TS OILFED, GODREJ AGROVET and Ruchi Soya
companies.
There are two processing units being operated by TSOILFED with a
capacity of 30 tonns per hour each at Ashwaraopet and Apparaopet
village in Dammapet mandal of Bhadradri Kothagudem District.
Further, a survey report submitted by Agri Horti society and Ruchi
Soya company revealed that an area of 2.78 lakh Ha in 206 Mandals
of 18 Districts is suitable for taking up OIL PALM cultivation in the
state.
The proposal is sent to Govt. of India for approval and further approval
is awaited.
Under this programme, Government is providing subsidies for plant
material, cultivation assistance, Vermicompost units, bore wells, drip
irrigation, harvesting tools on 50% subsidy.
During 2019-20, the physical target under OILPALM is 2400 Ha. with
Financial outlay of Rs.885.00 lakhs.
So far an area of 1900 ha. is covered under OILPALM.
24
OIL PALM CULTIVATION
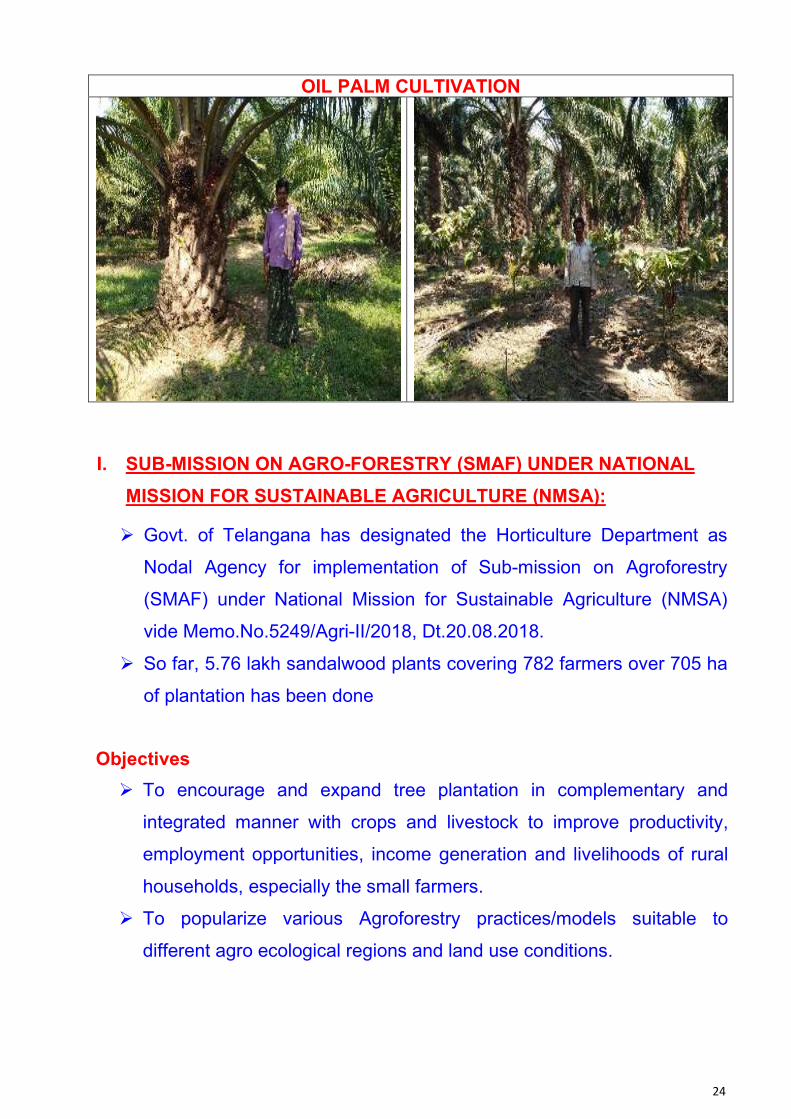
I. SUB-MISSION ON AGRO-FORESTRY (SMAF) UNDER NATIONAL
MISSION FOR SUSTAINABLE AGRICULTURE (NMSA):
Govt. of Telangana has designated the Horticulture Department as
Nodal Agency for implementation of Sub-mission on Agroforestry
(SMAF) under National Mission for Sustainable Agriculture (NMSA)
vide Memo.No.5249/Agri-II/2018, Dt.20.08.2018.
So far, 5.76 lakh sandalwood plants covering 782 farmers over 705 ha
of plantation has been done
Objectives
To encourage and expand tree plantation in complementary and
integrated manner with crops and livestock to improve productivity,
employment opportunities, income generation and livelihoods of rural
households, especially the small farmers.
To popularize various Agroforestry practices/models suitable to
different agro ecological regions and land use conditions.
25
J. NATIONAL BAMBOO MISSION SCHEME
Govt. of Telangana has designated Horticulture Department as Nodal
and implementing Agency for implementation of National Bamboo
Mission under National Mission for Sustainable Agriculture (NMSA)
and nominated Director of Horticulture for anchoring the State
Bamboo Mission and also as Mission Director of Bamboo Mission vide
Memo.No.5250/Agri-II/2018, Dt.20.08.2018.
So far 2.05 lakh Bamboo saplings planted in farmers fields(block and
boundary plantatons) covering an area of 607 Ha by 161 farmers.
Objectives:
To increase the area under bamboo plantation in non forest
Government and private lands to supplement farm income and contribute
towards resilience to climate change as well as availability of quality raw
material requirement of industries. The bamboo plantations will be promoted
predominantly in farmers’ fields, homesteads, community lands, arable
wastelands, and along irrigation canals, water bodies etc.
K. Horticulture Farms:
In Telangana State, 18 nos. of Horticulture Farms are existing out of
which 13 nos. of Horticulture Farms are functional, and are being
monitored through a society called “Society for Horticulture
Nurseries”.
These farms are established with an objective to produce superior
quality planting material and to serve them as demonstration cum
training centres for the farmers.
The Horticulture Farms in the United State of Andhra Pradesh regime
are completely neglected and on the verge of collapsing condition.
26
After formation of Telangana state, these Horticulture Farms are
revived with the help of State Government through creation of latest
infrastructure, establishment of Scion Blocks with improved varieties of
fruit crops like Mango, Sweet Orange, Guava, Custard Apple, Apple
Ber & Coconut etc.
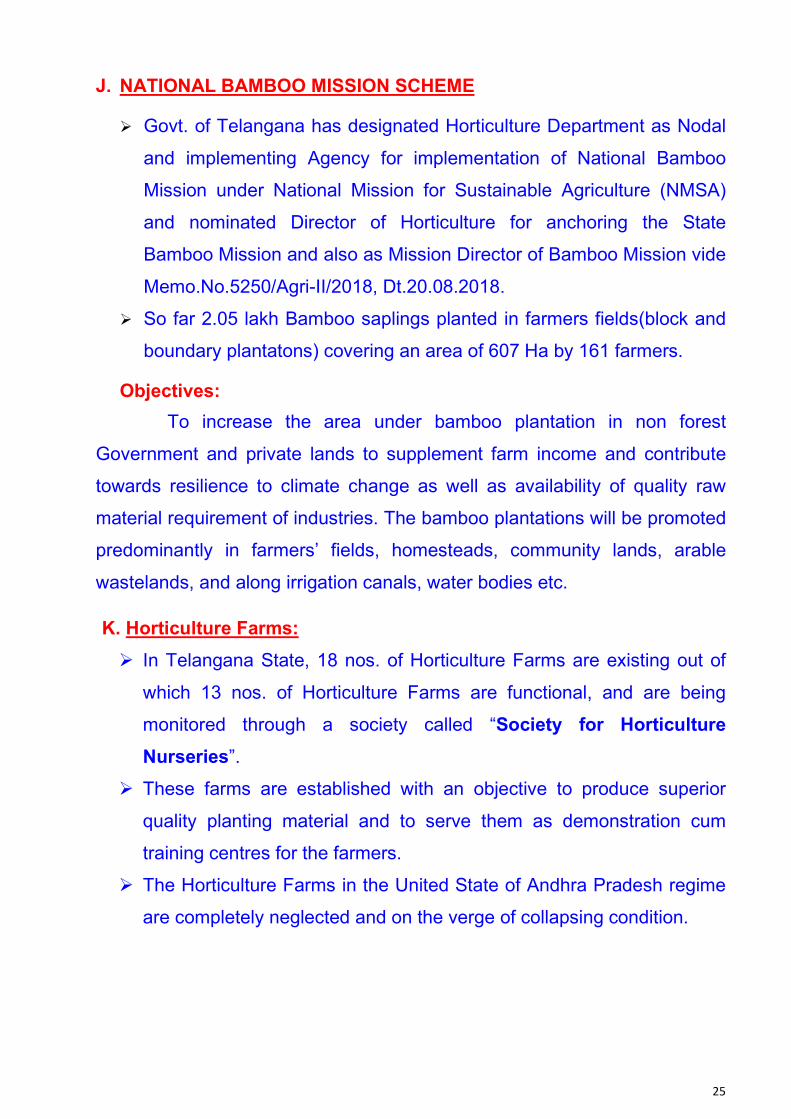
The infrastructure established is being utilized for production of quality
planting material particularly Mango Grafts, Guava Layers, Coconut
Seedlings etc. for onward supply in Government flagship plantation
programmes like Telangana Ku Harithharam and MGNREGA.
From 2014-15, a quality of 52.62 Lakh nos. of plat material is supplied
from Horticulture Farms to the above programmes.
Horticulture Farm at Mudgal in Nirmal district is being converted into
Model Bamboo Farm under National Bamboo Mission.
The Farm-wise, year-wise and Species-wise Production particulars are
appended in Annexure-VII
MANGO GRAFTS COCONUT SEEDLINGS
27
L. Horticulture Training Institutes:
A Horticulture Training Institute was established in year 2002 with an
objective to impart training to Progressive Horticulture Farmer of the
State in addition to organize in-service training to the technical staff of
the department on the latest technologies in different aspect of
horticulture.
This the APEX training institute for the horticulture maintained by the
Department of Horticulture.
The Horticulture Training institute is fully equipped with one number of
conference Halls with a seating capacity of 100 members.
The training institute is oraganizing one day, two days & three days in-
house training programmes to the farmers, send for the purpose from
the districts.
One Hostel building with 15 rooms, 5 dormitories which can
accommodate 50 persons is also attached to the institute for the stay
of trainees.
After formation of Telangana state 10,227 farmers are trained in the
Horticulture Training Institute under MIDH, Poly Houses and other
aspects.
M. Government Gardens:
The Public Gardens was established in 54 acres of land, which
pertains to one Shri Balakrishna in year 1868 A.D. consisting of some
babul trees.
Subsequently, an engineer of Nizams Government made
improvements and completed in 1872.
A zoo was added with many kinds of birds, forest and wild animals
and was named as “Bagh-E-Am” which is the only place where the
recreation for the public was available.
28
Initially the Government Gardens was attached to PWD Department
and maintained by a Superintendent of the department.
Afterwards, the Superintendent is re-designated of Director of
Government Gardens vide. G.O. MS. No. 2353 PWD, Dated
24/09/1965.
Later, the Director of Government Garden was merged with
Agriculture Department on 12/02/1976.
The Directorate of Government Garden was merged with department
of Horticulture vide G.O. MS. No 304 Food & Agriculture (Agri-I)
Department, with effect from 01/01/1982. Since then the wing is
headed by an officer of the Horticulture Department in the cadre of Dy.
Director.
During 2019-20, an amount of Rs.1.03 crores has been allocated for
development of government gardens..
Basic Duties & Responsibilities of Government Garden Wings
The Following Gardens are also being maintained by Government
Garden wings of this Department in addition to Public Gardens:
a) Riverside Parks on the Bank of Musi River, which is now called
as R.I.P.
b) Red Hills Garden
c) Legislative Assembly, Council and Secretariat Gardens
d) Lakeview Guest House Gardens
e) Dilkusha Gardens
f) Manjeera Guest House Gardens
g) Anand Nilayam Gardens
h) Green Land Guest House Garden
i) Nursing College Garden.
In addition to the above Government Gardens, the residential gardens
of Hon’ble Chief Minister, all Hon’ble Ministers, Assemble Speaker,
29
Dy. Speaker, Chief Whip. Government Whip, Hon’ble Chief Justice of
High Court and other Hon’ble are also being maintained by this wing.
The wing is headed by one Dy. Director, Supervisors (13 nos), Malis
(160 nos) & mallans (80 nos).
Urban Farming
The wing is also promoting terrace cultivation of vegetables in
Hyderabad city through a scheme called Urban farming.
This scheme is mainly intended to make city dwellers to grow their
own vegetables a fresh & with high nutrition and to reduce burden on
the local vegetable markets through providing subsidies.
Under this scheme Growbags (Silpaulin covers), potting mixture,
Vegetable seed kits containing 12 varieties of vegetable seeds, Neem
Cake, Neem Oil and implements like, Kurphi, Secatures, small
sprayers, shower, poly feed and cloth bag.
The total unit cost per one unit is Rs. 6000, out of which Rs. 3000 is
subsidy and balance beneficiary share.
This programme is being implemented from 2012-13 onwards.
Totally 5905 kits worth of Rs. 176.70 Lakhs have been supplied under
this programme.
N. Introduction of New Crops
The Department of Horticulture has taken steps to introduce several
new Horticulture crops and varieties which are suitable for Telangana
climate and soils.
Crops like Apple ber, New varieties in seethafal (NMK1), Guava (Thai
Guava, Lalith, Swetha and Arka Kiran), Date palm, Dragon Fruit, Agro-
forestry species like Sandalwood, Malabar neem, casuarinas ,
Bamboo and seed spices like Coriander, Ajwain, Fennel, Fenugreek
and Cumin.
30
With the efforts of the Department the area under Apple ber has
suppressed 1000 acres while Custard Apple is covered in an area of
508 acres, Date Palm and Dragon Fruit are in an area of 21 and 82
acres respectively.
New varieties under Jamun (CISH-J-37) has been brought from CISH
Lucknow and got them planted at COE Mulugu.
New varieties of Tamarind have been brought from HRS Ananthapur
i.e., Anantha Rudhira, Tettu Amolika, DSR-1 and DSR-2 got them
planted at COE Mulugu.
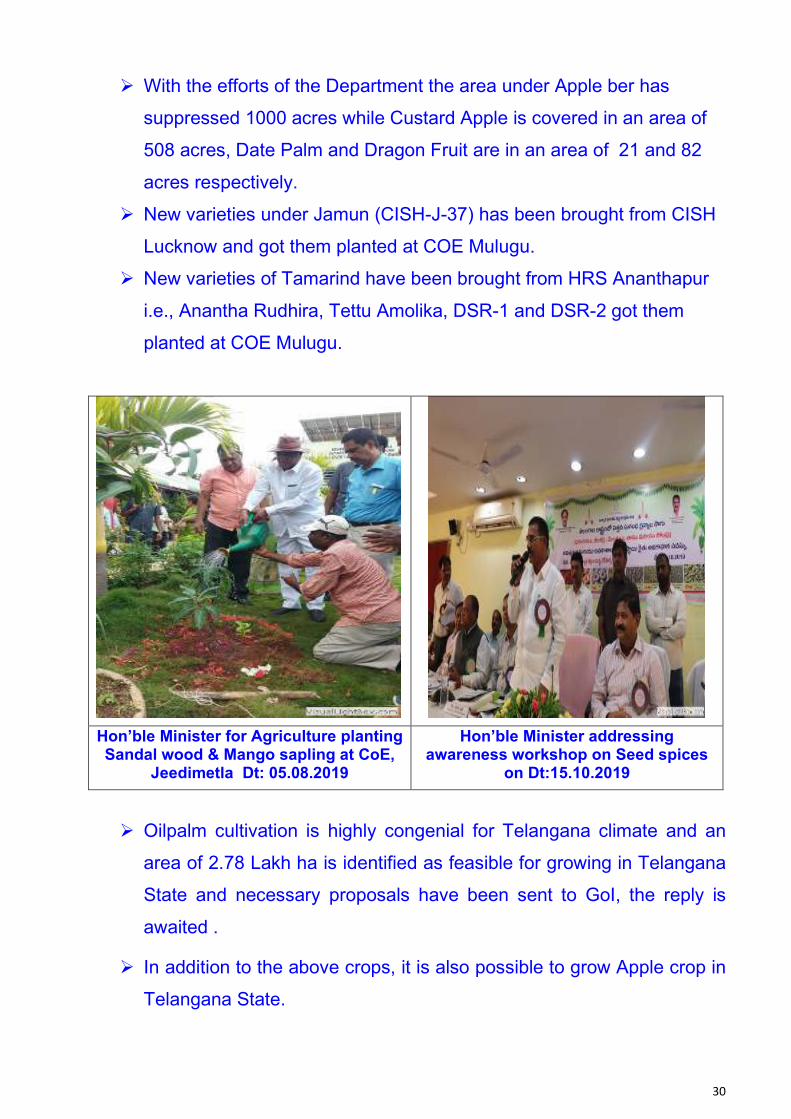
Hon’ble Minister for Agriculture planting Sandal wood & Mango sapling at CoE,
Jeedimetla Dt: 05.08.2019
Hon’ble Minister addressing awareness workshop on Seed spices
on Dt:15.10.2019
Oilpalm cultivation is highly congenial for Telangana climate and an
area of 2.78 Lakh ha is identified as feasible for growing in Telangana
State and necessary proposals have been sent to GoI, the reply is
awaited .
In addition to the above crops, it is also possible to grow Apple crop in
Telangana State.
31
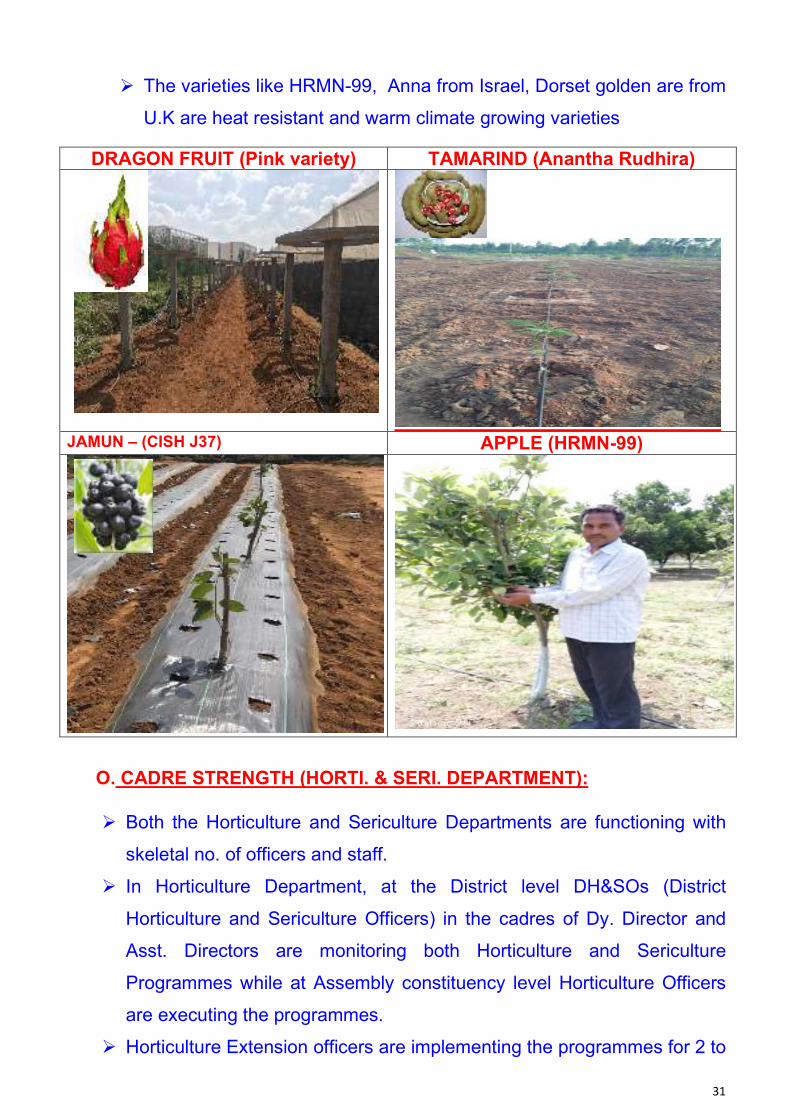
The varieties like HRMN-99, Anna from Israel, Dorset golden are from
U.K are heat resistant and warm climate growing varieties
DRAGON FRUIT (Pink variety) TAMARIND (Anantha Rudhira)
JAMUN – (CISH J37) APPLE (HRMN-99)
O. CADRE STRENGTH (HORTI. & SERI. DEPARTMENT):
Both the Horticulture and Sericulture Departments are functioning with
skeletal no. of officers and staff.
In Horticulture Department, at the District level DH&SOs (District
Horticulture and Sericulture Officers) in the cadres of Dy. Director and
Asst. Directors are monitoring both Horticulture and Sericulture
Programmes while at Assembly constituency level Horticulture Officers
are executing the programmes.
Horticulture Extension officers are implementing the programmes for 2 to
32
3 mandals.
In Horticulture Department totally 255 regular officers and staff in
different cadres are working against sanctioned strength of 429 leaving
vacancies of 174 no.s.
In Outsourcing, 574 no. of persons are working, out of which 131 no of
persons are drawing salaries from treasury and balance 443 no. are
drawing salaries from Administrative charge head of TSMIP (279), MIDH
(143) & RKVY (2). Further, 8 no. from TSHDCL, 6 no. from THTI & 5 no.
from SHN and Fruits are working.
Out of this Outsourcing staff. 190 no of field staff in the cadre of
Horticulture Extensions Officers.
In Sericulture Department, Asst. Directors of Sericulture are working at
District level under the control of DH&SOs for implementation of
Sericulture Programmes while Sericulture officers and Asst. Sericulture
officers are working at Assembly constituency level.
Totally 210 no. of Officers and Staff are working at present against a
sanctioned strength of 742 nos. in different cadres.
The details are annexed in Annexure – VIII, IX & X.
S. No
Type No. of
personnel working
Approx. Amount required per month (in
Lakhs)
1 Outsourcing (Districts + HoD) 143 28.00
2 Regular (HoD) 6 6.00
3 Other contingencies 1.00
Total amount required per
month 35.00
Amount required per annum 35.00 x 12 = 420.00
P. DEPARTMENTAL BUDGET During 2018-19
An amount of Rs.19.36 crores has been allocated as BEs during the
year 2019-20 for implementation of Horticulture programmes in the
state.
The details are appended in Annexure – XI.
33
Q. AWARENESS PROGRAMMES
A series of workshop crop specific, technology specific workshops and
seminars were organized by the Department at State and Regional
levels to create awareness among farmers.
Training programmes for organized to the farming community on
different scientific, technical aspects of cultivation, harvesting, post
harvest management and value addition.
Exposure Visits were conducted to the farmers on technology
demonstration, best practices, marketing avenues, good agricultural
practices at various state level, national level institutions across entire
country.
34
R. SERICULTURE:
Introduction:
SERICULTURE IS AN AGRO – INDUSTRY. Mulberry cultivation, Silk
worm rearing are Agriculture in nature whereas Silk Reeling, Silk
Twisting and weaving activities are industrial in nature.
Though, the agro climatic conditions are very much suitable for the
development of sericulture in Telangana, but no much concentration
was paid before to 2014.
Expansion of mulberry which was only 3176 acres during 2014has
been raised to 11,583 acres upto October 2019
Telangana is 100% Bi-voltine Cocoon producing state in the country
Cocoon production which was only 699 MTs and silk production was
105 MTs during 2014
During 2018-19, 214.14 MTs of Silk was produced by consuming
1435.08 MTs of cocoons within the state
With the existing mulberry acreage on an average 193.68 lakh
mandays are generated throughout the year. (5 persons are
employed from each acre of mulberry directly or indirectly from its
ancillary activities throughout the year i.e., silkworm rearing, silk
reeling, twisting, weaving and trading)
Telangana is blessed with production of Tasar Cocoons on forest
founa mostly the Tribals in Prof.Jayashankar Bhoopalapally,
Mancherial,Komaram Bheem and Bhadradri Kothagudem
To safe guard the traditional industry efforts were made and produced
117.224 lakh cocoons during 2018-19, which was 44.80 lakh nos
during 2017-18.
35
Govt. support:
Production incentive of Rs.75/- per kg of Cocoons is given to
sericulture farmers in addition to their market price and this is
applicable for the cocoons disposed anywhere in India.
State Govt is giving a Silk production incentive to the reelers
@ Rs.80/- per kg to MERU (Multi-end Reeling Unit) silk and
Rs.105/- to ARM (Automatic Reeling Machine) silk.
To increase the productivity and reduce the risk to farmers (10)
Chawkie Rearing Centres (CRCs) are established, which were only (5)
CRC during 2014 accordingly productivity also increased to 72 Kgs
per 100 dfls
State Govt. Incentive of Rs.200/- per 1000 nos of Tasar Reeling
Cocoons to the Tribal rearers to safe guard the traditional Tasar
industry in the state
50% Subsidy on cost of Tasar dfls i.e. Rs. 6/- per dfl is provided to the
tasar rearers.
Under Convergence with MG NREGS:
Telangana is the first state to cover the Tasar rearing under
convergence with MG NREGS, there by tasar farmer will get 145
mandays covering (2) beneficiaries per family i.e., Rs.62,000/-
additional income besides income from regular tasar crop.
For Mulberry bush plantation Rs.1.13 lakhs of which 1st year Rs.
41500/- & year 2nd & 3rd year Rs . 36,000/- each is provided under
MGNREGS. For Silkworm Rearing Shed construction Rs.1.03
lakhs is provided of which Rs. 1.00 lakhs material component and
3000/- wage component is also provided under convergence with MG
NREGS
36
New Initiatives:
The state has introduced new mulberry High yielding plant
varieties viz., G2 & G4.
Mist chamber a new concept has been introduced in the Government
Seed Farms to produce 2.00 lakhs of sapling per cycle in a short span
of 45 days in an area of 1200 sq.mts there by producing 12.00 lakhs
in (6) cycles to meet the demand of saplings during plantation
season.
A new concept of Sericulture Crop Colonies are identified under
mulberry considering the expansion in a radius of 20-25 KMs from
each identified crop colony.
Presently (12) such crop colonies are identified in the state which will
have more than 300 acres Viz.(1) Bizwaram of Gadwal district, (2)
Thummanapally and (3) Katnapally of Krimnagar district (4)
Nandyalavarigudem of Suryapet district (5) Pedda masanpally of
Siddipet district, (6) Warangal (U) district (7) Patimatla of
YadadriBhongir and (8) Bhainsa of Nirmal district (9) Kothakota of
Wanaparthy dist and (10) Koudipally of Medak district.
Tasar crop colonies of Kotapally of Mancherial and Koutala of
Komaram Bheem dist
Process is on to establish Bi voltine seed (egg) (DFLs) Production
Centre i.e., Grainage at Shadnagar by a Chinese entrepreneur for
self-sufficiency of seed. Presently we are depending on NSSO
(National Silkworm Seed Organisation) which is a Central Silk
Board unit and private seed producers of neighbouring states.
Establishment of backend support machinery to utilise the cocoons
produced with in the state, Previously there were only(2) Multi-end
Reeling Units and only (1) Automatic Reeling unit (ARM) were
functioning in the State as on 02.06.2014.
37
Now (5) 10- Basin MERUs (Multi End Silk Reeling Units) are
functioning effectively and (5) more MERUs are sanctioned there by
(10) MERUs will start functioning by year end.
The Central Silk Board has sanctioned (2) ARMs recently which will be
established shortly. In addition to one more ARM under establishment
at Gadwal with own funds of the Chinese entrepreneur, their by total
(4) ARMs will start functioning by year end.
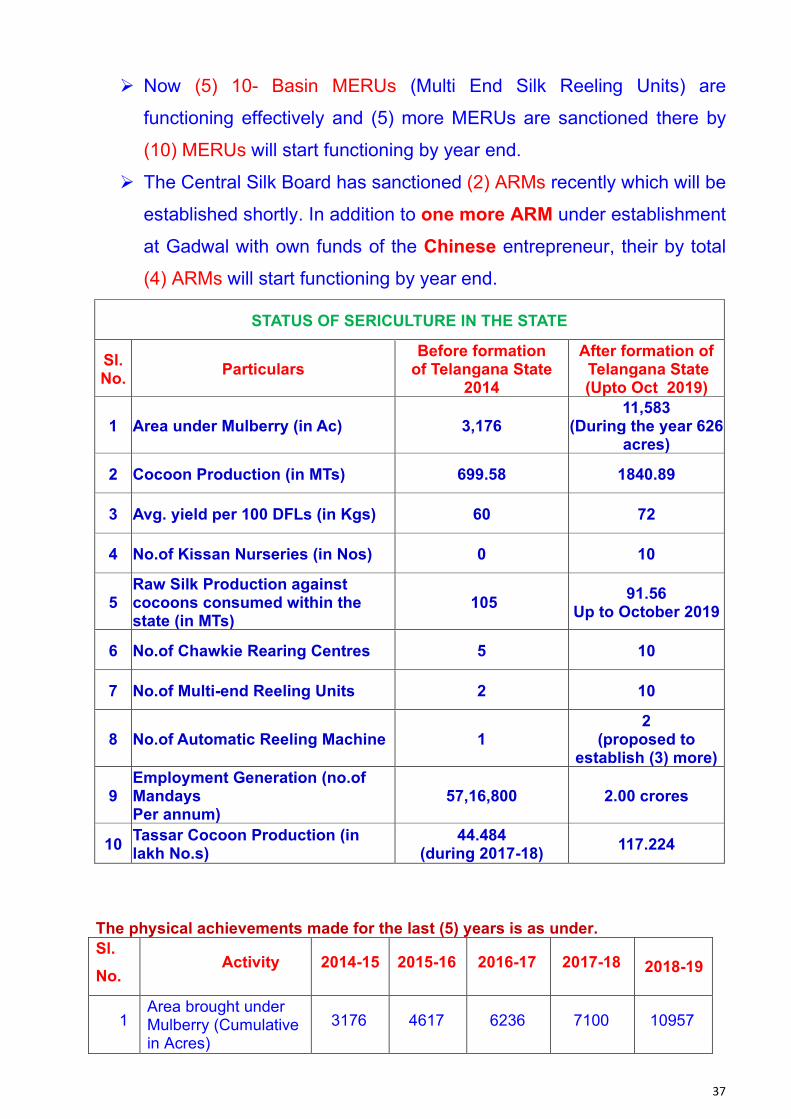
STATUS OF SERICULTURE IN THE STATE
Sl. No.
Particulars Before formation
of Telangana State 2014
After formation of Telangana State (Upto Oct 2019)
1 Area under Mulberry (in Ac) 3,176 11,583
(During the year 626 acres)
2 Cocoon Production (in MTs) 699.58 1840.89
3 Avg. yield per 100 DFLs (in Kgs) 60 72
4 No.of Kissan Nurseries (in Nos) 0 10
5 Raw Silk Production against cocoons consumed within the state (in MTs)
105 91.56
Up to October 2019
6 No.of Chawkie Rearing Centres 5 10
7 No.of Multi-end Reeling Units 2 10
8 No.of Automatic Reeling Machine 1 2
(proposed to establish (3) more)
9 Employment Generation (no.of Mandays Per annum)
57,16,800 2.00 crores
10 Tassar Cocoon Production (in lakh No.s)
44.484 (during 2017-18)
117.224
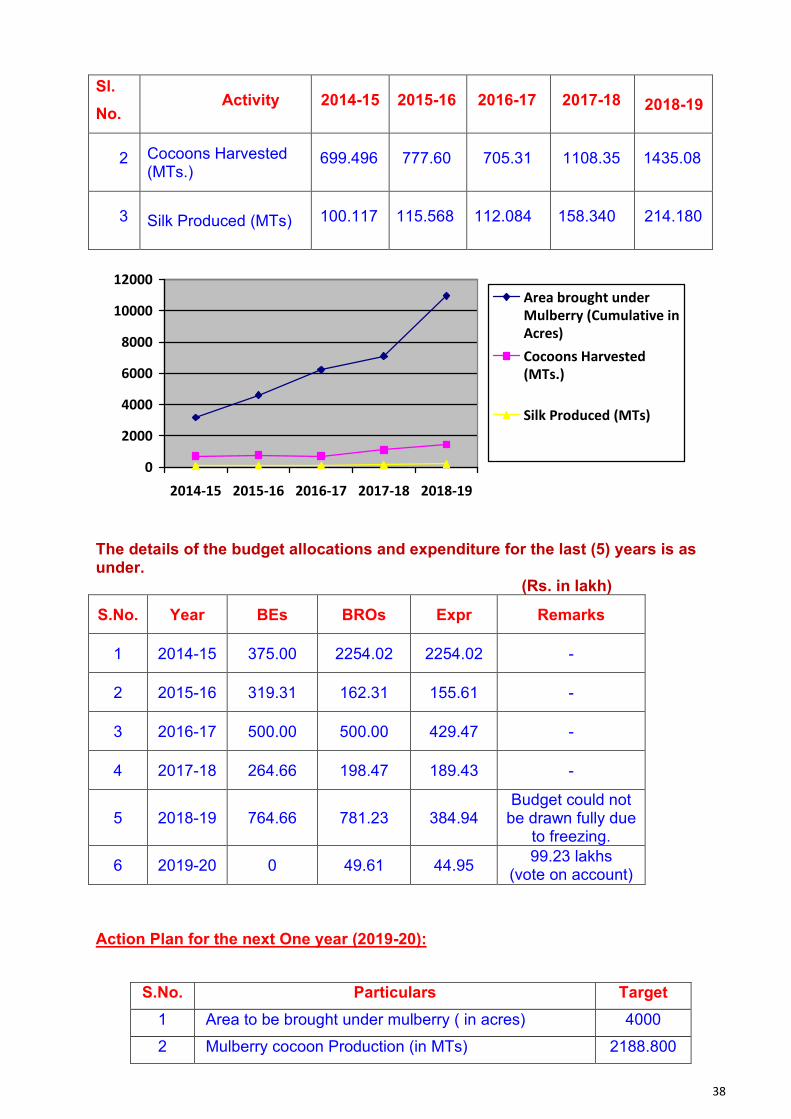
The physical achievements made for the last (5) years is as under.
Sl.
No. Activity 2014-15 2015-16 2016-17 2017-18 2018-19
1 Area brought under Mulberry (Cumulative in Acres)
3176 4617 6236 7100 10957
38
Sl.
No. Activity 2014-15 2015-16 2016-17 2017-18 2018-19
2 Cocoons Harvested (MTs.)
699.496 777.60 705.31 1108.35 1435.08
3 Silk Produced (MTs) 100.117 115.568 112.084 158.340 214.180
0
2000
4000
6000
8000
10000
12000
2014-15 2015-16 2016-17 2017-18 2018-19
Area brought under
Mulberry (Cumulative in
Acres)
Cocoons Harvested
(MTs.)
Silk Produced (MTs)
The details of the budget allocations and expenditure for the last (5) years is as under. (Rs. in lakh)
S.No. Year BEs BROs Expr Remarks
1 2014-15 375.00 2254.02 2254.02 -
2 2015-16 319.31 162.31 155.61 -
3 2016-17 500.00 500.00 429.47 -
4 2017-18 264.66 198.47 189.43 -
5 2018-19 764.66 781.23 384.94 Budget could not
be drawn fully due to freezing.
6 2019-20 0 49.61 44.95 99.23 lakhs
(vote on account)
Action Plan for the next One year (2019-20):
S.No. Particulars Target
1 Area to be brought under mulberry ( in acres) 4000
2 Mulberry cocoon Production (in MTs) 2188.800
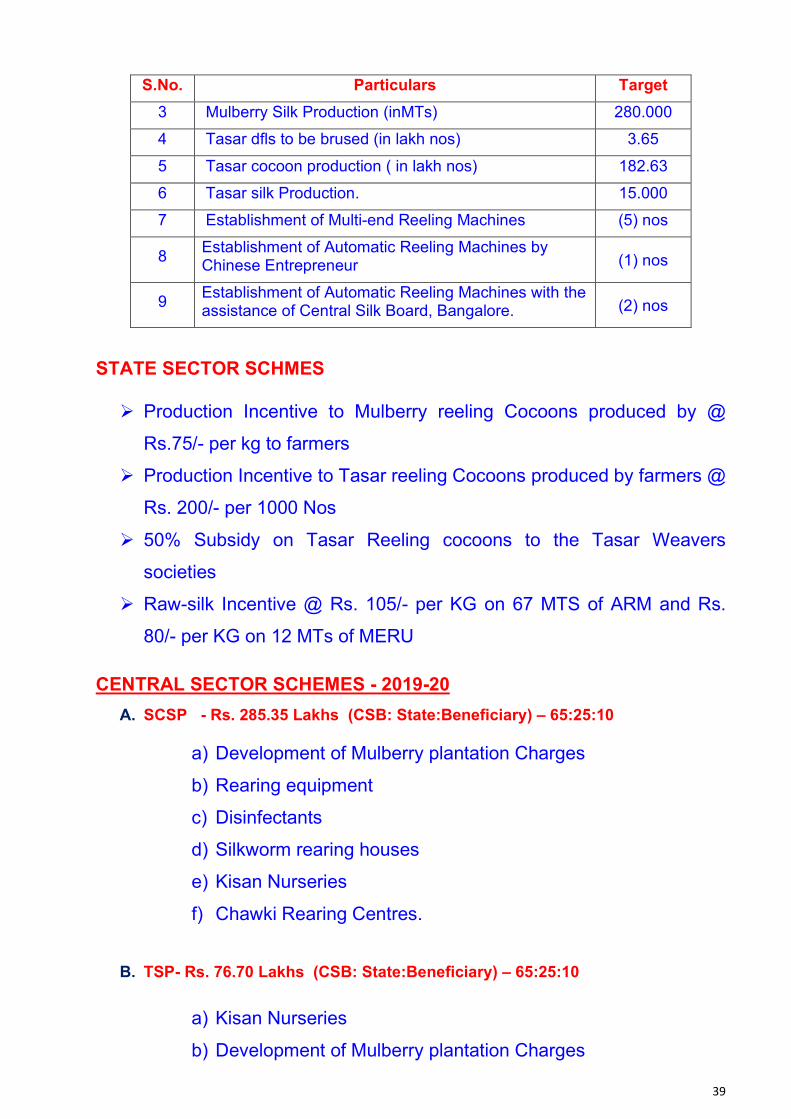
39
S.No. Particulars Target
3 Mulberry Silk Production (inMTs) 280.000
4 Tasar dfls to be brused (in lakh nos) 3.65
5 Tasar cocoon production ( in lakh nos) 182.63
6 Tasar silk Production. 15.000
7 Establishment of Multi-end Reeling Machines (5) nos
8 Establishment of Automatic Reeling Machines by Chinese Entrepreneur (1) nos
9 Establishment of Automatic Reeling Machines with the assistance of Central Silk Board, Bangalore. (2) nos
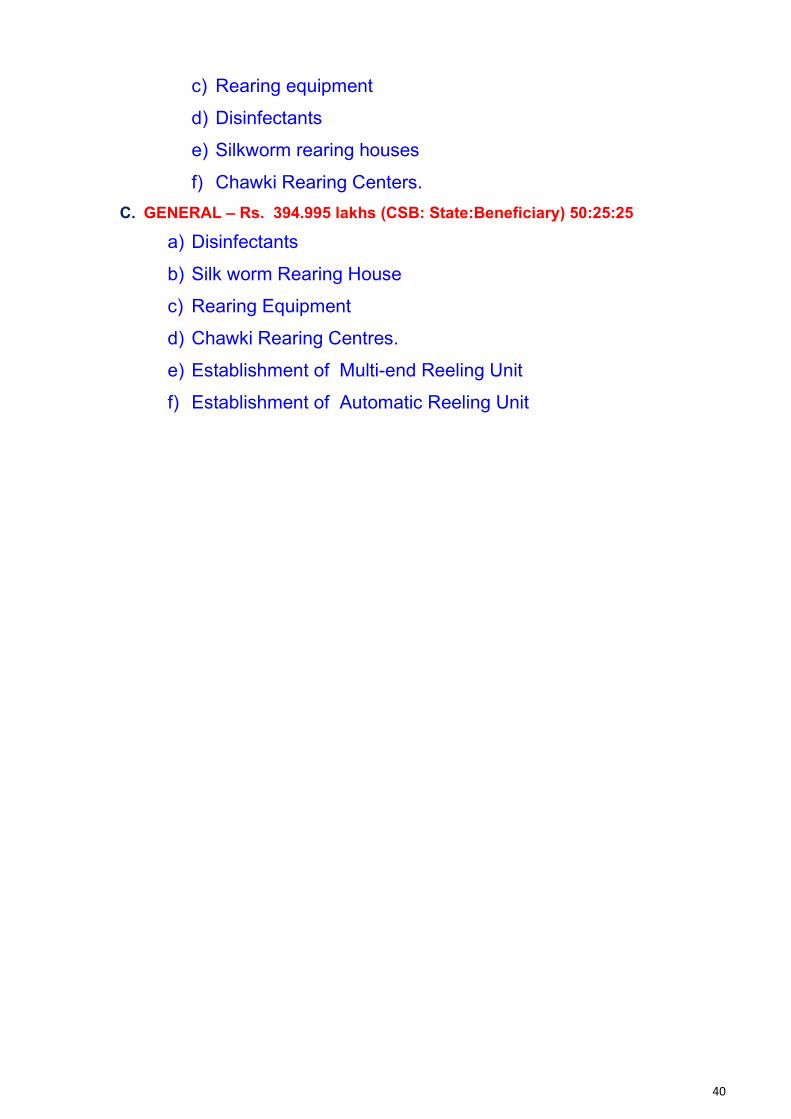
STATE SECTOR SCHMES
Production Incentive to Mulberry reeling Cocoons produced by @
Rs.75/- per kg to farmers
Production Incentive to Tasar reeling Cocoons produced by farmers @
Rs. 200/- per 1000 Nos
50% Subsidy on Tasar Reeling cocoons to the Tasar Weavers
societies
Raw-silk Incentive @ Rs. 105/- per KG on 67 MTS of ARM and Rs.
80/- per KG on 12 MTs of MERU
CENTRAL SECTOR SCHEMES - 2019-20
A. SCSP - Rs. 285.35 Lakhs (CSB: State:Beneficiary) – 65:25:10
a) Development of Mulberry plantation Charges
b) Rearing equipment
c) Disinfectants
d) Silkworm rearing houses
e) Kisan Nurseries
f) Chawki Rearing Centres.
B. TSP- Rs. 76.70 Lakhs (CSB: State:Beneficiary) – 65:25:10
a) Kisan Nurseries
b) Development of Mulberry plantation Charges
40
c) Rearing equipment
d) Disinfectants
e) Silkworm rearing houses
f) Chawki Rearing Centers.
C. GENERAL – Rs. 394.995 lakhs (CSB: State:Beneficiary) 50:25:25
a) Disinfectants
b) Silk worm Rearing House
c) Rearing Equipment
d) Chawki Rearing Centres.
e) Establishment of Multi-end Reeling Unit
f) Establishment of Automatic Reeling Unit

41
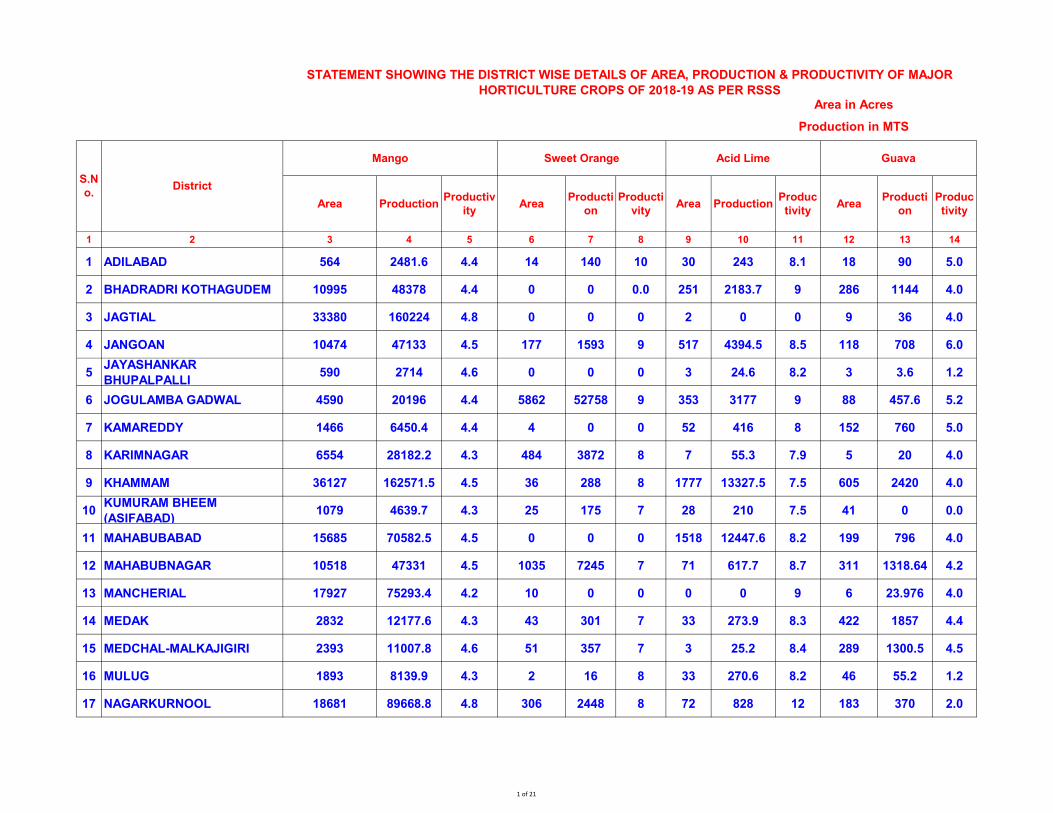
ANNEXURES
Area Production Productiv
ity Area
Producti
on
Producti
vity Area Production
Produc
tivity Area
Producti
on
Produc
tivity
1 2 3 4 5 6 7 8 9 10 11 12 13 14
1 ADILABAD 564 2481.6 4.4 14 140 10 30 243 8.1 18 90 5.0
2 BHADRADRI KOTHAGUDEM 10995 48378 4.4 0 0 0.0 251 2183.7 9 286 1144 4.0
3 JAGTIAL 33380 160224 4.8 0 0 0 2 0 0 9 36 4.0
4 JANGOAN 10474 47133 4.5 177 1593 9 517 4394.5 8.5 118 708 6.0
5JAYASHANKAR
BHUPALPALLI590 2714 4.6 0 0 0 3 24.6 8.2 3 3.6 1.2
6 JOGULAMBA GADWAL 4590 20196 4.4 5862 52758 9 353 3177 9 88 457.6 5.2
7 KAMAREDDY 1466 6450.4 4.4 4 0 0 52 416 8 152 760 5.0
8 KARIMNAGAR 6554 28182.2 4.3 484 3872 8 7 55.3 7.9 5 20 4.0
9 KHAMMAM 36127 162571.5 4.5 36 288 8 1777 13327.5 7.5 605 2420 4.0
10KUMURAM BHEEM
(ASIFABAD)1079 4639.7 4.3 25 175 7 28 210 7.5 41 0 0.0
11 MAHABUBABAD 15685 70582.5 4.5 0 0 0 1518 12447.6 8.2 199 796 4.0
12 MAHABUBNAGAR 10518 47331 4.5 1035 7245 7 71 617.7 8.7 311 1318.64 4.2
13 MANCHERIAL 17927 75293.4 4.2 10 0 0 0 0 9 6 23.976 4.0
14 MEDAK 2832 12177.6 4.3 43 301 7 33 273.9 8.3 422 1857 4.4
15 MEDCHAL-MALKAJIGIRI 2393 11007.8 4.6 51 357 7 3 25.2 8.4 289 1300.5 4.5
16 MULUG 1893 8139.9 4.3 2 16 8 33 270.6 8.2 46 55.2 1.2
17 NAGARKURNOOL 18681 89668.8 4.8 306 2448 8 72 828 12 183 370 2.0
STATEMENT SHOWING THE DISTRICT WISE DETAILS OF AREA, PRODUCTION & PRODUCTIVITY OF MAJOR
HORTICULTURE CROPS OF 2018-19 AS PER RSSSArea in Acres
Production in MTS
S.N
o.District
Mango Sweet Orange Acid Lime Guava
1 of 21
Area Production Productiv
ity Area
Producti
on
Producti
vity Area Production
Produc
tivity Area
Producti
on
Produc
tivity
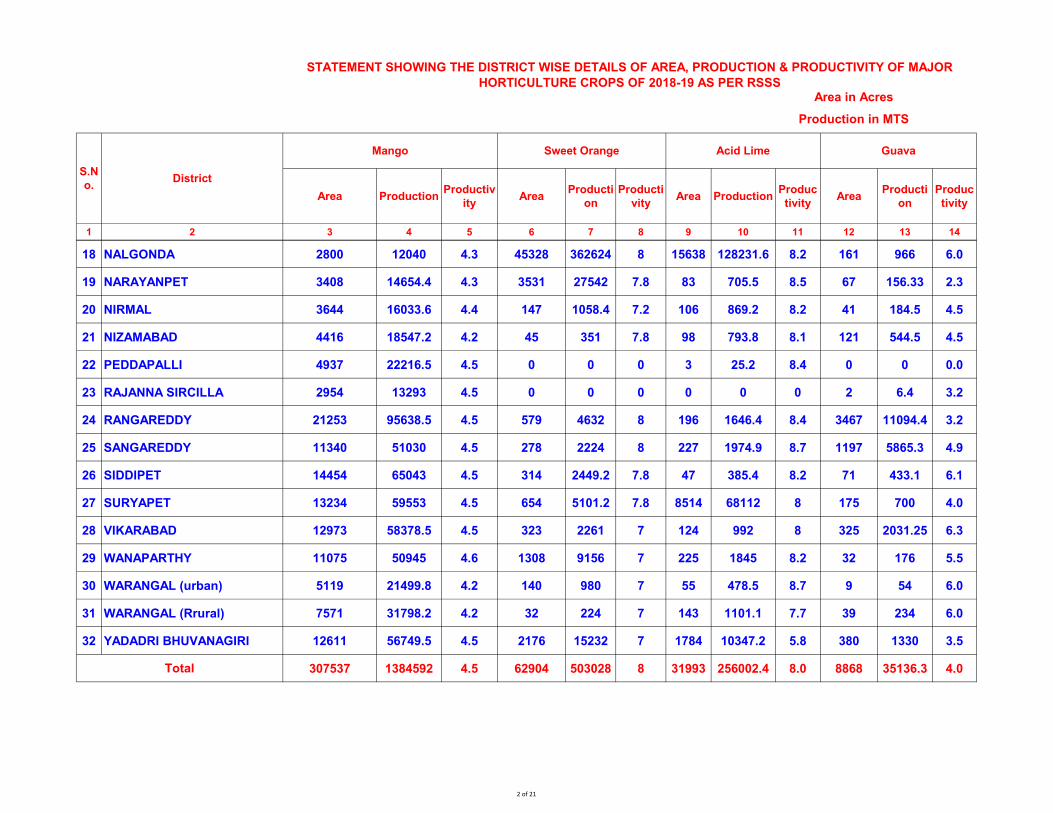
1 2 3 4 5 6 7 8 9 10 11 12 13 14
STATEMENT SHOWING THE DISTRICT WISE DETAILS OF AREA, PRODUCTION & PRODUCTIVITY OF MAJOR
HORTICULTURE CROPS OF 2018-19 AS PER RSSSArea in Acres
Production in MTS
S.N
o.District
Mango Sweet Orange Acid Lime Guava
18 NALGONDA 2800 12040 4.3 45328 362624 8 15638 128231.6 8.2 161 966 6.0
19 NARAYANPET 3408 14654.4 4.3 3531 27542 7.8 83 705.5 8.5 67 156.33 2.3
20 NIRMAL 3644 16033.6 4.4 147 1058.4 7.2 106 869.2 8.2 41 184.5 4.5
21 NIZAMABAD 4416 18547.2 4.2 45 351 7.8 98 793.8 8.1 121 544.5 4.5
22 PEDDAPALLI 4937 22216.5 4.5 0 0 0 3 25.2 8.4 0 0 0.0
23 RAJANNA SIRCILLA 2954 13293 4.5 0 0 0 0 0 0 2 6.4 3.2
24 RANGAREDDY 21253 95638.5 4.5 579 4632 8 196 1646.4 8.4 3467 11094.4 3.2
25 SANGAREDDY 11340 51030 4.5 278 2224 8 227 1974.9 8.7 1197 5865.3 4.9
26 SIDDIPET 14454 65043 4.5 314 2449.2 7.8 47 385.4 8.2 71 433.1 6.1
27 SURYAPET 13234 59553 4.5 654 5101.2 7.8 8514 68112 8 175 700 4.0
28 VIKARABAD 12973 58378.5 4.5 323 2261 7 124 992 8 325 2031.25 6.3
29 WANAPARTHY 11075 50945 4.6 1308 9156 7 225 1845 8.2 32 176 5.5
30 WARANGAL (urban) 5119 21499.8 4.2 140 980 7 55 478.5 8.7 9 54 6.0
31 WARANGAL (Rrural) 7571 31798.2 4.2 32 224 7 143 1101.1 7.7 39 234 6.0
32 YADADRI BHUVANAGIRI 12611 56749.5 4.5 2176 15232 7 1784 10347.2 5.8 380 1330 3.5
307537 1384592 4.5 62904 503028 8 31993 256002.4 8.0 8868 35136.3 4.0Total
2 of 21
1 2
1 ADILABAD
2 BHADRADRI KOTHAGUDEM
3 JAGTIAL
4 JANGOAN
5JAYASHANKAR
BHUPALPALLI
6 JOGULAMBA GADWAL
7 KAMAREDDY
8 KARIMNAGAR
9 KHAMMAM
10KUMURAM BHEEM
(ASIFABAD)
11 MAHABUBABAD
12 MAHABUBNAGAR
13 MANCHERIAL
14 MEDAK
15 MEDCHAL-MALKAJIGIRI
16 MULUG
17 NAGARKURNOOL
S.N
o.District
Area Production Producti
vity Area
Productio
n Area Production Area
Productio
n
Producti
vity Area
Producti
on
Producti
vity
15 16 17 18 19 20 21 22 23 24 25 26 27
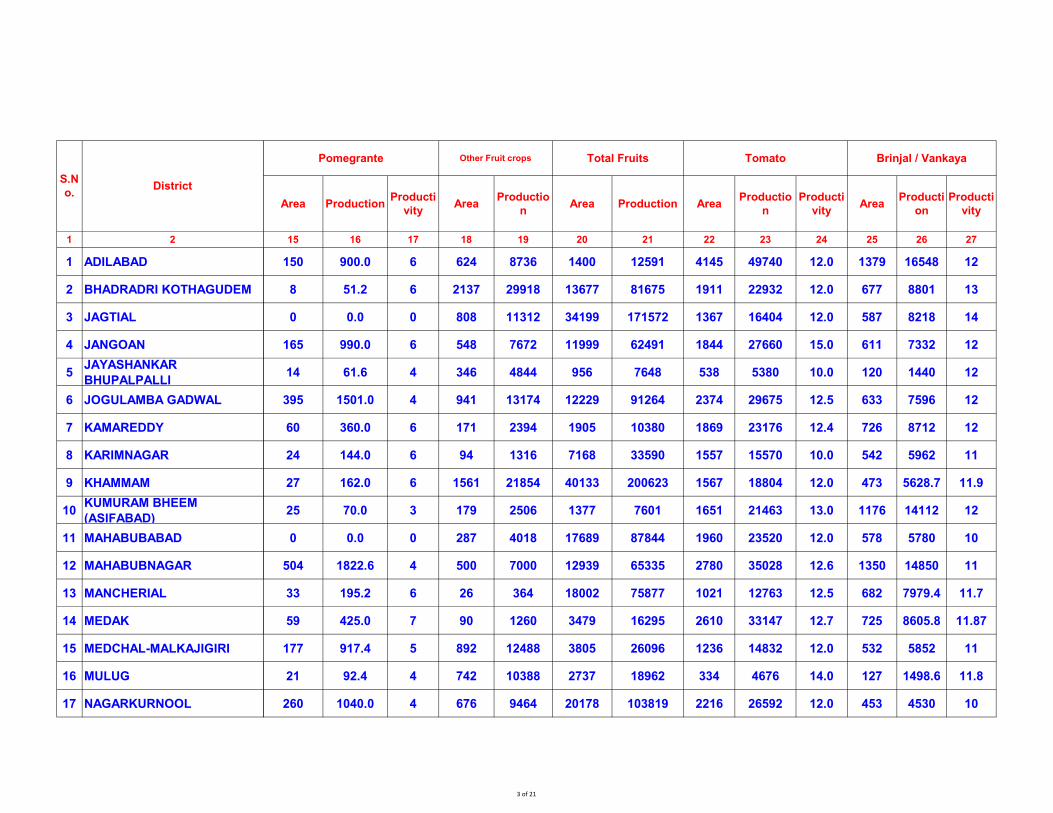
150 900.0 6 624 8736 1400 12591 4145 49740 12.0 1379 16548 12
8 51.2 6 2137 29918 13677 81675 1911 22932 12.0 677 8801 13
0 0.0 0 808 11312 34199 171572 1367 16404 12.0 587 8218 14
165 990.0 6 548 7672 11999 62491 1844 27660 15.0 611 7332 12
14 61.6 4 346 4844 956 7648 538 5380 10.0 120 1440 12
395 1501.0 4 941 13174 12229 91264 2374 29675 12.5 633 7596 12
60 360.0 6 171 2394 1905 10380 1869 23176 12.4 726 8712 12
24 144.0 6 94 1316 7168 33590 1557 15570 10.0 542 5962 11
27 162.0 6 1561 21854 40133 200623 1567 18804 12.0 473 5628.7 11.9
25 70.0 3 179 2506 1377 7601 1651 21463 13.0 1176 14112 12
0 0.0 0 287 4018 17689 87844 1960 23520 12.0 578 5780 10
504 1822.6 4 500 7000 12939 65335 2780 35028 12.6 1350 14850 11
33 195.2 6 26 364 18002 75877 1021 12763 12.5 682 7979.4 11.7
59 425.0 7 90 1260 3479 16295 2610 33147 12.7 725 8605.8 11.87
177 917.4 5 892 12488 3805 26096 1236 14832 12.0 532 5852 11
21 92.4 4 742 10388 2737 18962 334 4676 14.0 127 1498.6 11.8
260 1040.0 4 676 9464 20178 103819 2216 26592 12.0 453 4530 10
Pomegrante Other Fruit crops Total Fruits Tomato Brinjal / Vankaya
3 of 21
1 2
S.N
o.District
18 NALGONDA
19 NARAYANPET
20 NIRMAL
21 NIZAMABAD
22 PEDDAPALLI
23 RAJANNA SIRCILLA
24 RANGAREDDY
25 SANGAREDDY
26 SIDDIPET
27 SURYAPET
28 VIKARABAD
29 WANAPARTHY
30 WARANGAL (urban)
31 WARANGAL (Rrural)
32 YADADRI BHUVANAGIRI
Total
Area Production Producti
vity Area
Productio
n Area Production Area
Productio
n
Producti
vity Area
Producti
on
Producti
vity
15 16 17 18 19 20 21 22 23 24 25 26 27
Pomegrante Other Fruit crops Total Fruits Tomato Brinjal / Vankaya
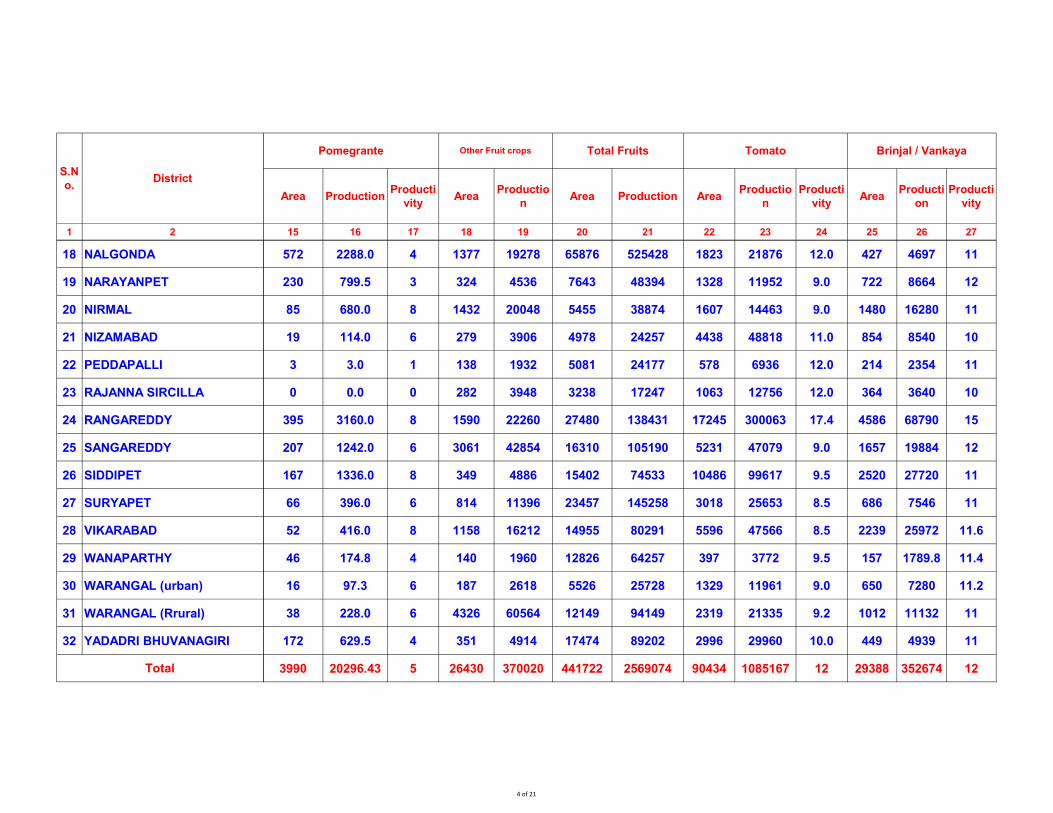
572 2288.0 4 1377 19278 65876 525428 1823 21876 12.0 427 4697 11
230 799.5 3 324 4536 7643 48394 1328 11952 9.0 722 8664 12
85 680.0 8 1432 20048 5455 38874 1607 14463 9.0 1480 16280 11
19 114.0 6 279 3906 4978 24257 4438 48818 11.0 854 8540 10
3 3.0 1 138 1932 5081 24177 578 6936 12.0 214 2354 11
0 0.0 0 282 3948 3238 17247 1063 12756 12.0 364 3640 10
395 3160.0 8 1590 22260 27480 138431 17245 300063 17.4 4586 68790 15
207 1242.0 6 3061 42854 16310 105190 5231 47079 9.0 1657 19884 12
167 1336.0 8 349 4886 15402 74533 10486 99617 9.5 2520 27720 11
66 396.0 6 814 11396 23457 145258 3018 25653 8.5 686 7546 11
52 416.0 8 1158 16212 14955 80291 5596 47566 8.5 2239 25972 11.6
46 174.8 4 140 1960 12826 64257 397 3772 9.5 157 1789.8 11.4
16 97.3 6 187 2618 5526 25728 1329 11961 9.0 650 7280 11.2
38 228.0 6 4326 60564 12149 94149 2319 21335 9.2 1012 11132 11
172 629.5 4 351 4914 17474 89202 2996 29960 10.0 449 4939 11
3990 20296.43 5 26430 370020 441722 2569074 90434 1085167 12 29388 352674 12
4 of 21
1 2
1 ADILABAD
2 BHADRADRI KOTHAGUDEM
3 JAGTIAL
4 JANGOAN
5JAYASHANKAR
BHUPALPALLI
6 JOGULAMBA GADWAL
7 KAMAREDDY
8 KARIMNAGAR
9 KHAMMAM
10KUMURAM BHEEM
(ASIFABAD)
11 MAHABUBABAD
12 MAHABUBNAGAR
13 MANCHERIAL
14 MEDAK
15 MEDCHAL-MALKAJIGIRI
16 MULUG
17 NAGARKURNOOL
S.N
o.District
Area Production Produc
tivity Area
Productio
n
Productivit
y Area Production
Productivit
y Area Production
Productivit
y
28 29 30 31 32 33 34 35 36 37 38 39
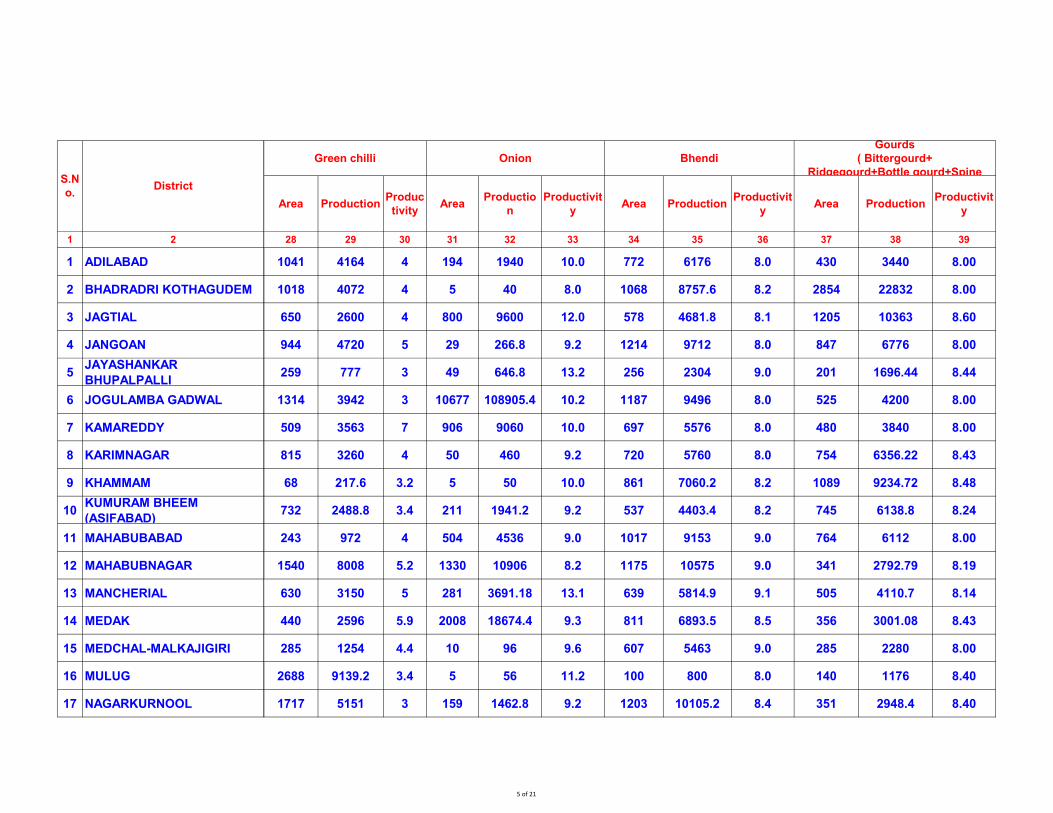
1041 4164 4 194 1940 10.0 772 6176 8.0 430 3440 8.00
1018 4072 4 5 40 8.0 1068 8757.6 8.2 2854 22832 8.00
650 2600 4 800 9600 12.0 578 4681.8 8.1 1205 10363 8.60
944 4720 5 29 266.8 9.2 1214 9712 8.0 847 6776 8.00
259 777 3 49 646.8 13.2 256 2304 9.0 201 1696.44 8.44
1314 3942 3 10677 108905.4 10.2 1187 9496 8.0 525 4200 8.00
509 3563 7 906 9060 10.0 697 5576 8.0 480 3840 8.00
815 3260 4 50 460 9.2 720 5760 8.0 754 6356.22 8.43
68 217.6 3.2 5 50 10.0 861 7060.2 8.2 1089 9234.72 8.48
732 2488.8 3.4 211 1941.2 9.2 537 4403.4 8.2 745 6138.8 8.24
243 972 4 504 4536 9.0 1017 9153 9.0 764 6112 8.00
1540 8008 5.2 1330 10906 8.2 1175 10575 9.0 341 2792.79 8.19
630 3150 5 281 3691.18 13.1 639 5814.9 9.1 505 4110.7 8.14
440 2596 5.9 2008 18674.4 9.3 811 6893.5 8.5 356 3001.08 8.43
285 1254 4.4 10 96 9.6 607 5463 9.0 285 2280 8.00
2688 9139.2 3.4 5 56 11.2 100 800 8.0 140 1176 8.40
1717 5151 3 159 1462.8 9.2 1203 10105.2 8.4 351 2948.4 8.40
Bhendi
Gourds
( Bittergourd+
Ridgegourd+Bottle gourd+Spine
Onion Green chilli
5 of 21
1 2
S.N
o.District
18 NALGONDA
19 NARAYANPET
20 NIRMAL
21 NIZAMABAD
22 PEDDAPALLI
23 RAJANNA SIRCILLA
24 RANGAREDDY
25 SANGAREDDY
26 SIDDIPET
27 SURYAPET
28 VIKARABAD
29 WANAPARTHY
30 WARANGAL (urban)
31 WARANGAL (Rrural)
32 YADADRI BHUVANAGIRI
Total
Area Production Produc
tivity Area
Productio
n
Productivit
y Area Production
Productivit
y Area Production
Productivit
y
28 29 30 31 32 33 34 35 36 37 38 39
Bhendi
Gourds
( Bittergourd+
Ridgegourd+Bottle gourd+Spine
Onion Green chilli
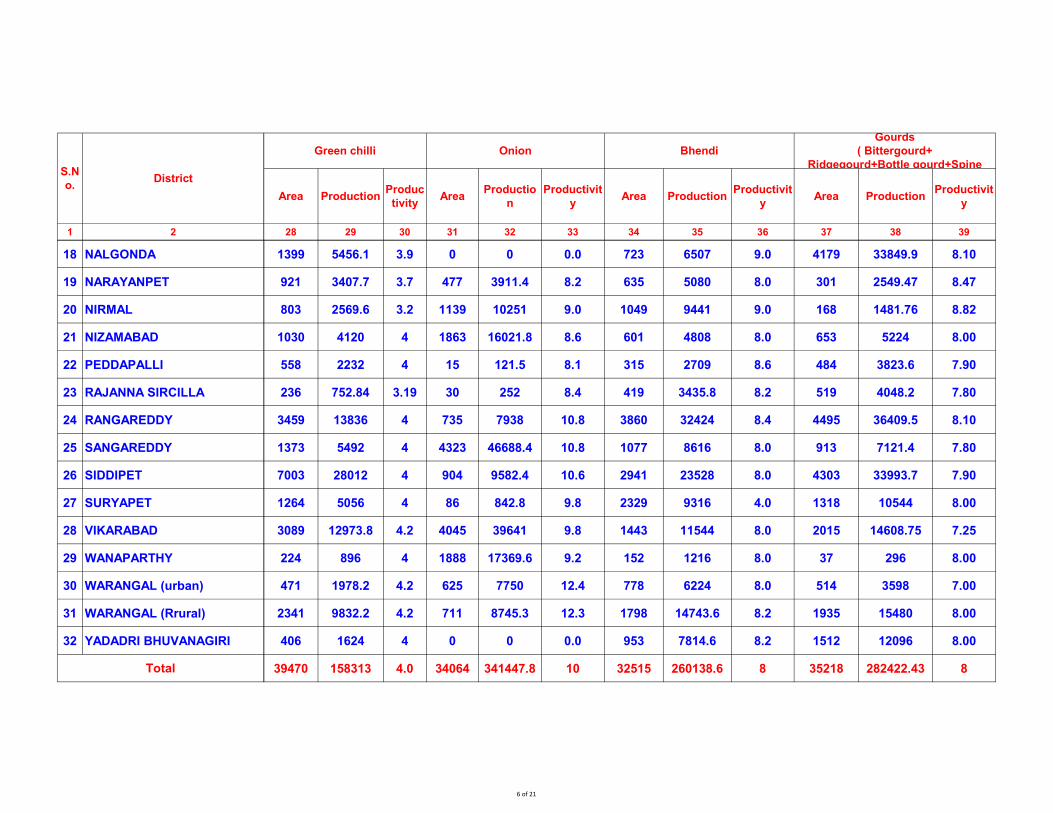
1399 5456.1 3.9 0 0 0.0 723 6507 9.0 4179 33849.9 8.10
921 3407.7 3.7 477 3911.4 8.2 635 5080 8.0 301 2549.47 8.47
803 2569.6 3.2 1139 10251 9.0 1049 9441 9.0 168 1481.76 8.82
1030 4120 4 1863 16021.8 8.6 601 4808 8.0 653 5224 8.00
558 2232 4 15 121.5 8.1 315 2709 8.6 484 3823.6 7.90
236 752.84 3.19 30 252 8.4 419 3435.8 8.2 519 4048.2 7.80
3459 13836 4 735 7938 10.8 3860 32424 8.4 4495 36409.5 8.10
1373 5492 4 4323 46688.4 10.8 1077 8616 8.0 913 7121.4 7.80
7003 28012 4 904 9582.4 10.6 2941 23528 8.0 4303 33993.7 7.90
1264 5056 4 86 842.8 9.8 2329 9316 4.0 1318 10544 8.00
3089 12973.8 4.2 4045 39641 9.8 1443 11544 8.0 2015 14608.75 7.25
224 896 4 1888 17369.6 9.2 152 1216 8.0 37 296 8.00
471 1978.2 4.2 625 7750 12.4 778 6224 8.0 514 3598 7.00
2341 9832.2 4.2 711 8745.3 12.3 1798 14743.6 8.2 1935 15480 8.00
406 1624 4 0 0 0.0 953 7814.6 8.2 1512 12096 8.00
39470 158313 4.0 34064 341447.8 10 32515 260138.6 8 35218 282422.43 8
6 of 21
1 2
1 ADILABAD
2 BHADRADRI KOTHAGUDEM
3 JAGTIAL
4 JANGOAN
5JAYASHANKAR
BHUPALPALLI
6 JOGULAMBA GADWAL
7 KAMAREDDY
8 KARIMNAGAR
9 KHAMMAM
10KUMURAM BHEEM
(ASIFABAD)
11 MAHABUBABAD
12 MAHABUBNAGAR
13 MANCHERIAL
14 MEDAK
15 MEDCHAL-MALKAJIGIRI
16 MULUG
17 NAGARKURNOOL
S.N
o.District
AreaProducti
on Area Production Area
Productio
n Productivity Area Production
Productivit
y
40 41 42 43 44 45 46 47 48 49
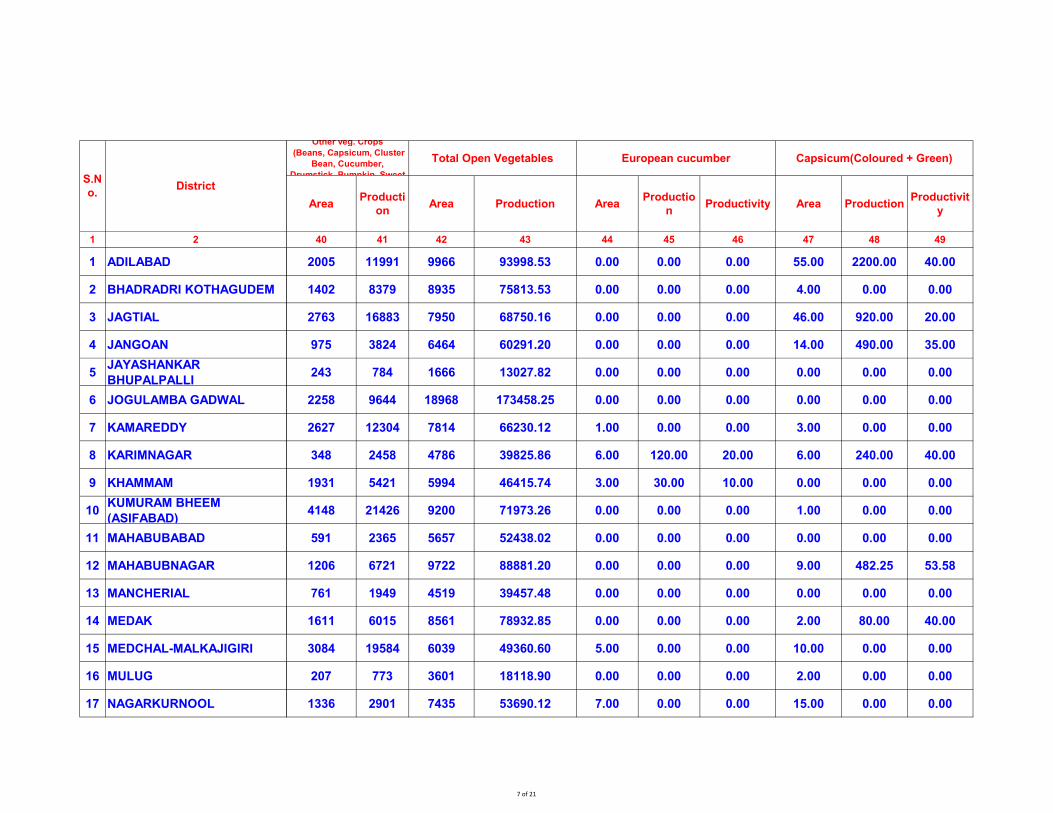
2005 11991 9966 93998.53 0.00 0.00 0.00 55.00 2200.00 40.00
1402 8379 8935 75813.53 0.00 0.00 0.00 4.00 0.00 0.00
2763 16883 7950 68750.16 0.00 0.00 0.00 46.00 920.00 20.00
975 3824 6464 60291.20 0.00 0.00 0.00 14.00 490.00 35.00
243 784 1666 13027.82 0.00 0.00 0.00 0.00 0.00 0.00
2258 9644 18968 173458.25 0.00 0.00 0.00 0.00 0.00 0.00
2627 12304 7814 66230.12 1.00 0.00 0.00 3.00 0.00 0.00
348 2458 4786 39825.86 6.00 120.00 20.00 6.00 240.00 40.00
1931 5421 5994 46415.74 3.00 30.00 10.00 0.00 0.00 0.00
4148 21426 9200 71973.26 0.00 0.00 0.00 1.00 0.00 0.00
591 2365 5657 52438.02 0.00 0.00 0.00 0.00 0.00 0.00
1206 6721 9722 88881.20 0.00 0.00 0.00 9.00 482.25 53.58
761 1949 4519 39457.48 0.00 0.00 0.00 0.00 0.00 0.00
1611 6015 8561 78932.85 0.00 0.00 0.00 2.00 80.00 40.00
3084 19584 6039 49360.60 5.00 0.00 0.00 10.00 0.00 0.00
207 773 3601 18118.90 0.00 0.00 0.00 2.00 0.00 0.00
1336 2901 7435 53690.12 7.00 0.00 0.00 15.00 0.00 0.00
Other veg. Crops
(Beans, Capsicum, Cluster
Bean, Cucumber,
Drumstick, Pumpkin, Sweet
Total Open Vegetables European cucumber Capsicum(Coloured + Green)
7 of 21
1 2
S.N
o.District
18 NALGONDA
19 NARAYANPET
20 NIRMAL
21 NIZAMABAD
22 PEDDAPALLI
23 RAJANNA SIRCILLA
24 RANGAREDDY
25 SANGAREDDY
26 SIDDIPET
27 SURYAPET
28 VIKARABAD
29 WANAPARTHY
30 WARANGAL (urban)
31 WARANGAL (Rrural)
32 YADADRI BHUVANAGIRI
Total
AreaProducti
on Area Production Area
Productio
n Productivity Area Production
Productivit
y
40 41 42 43 44 45 46 47 48 49
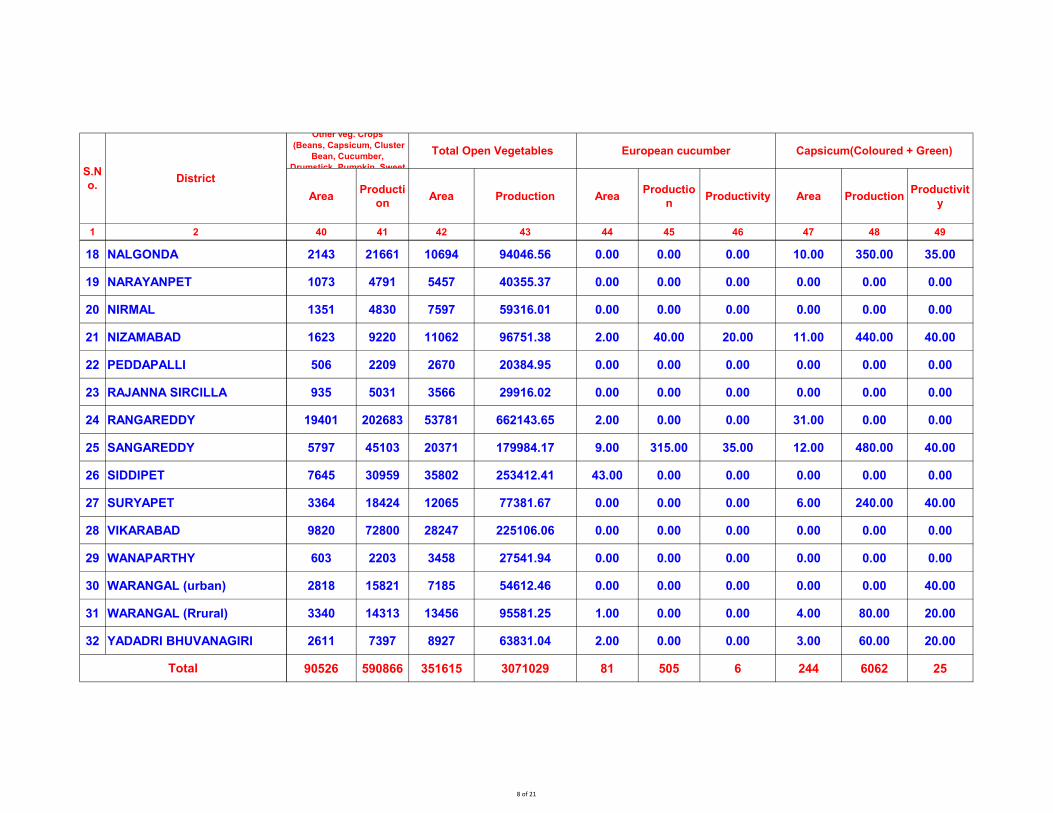
Other veg. Crops
(Beans, Capsicum, Cluster
Bean, Cucumber,
Drumstick, Pumpkin, Sweet
Total Open Vegetables European cucumber Capsicum(Coloured + Green)
2143 21661 10694 94046.56 0.00 0.00 0.00 10.00 350.00 35.00
1073 4791 5457 40355.37 0.00 0.00 0.00 0.00 0.00 0.00
1351 4830 7597 59316.01 0.00 0.00 0.00 0.00 0.00 0.00
1623 9220 11062 96751.38 2.00 40.00 20.00 11.00 440.00 40.00
506 2209 2670 20384.95 0.00 0.00 0.00 0.00 0.00 0.00
935 5031 3566 29916.02 0.00 0.00 0.00 0.00 0.00 0.00
19401 202683 53781 662143.65 2.00 0.00 0.00 31.00 0.00 0.00
5797 45103 20371 179984.17 9.00 315.00 35.00 12.00 480.00 40.00
7645 30959 35802 253412.41 43.00 0.00 0.00 0.00 0.00 0.00
3364 18424 12065 77381.67 0.00 0.00 0.00 6.00 240.00 40.00
9820 72800 28247 225106.06 0.00 0.00 0.00 0.00 0.00 0.00
603 2203 3458 27541.94 0.00 0.00 0.00 0.00 0.00 0.00
2818 15821 7185 54612.46 0.00 0.00 0.00 0.00 0.00 40.00
3340 14313 13456 95581.25 1.00 0.00 0.00 4.00 80.00 20.00
2611 7397 8927 63831.04 2.00 0.00 0.00 3.00 60.00 20.00
90526 590866 351615 3071029 81 505 6 244 6062 25
8 of 21
1 2
1 ADILABAD
2 BHADRADRI KOTHAGUDEM
3 JAGTIAL
4 JANGOAN
5JAYASHANKAR
BHUPALPALLI
6 JOGULAMBA GADWAL
7 KAMAREDDY
8 KARIMNAGAR
9 KHAMMAM
10KUMURAM BHEEM
(ASIFABAD)
11 MAHABUBABAD
12 MAHABUBNAGAR
13 MANCHERIAL
14 MEDAK
15 MEDCHAL-MALKAJIGIRI
16 MULUG
17 NAGARKURNOOL
S.N
o.District
AreaProductio
n Area Production Area Production Area Production Productivity
50 51 52 53 54 55 56 57 58
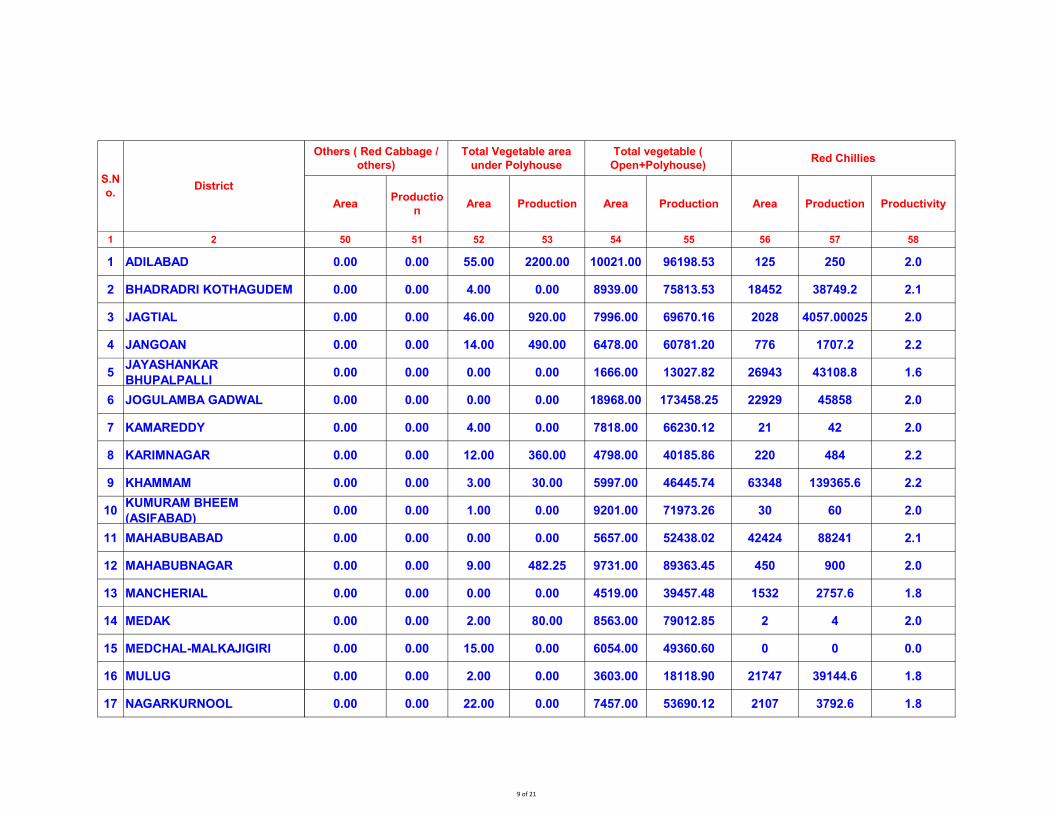
0.00 0.00 55.00 2200.00 10021.00 96198.53 125 250 2.0
0.00 0.00 4.00 0.00 8939.00 75813.53 18452 38749.2 2.1
0.00 0.00 46.00 920.00 7996.00 69670.16 2028 4057.00025 2.0
0.00 0.00 14.00 490.00 6478.00 60781.20 776 1707.2 2.2
0.00 0.00 0.00 0.00 1666.00 13027.82 26943 43108.8 1.6
0.00 0.00 0.00 0.00 18968.00 173458.25 22929 45858 2.0
0.00 0.00 4.00 0.00 7818.00 66230.12 21 42 2.0
0.00 0.00 12.00 360.00 4798.00 40185.86 220 484 2.2
0.00 0.00 3.00 30.00 5997.00 46445.74 63348 139365.6 2.2
0.00 0.00 1.00 0.00 9201.00 71973.26 30 60 2.0
0.00 0.00 0.00 0.00 5657.00 52438.02 42424 88241 2.1
0.00 0.00 9.00 482.25 9731.00 89363.45 450 900 2.0
0.00 0.00 0.00 0.00 4519.00 39457.48 1532 2757.6 1.8
0.00 0.00 2.00 80.00 8563.00 79012.85 2 4 2.0
0.00 0.00 15.00 0.00 6054.00 49360.60 0 0 0.0
0.00 0.00 2.00 0.00 3603.00 18118.90 21747 39144.6 1.8
0.00 0.00 22.00 0.00 7457.00 53690.12 2107 3792.6 1.8
Others ( Red Cabbage /
others)
Total Vegetable area
under Polyhouse
Total vegetable (
Open+Polyhouse)Red Chillies
9 of 21
1 2
S.N
o.District
18 NALGONDA
19 NARAYANPET
20 NIRMAL
21 NIZAMABAD
22 PEDDAPALLI
23 RAJANNA SIRCILLA
24 RANGAREDDY
25 SANGAREDDY
26 SIDDIPET
27 SURYAPET
28 VIKARABAD
29 WANAPARTHY
30 WARANGAL (urban)
31 WARANGAL (Rrural)
32 YADADRI BHUVANAGIRI
Total
AreaProductio
n Area Production Area Production Area Production Productivity
50 51 52 53 54 55 56 57 58
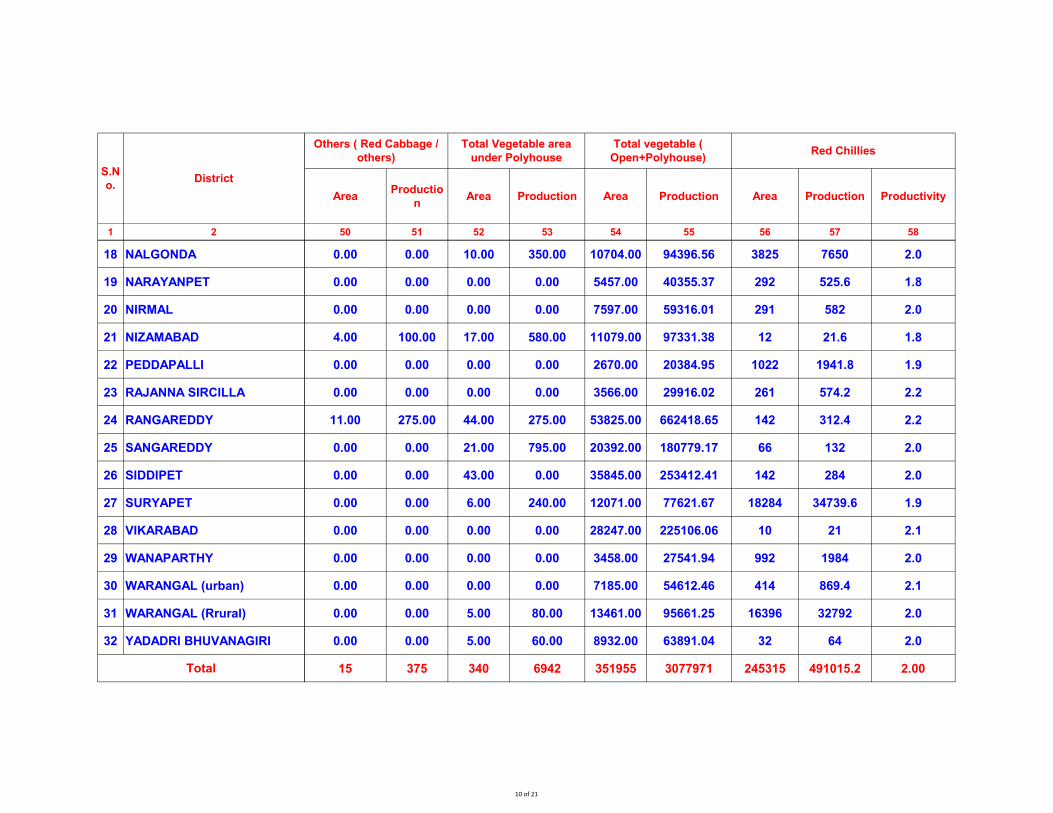
Others ( Red Cabbage /
others)
Total Vegetable area
under Polyhouse
Total vegetable (
Open+Polyhouse)Red Chillies
0.00 0.00 10.00 350.00 10704.00 94396.56 3825 7650 2.0
0.00 0.00 0.00 0.00 5457.00 40355.37 292 525.6 1.8
0.00 0.00 0.00 0.00 7597.00 59316.01 291 582 2.0
4.00 100.00 17.00 580.00 11079.00 97331.38 12 21.6 1.8
0.00 0.00 0.00 0.00 2670.00 20384.95 1022 1941.8 1.9
0.00 0.00 0.00 0.00 3566.00 29916.02 261 574.2 2.2
11.00 275.00 44.00 275.00 53825.00 662418.65 142 312.4 2.2
0.00 0.00 21.00 795.00 20392.00 180779.17 66 132 2.0
0.00 0.00 43.00 0.00 35845.00 253412.41 142 284 2.0
0.00 0.00 6.00 240.00 12071.00 77621.67 18284 34739.6 1.9
0.00 0.00 0.00 0.00 28247.00 225106.06 10 21 2.1
0.00 0.00 0.00 0.00 3458.00 27541.94 992 1984 2.0
0.00 0.00 0.00 0.00 7185.00 54612.46 414 869.4 2.1
0.00 0.00 5.00 80.00 13461.00 95661.25 16396 32792 2.0
0.00 0.00 5.00 60.00 8932.00 63891.04 32 64 2.0
15 375 340 6942 351955 3077971 245315 491015.2 2.00
10 of 21
1 2
1 ADILABAD
2 BHADRADRI KOTHAGUDEM
3 JAGTIAL
4 JANGOAN
5JAYASHANKAR
BHUPALPALLI
6 JOGULAMBA GADWAL
7 KAMAREDDY
8 KARIMNAGAR
9 KHAMMAM
10KUMURAM BHEEM
(ASIFABAD)
11 MAHABUBABAD
12 MAHABUBNAGAR
13 MANCHERIAL
14 MEDAK
15 MEDCHAL-MALKAJIGIRI
16 MULUG
17 NAGARKURNOOL
S.N
o.District
AreaProductio
n
Producti
vity Area Production Area Production Area Production
Productivit
y
59 60 61 62 63 64 65 66 67 68
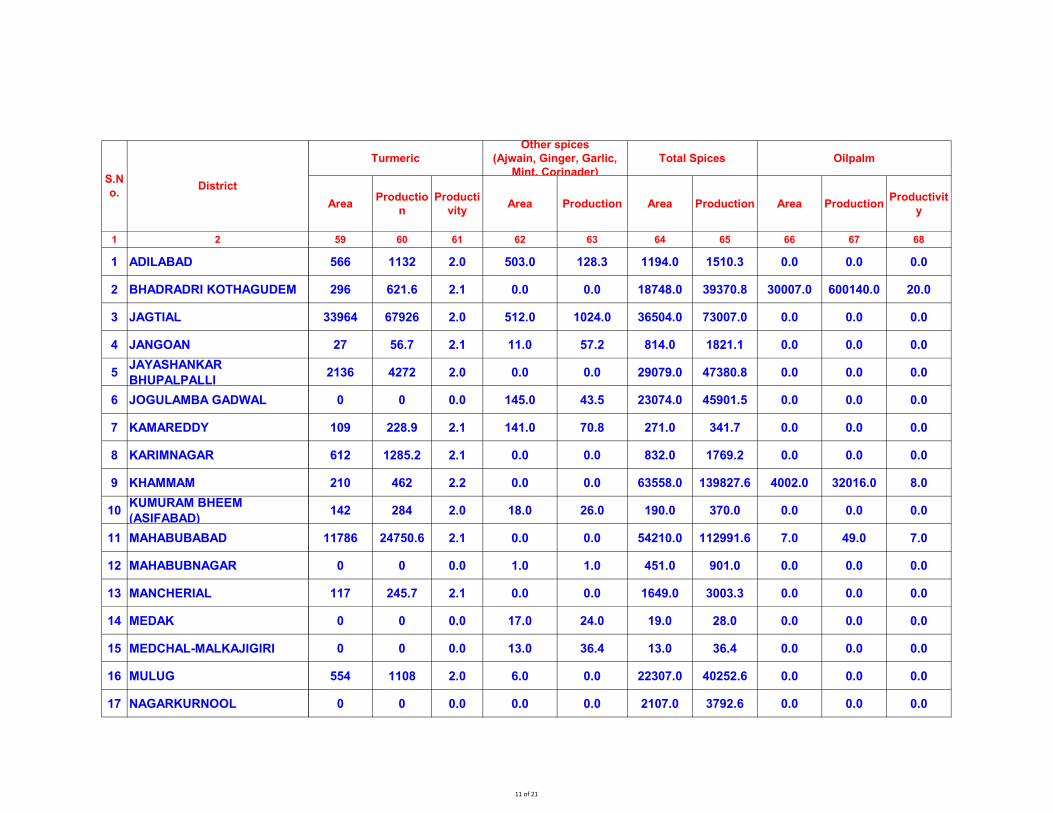
566 1132 2.0 503.0 128.3 1194.0 1510.3 0.0 0.0 0.0
296 621.6 2.1 0.0 0.0 18748.0 39370.8 30007.0 600140.0 20.0
33964 67926 2.0 512.0 1024.0 36504.0 73007.0 0.0 0.0 0.0
27 56.7 2.1 11.0 57.2 814.0 1821.1 0.0 0.0 0.0
2136 4272 2.0 0.0 0.0 29079.0 47380.8 0.0 0.0 0.0
0 0 0.0 145.0 43.5 23074.0 45901.5 0.0 0.0 0.0
109 228.9 2.1 141.0 70.8 271.0 341.7 0.0 0.0 0.0
612 1285.2 2.1 0.0 0.0 832.0 1769.2 0.0 0.0 0.0
210 462 2.2 0.0 0.0 63558.0 139827.6 4002.0 32016.0 8.0
142 284 2.0 18.0 26.0 190.0 370.0 0.0 0.0 0.0
11786 24750.6 2.1 0.0 0.0 54210.0 112991.6 7.0 49.0 7.0
0 0 0.0 1.0 1.0 451.0 901.0 0.0 0.0 0.0
117 245.7 2.1 0.0 0.0 1649.0 3003.3 0.0 0.0 0.0
0 0 0.0 17.0 24.0 19.0 28.0 0.0 0.0 0.0
0 0 0.0 13.0 36.4 13.0 36.4 0.0 0.0 0.0
554 1108 2.0 6.0 0.0 22307.0 40252.6 0.0 0.0 0.0
0 0 0.0 0.0 0.0 2107.0 3792.6 0.0 0.0 0.0
Total Spices Oilpalm
Other spices
(Ajwain, Ginger, Garlic,
Mint, Corinader)
Turmeric
11 of 21
1 2
S.N
o.District
18 NALGONDA
19 NARAYANPET
20 NIRMAL
21 NIZAMABAD
22 PEDDAPALLI
23 RAJANNA SIRCILLA
24 RANGAREDDY
25 SANGAREDDY
26 SIDDIPET
27 SURYAPET
28 VIKARABAD
29 WANAPARTHY
30 WARANGAL (urban)
31 WARANGAL (Rrural)
32 YADADRI BHUVANAGIRI
Total
AreaProductio
n
Producti
vity Area Production Area Production Area Production
Productivit
y
59 60 61 62 63 64 65 66 67 68
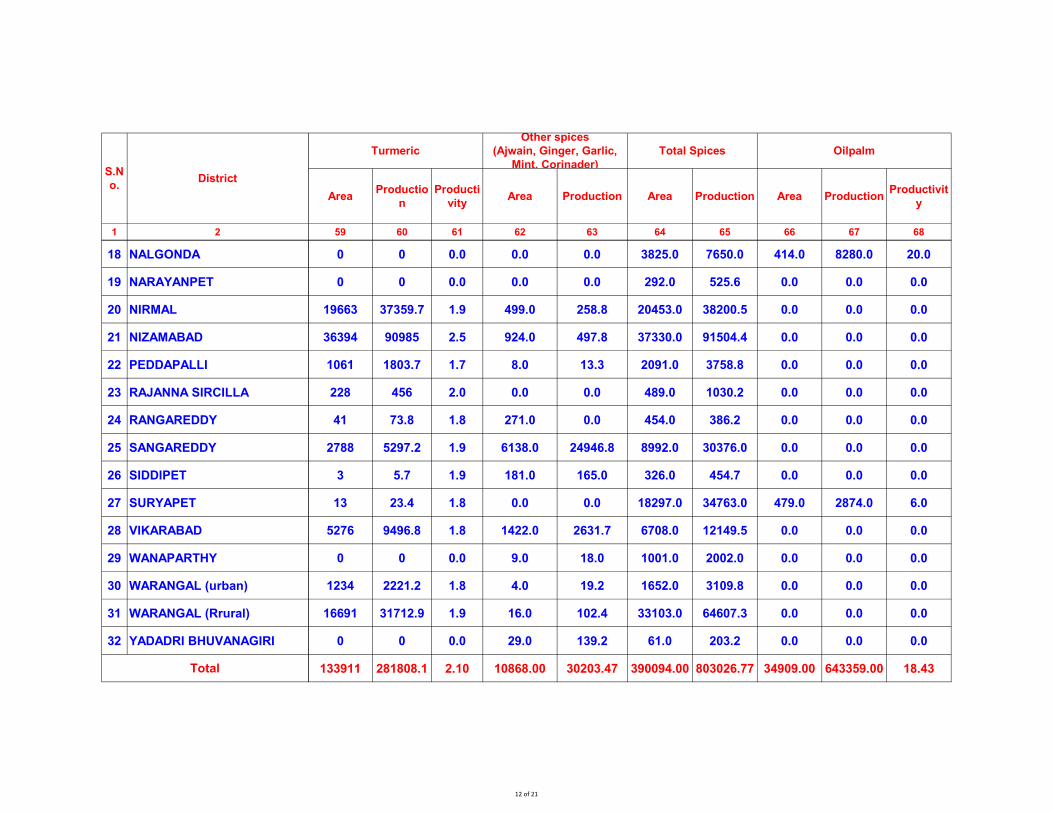
Total Spices Oilpalm
Other spices
(Ajwain, Ginger, Garlic,
Mint, Corinader)
Turmeric
0 0 0.0 0.0 0.0 3825.0 7650.0 414.0 8280.0 20.0
0 0 0.0 0.0 0.0 292.0 525.6 0.0 0.0 0.0
19663 37359.7 1.9 499.0 258.8 20453.0 38200.5 0.0 0.0 0.0
36394 90985 2.5 924.0 497.8 37330.0 91504.4 0.0 0.0 0.0
1061 1803.7 1.7 8.0 13.3 2091.0 3758.8 0.0 0.0 0.0
228 456 2.0 0.0 0.0 489.0 1030.2 0.0 0.0 0.0
41 73.8 1.8 271.0 0.0 454.0 386.2 0.0 0.0 0.0
2788 5297.2 1.9 6138.0 24946.8 8992.0 30376.0 0.0 0.0 0.0
3 5.7 1.9 181.0 165.0 326.0 454.7 0.0 0.0 0.0
13 23.4 1.8 0.0 0.0 18297.0 34763.0 479.0 2874.0 6.0
5276 9496.8 1.8 1422.0 2631.7 6708.0 12149.5 0.0 0.0 0.0
0 0 0.0 9.0 18.0 1001.0 2002.0 0.0 0.0 0.0
1234 2221.2 1.8 4.0 19.2 1652.0 3109.8 0.0 0.0 0.0
16691 31712.9 1.9 16.0 102.4 33103.0 64607.3 0.0 0.0 0.0
0 0 0.0 29.0 139.2 61.0 203.2 0.0 0.0 0.0
133911 281808.1 2.10 10868.00 30203.47 390094.00 803026.77 34909.00 643359.00 18.43
12 of 21
1 2
1 ADILABAD
2 BHADRADRI KOTHAGUDEM
3 JAGTIAL
4 JANGOAN
5JAYASHANKAR
BHUPALPALLI
6 JOGULAMBA GADWAL
7 KAMAREDDY
8 KARIMNAGAR
9 KHAMMAM
10KUMURAM BHEEM
(ASIFABAD)
11 MAHABUBABAD
12 MAHABUBNAGAR
13 MANCHERIAL
14 MEDAK
15 MEDCHAL-MALKAJIGIRI
16 MULUG
17 NAGARKURNOOL
S.N
o.District
Area Production Productivit
y Area
production of
coconut and
beetle leaf in
lakh Nos
Production of
cocoa in
mts(whole
nut)
Area Production
production of
coconut and
beetle leaf in
lakh Nos
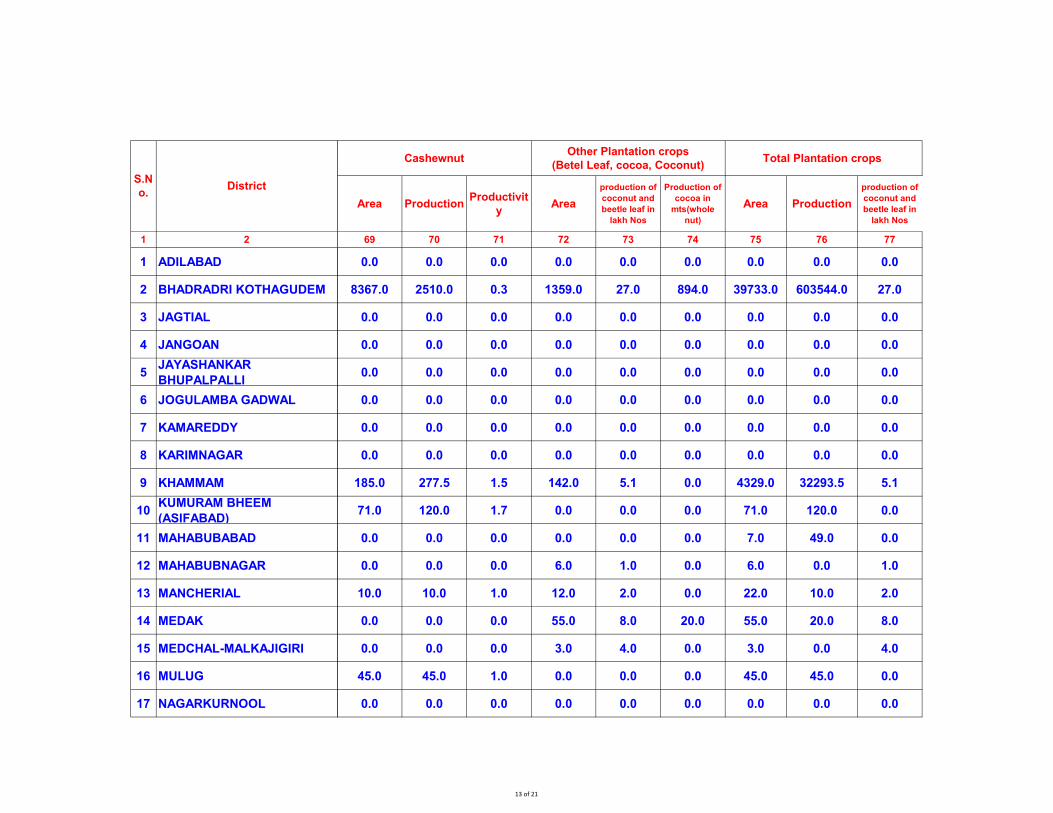
69 70 71 72 73 74 75 76 77
0.0 0.0 0.0 0.0 0.0 0.0 0.0 0.0 0.0
8367.0 2510.0 0.3 1359.0 27.0 894.0 39733.0 603544.0 27.0
0.0 0.0 0.0 0.0 0.0 0.0 0.0 0.0 0.0
0.0 0.0 0.0 0.0 0.0 0.0 0.0 0.0 0.0
0.0 0.0 0.0 0.0 0.0 0.0 0.0 0.0 0.0
0.0 0.0 0.0 0.0 0.0 0.0 0.0 0.0 0.0
0.0 0.0 0.0 0.0 0.0 0.0 0.0 0.0 0.0
0.0 0.0 0.0 0.0 0.0 0.0 0.0 0.0 0.0
185.0 277.5 1.5 142.0 5.1 0.0 4329.0 32293.5 5.1
71.0 120.0 1.7 0.0 0.0 0.0 71.0 120.0 0.0
0.0 0.0 0.0 0.0 0.0 0.0 7.0 49.0 0.0
0.0 0.0 0.0 6.0 1.0 0.0 6.0 0.0 1.0
10.0 10.0 1.0 12.0 2.0 0.0 22.0 10.0 2.0
0.0 0.0 0.0 55.0 8.0 20.0 55.0 20.0 8.0
0.0 0.0 0.0 3.0 4.0 0.0 3.0 0.0 4.0
45.0 45.0 1.0 0.0 0.0 0.0 45.0 45.0 0.0
0.0 0.0 0.0 0.0 0.0 0.0 0.0 0.0 0.0
CashewnutOther Plantation crops
(Betel Leaf, cocoa, Coconut)Total Plantation crops
13 of 21
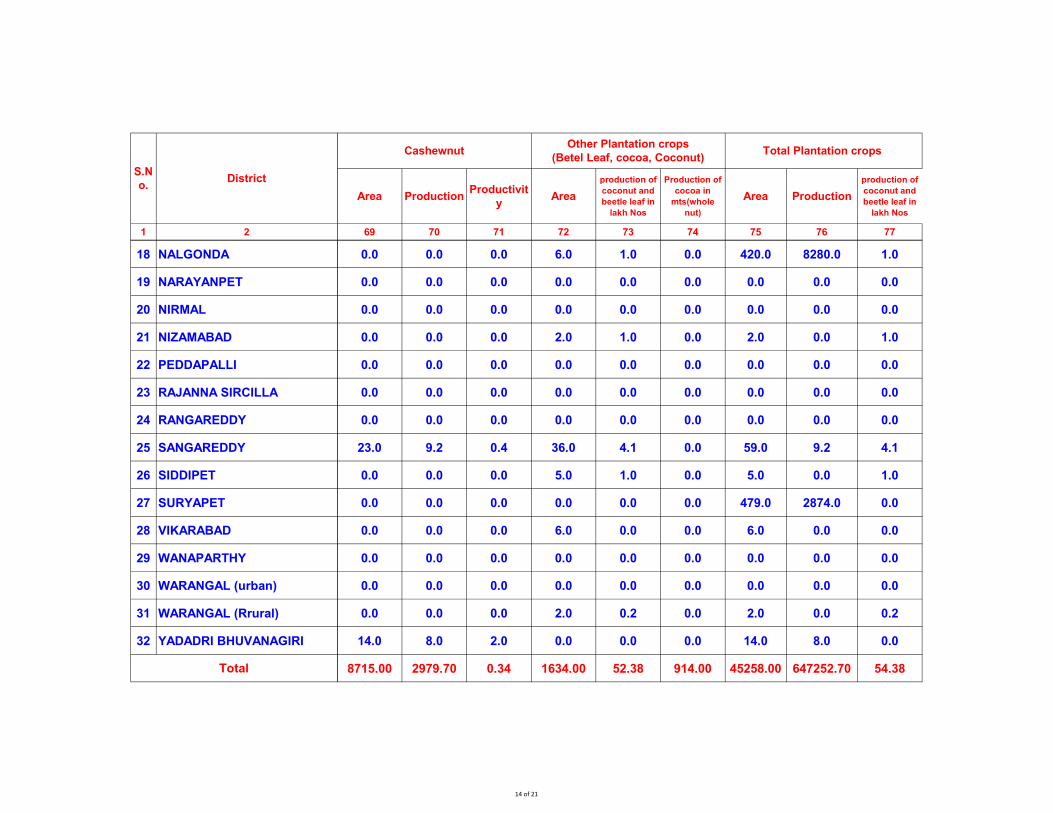
1 2
S.N
o.District
18 NALGONDA
19 NARAYANPET
20 NIRMAL
21 NIZAMABAD
22 PEDDAPALLI
23 RAJANNA SIRCILLA
24 RANGAREDDY
25 SANGAREDDY
26 SIDDIPET
27 SURYAPET
28 VIKARABAD
29 WANAPARTHY
30 WARANGAL (urban)
31 WARANGAL (Rrural)
32 YADADRI BHUVANAGIRI
Total
Area Production Productivit
y Area
production of
coconut and
beetle leaf in
lakh Nos
Production of
cocoa in
mts(whole
nut)
Area Production
production of
coconut and
beetle leaf in
lakh Nos
69 70 71 72 73 74 75 76 77
CashewnutOther Plantation crops
(Betel Leaf, cocoa, Coconut)Total Plantation crops
0.0 0.0 0.0 6.0 1.0 0.0 420.0 8280.0 1.0
0.0 0.0 0.0 0.0 0.0 0.0 0.0 0.0 0.0
0.0 0.0 0.0 0.0 0.0 0.0 0.0 0.0 0.0
0.0 0.0 0.0 2.0 1.0 0.0 2.0 0.0 1.0
0.0 0.0 0.0 0.0 0.0 0.0 0.0 0.0 0.0
0.0 0.0 0.0 0.0 0.0 0.0 0.0 0.0 0.0
0.0 0.0 0.0 0.0 0.0 0.0 0.0 0.0 0.0
23.0 9.2 0.4 36.0 4.1 0.0 59.0 9.2 4.1
0.0 0.0 0.0 5.0 1.0 0.0 5.0 0.0 1.0
0.0 0.0 0.0 0.0 0.0 0.0 479.0 2874.0 0.0
0.0 0.0 0.0 6.0 0.0 0.0 6.0 0.0 0.0
0.0 0.0 0.0 0.0 0.0 0.0 0.0 0.0 0.0
0.0 0.0 0.0 0.0 0.0 0.0 0.0 0.0 0.0
0.0 0.0 0.0 2.0 0.2 0.0 2.0 0.0 0.2
14.0 8.0 2.0 0.0 0.0 0.0 14.0 8.0 0.0
8715.00 2979.70 0.34 1634.00 52.38 914.00 45258.00 647252.70 54.38
14 of 21
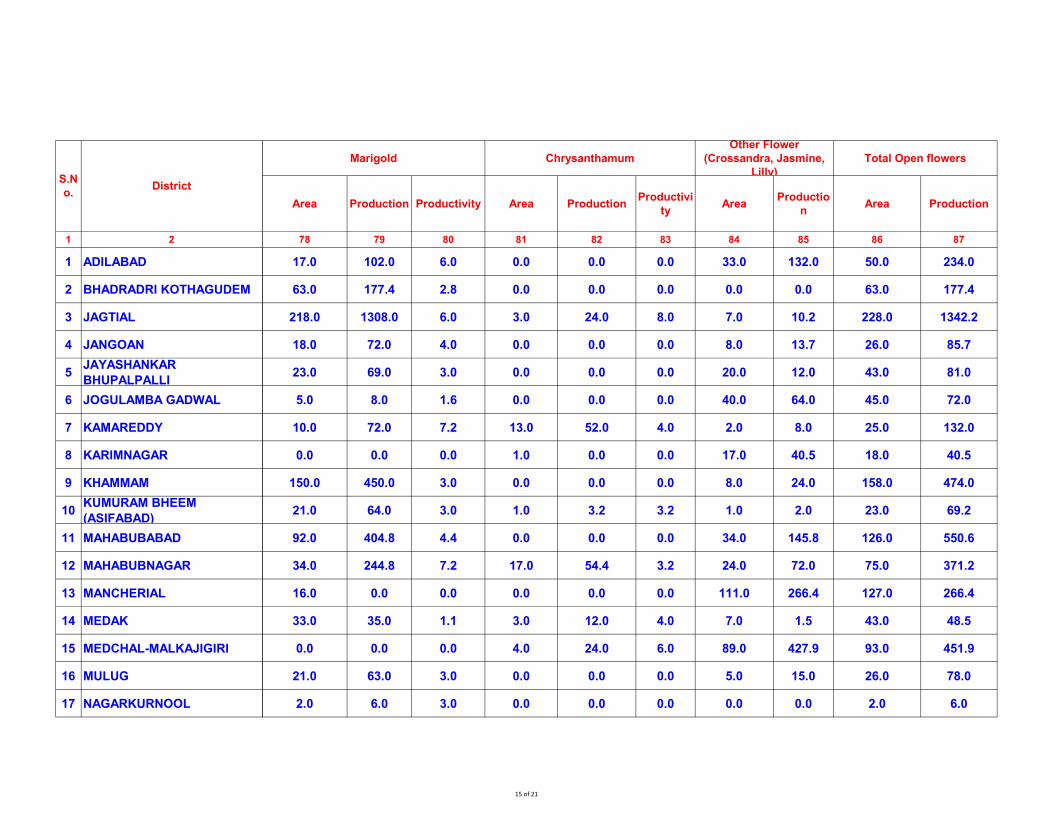
1 2
1 ADILABAD
2 BHADRADRI KOTHAGUDEM
3 JAGTIAL
4 JANGOAN
5JAYASHANKAR
BHUPALPALLI
6 JOGULAMBA GADWAL
7 KAMAREDDY
8 KARIMNAGAR
9 KHAMMAM
10KUMURAM BHEEM
(ASIFABAD)
11 MAHABUBABAD
12 MAHABUBNAGAR
13 MANCHERIAL
14 MEDAK
15 MEDCHAL-MALKAJIGIRI
16 MULUG
17 NAGARKURNOOL
S.N
o.District
Area Production Productivity Area Production Productivi
ty Area
Productio
n Area Production
78 79 80 81 82 83 84 85 86 87
17.0 102.0 6.0 0.0 0.0 0.0 33.0 132.0 50.0 234.0
63.0 177.4 2.8 0.0 0.0 0.0 0.0 0.0 63.0 177.4
218.0 1308.0 6.0 3.0 24.0 8.0 7.0 10.2 228.0 1342.2
18.0 72.0 4.0 0.0 0.0 0.0 8.0 13.7 26.0 85.7
23.0 69.0 3.0 0.0 0.0 0.0 20.0 12.0 43.0 81.0
5.0 8.0 1.6 0.0 0.0 0.0 40.0 64.0 45.0 72.0
10.0 72.0 7.2 13.0 52.0 4.0 2.0 8.0 25.0 132.0
0.0 0.0 0.0 1.0 0.0 0.0 17.0 40.5 18.0 40.5
150.0 450.0 3.0 0.0 0.0 0.0 8.0 24.0 158.0 474.0
21.0 64.0 3.0 1.0 3.2 3.2 1.0 2.0 23.0 69.2
92.0 404.8 4.4 0.0 0.0 0.0 34.0 145.8 126.0 550.6
34.0 244.8 7.2 17.0 54.4 3.2 24.0 72.0 75.0 371.2
16.0 0.0 0.0 0.0 0.0 0.0 111.0 266.4 127.0 266.4
33.0 35.0 1.1 3.0 12.0 4.0 7.0 1.5 43.0 48.5
0.0 0.0 0.0 4.0 24.0 6.0 89.0 427.9 93.0 451.9
21.0 63.0 3.0 0.0 0.0 0.0 5.0 15.0 26.0 78.0
2.0 6.0 3.0 0.0 0.0 0.0 0.0 0.0 2.0 6.0
Chrysanthamum
Other Flower
(Crossandra, Jasmine,
Lilly)
Total Open flowers Marigold
15 of 21
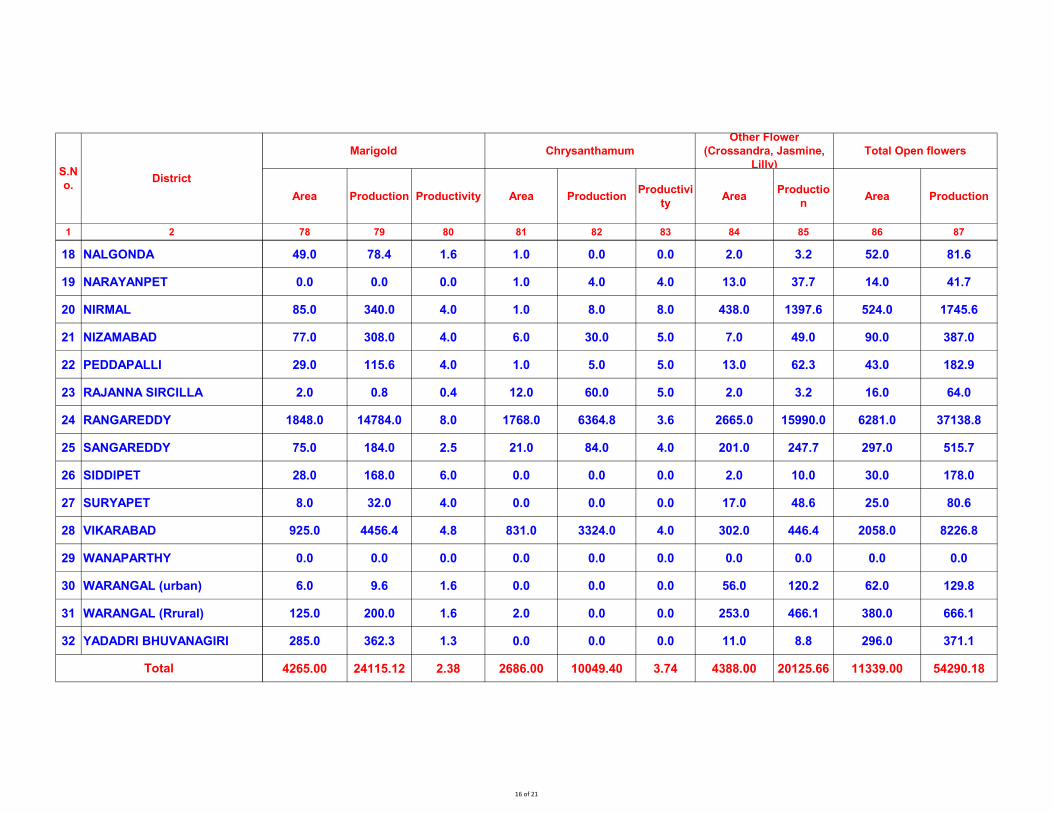
1 2
S.N
o.District
18 NALGONDA
19 NARAYANPET
20 NIRMAL
21 NIZAMABAD
22 PEDDAPALLI
23 RAJANNA SIRCILLA
24 RANGAREDDY
25 SANGAREDDY
26 SIDDIPET
27 SURYAPET
28 VIKARABAD
29 WANAPARTHY
30 WARANGAL (urban)
31 WARANGAL (Rrural)
32 YADADRI BHUVANAGIRI
Total
Area Production Productivity Area Production Productivi
ty Area
Productio
n Area Production
78 79 80 81 82 83 84 85 86 87
Chrysanthamum
Other Flower
(Crossandra, Jasmine,
Lilly)
Total Open flowers Marigold
49.0 78.4 1.6 1.0 0.0 0.0 2.0 3.2 52.0 81.6
0.0 0.0 0.0 1.0 4.0 4.0 13.0 37.7 14.0 41.7
85.0 340.0 4.0 1.0 8.0 8.0 438.0 1397.6 524.0 1745.6
77.0 308.0 4.0 6.0 30.0 5.0 7.0 49.0 90.0 387.0
29.0 115.6 4.0 1.0 5.0 5.0 13.0 62.3 43.0 182.9
2.0 0.8 0.4 12.0 60.0 5.0 2.0 3.2 16.0 64.0
1848.0 14784.0 8.0 1768.0 6364.8 3.6 2665.0 15990.0 6281.0 37138.8
75.0 184.0 2.5 21.0 84.0 4.0 201.0 247.7 297.0 515.7
28.0 168.0 6.0 0.0 0.0 0.0 2.0 10.0 30.0 178.0
8.0 32.0 4.0 0.0 0.0 0.0 17.0 48.6 25.0 80.6
925.0 4456.4 4.8 831.0 3324.0 4.0 302.0 446.4 2058.0 8226.8
0.0 0.0 0.0 0.0 0.0 0.0 0.0 0.0 0.0 0.0
6.0 9.6 1.6 0.0 0.0 0.0 56.0 120.2 62.0 129.8
125.0 200.0 1.6 2.0 0.0 0.0 253.0 466.1 380.0 666.1
285.0 362.3 1.3 0.0 0.0 0.0 11.0 8.8 296.0 371.1
4265.00 24115.12 2.38 2686.00 10049.40 3.74 4388.00 20125.66 11339.00 54290.18
16 of 21
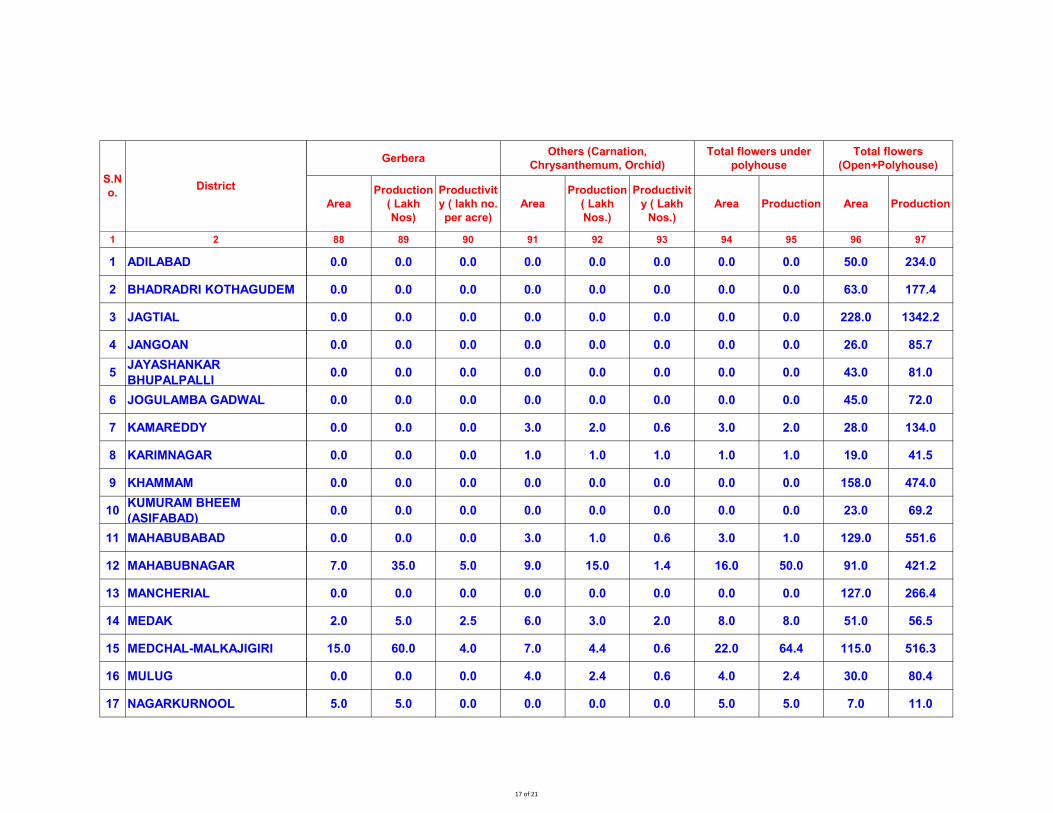
1 2
1 ADILABAD
2 BHADRADRI KOTHAGUDEM
3 JAGTIAL
4 JANGOAN
5JAYASHANKAR
BHUPALPALLI
6 JOGULAMBA GADWAL
7 KAMAREDDY
8 KARIMNAGAR
9 KHAMMAM
10KUMURAM BHEEM
(ASIFABAD)
11 MAHABUBABAD
12 MAHABUBNAGAR
13 MANCHERIAL
14 MEDAK
15 MEDCHAL-MALKAJIGIRI
16 MULUG
17 NAGARKURNOOL
S.N
o.District
Area
Production
( Lakh
Nos)
Productivit
y ( lakh no.
per acre)
Area
Production
( Lakh
Nos.)
Productivit
y ( Lakh
Nos.)
Area Production Area Production
88 89 90 91 92 93 94 95 96 97
0.0 0.0 0.0 0.0 0.0 0.0 0.0 0.0 50.0 234.0
0.0 0.0 0.0 0.0 0.0 0.0 0.0 0.0 63.0 177.4
0.0 0.0 0.0 0.0 0.0 0.0 0.0 0.0 228.0 1342.2
0.0 0.0 0.0 0.0 0.0 0.0 0.0 0.0 26.0 85.7
0.0 0.0 0.0 0.0 0.0 0.0 0.0 0.0 43.0 81.0
0.0 0.0 0.0 0.0 0.0 0.0 0.0 0.0 45.0 72.0
0.0 0.0 0.0 3.0 2.0 0.6 3.0 2.0 28.0 134.0
0.0 0.0 0.0 1.0 1.0 1.0 1.0 1.0 19.0 41.5
0.0 0.0 0.0 0.0 0.0 0.0 0.0 0.0 158.0 474.0
0.0 0.0 0.0 0.0 0.0 0.0 0.0 0.0 23.0 69.2
0.0 0.0 0.0 3.0 1.0 0.6 3.0 1.0 129.0 551.6
7.0 35.0 5.0 9.0 15.0 1.4 16.0 50.0 91.0 421.2
0.0 0.0 0.0 0.0 0.0 0.0 0.0 0.0 127.0 266.4
2.0 5.0 2.5 6.0 3.0 2.0 8.0 8.0 51.0 56.5
15.0 60.0 4.0 7.0 4.4 0.6 22.0 64.4 115.0 516.3
0.0 0.0 0.0 4.0 2.4 0.6 4.0 2.4 30.0 80.4
5.0 5.0 0.0 0.0 0.0 0.0 5.0 5.0 7.0 11.0
Total flowers
(Open+Polyhouse)Gerbera
Others (Carnation,
Chrysanthemum, Orchid)
Total flowers under
polyhouse
17 of 21
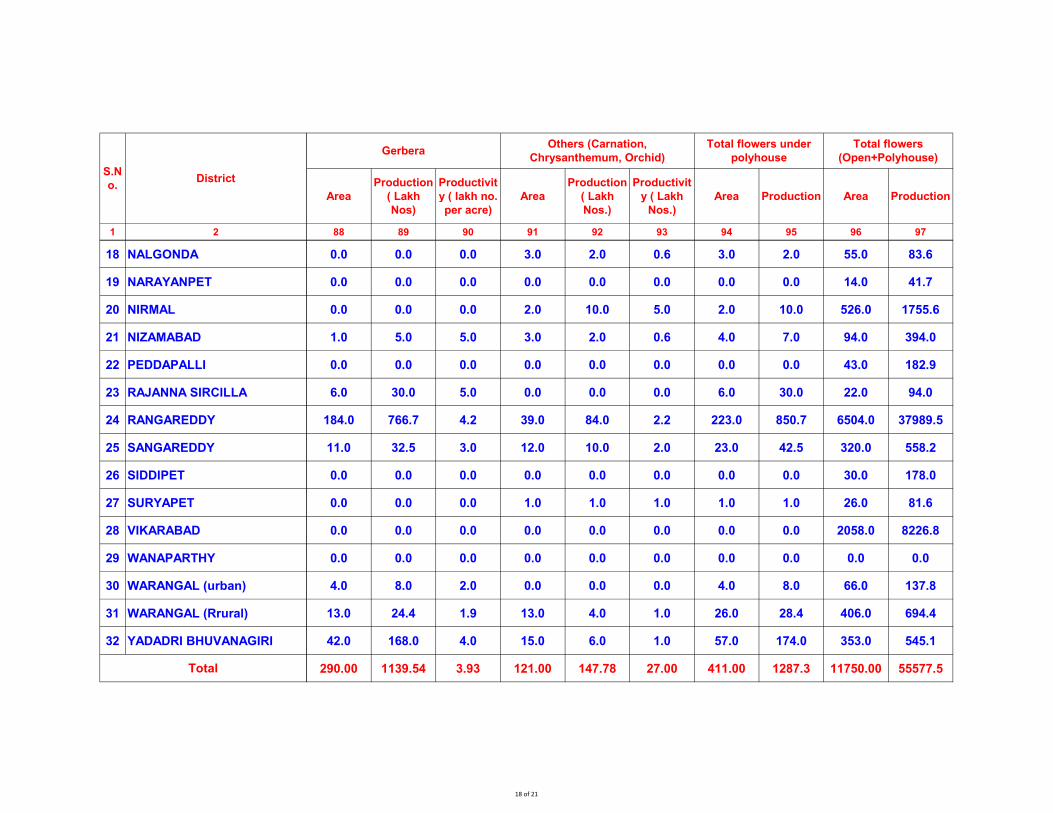
1 2
S.N
o.District
18 NALGONDA
19 NARAYANPET
20 NIRMAL
21 NIZAMABAD
22 PEDDAPALLI
23 RAJANNA SIRCILLA
24 RANGAREDDY
25 SANGAREDDY
26 SIDDIPET
27 SURYAPET
28 VIKARABAD
29 WANAPARTHY
30 WARANGAL (urban)
31 WARANGAL (Rrural)
32 YADADRI BHUVANAGIRI
Total
Area
Production
( Lakh
Nos)
Productivit
y ( lakh no.
per acre)
Area
Production
( Lakh
Nos.)
Productivit
y ( Lakh
Nos.)
Area Production Area Production
88 89 90 91 92 93 94 95 96 97
Total flowers
(Open+Polyhouse)Gerbera
Others (Carnation,
Chrysanthemum, Orchid)
Total flowers under
polyhouse
0.0 0.0 0.0 3.0 2.0 0.6 3.0 2.0 55.0 83.6
0.0 0.0 0.0 0.0 0.0 0.0 0.0 0.0 14.0 41.7
0.0 0.0 0.0 2.0 10.0 5.0 2.0 10.0 526.0 1755.6
1.0 5.0 5.0 3.0 2.0 0.6 4.0 7.0 94.0 394.0
0.0 0.0 0.0 0.0 0.0 0.0 0.0 0.0 43.0 182.9
6.0 30.0 5.0 0.0 0.0 0.0 6.0 30.0 22.0 94.0
184.0 766.7 4.2 39.0 84.0 2.2 223.0 850.7 6504.0 37989.5
11.0 32.5 3.0 12.0 10.0 2.0 23.0 42.5 320.0 558.2
0.0 0.0 0.0 0.0 0.0 0.0 0.0 0.0 30.0 178.0
0.0 0.0 0.0 1.0 1.0 1.0 1.0 1.0 26.0 81.6
0.0 0.0 0.0 0.0 0.0 0.0 0.0 0.0 2058.0 8226.8
0.0 0.0 0.0 0.0 0.0 0.0 0.0 0.0 0.0 0.0
4.0 8.0 2.0 0.0 0.0 0.0 4.0 8.0 66.0 137.8
13.0 24.4 1.9 13.0 4.0 1.0 26.0 28.4 406.0 694.4
42.0 168.0 4.0 15.0 6.0 1.0 57.0 174.0 353.0 545.1
290.00 1139.54 3.93 121.00 147.78 27.00 411.00 1287.3 11750.00 55577.5
18 of 21
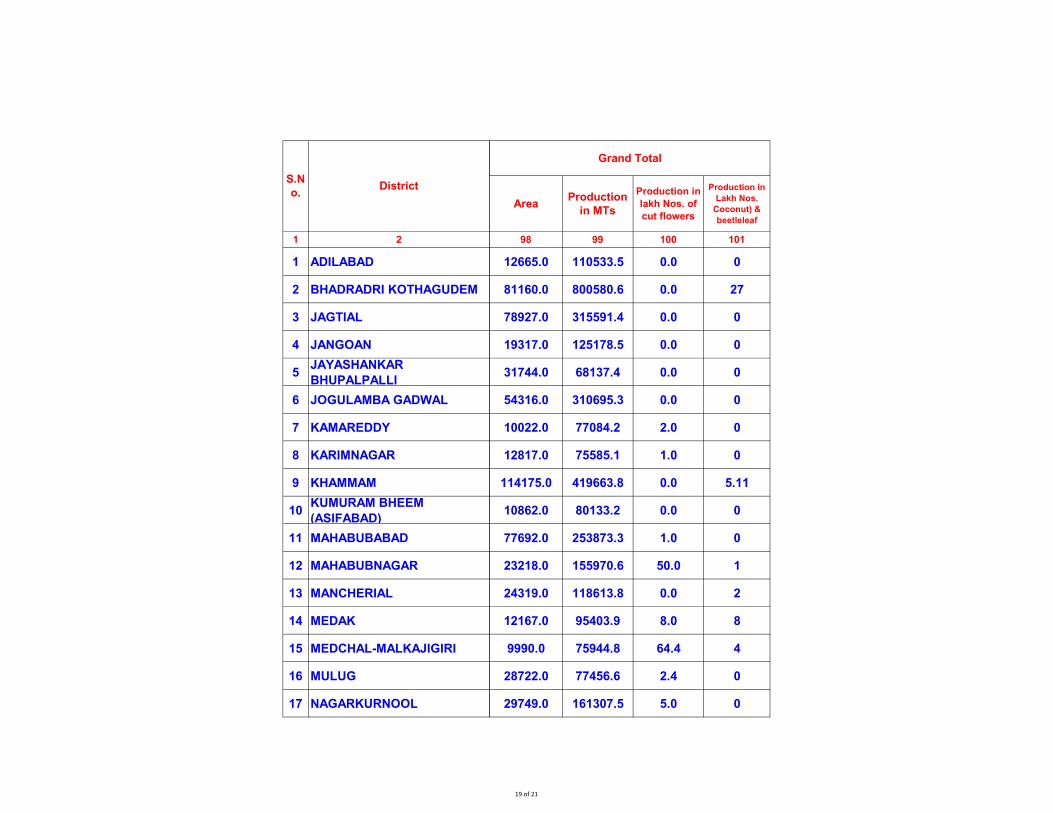
1 2
1 ADILABAD
2 BHADRADRI KOTHAGUDEM
3 JAGTIAL
4 JANGOAN
5JAYASHANKAR
BHUPALPALLI
6 JOGULAMBA GADWAL
7 KAMAREDDY
8 KARIMNAGAR
9 KHAMMAM
10KUMURAM BHEEM
(ASIFABAD)
11 MAHABUBABAD
12 MAHABUBNAGAR
13 MANCHERIAL
14 MEDAK
15 MEDCHAL-MALKAJIGIRI
16 MULUG
17 NAGARKURNOOL
S.N
o.District
AreaProduction
in MTs
Production in
lakh Nos. of
cut flowers
Production in
Lakh Nos.
Coconut) &
beetleleaf
98 99 100 101
12665.0 110533.5 0.0 0
81160.0 800580.6 0.0 27
78927.0 315591.4 0.0 0
19317.0 125178.5 0.0 0
31744.0 68137.4 0.0 0
54316.0 310695.3 0.0 0
10022.0 77084.2 2.0 0
12817.0 75585.1 1.0 0
114175.0 419663.8 0.0 5.11
10862.0 80133.2 0.0 0
77692.0 253873.3 1.0 0
23218.0 155970.6 50.0 1
24319.0 118613.8 0.0 2
12167.0 95403.9 8.0 8
9990.0 75944.8 64.4 4
28722.0 77456.6 2.4 0
29749.0 161307.5 5.0 0
Grand Total
19 of 21
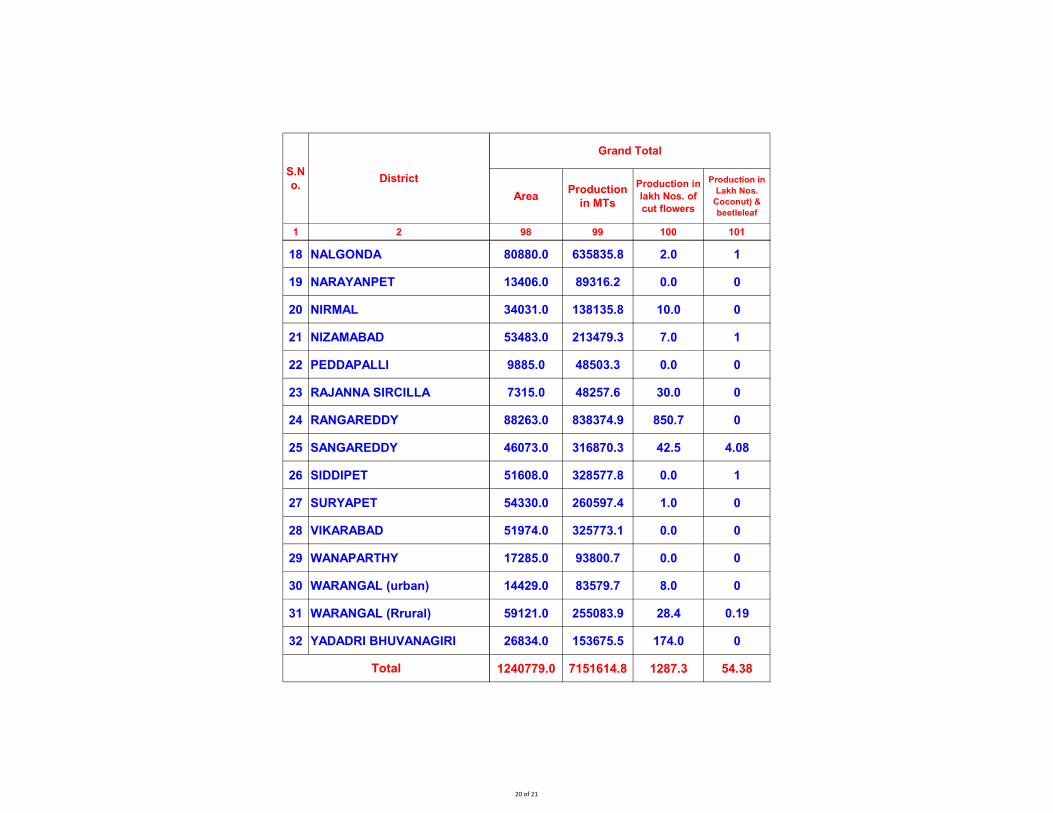
1 2
S.N
o.District
18 NALGONDA
19 NARAYANPET
20 NIRMAL
21 NIZAMABAD
22 PEDDAPALLI
23 RAJANNA SIRCILLA
24 RANGAREDDY
25 SANGAREDDY
26 SIDDIPET
27 SURYAPET
28 VIKARABAD
29 WANAPARTHY
30 WARANGAL (urban)
31 WARANGAL (Rrural)
32 YADADRI BHUVANAGIRI
Total
AreaProduction
in MTs
Production in
lakh Nos. of
cut flowers
Production in
Lakh Nos.
Coconut) &
beetleleaf
98 99 100 101
Grand Total
80880.0 635835.8 2.0 1
13406.0 89316.2 0.0 0
34031.0 138135.8 10.0 0
53483.0 213479.3 7.0 1
9885.0 48503.3 0.0 0
7315.0 48257.6 30.0 0
88263.0 838374.9 850.7 0
46073.0 316870.3 42.5 4.08
51608.0 328577.8 0.0 1
54330.0 260597.4 1.0 0
51974.0 325773.1 0.0 0
17285.0 93800.7 0.0 0
14429.0 83579.7 8.0 0
59121.0 255083.9 28.4 0.19
26834.0 153675.5 174.0 0
1240779.0 7151614.8 1287.3 54.38
20 of 21
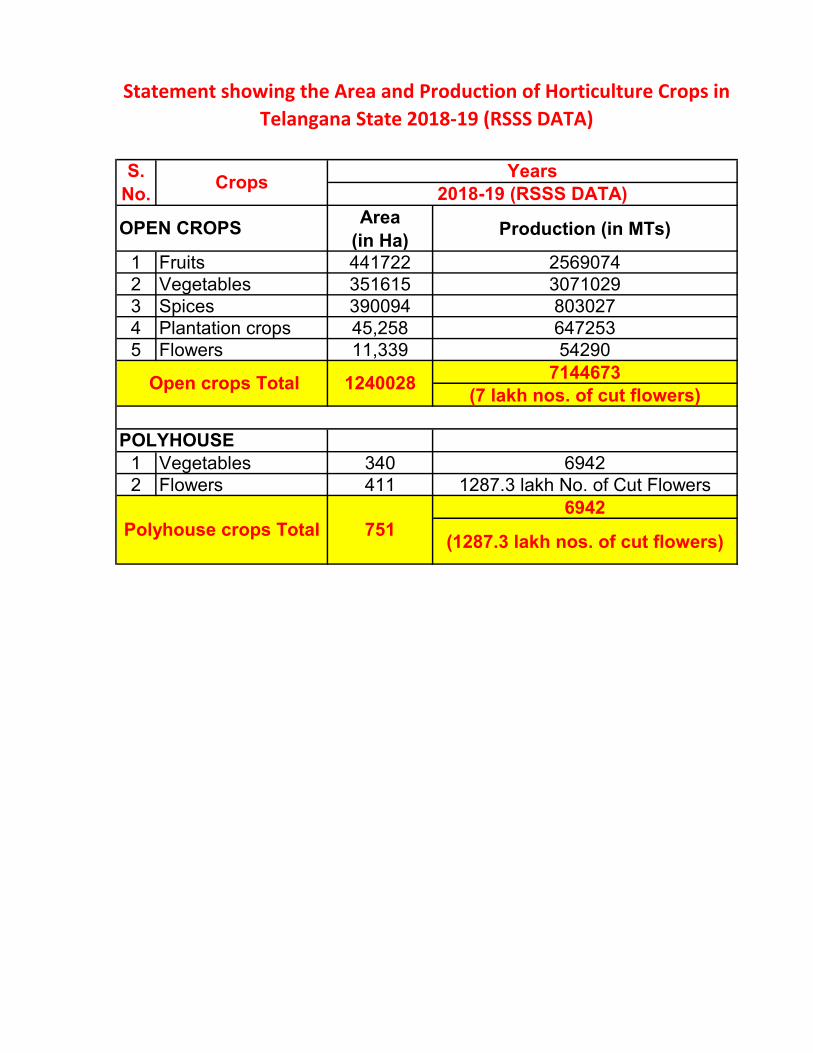
Area
(in Ha)Production (in MTs)
1 Fruits 441722 2569074
2 Vegetables 351615 3071029
3 Spices 390094 803027
4 Plantation crops 45,258 647253
5 Flowers 11,339 54290
7144673
(7 lakh nos. of cut flowers)
1 Vegetables 340 6942
2 Flowers 411 1287.3 lakh No. of Cut Flowers
6942
(1287.3 lakh nos. of cut flowers)
OPEN CROPS
Statement showing the Area and Production of Horticulture Crops in
Telangana State 2018-19 (RSSS DATA)
S.
No.Crops
Years
2018-19 (RSSS DATA)
POLYHOUSE
Polyhouse crops Total 751
Open crops Total 1240028
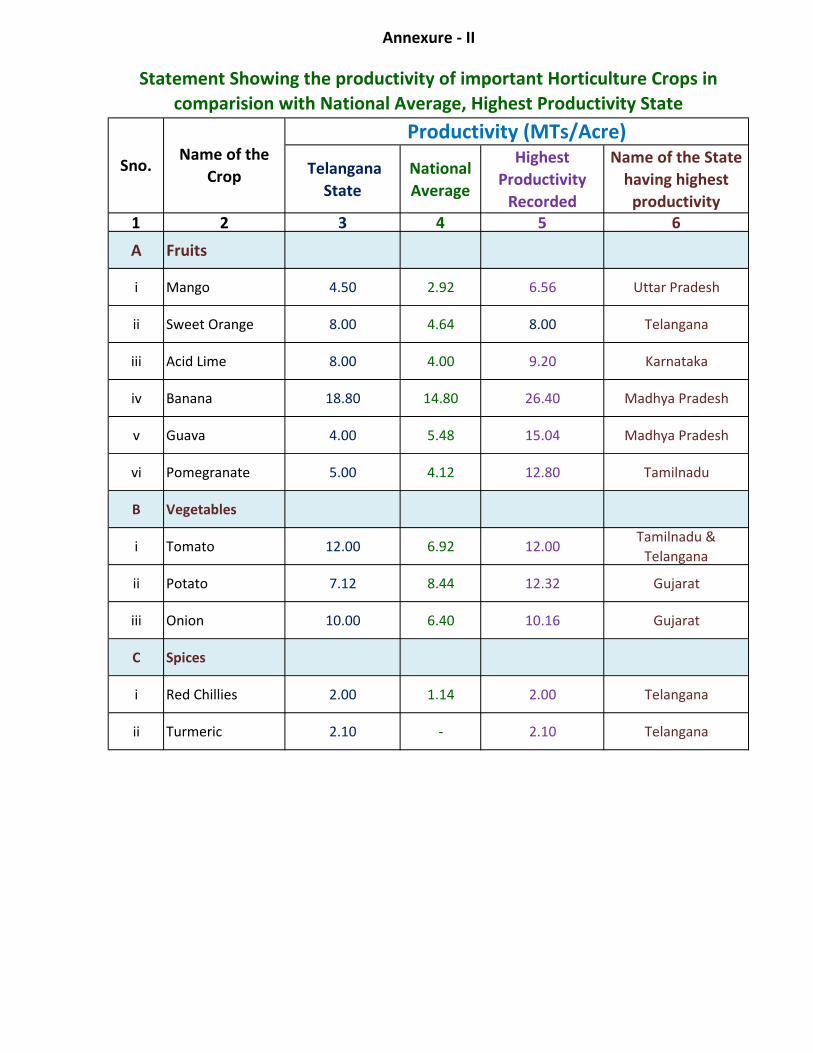
Telangana
State
National
Average
Highest
Productivity
Recorded
Name of the State
having highest
productivity
1 2 3 4 5 6
A Fruits
i Mango 4.50 2.92 6.56 Uttar Pradesh
ii Sweet Orange 8.00 4.64 8.00 Telangana
iii Acid Lime 8.00 4.00 9.20 Karnataka
iv Banana 18.80 14.80 26.40 Madhya Pradesh
v Guava 4.00 5.48 15.04 Madhya Pradesh
vi Pomegranate 5.00 4.12 12.80 Tamilnadu
B Vegetables
i Tomato 12.00 6.92 12.00Tamilnadu &
Telangana
ii Potato 7.12 8.44 12.32 Gujarat
iii Onion 10.00 6.40 10.16 Gujarat
C Spices
i Red Chillies 2.00 1.14 2.00 Telangana
ii Turmeric 2.10 - 2.10 Telangana
Annexure - II
Statement Showing the productivity of important Horticulture Crops in
comparision with National Average, Highest Productivity State
Sno. Name of the
Crop
Productivity (MTs/Acre)
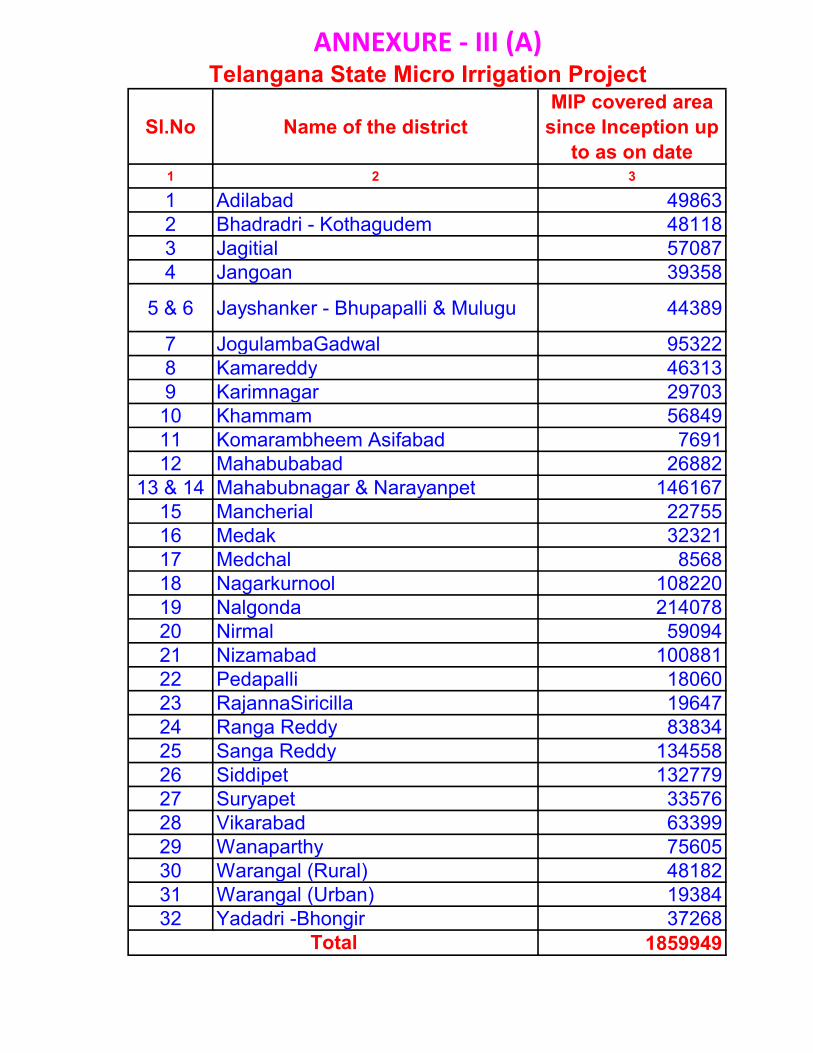
Sl.No Name of the district
MIP covered area
since Inception up
to as on date1 2 3
1 Adilabad 49863
2 Bhadradri - Kothagudem 48118
3 Jagitial 57087
4 Jangoan 39358
5 & 6 Jayshanker - Bhupapalli & Mulugu 44389
7 JogulambaGadwal 95322
8 Kamareddy 46313
9 Karimnagar 29703
10 Khammam 56849
11 Komarambheem Asifabad 7691
12 Mahabubabad 26882
13 & 14 Mahabubnagar & Narayanpet 146167
15 Mancherial 22755
16 Medak 32321
17 Medchal 8568
18 Nagarkurnool 108220
19 Nalgonda 214078
20 Nirmal 59094
21 Nizamabad 100881
22 Pedapalli 18060
23 RajannaSiricilla 19647
24 Ranga Reddy 83834
25 Sanga Reddy 134558
26 Siddipet 132779
27 Suryapet 33576
28 Vikarabad 63399
29 Wanaparthy 75605
30 Warangal (Rural) 48182
31 Warangal (Urban) 19384
32 Yadadri -Bhongir 37268
1859949
Telangana State Micro Irrigation Project
Total
ANNEXURE - III (A)

Sl.No Name of the district
MIP covered area
since Inception up
to as on date1 2 3
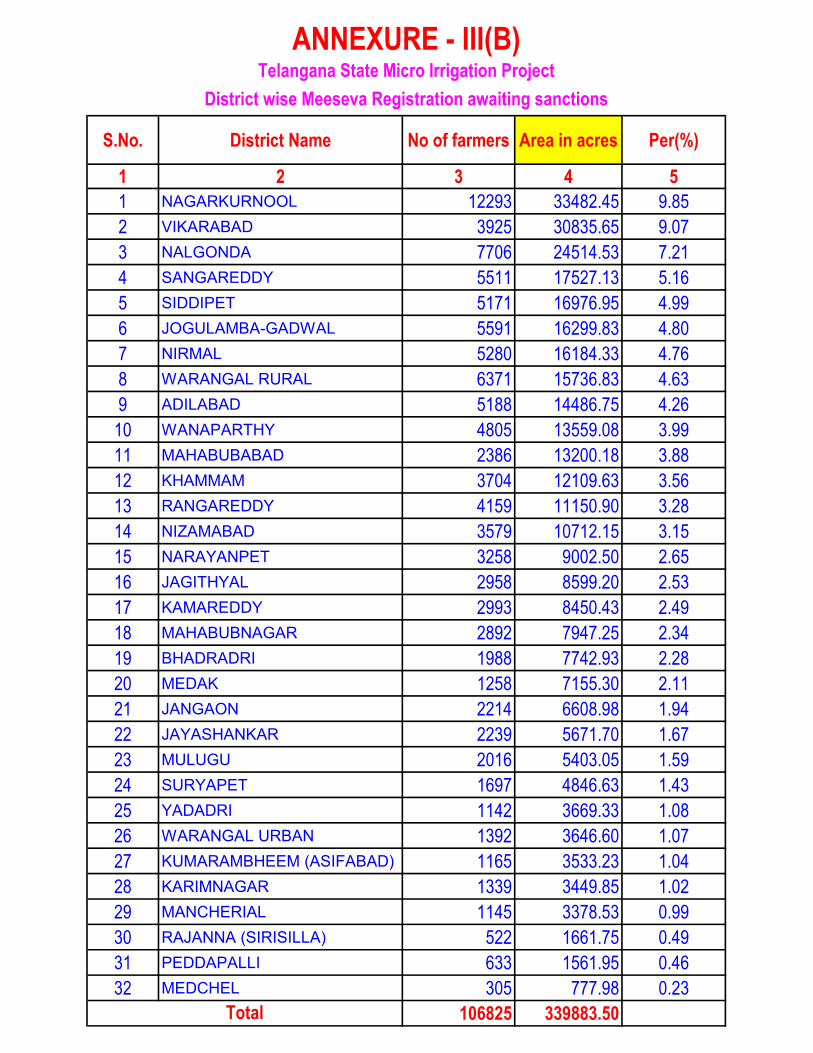
S.No. District Name No of farmers Area in acres Per(%)
1 2 3 4 5
1 NAGARKURNOOL 12293 33482.45 9.85
2 VIKARABAD 3925 30835.65 9.07
3 NALGONDA 7706 24514.53 7.21
4 SANGAREDDY 5511 17527.13 5.16
5 SIDDIPET 5171 16976.95 4.99
6 JOGULAMBA-GADWAL 5591 16299.83 4.80
7 NIRMAL 5280 16184.33 4.76
8 WARANGAL RURAL 6371 15736.83 4.63
9 ADILABAD 5188 14486.75 4.26
10 WANAPARTHY 4805 13559.08 3.99
11 MAHABUBABAD 2386 13200.18 3.88
12 KHAMMAM 3704 12109.63 3.56
13 RANGAREDDY 4159 11150.90 3.28
14 NIZAMABAD 3579 10712.15 3.15
15 NARAYANPET 3258 9002.50 2.65
16 JAGITHYAL 2958 8599.20 2.53
17 KAMAREDDY 2993 8450.43 2.49
18 MAHABUBNAGAR 2892 7947.25 2.34
19 BHADRADRI 1988 7742.93 2.28
20 MEDAK 1258 7155.30 2.11
21 JANGAON 2214 6608.98 1.94
22 JAYASHANKAR 2239 5671.70 1.67
23 MULUGU 2016 5403.05 1.59
24 SURYAPET 1697 4846.63 1.43
25 YADADRI 1142 3669.33 1.08
26 WARANGAL URBAN 1392 3646.60 1.07
27 KUMARAMBHEEM (ASIFABAD) 1165 3533.23 1.04
28 KARIMNAGAR 1339 3449.85 1.02
29 MANCHERIAL 1145 3378.53 0.99
30 RAJANNA (SIRISILLA) 522 1661.75 0.49
31 PEDDAPALLI 633 1561.95 0.46
32 MEDCHEL 305 777.98 0.23
106825 339883.50
Telangana State Micro Irrigation Project
District wise Meeseva Registration awaiting sanctions
Total
ANNEXURE - III(B)

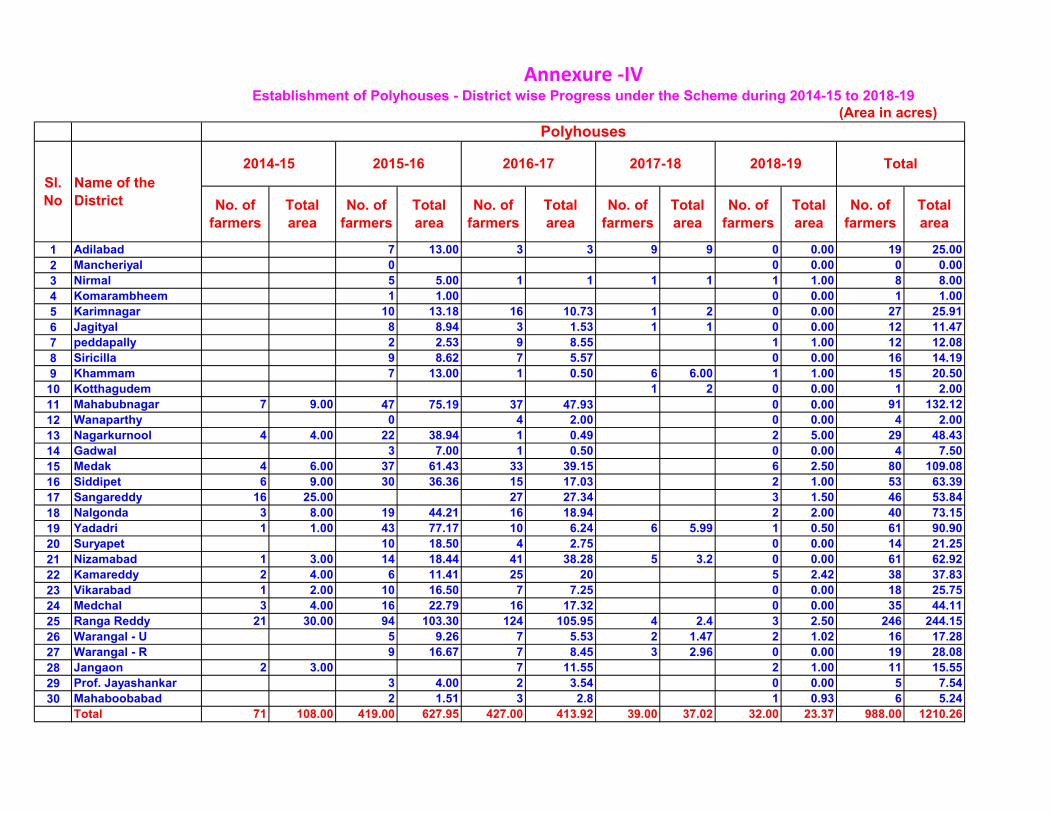
(Area in acres)
1 Adilabad 7 13.00 3 3 9 9 0 0.00 19 25.00
2 Mancheriyal 0 0 0.00 0 0.00
3 Nirmal 5 5.00 1 1 1 1 1 1.00 8 8.00
4 Komarambheem 1 1.00 0 0.00 1 1.00
5 Karimnagar 10 13.18 16 10.73 1 2 0 0.00 27 25.91
6 Jagityal 8 8.94 3 1.53 1 1 0 0.00 12 11.47
7 peddapally 2 2.53 9 8.55 1 1.00 12 12.08
8 Siricilla 9 8.62 7 5.57 0 0.00 16 14.19
9 Khammam 7 13.00 1 0.50 6 6.00 1 1.00 15 20.50
10 Kotthagudem 1 2 0 0.00 1 2.00
11 Mahabubnagar 7 9.00 47 75.19 37 47.93 0 0.00 91 132.12
12 Wanaparthy 0 4 2.00 0 0.00 4 2.00
13 Nagarkurnool 4 4.00 22 38.94 1 0.49 2 5.00 29 48.43
14 Gadwal 3 7.00 1 0.50 0 0.00 4 7.50
15 Medak 4 6.00 37 61.43 33 39.15 6 2.50 80 109.08
16 Siddipet 6 9.00 30 36.36 15 17.03 2 1.00 53 63.39
17 Sangareddy 16 25.00 27 27.34 3 1.50 46 53.84
18 Nalgonda 3 8.00 19 44.21 16 18.94 2 2.00 40 73.15
19 Yadadri 1 1.00 43 77.17 10 6.24 6 5.99 1 0.50 61 90.90
20 Suryapet 10 18.50 4 2.75 0 0.00 14 21.25
21 Nizamabad 1 3.00 14 18.44 41 38.28 5 3.2 0 0.00 61 62.92
22 Kamareddy 2 4.00 6 11.41 25 20 5 2.42 38 37.83
23 Vikarabad 1 2.00 10 16.50 7 7.25 0 0.00 18 25.75
24 Medchal 3 4.00 16 22.79 16 17.32 0 0.00 35 44.11
25 Ranga Reddy 21 30.00 94 103.30 124 105.95 4 2.4 3 2.50 246 244.15
26 Warangal - U 5 9.26 7 5.53 2 1.47 2 1.02 16 17.28
27 Warangal - R 9 16.67 7 8.45 3 2.96 0 0.00 19 28.08
28 Jangaon 2 3.00 7 11.55 2 1.00 11 15.55
29 Prof. Jayashankar 3 4.00 2 3.54 0 0.00 5 7.54
30 Mahaboobabad 2 1.51 3 2.8 1 0.93 6 5.24
Total 71 108.00 419.00 627.95 427.00 413.92 39.00 37.02 32.00 23.37 988.00 1210.26
Sl.
No
Name of the
District
2014-15 2015-16 2016-17
Total
area
No. of
farmers
Total
area
No. of
farmers
Total
area
Annexure -IV
Total
area
No. of
farmers
2017-18
Polyhouses
Total
area
No. of
farmers
Total
No. of
farmers
Establishment of Polyhouses - District wise Progress under the Scheme during 2014-15 to 2018-19
2018-19
No. of
farmers
Total
area
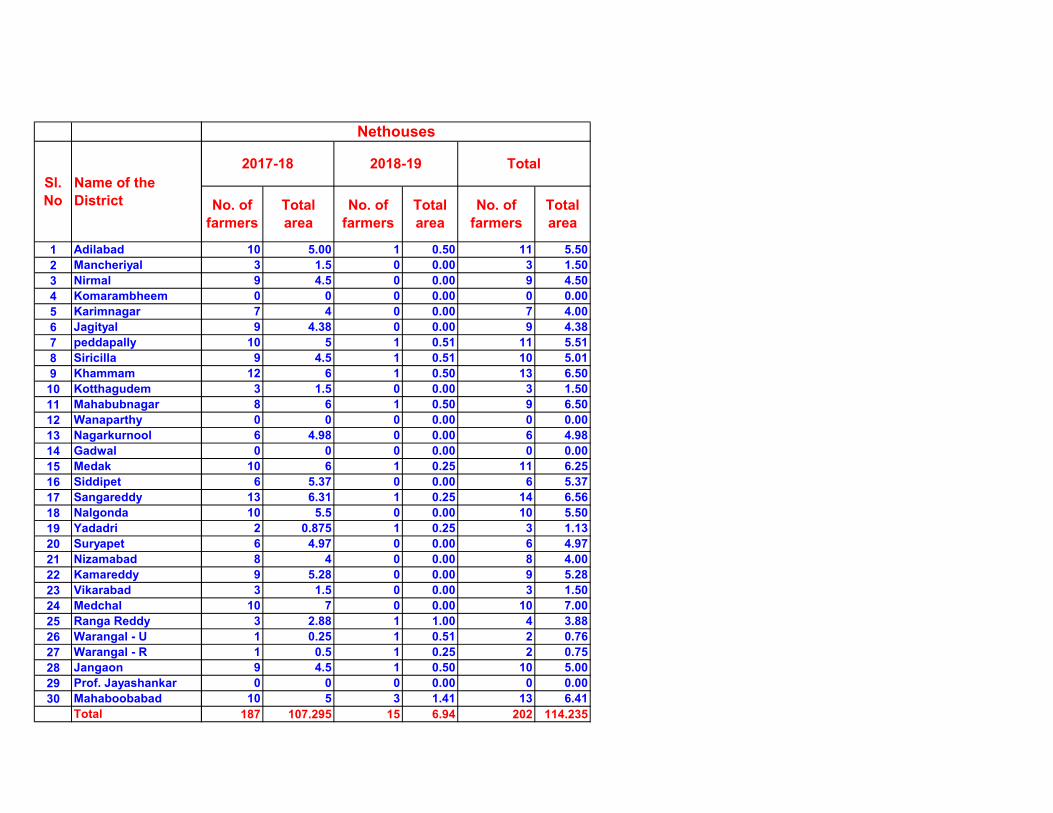
1 Adilabad
2 Mancheriyal
3 Nirmal
4 Komarambheem
5 Karimnagar
6 Jagityal
7 peddapally
8 Siricilla
9 Khammam
10 Kotthagudem
11 Mahabubnagar
12 Wanaparthy
13 Nagarkurnool
14 Gadwal
15 Medak
16 Siddipet
17 Sangareddy
18 Nalgonda
19 Yadadri
20 Suryapet
21 Nizamabad
22 Kamareddy
23 Vikarabad
24 Medchal
25 Ranga Reddy
26 Warangal - U
27 Warangal - R
28 Jangaon
29 Prof. Jayashankar
30 Mahaboobabad
Total
Sl.
No
Name of the
District
10 5.00 1 0.50 11 5.50
3 1.5 0 0.00 3 1.50
9 4.5 0 0.00 9 4.50
0 0 0 0.00 0 0.00
7 4 0 0.00 7 4.00
9 4.38 0 0.00 9 4.38
10 5 1 0.51 11 5.51
9 4.5 1 0.51 10 5.01
12 6 1 0.50 13 6.50
3 1.5 0 0.00 3 1.50
8 6 1 0.50 9 6.50
0 0 0 0.00 0 0.00
6 4.98 0 0.00 6 4.98
0 0 0 0.00 0 0.00
10 6 1 0.25 11 6.25
6 5.37 0 0.00 6 5.37
13 6.31 1 0.25 14 6.56
10 5.5 0 0.00 10 5.50
2 0.875 1 0.25 3 1.13
6 4.97 0 0.00 6 4.97
8 4 0 0.00 8 4.00
9 5.28 0 0.00 9 5.28
3 1.5 0 0.00 3 1.50
10 7 0 0.00 10 7.00
3 2.88 1 1.00 4 3.88
1 0.25 1 0.51 2 0.76
1 0.5 1 0.25 2 0.75
9 4.5 1 0.50 10 5.00
0 0 0 0.00 0 0.00
10 5 3 1.41 13 6.41
187 107.295 15 6.94 202 114.235
Total
No. of
farmers
Total
area
Nethouses
2017-18
No. of
farmers
Total
area
2018-19
No. of
farmers
Total
area
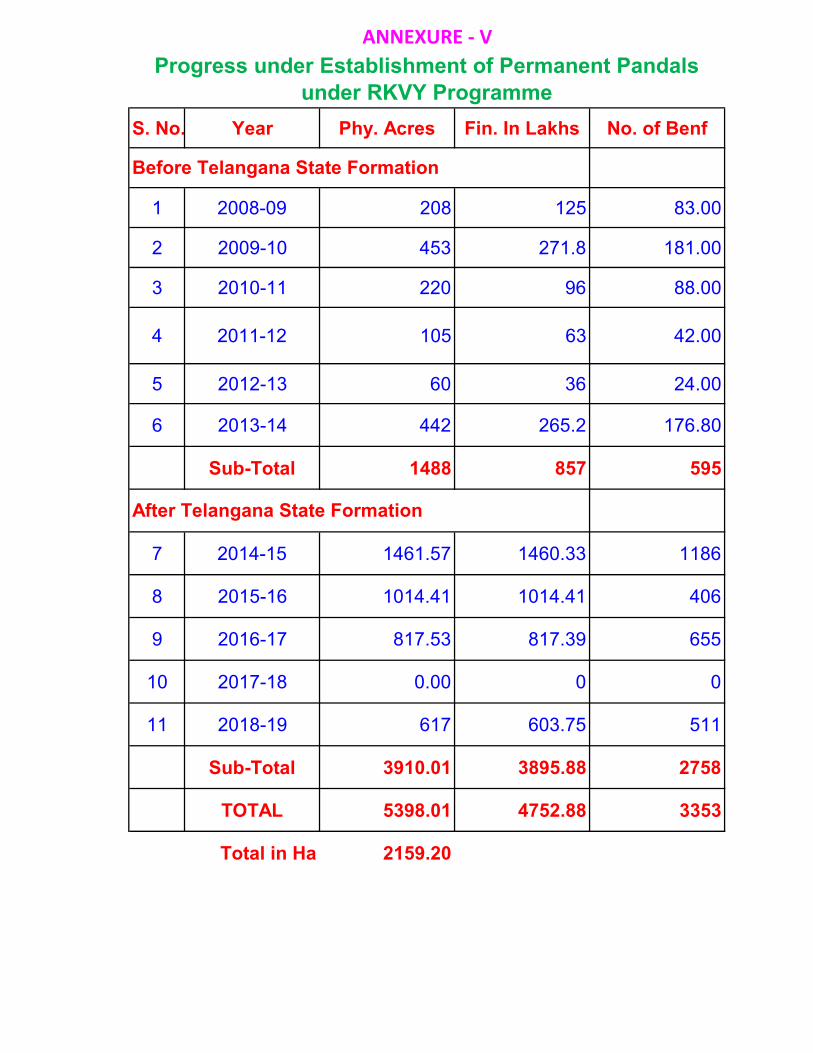
S. No. Year Phy. Acres Fin. In Lakhs No. of Benf
1 2008-09 208 125 83.00
2 2009-10 453 271.8 181.00
3 2010-11 220 96 88.00
4 2011-12 105 63 42.00
5 2012-13 60 36 24.00
6 2013-14 442 265.2 176.80
Sub-Total 1488 857 595
7 2014-15 1461.57 1460.33 1186
8 2015-16 1014.41 1014.41 406
9 2016-17 817.53 817.39 655
10 2017-18 0.00 0 0
11 2018-19 617 603.75 511
Sub-Total 3910.01 3895.88 2758
TOTAL 5398.01 4752.88 3353
Total in Ha 2159.20
Progress under Establishment of Permanent Pandals
under RKVY Programme
Before Telangana State Formation
After Telangana State Formation
ANNEXURE - V

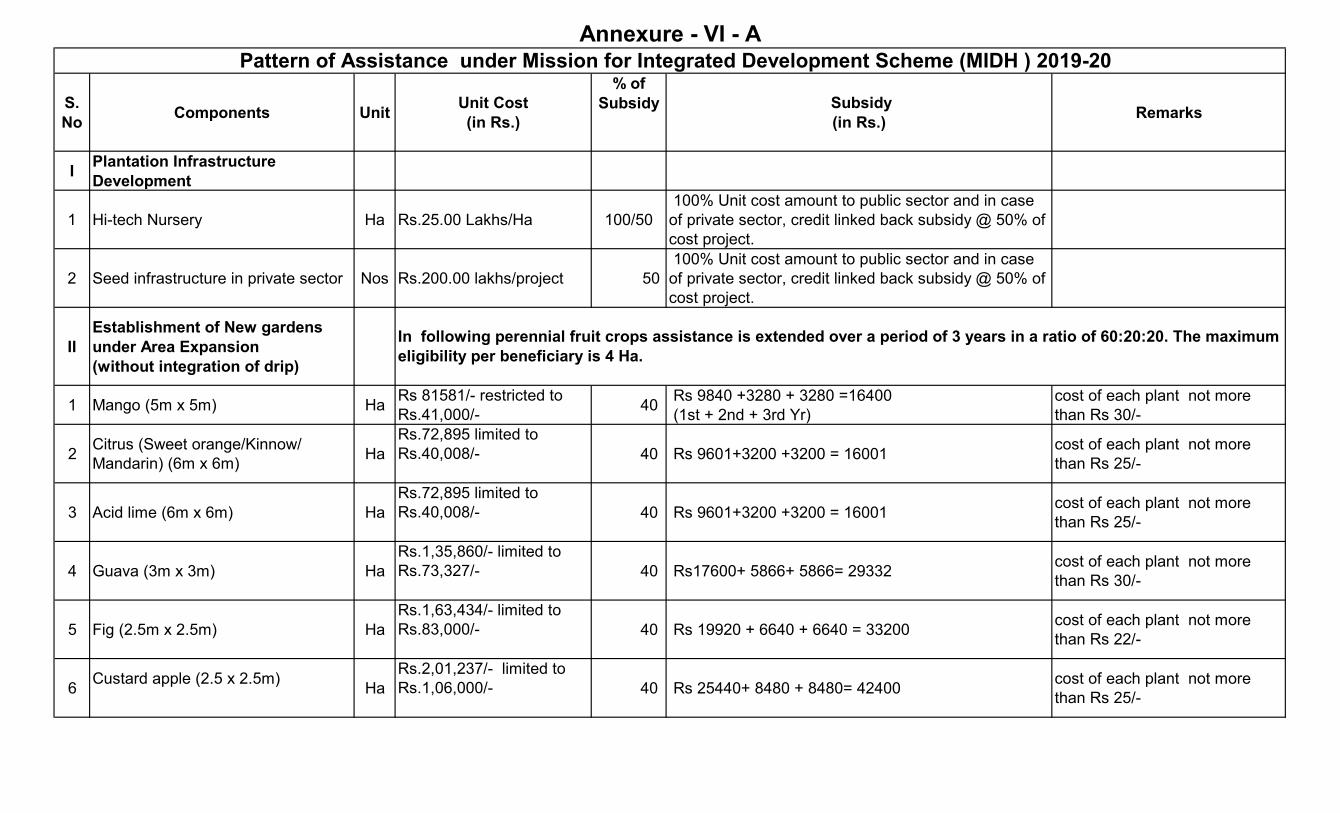
S.
NoComponents Unit
Unit Cost
(in Rs.)
% of
Subsidy Subsidy
(in Rs.) Remarks
IPlantation Infrastructure
Development
1 Hi-tech Nursery Ha Rs.25.00 Lakhs/Ha 100/50
100% Unit cost amount to public sector and in case
of private sector, credit linked back subsidy @ 50% of
cost project.
2 Seed infrastructure in private sector Nos Rs.200.00 lakhs/project 50
100% Unit cost amount to public sector and in case
of private sector, credit linked back subsidy @ 50% of
cost project.
II
Establishment of New gardens
under Area Expansion
(without integration of drip)
1 Mango (5m x 5m) HaRs 81581/- restricted to
Rs.41,000/-40
Rs 9840 +3280 + 3280 =16400
(1st + 2nd + 3rd Yr)
cost of each plant not more
than Rs 30/-
2Citrus (Sweet orange/Kinnow/
Mandarin) (6m x 6m)Ha
Rs.72,895 limited to
Rs.40,008/- 40 Rs 9601+3200 +3200 = 16001 cost of each plant not more
than Rs 25/-
3 Acid lime (6m x 6m) Ha
Rs.72,895 limited to
Rs.40,008/- 40 Rs 9601+3200 +3200 = 16001 cost of each plant not more
than Rs 25/-
4 Guava (3m x 3m) Ha
Rs.1,35,860/- limited to
Rs.73,327/- 40 Rs17600+ 5866+ 5866= 29332 cost of each plant not more
than Rs 30/-
5 Fig (2.5m x 2.5m) Ha
Rs.1,63,434/- limited to
Rs.83,000/- 40 Rs 19920 + 6640 + 6640 = 33200 cost of each plant not more
than Rs 22/-
6Custard apple (2.5 x 2.5m)
Ha
Rs.2,01,237/- limited to
Rs.1,06,000/- 40 Rs 25440+ 8480 + 8480= 42400 cost of each plant not more
than Rs 25/-
Annexure - VI - A Pattern of Assistance under Mission for Integrated Development Scheme (MIDH ) 2019-20
In following perennial fruit crops assistance is extended over a period of 3 years in a ratio of 60:20:20. The maximum
eligibility per beneficiary is 4 Ha.
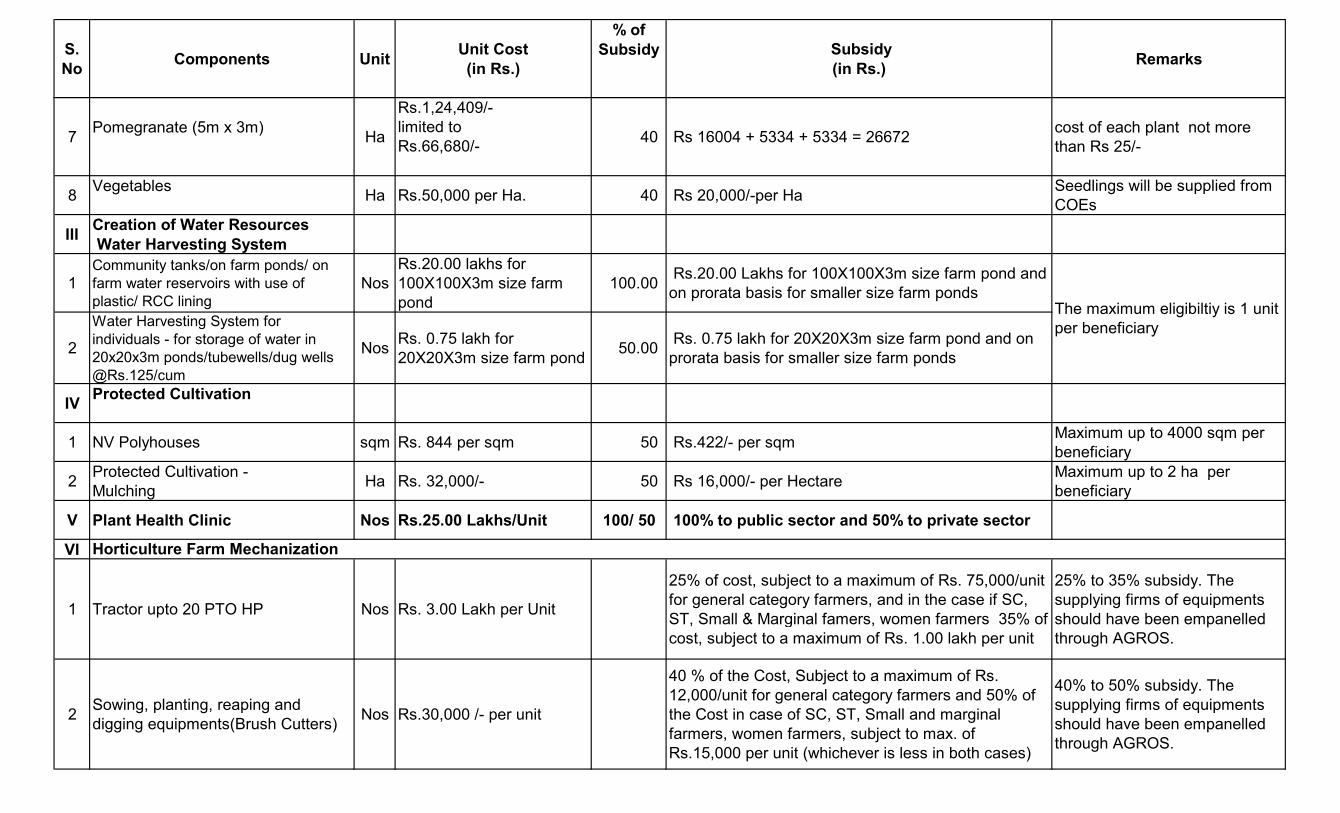
S.
NoComponents Unit
Unit Cost
(in Rs.)
% of
Subsidy Subsidy
(in Rs.) Remarks
7Pomegranate (5m x 3m)
Ha
Rs.1,24,409/-
limited to
Rs.66,680/-40 Rs 16004 + 5334 + 5334 = 26672
cost of each plant not more
than Rs 25/-
8Vegetables
Ha Rs.50,000 per Ha. 40 Rs 20,000/-per Ha Seedlings will be supplied from
COEs
IIICreation of Water Resources
Water Harvesting System
1Community tanks/on farm ponds/ on
farm water reservoirs with use of
plastic/ RCC lining
Nos
Rs.20.00 lakhs for
100X100X3m size farm
pond
100.00 Rs.20.00 Lakhs for 100X100X3m size farm pond and
on prorata basis for smaller size farm ponds
2
Water Harvesting System for
individuals - for storage of water in
20x20x3m ponds/tubewells/dug wells
@Rs.125/cum
NosRs. 0.75 lakh for
20X20X3m size farm pond 50.00
Rs. 0.75 lakh for 20X20X3m size farm pond and on
prorata basis for smaller size farm ponds
IVProtected Cultivation
1 NV Polyhouses sqm Rs. 844 per sqm 50 Rs.422/- per sqm Maximum up to 4000 sqm per
beneficiary
2Protected Cultivation -
MulchingHa Rs. 32,000/- 50 Rs 16,000/- per Hectare
Maximum up to 2 ha per
beneficiary
V Plant Health Clinic Nos Rs.25.00 Lakhs/Unit 100/ 50 100% to public sector and 50% to private sector
VI
1 Tractor upto 20 PTO HP Nos Rs. 3.00 Lakh per Unit
25% of cost, subject to a maximum of Rs. 75,000/unit
for general category farmers, and in the case if SC,
ST, Small & Marginal famers, women farmers 35% of
cost, subject to a maximum of Rs. 1.00 lakh per unit
25% to 35% subsidy. The
supplying firms of equipments
should have been empanelled
through AGROS.
2Sowing, planting, reaping and
digging equipments(Brush Cutters)Nos Rs.30,000 /- per unit
40 % of the Cost, Subject to a maximum of Rs.
12,000/unit for general category farmers and 50% of
the Cost in case of SC, ST, Small and marginal
farmers, women farmers, subject to max. of
Rs.15,000 per unit (whichever is less in both cases)
40% to 50% subsidy. The
supplying firms of equipments
should have been empanelled
through AGROS.
The maximum eligibiltiy is 1 unit
per beneficiary
Horticulture Farm Mechanization
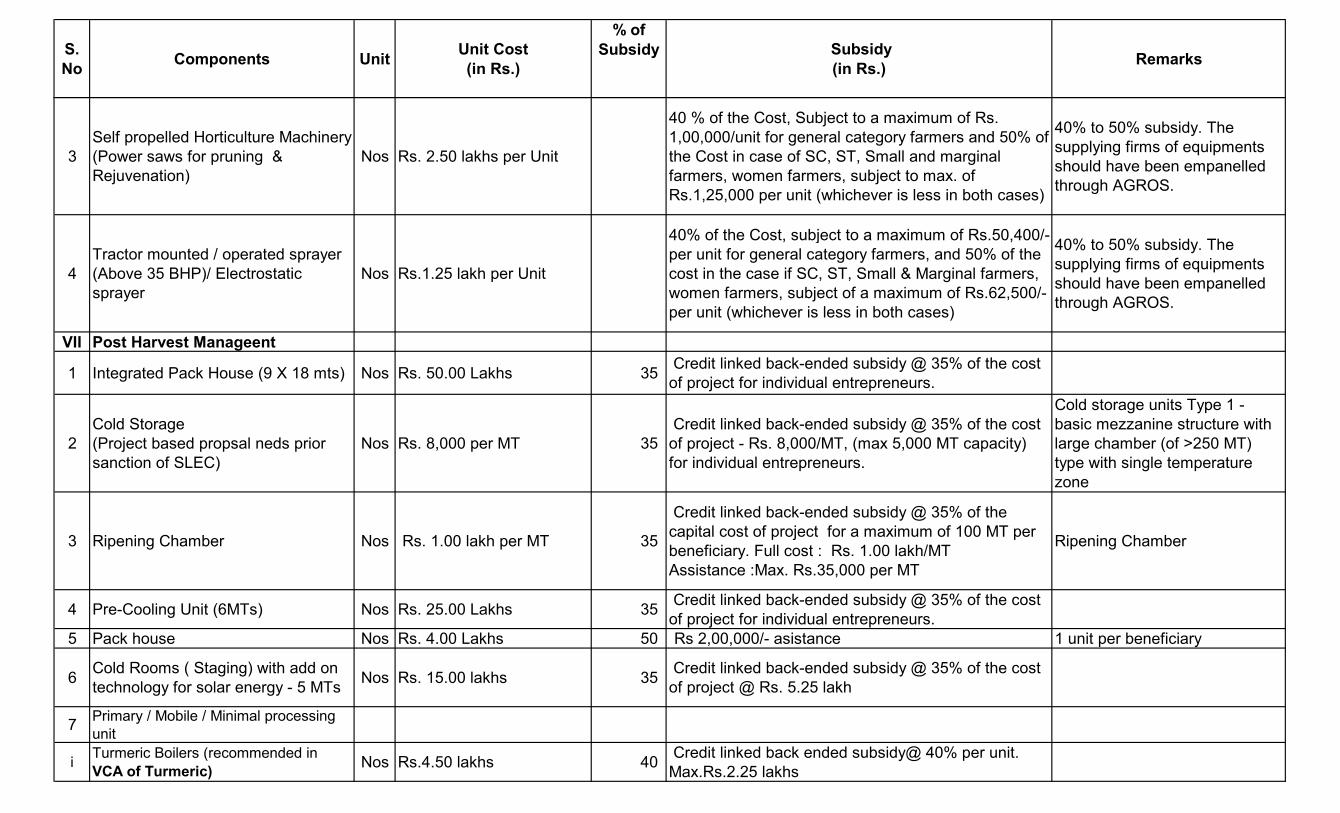
S.
NoComponents Unit
Unit Cost
(in Rs.)
% of
Subsidy Subsidy
(in Rs.) Remarks
3
Self propelled Horticulture Machinery
(Power saws for pruning &
Rejuvenation)
Nos Rs. 2.50 lakhs per Unit
40 % of the Cost, Subject to a maximum of Rs.
1,00,000/unit for general category farmers and 50% of
the Cost in case of SC, ST, Small and marginal
farmers, women farmers, subject to max. of
Rs.1,25,000 per unit (whichever is less in both cases)
40% to 50% subsidy. The
supplying firms of equipments
should have been empanelled
through AGROS.
4
Tractor mounted / operated sprayer
(Above 35 BHP)/ Electrostatic
sprayer
Nos Rs.1.25 lakh per Unit
40% of the Cost, subject to a maximum of Rs.50,400/-
per unit for general category farmers, and 50% of the
cost in the case if SC, ST, Small & Marginal farmers,
women farmers, subject of a maximum of Rs.62,500/-
per unit (whichever is less in both cases)
40% to 50% subsidy. The
supplying firms of equipments
should have been empanelled
through AGROS.
VII Post Harvest Manageent
1 Integrated Pack House (9 X 18 mts) Nos Rs. 50.00 Lakhs 35 Credit linked back-ended subsidy @ 35% of the cost
of project for individual entrepreneurs.
2
Cold Storage
(Project based propsal neds prior
sanction of SLEC)
Nos Rs. 8,000 per MT 35
Credit linked back-ended subsidy @ 35% of the cost
of project - Rs. 8,000/MT, (max 5,000 MT capacity)
for individual entrepreneurs.
Cold storage units Type 1 -
basic mezzanine structure with
large chamber (of >250 MT)
type with single temperature
zone
3 Ripening Chamber Nos Rs. 1.00 lakh per MT 35
Credit linked back-ended subsidy @ 35% of the
capital cost of project for a maximum of 100 MT per
beneficiary. Full cost : Rs. 1.00 lakh/MT
Assistance :Max. Rs.35,000 per MT
Ripening Chamber
4 Pre-Cooling Unit (6MTs) Nos Rs. 25.00 Lakhs 35 Credit linked back-ended subsidy @ 35% of the cost
of project for individual entrepreneurs.
5 Pack house Nos Rs. 4.00 Lakhs 50 Rs 2,00,000/- asistance 1 unit per beneficiary
6Cold Rooms ( Staging) with add on
technology for solar energy - 5 MTsNos Rs. 15.00 lakhs 35
Credit linked back-ended subsidy @ 35% of the cost
of project @ Rs. 5.25 lakh
7Primary / Mobile / Minimal processing
unit
iTurmeric Boilers (recommended in
VCA of Turmeric)Nos Rs.4.50 lakhs 40
Credit linked back ended subsidy@ 40% per unit.
Max.Rs.2.25 lakhs
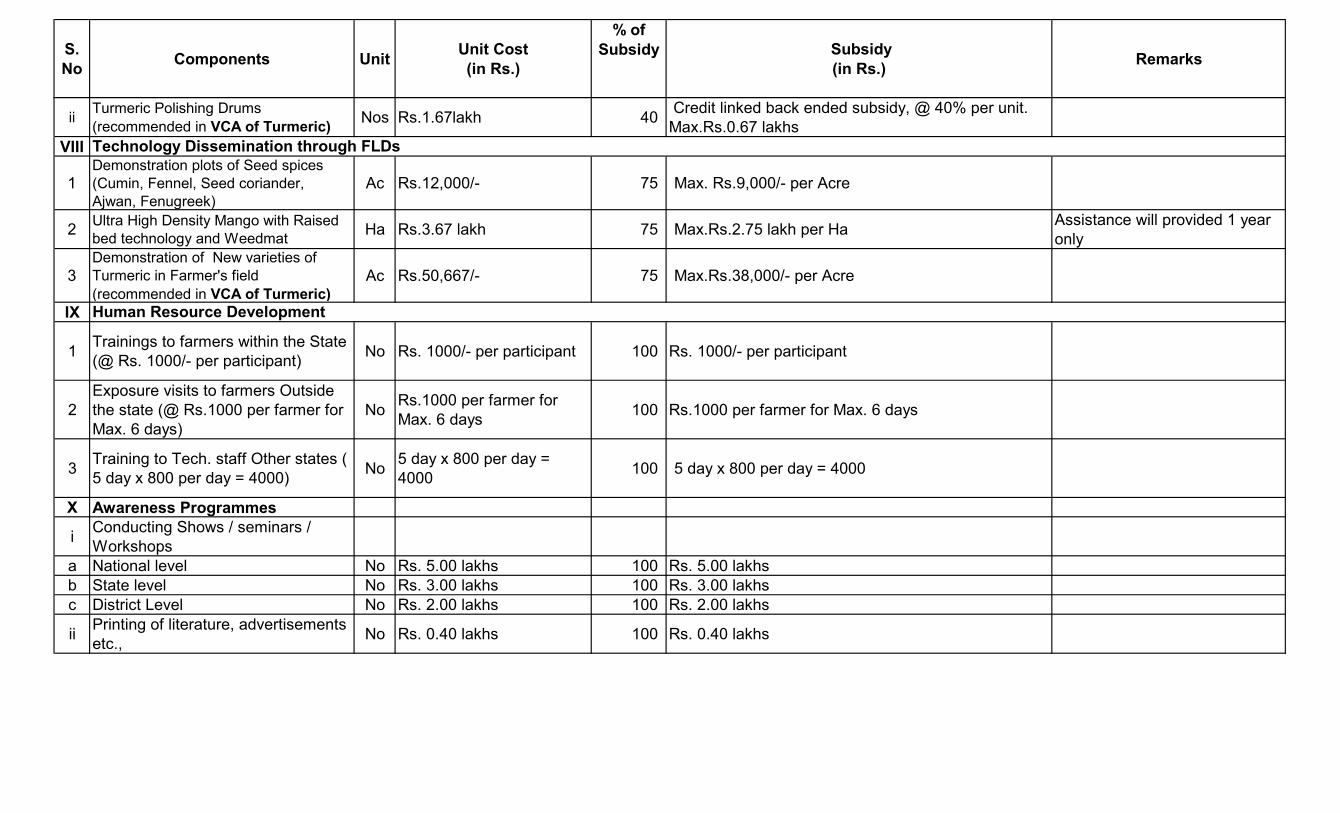
S.
NoComponents Unit
Unit Cost
(in Rs.)
% of
Subsidy Subsidy
(in Rs.) Remarks
iiTurmeric Polishing Drums
(recommended in VCA of Turmeric)Nos Rs.1.67lakh 40
Credit linked back ended subsidy, @ 40% per unit.
Max.Rs.0.67 lakhs
VIII
1Demonstration plots of Seed spices
(Cumin, Fennel, Seed coriander,
Ajwan, Fenugreek)
Ac Rs.12,000/- 75 Max. Rs.9,000/- per Acre
2Ultra High Density Mango with Raised
bed technology and Weedmat Ha Rs.3.67 lakh 75 Max.Rs.2.75 lakh per Ha
Assistance will provided 1 year
only
3Demonstration of New varieties of
Turmeric in Farmer's field
(recommended in VCA of Turmeric)
Ac Rs.50,667/- 75 Max.Rs.38,000/- per Acre
IX
1Trainings to farmers within the State
(@ Rs. 1000/- per participant) No Rs. 1000/- per participant 100 Rs. 1000/- per participant
2
Exposure visits to farmers Outside
the state (@ Rs.1000 per farmer for
Max. 6 days)
NoRs.1000 per farmer for
Max. 6 days100 Rs.1000 per farmer for Max. 6 days
3Training to Tech. staff Other states (
5 day x 800 per day = 4000)No
5 day x 800 per day =
4000100 5 day x 800 per day = 4000
X Awareness Programmes
iConducting Shows / seminars /
Workshops
a National level No Rs. 5.00 lakhs 100 Rs. 5.00 lakhs
b State level No Rs. 3.00 lakhs 100 Rs. 3.00 lakhs
c District Level No Rs. 2.00 lakhs 100 Rs. 2.00 lakhs
iiPrinting of literature, advertisements
etc.,No Rs. 0.40 lakhs 100 Rs. 0.40 lakhs
Human Resource Development
Technology Dissemination through FLDs
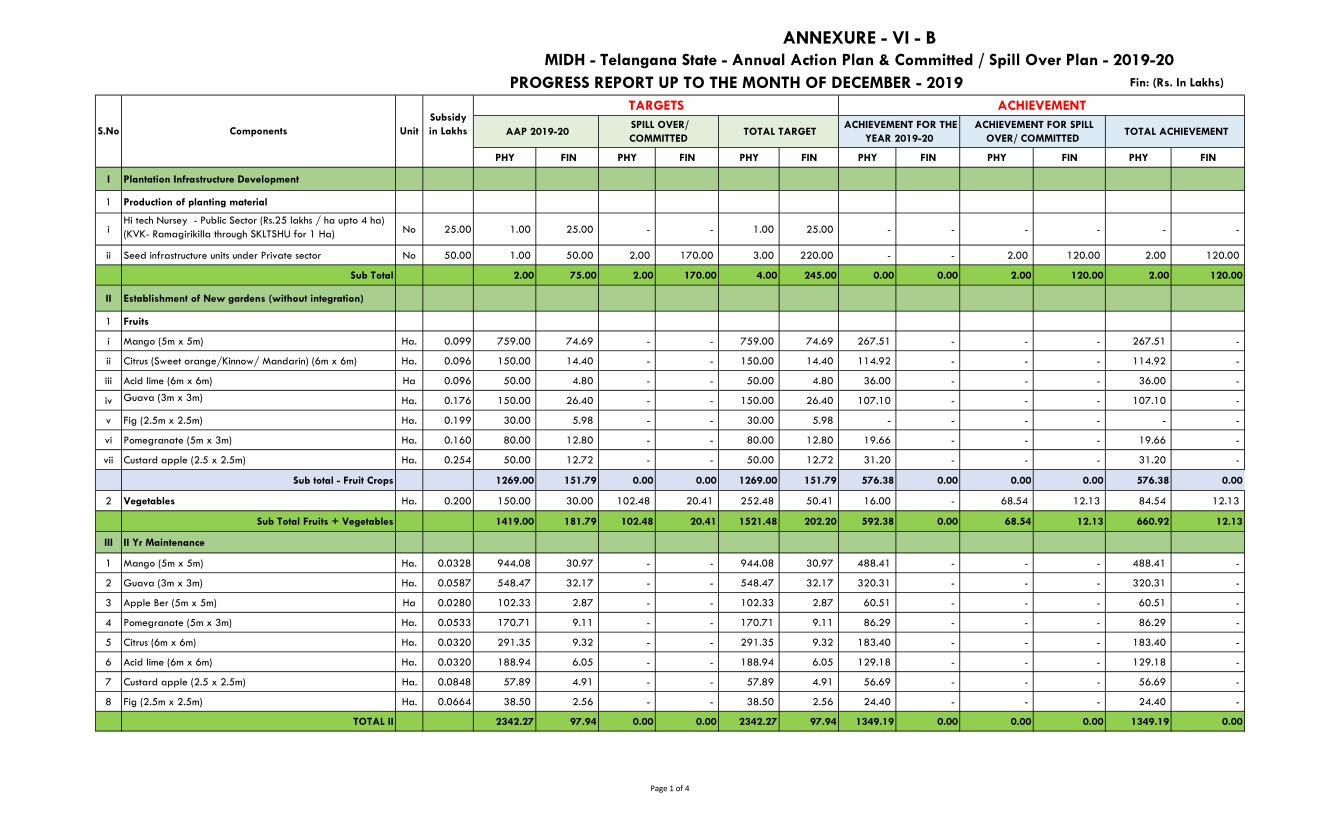
PHY FIN PHY FIN PHY FIN PHY FIN PHY FIN PHY FIN
I Plantation Infrastructure Development
1 Production of planting material
iHi tech Nursey - Public Sector (Rs.25 lakhs / ha upto 4 ha)
(KVK- Ramagirikilla through SKLTSHU for 1 Ha) No 25.00 1.00 25.00 - - 1.00 25.00 - - - - - -
ii Seed infrastructure units under Private sector No 50.00 1.00 50.00 2.00 170.00 3.00 220.00 - - 2.00 120.00 2.00 120.00
Sub Total 2.00 75.00 2.00 170.00 4.00 245.00 0.00 0.00 2.00 120.00 2.00 120.00
II Establishment of New gardens (without integration)
1 Fruits
i Mango (5m x 5m) Ha. 0.099 759.00 74.69 - - 759.00 74.69 267.51 - - - 267.51 -
ii Citrus (Sweet orange/Kinnow/ Mandarin) (6m x 6m) Ha. 0.096 150.00 14.40 - - 150.00 14.40 114.92 - - - 114.92 -
iii Acid lime (6m x 6m) Ha 0.096 50.00 4.80 - - 50.00 4.80 36.00 - - - 36.00 -
iv Guava (3m x 3m) Ha. 0.176 150.00 26.40 - - 150.00 26.40 107.10 - - - 107.10 -
v Fig (2.5m x 2.5m) Ha. 0.199 30.00 5.98 - - 30.00 5.98 - - - - - -
vi Pomegranate (5m x 3m) Ha. 0.160 80.00 12.80 - - 80.00 12.80 19.66 - - - 19.66 -
vii Custard apple (2.5 x 2.5m) Ha. 0.254 50.00 12.72 - - 50.00 12.72 31.20 - - - 31.20 -
Sub total - Fruit Crops 1269.00 151.79 0.00 0.00 1269.00 151.79 576.38 0.00 0.00 0.00 576.38 0.00
2 Vegetables Ha. 0.200 150.00 30.00 102.48 20.41 252.48 50.41 16.00 - 68.54 12.13 84.54 12.13
Sub Total Fruits + Vegetables 1419.00 181.79 102.48 20.41 1521.48 202.20 592.38 0.00 68.54 12.13 660.92 12.13
III II Yr Maintenance
1 Mango (5m x 5m) Ha. 0.0328 944.08 30.97 - - 944.08 30.97 488.41 - - - 488.41 -
2 Guava (3m x 3m) Ha. 0.0587 548.47 32.17 - - 548.47 32.17 320.31 - - - 320.31 -
3 Apple Ber (5m x 5m) Ha 0.0280 102.33 2.87 - - 102.33 2.87 60.51 - - - 60.51 -
4 Pomegranate (5m x 3m) Ha. 0.0533 170.71 9.11 - - 170.71 9.11 86.29 - - - 86.29 -
5 Citrus (6m x 6m) Ha. 0.0320 291.35 9.32 - - 291.35 9.32 183.40 - - - 183.40 -
6 Acid lime (6m x 6m) Ha. 0.0320 188.94 6.05 - - 188.94 6.05 129.18 - - - 129.18 -
7 Custard apple (2.5 x 2.5m) Ha. 0.0848 57.89 4.91 - - 57.89 4.91 56.69 - - - 56.69 -
8 Fig (2.5m x 2.5m) Ha. 0.0664 38.50 2.56 - - 38.50 2.56 24.40 - - - 24.40 -
TOTAL II 2342.27 97.94 0.00 0.00 2342.27 97.94 1349.19 0.00 0.00 0.00 1349.19 0.00
AAP 2019-20 SPILL OVER/
COMMITTED TOTAL TARGET
ACHIEVEMENT FOR THE
YEAR 2019-20
ACHIEVEMENT FOR SPILL
OVER/ COMMITTED TOTAL ACHIEVEMENT
ANNEXURE - VI - BMIDH - Telangana State - Annual Action Plan & Committed / Spill Over Plan - 2019-20
S.No Components Unit
Subsidy
in Lakhs
TARGETS ACHIEVEMENT
Fin: (Rs. In Lakhs) PROGRESS REPORT UP TO THE MONTH OF DECEMBER - 2019
Page 1 of 4
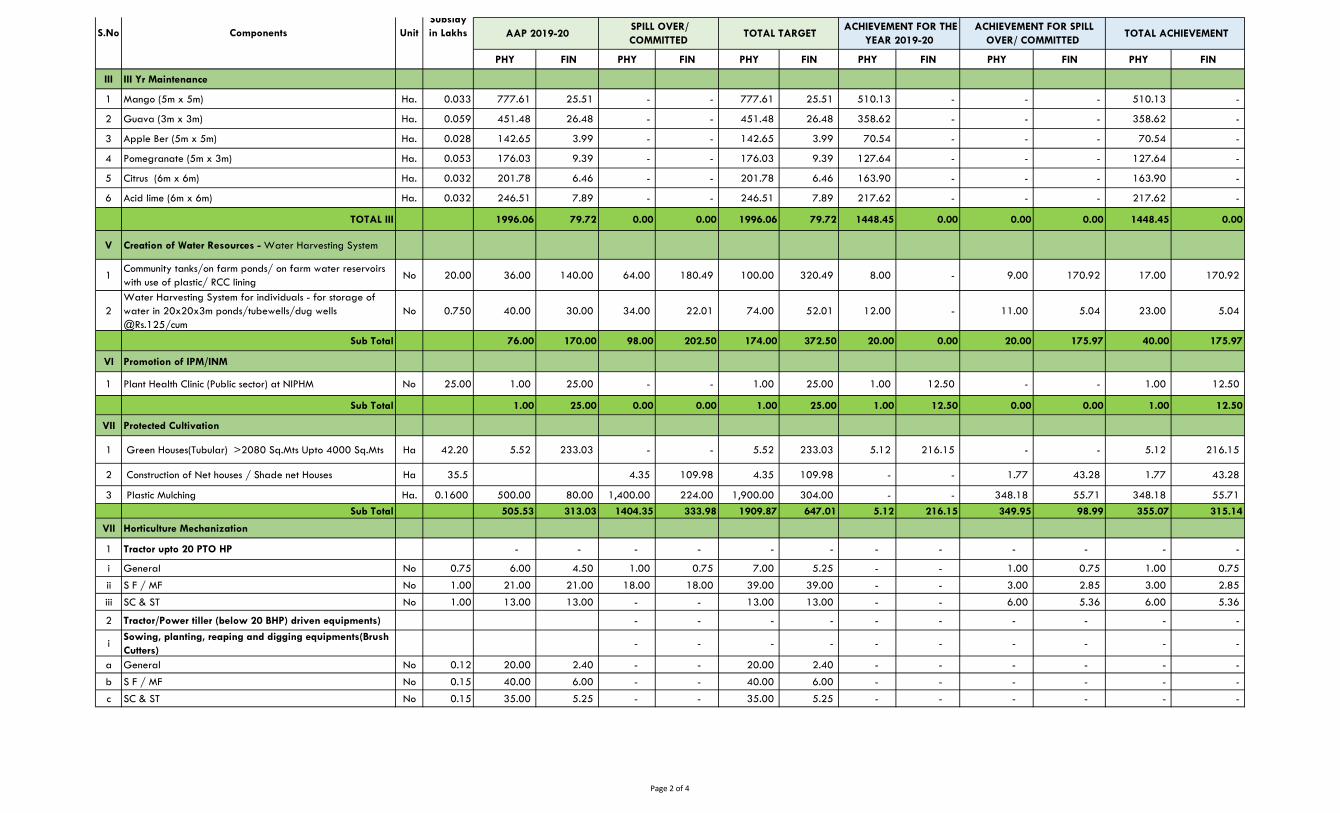
PHY FIN PHY FIN PHY FIN PHY FIN PHY FIN PHY FIN
AAP 2019-20 SPILL OVER/
COMMITTED TOTAL TARGET
ACHIEVEMENT FOR THE
YEAR 2019-20
ACHIEVEMENT FOR SPILL
OVER/ COMMITTED TOTAL ACHIEVEMENT S.No Components Unit
Subsidy
in Lakhs
III III Yr Maintenance
1 Mango (5m x 5m) Ha. 0.033 777.61 25.51 - - 777.61 25.51 510.13 - - - 510.13 -
2 Guava (3m x 3m) Ha. 0.059 451.48 26.48 - - 451.48 26.48 358.62 - - - 358.62 -
3 Apple Ber (5m x 5m) Ha. 0.028 142.65 3.99 - - 142.65 3.99 70.54 - - - 70.54 -
4 Pomegranate (5m x 3m) Ha. 0.053 176.03 9.39 - - 176.03 9.39 127.64 - - - 127.64 -
5 Citrus (6m x 6m) Ha. 0.032 201.78 6.46 - - 201.78 6.46 163.90 - - - 163.90 -
6 Acid lime (6m x 6m) Ha. 0.032 246.51 7.89 - - 246.51 7.89 217.62 - - - 217.62 -
TOTAL III 1996.06 79.72 0.00 0.00 1996.06 79.72 1448.45 0.00 0.00 0.00 1448.45 0.00
V Creation of Water Resources - Water Harvesting System
1Community tanks/on farm ponds/ on farm water reservoirs
with use of plastic/ RCC lining No 20.00 36.00 140.00 64.00 180.49 100.00 320.49 8.00 - 9.00 170.92 17.00 170.92
2
Water Harvesting System for individuals - for storage of
water in 20x20x3m ponds/tubewells/dug wells
@Rs.125/cum
No 0.750 40.00 30.00 34.00 22.01 74.00 52.01 12.00 - 11.00 5.04 23.00 5.04
Sub Total 76.00 170.00 98.00 202.50 174.00 372.50 20.00 0.00 20.00 175.97 40.00 175.97
VI Promotion of IPM/INM
1 Plant Health Clinic (Public sector) at NIPHM No 25.00 1.00 25.00 - - 1.00 25.00 1.00 12.50 - - 1.00 12.50
Sub Total 1.00 25.00 0.00 0.00 1.00 25.00 1.00 12.50 0.00 0.00 1.00 12.50
VII Protected Cultivation
1 Green Houses(Tubular) >2080 Sq.Mts Upto 4000 Sq.Mts Ha 42.20 5.52 233.03 - - 5.52 233.03 5.12 216.15 - - 5.12 216.15
2 Construction of Net houses / Shade net Houses Ha 35.5 4.35 109.98 4.35 109.98 - - 1.77 43.28 1.77 43.28
3 Plastic Mulching Ha. 0.1600 500.00 80.00 1,400.00 224.00 1,900.00 304.00 - - 348.18 55.71 348.18 55.71
Sub Total 505.53 313.03 1404.35 333.98 1909.87 647.01 5.12 216.15 349.95 98.99 355.07 315.14
VII Horticulture Mechanization
1 Tractor upto 20 PTO HP - - - - - - - - - - - -
i General No 0.75 6.00 4.50 1.00 0.75 7.00 5.25 - - 1.00 0.75 1.00 0.75
ii S F / MF No 1.00 21.00 21.00 18.00 18.00 39.00 39.00 - - 3.00 2.85 3.00 2.85
iii SC & ST No 1.00 13.00 13.00 - - 13.00 13.00 - - 6.00 5.36 6.00 5.36
2 Tractor/Power tiller (below 20 BHP) driven equipments) - - - - - - - - - -
iSowing, planting, reaping and digging equipments(Brush
Cutters)- - - - - - - - - -
a General No 0.12 20.00 2.40 - - 20.00 2.40 - - - - - -
b S F / MF No 0.15 40.00 6.00 - - 40.00 6.00 - - - - - -
c SC & ST No 0.15 35.00 5.25 - - 35.00 5.25 - - - - - -
Page 2 of 4
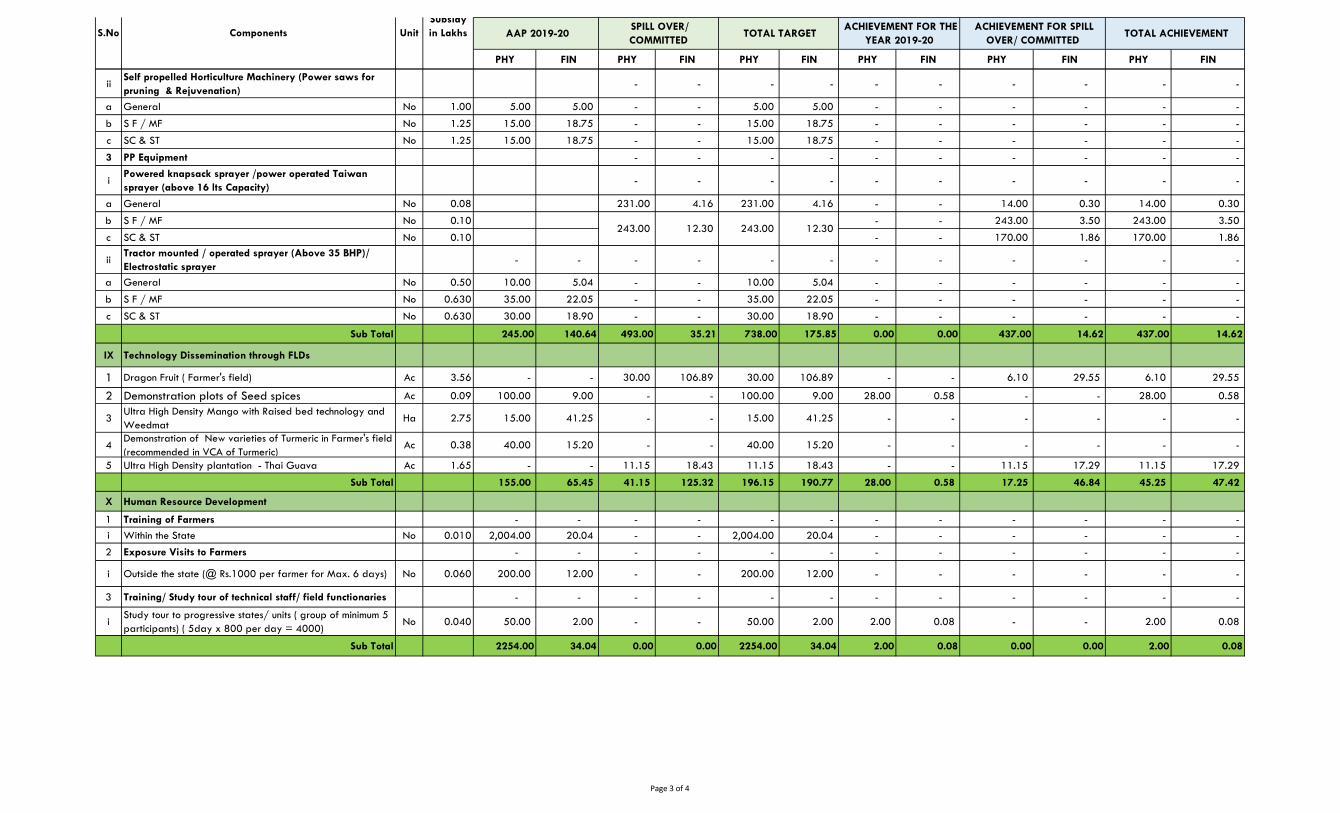
PHY FIN PHY FIN PHY FIN PHY FIN PHY FIN PHY FIN
AAP 2019-20 SPILL OVER/
COMMITTED TOTAL TARGET
ACHIEVEMENT FOR THE
YEAR 2019-20
ACHIEVEMENT FOR SPILL
OVER/ COMMITTED TOTAL ACHIEVEMENT S.No Components Unit
Subsidy
in Lakhs
iiSelf propelled Horticulture Machinery (Power saws for
pruning & Rejuvenation)- - - - - - - - - -
a General No 1.00 5.00 5.00 - - 5.00 5.00 - - - - - -
b S F / MF No 1.25 15.00 18.75 - - 15.00 18.75 - - - - - -
c SC & ST No 1.25 15.00 18.75 - - 15.00 18.75 - - - - - -
3 PP Equipment - - - - - - - - - -
iPowered knapsack sprayer /power operated Taiwan
sprayer (above 16 lts Capacity)- - - - - - - - - -
a General No 0.08 231.00 4.16 231.00 4.16 - - 14.00 0.30 14.00 0.30
b S F / MF No 0.10 - - 243.00 3.50 243.00 3.50
c SC & ST No 0.10 - - 170.00 1.86 170.00 1.86
iiTractor mounted / operated sprayer (Above 35 BHP)/
Electrostatic sprayer- - - - - - - - - - - -
a General No 0.50 10.00 5.04 - - 10.00 5.04 - - - - - -
b S F / MF No 0.630 35.00 22.05 - - 35.00 22.05 - - - - - -
c SC & ST No 0.630 30.00 18.90 - - 30.00 18.90 - - - - - -
Sub Total 245.00 140.64 493.00 35.21 738.00 175.85 0.00 0.00 437.00 14.62 437.00 14.62
IX Technology Dissemination through FLDs
1 Dragon Fruit ( Farmer's field) Ac 3.56 - - 30.00 106.89 30.00 106.89 - - 6.10 29.55 6.10 29.55
2 Demonstration plots of Seed spices Ac 0.09 100.00 9.00 - - 100.00 9.00 28.00 0.58 - - 28.00 0.58
3Ultra High Density Mango with Raised bed technology and
Weedmat Ha 2.75 15.00 41.25 - - 15.00 41.25 - - - - - -
4Demonstration of New varieties of Turmeric in Farmer's field
(recommended in VCA of Turmeric)Ac 0.38 40.00 15.20 - - 40.00 15.20 - - - - - -
5 Ultra High Density plantation - Thai Guava Ac 1.65 - - 11.15 18.43 11.15 18.43 - - 11.15 17.29 11.15 17.29
Sub Total 155.00 65.45 41.15 125.32 196.15 190.77 28.00 0.58 17.25 46.84 45.25 47.42
X Human Resource Development
1 Training of Farmers - - - - - - - - - - - -
i Within the State No 0.010 2,004.00 20.04 - - 2,004.00 20.04 - - - - - -
2 Exposure Visits to Farmers - - - - - - - - - - - -
i Outside the state (@ Rs.1000 per farmer for Max. 6 days) No 0.060 200.00 12.00 - - 200.00 12.00 - - - - - -
3 Training/ Study tour of technical staff/ field functionaries - - - - - - - - - - - -
iStudy tour to progressive states/ units ( group of minimum 5
participants) ( 5day x 800 per day = 4000)No 0.040 50.00 2.00 - - 50.00 2.00 2.00 0.08 - - 2.00 0.08
Sub Total 2254.00 34.04 0.00 0.00 2254.00 34.04 2.00 0.08 0.00 0.00 2.00 0.08
243.00 12.30 243.00 12.30
Page 3 of 4
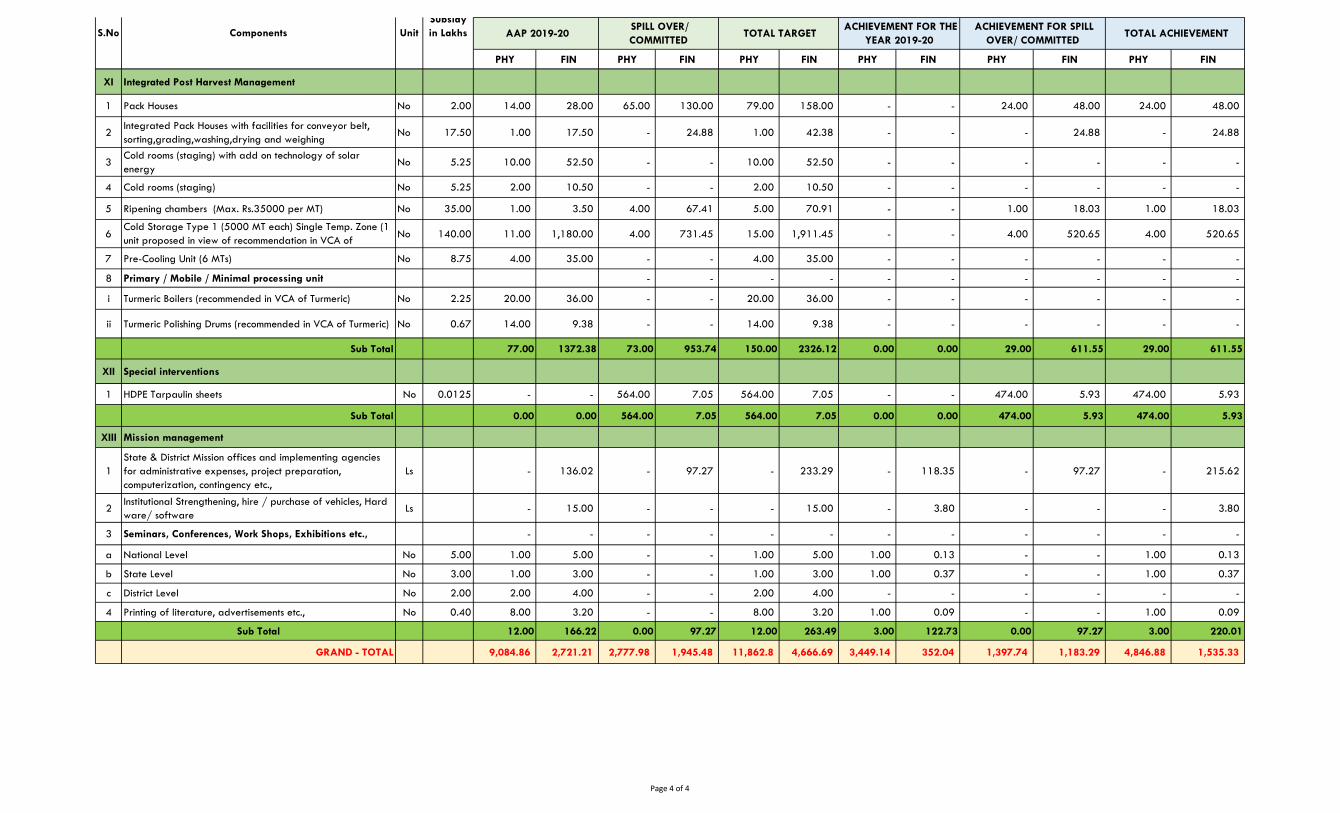
PHY FIN PHY FIN PHY FIN PHY FIN PHY FIN PHY FIN
AAP 2019-20 SPILL OVER/
COMMITTED TOTAL TARGET
ACHIEVEMENT FOR THE
YEAR 2019-20
ACHIEVEMENT FOR SPILL
OVER/ COMMITTED TOTAL ACHIEVEMENT S.No Components Unit
Subsidy
in Lakhs
XI Integrated Post Harvest Management
1 Pack Houses No 2.00 14.00 28.00 65.00 130.00 79.00 158.00 - - 24.00 48.00 24.00 48.00
2Integrated Pack Houses with facilities for conveyor belt,
sorting,grading,washing,drying and weighingNo 17.50 1.00 17.50 - 24.88 1.00 42.38 - - - 24.88 - 24.88
3Cold rooms (staging) with add on technology of solar
energyNo 5.25 10.00 52.50 - - 10.00 52.50 - - - - - -
4 Cold rooms (staging) No 5.25 2.00 10.50 - - 2.00 10.50 - - - - - -
5 Ripening chambers (Max. Rs.35000 per MT) No 35.00 1.00 3.50 4.00 67.41 5.00 70.91 - - 1.00 18.03 1.00 18.03
6Cold Storage Type 1 (5000 MT each) Single Temp. Zone (1
unit proposed in view of recommendation in VCA of
Turmeric)
No 140.00 11.00 1,180.00 4.00 731.45 15.00 1,911.45 - - 4.00 520.65 4.00 520.65
7 Pre-Cooling Unit (6 MTs) No 8.75 4.00 35.00 - - 4.00 35.00 - - - - - -
8 Primary / Mobile / Minimal processing unit - - - - - - - - - -
i Turmeric Boilers (recommended in VCA of Turmeric) No 2.25 20.00 36.00 - - 20.00 36.00 - - - - - -
ii Turmeric Polishing Drums (recommended in VCA of Turmeric) No 0.67 14.00 9.38 - - 14.00 9.38 - - - - - -
Sub Total 77.00 1372.38 73.00 953.74 150.00 2326.12 0.00 0.00 29.00 611.55 29.00 611.55
XII Special interventions
1 HDPE Tarpaulin sheets No 0.0125 - - 564.00 7.05 564.00 7.05 - - 474.00 5.93 474.00 5.93
Sub Total 0.00 0.00 564.00 7.05 564.00 7.05 0.00 0.00 474.00 5.93 474.00 5.93
XIII Mission management
1
State & District Mission offices and implementing agencies
for administrative expenses, project preparation,
computerization, contingency etc.,
Ls - 136.02 - 97.27 - 233.29 - 118.35 - 97.27 - 215.62
2Institutional Strengthening, hire / purchase of vehicles, Hard
ware/ software Ls - 15.00 - - - 15.00 - 3.80 - - - 3.80
3 Seminars, Conferences, Work Shops, Exhibitions etc., - - - - - - - - - - - -
a National Level No 5.00 1.00 5.00 - - 1.00 5.00 1.00 0.13 - - 1.00 0.13
b State Level No 3.00 1.00 3.00 - - 1.00 3.00 1.00 0.37 - - 1.00 0.37
c District Level No 2.00 2.00 4.00 - - 2.00 4.00 - - - - - -
4 Printing of literature, advertisements etc., No 0.40 8.00 3.20 - - 8.00 3.20 1.00 0.09 - - 1.00 0.09
Sub Total 12.00 166.22 0.00 97.27 12.00 263.49 3.00 122.73 0.00 97.27 3.00 220.01
GRAND - TOTAL 9,084.86 2,721.21 2,777.98 1,945.48 11,862.8 4,666.69 3,449.14 352.04 1,397.74 1,183.29 4,846.88 1,535.33
Page 4 of 4
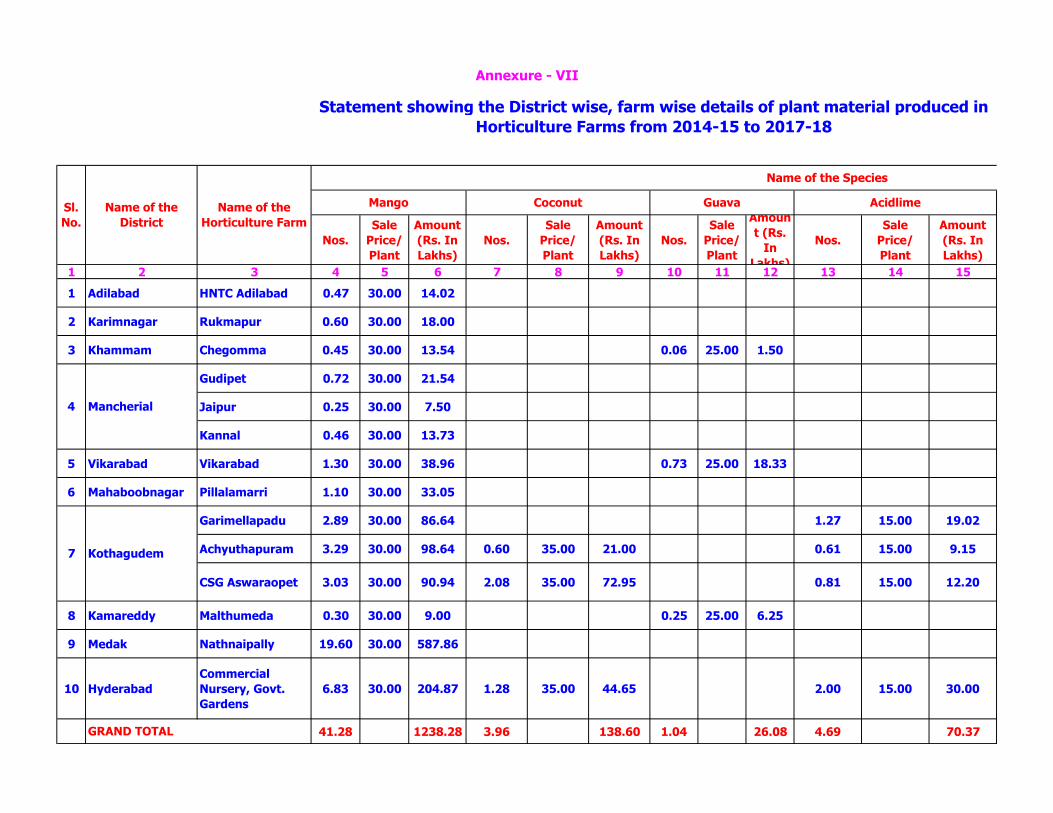
Nos.
Sale
Price/
Plant
Amount
(Rs. In
Lakhs)
Nos.
Sale
Price/
Plant
Amount
(Rs. In
Lakhs)
Nos.
Sale
Price/
Plant
Amoun
t (Rs.
In
Lakhs)
Nos.
Sale
Price/
Plant
Amount
(Rs. In
Lakhs)
1 2 3 4 5 6 7 8 9 10 11 12 13 14 15
1 Adilabad HNTC Adilabad 0.47 30.00 14.02
2 Karimnagar Rukmapur 0.60 30.00 18.00
3 Khammam Chegomma 0.45 30.00 13.54 0.06 25.00 1.50
Gudipet 0.72 30.00 21.54
Jaipur 0.25 30.00 7.50
Kannal 0.46 30.00 13.73
5 Vikarabad Vikarabad 1.30 30.00 38.96 0.73 25.00 18.33
6 Mahaboobnagar Pillalamarri 1.10 30.00 33.05
Garimellapadu 2.89 30.00 86.64 1.27 15.00 19.02
Achyuthapuram 3.29 30.00 98.64 0.60 35.00 21.00 0.61 15.00 9.15
CSG Aswaraopet 3.03 30.00 90.94 2.08 35.00 72.95 0.81 15.00 12.20
8 Kamareddy Malthumeda 0.30 30.00 9.00 0.25 25.00 6.25
9 Medak Nathnaipally 19.60 30.00 587.86
10 Hyderabad
Commercial
Nursery, Govt.
Gardens
6.83 30.00 204.87 1.28 35.00 44.65 2.00 15.00 30.00
41.28 1238.28 3.96 138.60 1.04 26.08 4.69 70.37
Mango Coconut Guava Acidlime
GRAND TOTAL
Sl.
No.
Name of the
District
Name of the
Horticulture Farm
Name of the Species
Annexure - VII
Statement showing the District wise, farm wise details of plant material produced in
Horticulture Farms from 2014-15 to 2017-18
4 Mancherial
7 Kothagudem
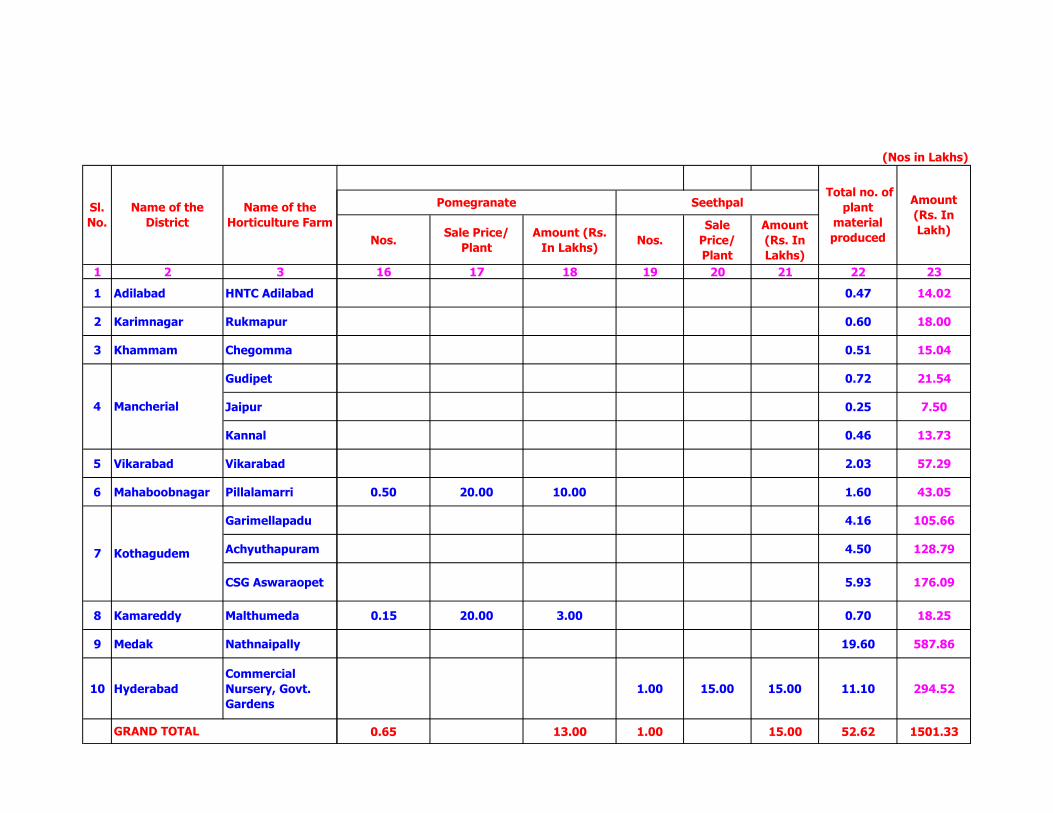
1 2 3
1 Adilabad HNTC Adilabad
2 Karimnagar Rukmapur
3 Khammam Chegomma
Gudipet
Jaipur
Kannal
5 Vikarabad Vikarabad
6 Mahaboobnagar Pillalamarri
Garimellapadu
Achyuthapuram
CSG Aswaraopet
8 Kamareddy Malthumeda
9 Medak Nathnaipally
10 Hyderabad
Commercial
Nursery, Govt.
Gardens
GRAND TOTAL
Sl.
No.
Name of the
District
Name of the
Horticulture Farm
4 Mancherial
7 Kothagudem
Nos.Sale Price/
Plant
Amount (Rs.
In Lakhs)Nos.
Sale
Price/
Plant
Amount
(Rs. In
Lakhs)
16 17 18 19 20 21 22 23
0.47 14.02
0.60 18.00
0.51 15.04
0.72 21.54
0.25 7.50
0.46 13.73
2.03 57.29
0.50 20.00 10.00 1.60 43.05
4.16 105.66
4.50 128.79
5.93 176.09
0.15 20.00 3.00 0.70 18.25
19.60 587.86
1.00 15.00 15.00 11.10 294.52
0.65 13.00 1.00 15.00 52.62 1501.33
Total no. of
plant
material
produced
Amount
(Rs. In
Lakh)
(Nos in Lakhs)
Pomegranate Seethpal
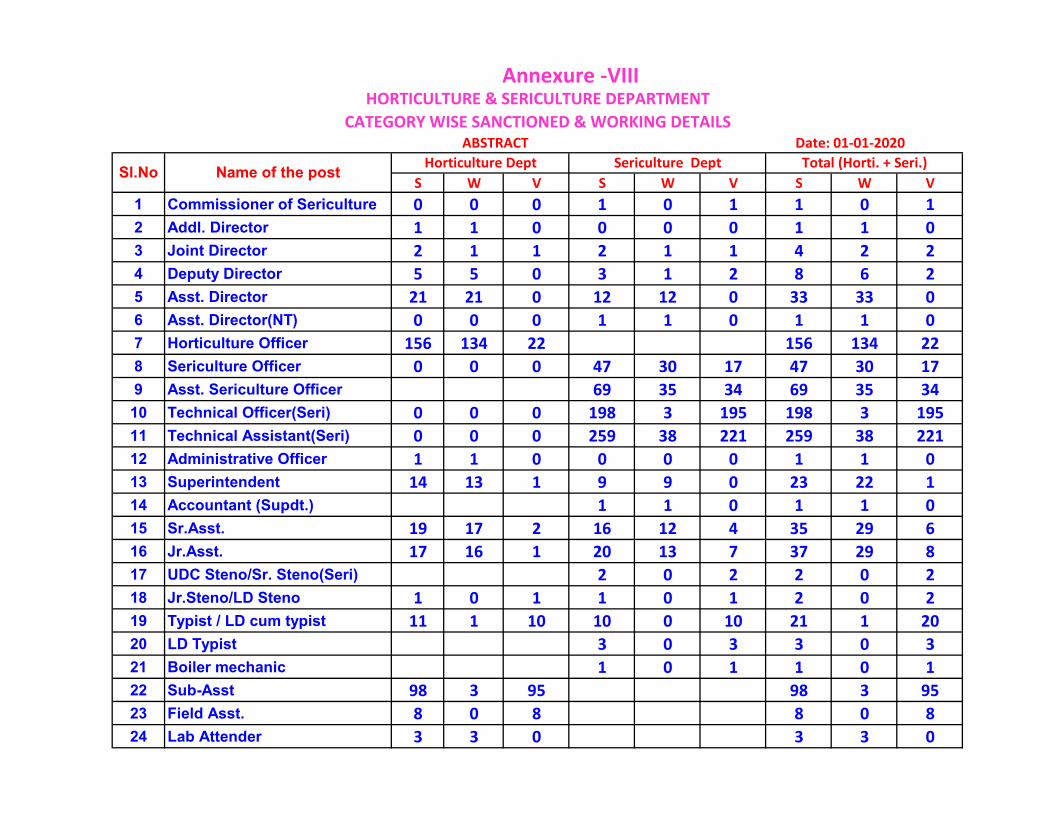
S W V S W V S W V
1 Commissioner of Sericulture 0 0 0 1 0 1 1 0 1
2 Addl. Director 1 1 0 0 0 0 1 1 0
3 Joint Director 2 1 1 2 1 1 4 2 2
4 Deputy Director 5 5 0 3 1 2 8 6 2
5 Asst. Director 21 21 0 12 12 0 33 33 0
6 Asst. Director(NT) 0 0 0 1 1 0 1 1 0
7 Horticulture Officer 156 134 22 156 134 22
8 Sericulture Officer 0 0 0 47 30 17 47 30 17
9 Asst. Sericulture Officer 69 35 34 69 35 34
10 Technical Officer(Seri) 0 0 0 198 3 195 198 3 195
11 Technical Assistant(Seri) 0 0 0 259 38 221 259 38 221
12 Administrative Officer 1 1 0 0 0 0 1 1 0
13 Superintendent 14 13 1 9 9 0 23 22 1
14 Accountant (Supdt.) 1 1 0 1 1 0
15 Sr.Asst. 19 17 2 16 12 4 35 29 6
16 Jr.Asst. 17 16 1 20 13 7 37 29 8
17 UDC Steno/Sr. Steno(Seri) 2 0 2 2 0 2
18 Jr.Steno/LD Steno 1 0 1 1 0 1 2 0 2
19 Typist / LD cum typist 11 1 10 10 0 10 21 1 20
20 LD Typist 3 0 3 3 0 3
21 Boiler mechanic 1 0 1 1 0 1
22 Sub-Asst 98 3 95 98 3 95
23 Field Asst. 8 0 8 8 0 8
24 Lab Attender 3 3 0 3 3 0
Annexure -VIIIHORTICULTURE & SERICULTURE DEPARTMENT
CATEGORY WISE SANCTIONED & WORKING DETAILS
ABSTRACT Date: 01-01-2020
Sl.No Name of the postHorticulture Dept Sericulture Dept Total (Horti. + Seri.)
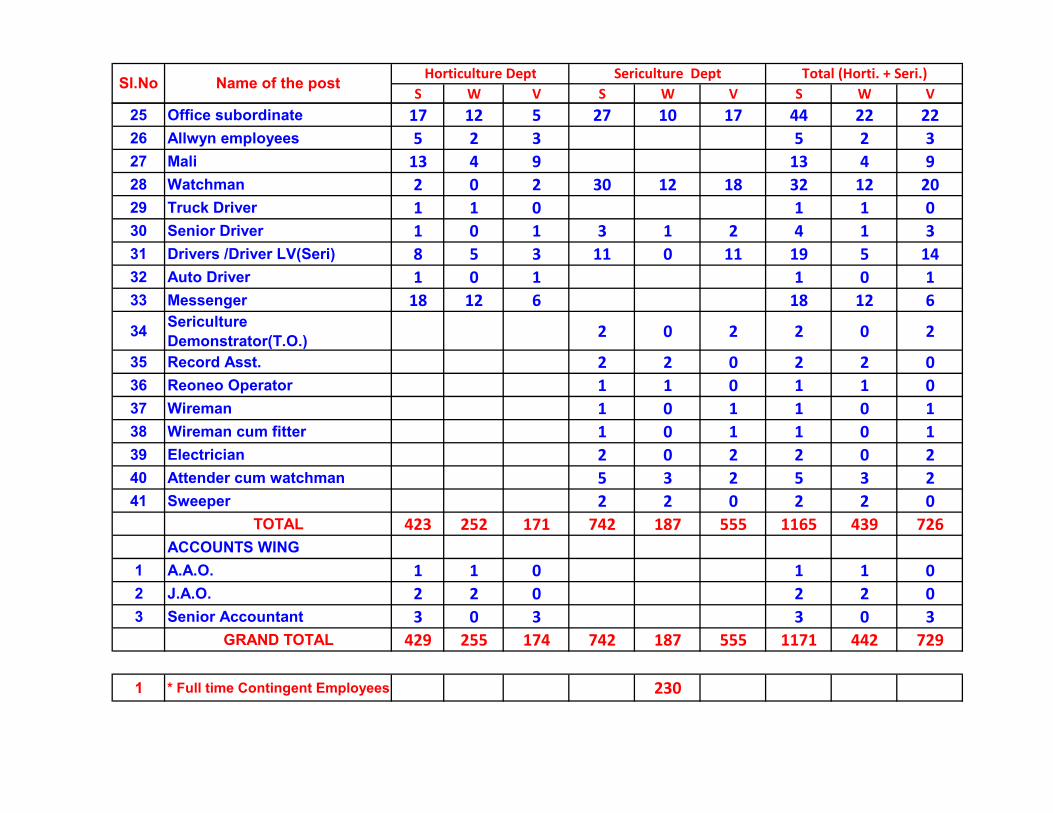
S W V S W V S W VSl.No Name of the post
Horticulture Dept Sericulture Dept Total (Horti. + Seri.)
25 Office subordinate 17 12 5 27 10 17 44 22 22
26 Allwyn employees 5 2 3 5 2 3
27 Mali 13 4 9 13 4 9
28 Watchman 2 0 2 30 12 18 32 12 20
29 Truck Driver 1 1 0 1 1 0
30 Senior Driver 1 0 1 3 1 2 4 1 3
31 Drivers /Driver LV(Seri) 8 5 3 11 0 11 19 5 14
32 Auto Driver 1 0 1 1 0 1
33 Messenger 18 12 6 18 12 6
34Sericulture
Demonstrator(T.O.)2 0 2 2 0 2
35 Record Asst. 2 2 0 2 2 0
36 Reoneo Operator 1 1 0 1 1 0
37 Wireman 1 0 1 1 0 1
38 Wireman cum fitter 1 0 1 1 0 1
39 Electrician 2 0 2 2 0 2
40 Attender cum watchman 5 3 2 5 3 2
41 Sweeper 2 2 0 2 2 0
TOTAL 423 252 171 742 187 555 1165 439 726
ACCOUNTS WING
1 A.A.O. 1 1 0 1 1 0
2 J.A.O. 2 2 0 2 2 0
3 Senior Accountant 3 0 3 3 0 3
GRAND TOTAL 429 255 174 742 187 555 1171 442 729
1 * Full time Contingent Employees 230
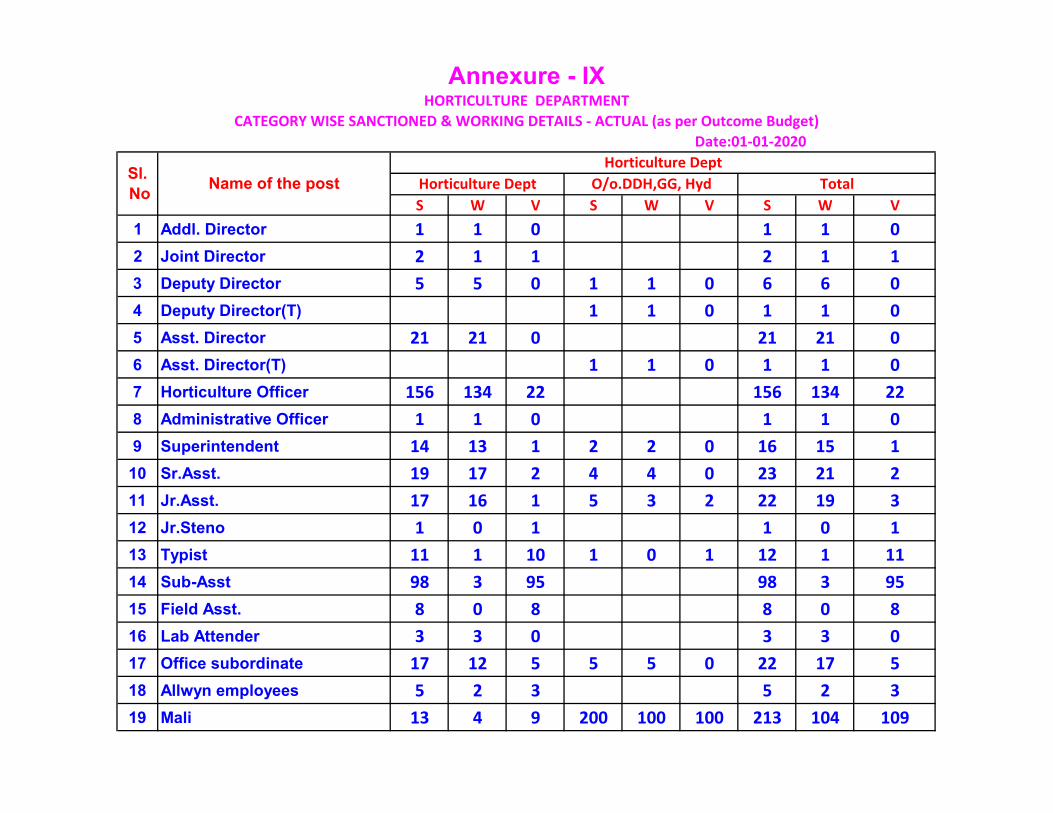
S W V S W V S W V
1 Addl. Director 1 1 0 1 1 0
2 Joint Director 2 1 1 2 1 1
3 Deputy Director 5 5 0 1 1 0 6 6 0
4 Deputy Director(T) 1 1 0 1 1 0
5 Asst. Director 21 21 0 21 21 0
6 Asst. Director(T) 1 1 0 1 1 0
7 Horticulture Officer 156 134 22 156 134 22
8 Administrative Officer 1 1 0 1 1 0
9 Superintendent 14 13 1 2 2 0 16 15 1
10 Sr.Asst. 19 17 2 4 4 0 23 21 2
11 Jr.Asst. 17 16 1 5 3 2 22 19 3
12 Jr.Steno 1 0 1 1 0 1
13 Typist 11 1 10 1 0 1 12 1 11
14 Sub-Asst 98 3 95 98 3 95
15 Field Asst. 8 0 8 8 0 8
16 Lab Attender 3 3 0 3 3 0
17 Office subordinate 17 12 5 5 5 0 22 17 5
18 Allwyn employees 5 2 3 5 2 3
19 Mali 13 4 9 200 100 100 213 104 109
Annexure - IXHORTICULTURE DEPARTMENT
CATEGORY WISE SANCTIONED & WORKING DETAILS - ACTUAL (as per Outcome Budget)
Date:01-01-2020
Sl.
NoName of the post
Horticulture Dept
Horticulture Dept O/o.DDH,GG, Hyd Total
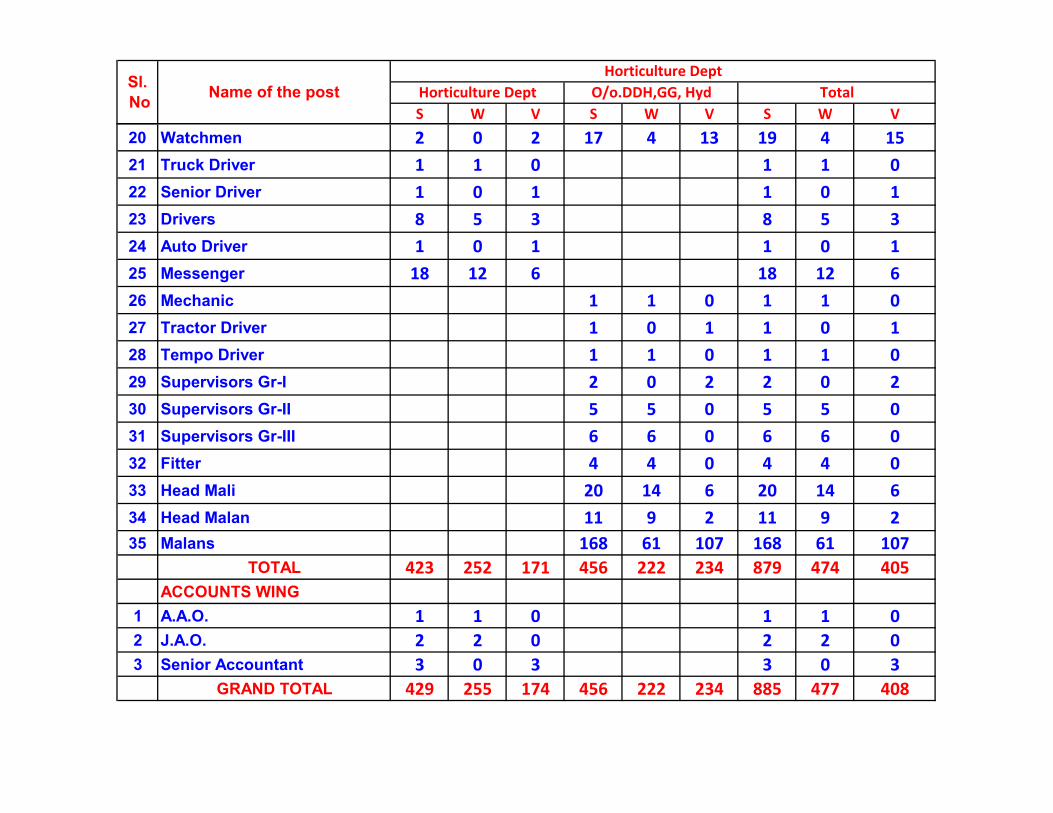
S W V S W V S W V
Sl.
NoName of the post
Horticulture Dept
Horticulture Dept O/o.DDH,GG, Hyd Total
20 Watchmen 2 0 2 17 4 13 19 4 15
21 Truck Driver 1 1 0 1 1 0
22 Senior Driver 1 0 1 1 0 1
23 Drivers 8 5 3 8 5 3
24 Auto Driver 1 0 1 1 0 1
25 Messenger 18 12 6 18 12 6
26 Mechanic 1 1 0 1 1 0
27 Tractor Driver 1 0 1 1 0 1
28 Tempo Driver 1 1 0 1 1 0
29 Supervisors Gr-I 2 0 2 2 0 2
30 Supervisors Gr-II 5 5 0 5 5 0
31 Supervisors Gr-III 6 6 0 6 6 0
32 Fitter 4 4 0 4 4 0
33 Head Mali 20 14 6 20 14 6
34 Head Malan 11 9 2 11 9 2
35 Malans 168 61 107 168 61 107
TOTAL 423 252 171 456 222 234 879 474 405
ACCOUNTS WING
1 A.A.O. 1 1 0 1 1 0
2 J.A.O. 2 2 0 2 2 0
3 Senior Accountant 3 0 3 3 0 3
GRAND TOTAL 429 255 174 456 222 234 885 477 408
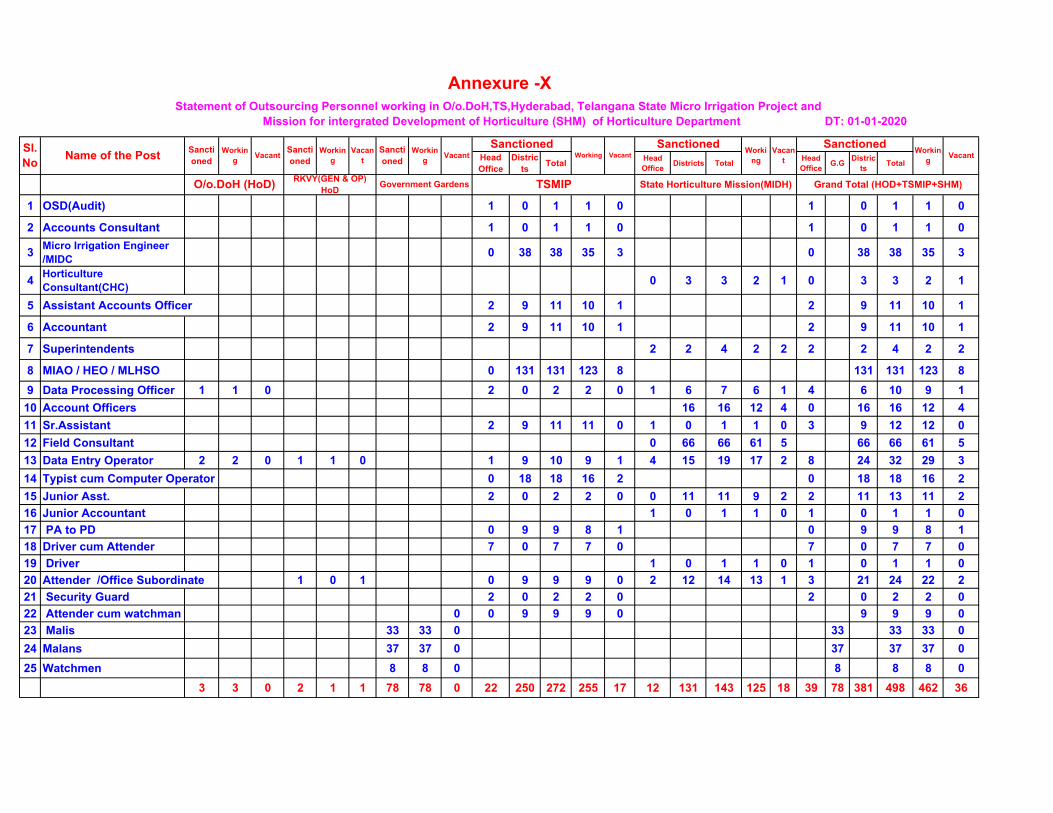
Head
Office
Distric
tsTotal
Head
OfficeDistricts Total
Head
OfficeG.G
Distric
tsTotal
1 OSD(Audit) 1 0 1 1 0 1 0 1 1 0
2 Accounts Consultant 1 0 1 1 0 1 0 1 1 0
3Micro Irrigation Engineer
/MIDC0 38 38 35 3 0 38 38 35 3
4Horticulture
Consultant(CHC)0 3 3 2 1 0 3 3 2 1
5 Assistant Accounts Officer 2 9 11 10 1 2 9 11 10 1
6 Accountant 2 9 11 10 1 2 9 11 10 1
7 Superintendents 2 2 4 2 2 2 2 4 2 2
8 MIAO / HEO / MLHSO 0 131 131 123 8 131 131 123 8
9 Data Processing Officer 1 1 0 2 0 2 2 0 1 6 7 6 1 4 6 10 9 1
10 Account Officers 16 16 12 4 0 16 16 12 4
11 Sr.Assistant 2 9 11 11 0 1 0 1 1 0 3 9 12 12 0
12 Field Consultant 0 66 66 61 5 66 66 61 5
13 Data Entry Operator 2 2 0 1 1 0 1 9 10 9 1 4 15 19 17 2 8 24 32 29 3
14 Typist cum Computer Operator 0 18 18 16 2 0 18 18 16 2
15 Junior Asst. 2 0 2 2 0 0 11 11 9 2 2 11 13 11 2
16 Junior Accountant 1 0 1 1 0 1 0 1 1 0
17 PA to PD 0 9 9 8 1 0 9 9 8 1
18 Driver cum Attender 7 0 7 7 0 7 0 7 7 0
19 Driver 1 0 1 1 0 1 0 1 1 0
20 Attender /Office Subordinate 1 0 1 0 9 9 9 0 2 12 14 13 1 3 21 24 22 2
21 Security Guard 2 0 2 2 0 2 0 2 2 0
22 Attender cum watchman 0 0 9 9 9 0 9 9 9 0
23 Malis 33 33 0 33 33 33 0
24 Malans 37 37 0 37 37 37 0
25 Watchmen 8 8 0 8 8 8 0
3 3 0 2 1 1 78 78 0 22 250 272 255 17 12 131 143 125 18 39 78 381 498 462 36
Annexure -X
Sanctioned
Statement of Outsourcing Personnel working in O/o.DoH,TS,Hyderabad, Telangana State Micro Irrigation Project and
Mission for intergrated Development of Horticulture (SHM) of Horticulture Department DT: 01-01-2020
Sl.
NoName of the Post
Sancti
oned
Workin
gVacant
Sancti
oned
Workin
g
Vacan
t
Sancti
oned
Workin
gVacant
SanctionedWorking Vacant
O/o.DoH (HoD)RKVY(GEN & OP)
HoDGovernment Gardens TSMIP
Vacant
Grand Total (HOD+TSMIP+SHM)State Horticulture Mission(MIDH)
Worki
ng
Vacan
t
SanctionedWorkin
g
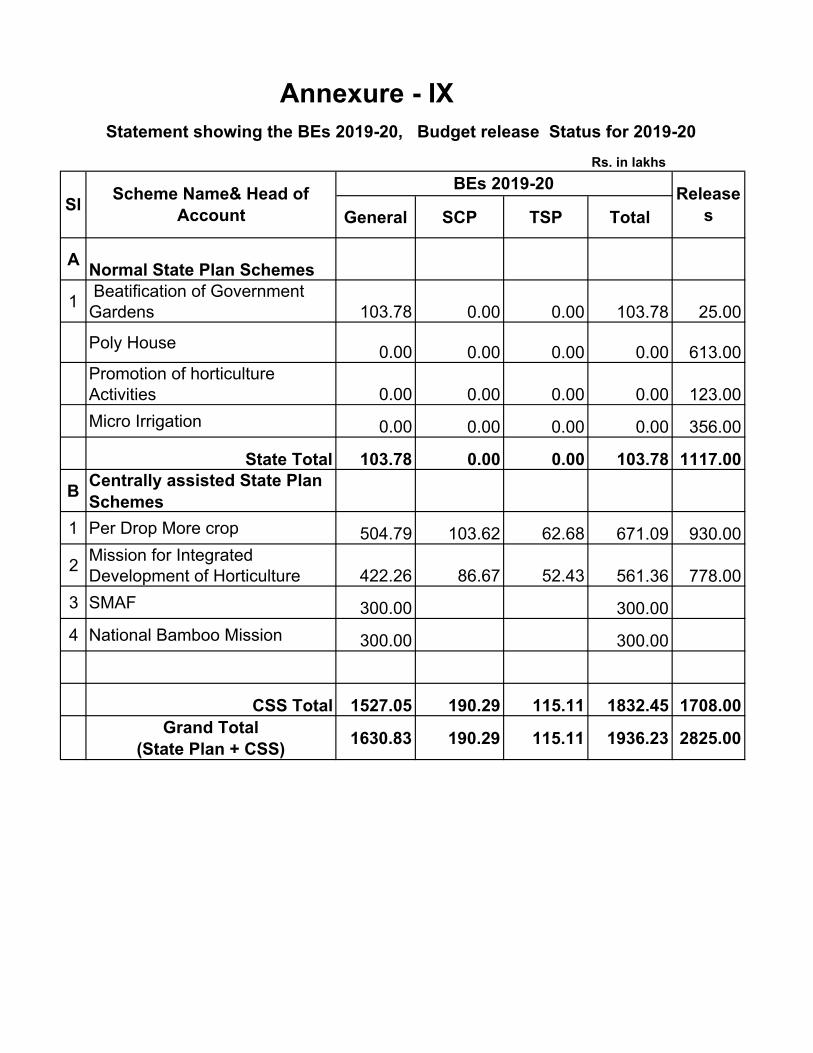
General SCP TSP Total
ANormal State Plan Schemes
1 Beatification of Government
Gardens 103.78 0.00 0.00 103.78 25.00
Poly House0.00 0.00 0.00 0.00 613.00
Promotion of horticulture
Activities 0.00 0.00 0.00 0.00 123.00
Micro Irrigation 0.00 0.00 0.00 0.00 356.00
State Total 103.78 0.00 0.00 103.78 1117.00
BCentrally assisted State Plan
Schemes
1 Per Drop More crop 504.79 103.62 62.68 671.09 930.00
2Mission for Integrated
Development of Horticulture 422.26 86.67 52.43 561.36 778.00
3 SMAF 300.00 300.00
4 National Bamboo Mission 300.00 300.00
CSS Total 1527.05 190.29 115.11 1832.45 1708.00
Grand Total
(State Plan + CSS)1630.83 190.29 115.11 1936.23 2825.00
Release
s
Statement showing the BEs 2019-20, Budget release Status for 2019-20
Annexure - IX
Rs. in lakhs
SlScheme Name& Head of
Account
BEs 2019-20
Top Related