


Languages
Pages
Legal


. , DOCUMENT RESUME
ED 083 568 CS 000 S06
AUTHOR Goulet, L. R.TITLE Age, School Experience and the Development of
Visual-Perceptual Memory. Final Report, Part 2.INSTITUTION Illinois Univ.,-Urbana.SPONS AGENCY Office of Education (DHEW), Washington, D.C.BUREAU NO . BR-1-E-124PUB DATE 73GRANT OEG -5 -72 -0020 (509)NOTE 88p.; See related document CS 000 805
EDRS.PRICEDESCRIPTORS
MF-$0.65 HC-$3.29Age; *Age Differences; *Educational Experience;Educational Research; Grade 1; Kindergarten;Learning; *Task Performance; *Tests; *VisualPerception
ABSTRACTThis study attempted to investigate the effects of
school experience on visual perception tests involving line figuresand forms. There were two experiments in this study. Experiment 1examined the independent and interactive influences of schoolexperience and chronological age in kindergarten children. Experiment2 compared the effects of kindergarten and first grade curricula-onperformance on visual perception tests. In experiment 2, atest-retest design was used with kindergarten a'nd first gradechildren whose birthdays were close to the December. 1 cut-off date,so that the two groups were less than one month apart ip age. Thetests used were the Developmental Test of Visual Perception:, theVisual Memory Test,' the Visual Motor Gestalt Test, the VisualSequential Memory subtest of the Test of Psycholinguistic,Abilities the Southern California Figure.-Ground Visual Perceptiop'Test, and the Visual III from the Reading Aptitude Tests. The resultsof experiment 2 suggested that the interaction effects indicated agreater change in six months for the kindergarten children incomparison to first grade children. Also, the present normativegroups based. on age penalize the child who is among the olderchildren in his grade. (WR)

FILMED FROM BEST AVAILABLE COPY
II 1 Of *Eftt Of 111111.DUC IO,IIV
WtU ALL +411eitlitt Oft DUCtiOft
DOC,64E*10 .41 OFF% F*0OL)CFLI ECtoor aFy,0%0 0NS141/ .0% 04,C.
A* ,/ 00.01 Of vifw 01 C .Cov%tAlF D 0,1 SDI f
Lf Of %As 011AL utt Of/.D/ PC,50/.0.4, Of rot
Age, School Experience and the Development
of Visual-Perceptual Memory
L. R. Goulet
University of Illinois, Urbana-Champaign
r:naki (aitt z )q ant- IVo. 1-E- ayPrze..ct . 0E6-- 5 -72 -oo20 Csa,

1
INTRODUCTION
The development of visual perceptual skills are of considerable
interest to educators. Certain visual skills (along with auditory
skills) have been postulated to be essential to beginning reading. For
example, Spache and Spache (1969) end a discussion of visual perceptual
skills by saying: "Reading is first and 17cremost a visual task for the
beginning reader and almost impossible for him to accomplish without the
perceptual and discriminative abilities we have stressed" (page 199).
Furthermore, a number of studies (e.g., Barrett, 1965a; Coins, 1958;
Monroe, 1935) have found moderate correlations between different tests
of visual skills and first grade reading achievement. Studies involving
children from grade three on (e.g., Phelan, 1940) have found little
correlation between visual perception test scores and reading achievement.
There is no common agreement as to whether there are discrete visual
perceptual skills which develop independently or whether there is a
single unitary set of skills used in processing visual input. Neverthe
less, visual discrimination skills, such as the ability to detect and
respond to differences in characteristics such as form, are almost
invariably included in the skills meant when a test is labeled "a test
of visual perceptual skills." Less commonly, the cognitive skills needed
to give meaning to visual stimuli are included in the term.
Reading readiness tests also contain a variety of tasks which are
used to determine if a child has the skills needed to learn to read.
A large proportion of the tasks on these tests involve visual discrimina
tion skills, e.g., matching words to a sample, marking the picture that
is different in a group, etc. Statistically, the best predictor of first

2
grade reading success is the ability to name letters. However, educators,
e.g. Barrett (1965a) have viewed this particular task as being strongly
influenced by environmental factors and have sought to develop tests
using pictures, forms, etc. which reflect the "potential to learn to
read" more than achievement.
Tests have also been devised for use with chi'dren who are having
difficulties in school. These ts, e.g., the Developmental Test of
Visual Perception (Frostig, 1961), the Southern California Figure-Ground
Visual Perception Test (Ayres, 1966), purport to measure different visual
skills postulated to be important for school achievement. Each test or
subtest attempts to focus on one particular skill (as defined by the test
author).
Both reading readiness tests and visual perception tests are con-
cerned with the skills needed for academic achievement and often contain
very similar items. The readiness tests are more likely to use letters
or words as stimuli and the visual perception tests typically involve
geometric forms or pictures. However, the task demands, such as matching
on the basis of certain physical characteristics or copying the sample,
are the same for both the readiness and perception tests even though
these two types of tests have quite different norm standards. On a
readiness test, the child is ranked in comparison to other children of
the same grade placement regardless of chronological age. On the "diagnos-
tic" visual perception tests, the child is ranked in terms of children
of the same chronological age regardless of the amount of school expe-
rience. In both instances, as much as a whole year variation in terms

3
of the other variables not considered is possible. The question arises
as to whether either normative group selected on only one factor (either
school experience or chronological age) is appropriate and if so, which
one.
In the reports of the normative data for the visual perception tests
4t%the mean scores differ by several points for children of different age
groups (generally three or six month intervals) but the standard devia-
tions within each age group tend to be fairly large. Often the differences
in the mean scores for children a year or more different in age are less
than one standard deviation. None of the existing tests of visual per-
ception skills have grade placement norms so the degree of overlap between
children with known differences in school experience cannot be examined.
Most kindergarten and first grade curricula contain a variety of
activities designed to foster the development of visual skills. If these
activities are effective, the amount of school experience, i.e. the
exposure to such activities over an academic year snould affect perfo
mance on visual perception tests. On the other hand, if factors related
to physical maturation (i.e. neural development) are primarily responsible
for the development of visual perceptual skills, the effects of school
experience (with age controlled) on such skills should be limited. No
study could be found which examined the influences of these two factors.
In terms of the role of school experience there is a dilemma. If
school experience is an important factor in the development of visual
perceptual skills, how likely are we to make incorrect decisions with
norms based on chronological age? Furthermore, if school experience
facilitates the development of such skills we need to know what kinds

4
of experiences are most effective. If school experience is not important
in the development of visual perceptual skills the time now spent on
activities designed to foster development of visual perceptual skills
could be better spent on other activities.
This study attempted to investigate the effects of school experience
on performance on visual perception tests involving line figures and
forms. In Experiment I, groups of kindergarten children matched on age
or school experience were used to examine the independent and interactive
influences of each factor. In Experiment II, comparisons were made of
the effects of kindergarten and first grade curricula on test performance
with chronological age controlled.
REVIEW OF THE LITERATURE
Age and School Experience
Relatively few studies have been designed to examine the effects
of age-related influences on performance independent of those of school
experience. In studies concerned with school achievement, children are
generally tested at the same point in time (usually the end of the school
year). This keeps the amount of school experience constant within each
grade but-allows a twelve month variation in chronological age within
each grade.
Differences in the performance by children of the same age who were
born at different times of the year have been noted for some time (e.g.,
Fialkin and Beckman, 1938; Goodenough, 1940; Huntington, 1.938; Lodge,
1938; Mills, 1941; Pinter and Forlano, 1933). A number of the studies
have focused on the relationship between the performance on intelligence
tests and the time of year that the child was born (e.g., Craddick, 1966;
Orme, 1963; Williams, 1964).. The majority of these studies have found
statistically significant correlations between intelligence test scores
and the season of birth. However, the season of the year in which the
highest mean scores occurred has differed from study to study. For
example, Craddick (:66) administering the Wechsler Intelligence Scale
for Children and the Wechsler Adult Intelligence Scale to normal adults
and children, found higher IQ scores for the groups in his sample that
were born in the winter or spring. Orme (1963) had found the IQ of a
sample of mentally retarded adults was higher if they had been born in
the summer or fall. The-authors of most of the studies in the 1930's
6
and 1940's suggested that the important factors in these seasonal IQ
differences were conditions such as the climate that occurred during
pregnancy.
Williams (1964), in a review of the studies on the relationship
of season of birth and intelligence test-scores ,has suggested two possible
school-related factors in the different test performance of children born
in different seasons: length of school and the child's age position in
his group in school. Since the studies were performed in different
countries which had varying patterns of school organization and. entrance
ages, the influences of these two factors could be different in the dif-
ferent studies.
Using a cross-sequential design in which children of three different
ages (8:0, 9:0, 10:0) were measured at three different times of the year,
Baltes, Baltes, and Reinert (1970) found a significant effect of time
of measurement (with age controlled) on four intelligence test subtests:
inductions, verbal comprehension, numerical facility, and perceptual
speed. This difference seen in the same age children tested at different
times of the year was interpreted as due, to differential amounts of
schooling.
There continues to be some disagreement as to the relationship of
chronological age to school performance. Some of the studies conducted
in England (e.g., Jinks, 1964) have shown a correlation between age and
school performance but the structure of their school system is such that
children born at different seasons of the year would have different
length of schooling in the Infant Schools. A child enters Infant School
at the first of the three entrance dates during the year after he becomes

7
fie years old. However, the entire year's group moves Into Junior School
as a unit after three years so that children born in certain months will
enter Junior School with only two and a third rather than three full
years in Infant School.
Studies conducted in the United States have found moderate positive
correlations between entrance age and school achievement if the achieve-
ment testing was done after the primary grade level. However, most of the
studies (e.g., Carter, 1956; Dickinson and Larson, 1963; Hall, 1963; King,
1962; Miller and Norris, 1967) have used children admitted to school
when either younger or older than the usual age for the comparison groups
rather than different ages within the normal one year span of ages created
by ..he cut-off dates for school admission. No studies were found that
showed a significant correlation between admission age and achievement
in the later grades when the age range was restricted to the one year
age span.
Of greater interest to the present study is the fact that the corre-
lation between chronological age and first- or second-grade reading skills
has repeatedly been found to be negligible (Barrett, 1965a; Hirst, 1970;
Petty, 1939). Murray (1966) found higher correlations between first
grade reading achievement and all the visual-motor-perceptual tests he
administered, i.e. the Winterhaven Form Copying Test and Monroe Visual I
and III, Clan between chronological age and reading achievement. There
have been some studie (e.g., Rosenthal, 1969) showing a low but sta-
tistically significant positive correlation between chronological age
and scores of readiness tests such as the Lee-Clark Reading Readiness
Test (Lee and Clark, 1962) administered to kindergarten children.
8
There appears to be little evidence indicating that chronological
age, at least within a twelve month span, is highly correlated to acado=ic
achievement. Rather the anount of school experience is considered as
the most important influLsce and this is reflected in the grade place=ent
grouping of the normative data for achievement tests.
In contrast, tests of visual perceptual skills have age norms.
Such a basis for establishing noms would seem to imply that the test
authors thought that chronological age was more important tLan school
experience in determining performance on such tests. The nor7latiw!
for such tests (e.g., Ayres, 1966; Koppitz, 1964) do show differences in
the mean scores for groups of child:en where the mean chronological age
differs by at lepst six months. Unfortunately, the data reported in
these studies do not include an indication of the testing dates. Without
knowing the period of time during which testing was carried out it is
impossible to calculate the correlation between chronological age and
the amount of school experience that existed in the normative sample.
If all ages of children were tested within a short period of time, say
one month, the relationship between chronological age and school expe-
rience would be different than if testing was distributed throughciut
calendar year.
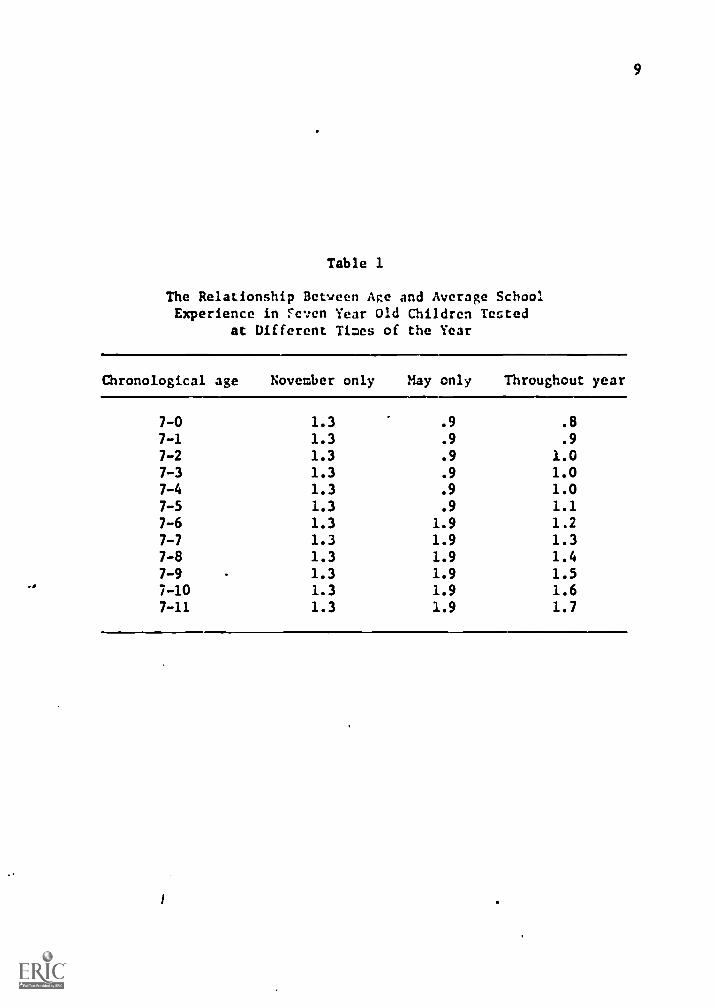
Table 1 presents the difference in the relationship between age
and school experience if all the testing was done in a single month
such as May or November in contrast to the testing being spread through-
out the year. If the cut off date for entrance into school is December 1
then in May seven year olds with birthdays from December to May would
be in first grade while seven year olds whose birthdays are in June to
9
Table 1
The Relationship Between Ace and Average SchoolExperience in Feven Year Old Children Tested
at Different Times of the Year
Chronological age November only May only Throughout year
7-0 1.3 .9 .8
7-1 1.3 .9 .9
7-2 1.3 .9 1.0
7-3 1.3 .9 1.0
7-4 1.3 .9 1.0
7-5 1.3 .9 1.1
7-6 1.3 1.9 1.2
7-7 1.3 1.9 1.3
7-8 1.3 1.9 1.4
7-9 1.3 1.9 1.5
7-10 1.3 1.9 1.6
7-11 1.3 1.9 1.7

10
November would be in second grade. As a result children with ages of
7-0 to 7-5 when tested in May would have had .9 years of school expe-
rience and children who are 7-6 to 7-11 would have had a whole additional
year of school experience or 1.9 years. If school experiences were an
important factor in performance on the test, the mean scores for these
two age groups might be very different. If, however, the testing was
done in November all seven-year-olds would be in the second grade and the
year difference would be between six and seven year old or seven and eight
year old children rather than at the half year mark. If the testing is
spread throughout the year this time of testing effect due to school
experience will be spread throughout the age range rather than creating
sharp dividing points.
Regardless of the distribution of testing dates there would be a
positive correlation between chronological age and school experience
with a larger correlation the greater the spread of testing times. Within
the ages where the child might be attending either a structured pre-
school or elementary school setting there exists the possibility that
school experience could account for a significant portion of the dif-
ference in scores in different age groups.
Within the elementary school setting, visual discrimination and
memory of letters and words are taught. However, the question looms as
to whether the training with letters would affect the ability to dis-
criminate and remember other visual stimuli such as pictures and forms.
There is evidence that form discrimination can be improved by specific
training on such skills. Studies using materials such as the Frostig
Remediation Program, a series of 359 work sheets (Frostig and Horne,

11
1964) have shown changes in scores on reading achievement tests as well
as on the Developmental Test of Visual Perception (Frostig, 1961) which
measures the same skills trained in the remediation program (Rosen, 1966;
Wheelock, 1968; Williams, 1968).
Most of the reading readiness programs contain activities designed
to train visual discrimination of stimuli such as forms varying on various
dimensions. By implication, the training on these stimuli prepares the
children for the finer discriminations involved in learning to distinguish
between different letters of the alphabet.
Tasks involving discrimination of geometric forms can be varied so
that the amount of difference between stimuli is either greater or less
than between letters. No studies could be found that investigated the
effect of letter discrimination on the more difficult of the form dis
crimination tasks. Since most visual perception tests are designed to
be used up to the ages of eight to ten they include some fairly difficult
items.
It is likely that there is a positive relationship between the
skills involved in the discrimination and memory of letters and the skills
involved in the discrimination and memory of geometric forms. Whether
there is a sufficient relationship for letter training to significantly
affect performance of visual perception tests which use forms is not
known.
Types of Visual Perceptual Skills
The term "visual perceptual skills" encompasseb a wide variety of
skills. In the broadest sense it would include all skills involved in

12
giving meaning to any type of visual stimuli. However, meaning is not
really involved in many of the tasks used in standardized tests con-
cerned with visual perception skills. Many tasks involved in the visual
perception tests ly require the detection of similarities or differ-
ences in physical properties such as orientation in space, a class of
skills more properly titled visual discrimination (Fellows, 1968; Vernon,
1970). To be sure, discrimination is necessary before accurate meaning
can to given to a visual stimulus but discrimination is only part of the
process of visual perception. The skills covered by this study involved
forms as forms, not as symbols having meaning, so the term "visual
perceptual skills" is not necessarily the most accurate on. use.
However, as the test names will suggest, this term has been used to
cover skills, such as visual discrimination, which are involved in
visual perception, thus the term will be used as a general term.
The available standardized visual perception tests were devised
primarily to measure only those skills thought to be related to academic
performance. As a result only a small portion of the range of visual
perception skills is sampled. For example, skills such as those re-
quired in making color or size discriminations are not included in the
tests.
Psychologists studying visual perception have included a much wider
variety of tasks, both in the dimensions on which the stimulus is varied
and the nature of the decision which must be made about the stimulus.
For example, Hake (1966) has described five types of decisions involved
in perception:

13
1. detectibility -- is there a stimulus present or not?
2. discrimination -- is the stimulus different from a standard?
3. identification -- which stimulus is present?
4. recognition -- has this stimulus been seen before?
5. judgmental -- what scale value should be assigned to this stimulus?
Another dimension is the time available to perform the task; i.e. whether
unlimited time is allowed or whether speed is a factor.
When meaningful stimuli (such as pictures or words) are used in a
task, a variety of additional cognitive skills may also be involved.
For example, matching words on a conceptual basis would appear to be more
closely related to matching pictures on a conceptual basis than to
matching words on the basis of their physical characteristics. Several
studies using visual percepticd tasks (e.g., Gates, 1940; Sister Mary
of the Visitation, 1929) have found tasks to correlate more highly with
each other when the stimulus material, e.g., words versus forms, was the
same and the task different than in the reverse situation. For example,
the scores on a match-to-sample test using words as stimuli correlated
more highly with the same-different pair judgment word scores than with
scores on a match-to-sample test using groups of digits. However, the
range of tasks used in these studies was quite small. In the study by
Sister Mary of the Visitation (1929) there were only three types of
tasks: match-to-sample, same-different judgment of pairs of stimuli,
and one task which required finding which group of letters spelled a
common word. Four types of stimuli were used: words, groups of letters,
groups of digits, and designs.

14
Within the limited range of tasks used in the more common tests of
visual perceptual skills, there have been questions raised whether an
individual's repertoire is characterized by specific skills or only one
general visual perceptual factor. Factor analytic studies of tests such
as the Developmental Test of Visual Perception which has five subtests
(e.g., figure ground discrimination, position of figures in space) have
failed to find any consistent discrete factors (Ohnmacht and Olson, 1968;
Ward, 1970).
The stimuli used in the present study were geometric forms (line
drawings) used strictly as forms and not as meaningful symbols. Responses
included indicating a matching or odd stimulus by pointing (or tracing)
and drawing (or constructing) a reproduction. On some of the tests the
child's response is made after the stimulus has been displayed for a
controlled period of time and then removed, which requires not only dis-
crimination but memory skills.
Tests of Visual Perception Skills
There are a large number of tasks which could be considered to
involve visual perception skills. This study focused on the discrimina-
tion of two dimensional forms. This decision eliminated tests or subtests
involving three-dimen3ional objects or other visually-detected attributes
such as color or size. Also omitted were tests involving meaningful
pictures such as the Picture Completion and Objects Assembly subtests of
the Wechsler Intelligence Test for Children (Wechsler, 1949), the Visual
Association subtest of the Illinois Test of Psycholinguistic Abilities
(Kirk, McCarthy, and Kirk, 1968), or tests using letters or words such
15
as the Matching subtest of the Lee-Clark Reading Readiness Test (Lee ard
Clark, 1962) or the Memory for Letters subtest of the Detroit Tests of
Learning Aptitude (Baker and Leland, 1967).
There are several tests which require the copying of geometric forms
while the stimulus is present. Perhaps the best known of these tests
is the Bender Visual Motor Ges:alt Test (Bender, 1938). This test uses
nine geometric designs which are presented one at a time for the child
to copy on a plain sheet of paper. Some of the designs are line drawings,
others are constructed of dots. Although this test is also used as a
projective technique, there are developmental changes in performance
(e.g., in the accuracy of reproduction) up to the age of 10 or 11. There
are several available scoring systems for the Visual Motor Gestalt Test
(Bender Gestalt). Koppitz (1964) has devised a developmental scale re-
flecting distortions related to immaturity with norms given for ages
between five and ten years. There are 30 mutually exclusive scoring items
(from two to four per design) which are scored as present or absent.
Scoring categories include distortion of shape, rotation, perseveration,
and integration.
A more recent test in this area is the Developmental Test of Visual-
Motor Integration (Beery, 1967) which has 24 figures to be copied in
spaces in a test booklet. All figures are line drawings beginning with
single lines and progressing through simple geometric figures such as a
circle to figures involving diagonals and several overlapping figures.
The figures range from being more simple to more complex than those used
in the Bender Gestalt and the norms extend from age two to fifteen. Each
form is scored on a pass-fail basis and not on specific errors. Three

16
factors made this test less desirable than the Bender Gestalt for this
study; the limited number of figures that would discriminate within the
restricted age range in this study, the pass-fail scoring system, and the
cost of the test booklets.
One section of the Perceptual Forms Test sponsored b! the Winter
Haven Lions Club (1960) requires the copying of geometric figures such as
a circle and diamond. This test has different forms for kindergarten
and first grade children which made it unsuitable for Experiment II of
this study.'
The Copy Forms test used by the Gesell Institute (Ilg and Ames, 1964)
involves the copying of six geometric figures and the drawing of two
three-dimensional objects. Both the inclusion of the three-dimensional
forms and the scoring system made this test unsuitable. Scoring for this
test is largely qualitative and descriptive.
The Dennis Visual Perception Scale (Dennis and Dennis, 1971) has
20 designs to be copied on fields of small squares. This test was not
available at the time this study was begun.
Subtest V (Spatial Relations) of the Developmental Test of Visual
Perception (Frostig, 1961) requires the reproduction of seven or eight
figures composed of straight lines drawn between pairs of dots. This
test was included in the study.
The greatest majority of visual memory tests require the reproduc-
tion of a stimulus containing one or more figures after exposure for a
brief interval of time (usually 5 to 10 seconds). However, most of these
tests have not been found satisfactory for use with children under the
age of eight. Such tests include the Benton Visual Retention Test for

17
Clinical Use (Benton, 1946), the Graham-Kendall Memory-for-Designs Test
(Graham and Kendall, 1960), and the Ellis Visual Designs Test (Lord and
Wood, 1942). There are two tests which have been used successfully with
young, school-age children. One is the Visual III subtest of the Monroe
Reading Aptitude Tests (Monroe, 1935). This test has four cards with
four line figures to a card. Each card is exposed for 10 seconds and then
the child is asked to reproduce all the pictures that he can remember
from that card. New norms have been established by the Gesell Institute
(Ilg and Ames, 1964). The Memory for Designs subtest of the Detroit
Tests of Learning Aptitude (Baker and Leland, 1959) requires both the
drawing and completion of forms . the test booklet used for the entire
battery of tests. It appeared that this test would not give sufficient
additional information in comparison to the Visual III subtest to justify
the cost of the test booklets which would be used for that subtest only.
Visual memory tests with responses other than drawing of the stimulus
are not as common. The Visual Sequential Memory subtest of the Illinois
Test of Psycholinguistic Abilities (Kirk, McCarthy, and Kirk, 1968)
requires the reconstruction of sequences of two to eight chips with
nonmeaningful designs. The Chicago Test of Visual Discrimination (Weiner,
1968) is a multiple-choice test using designs from the Bender Gestalt
Test and the Graham-Kendall Memory-for-Designs Test and is given both
as a memory and matching test. Since the Bender Gestalt Test was being
used in this study the forms would be familiar if the Chicago Test of
Visual Discrimination was also used. Since a multiple-choice visual
memory test was desired for this study as a contrast for both Visual III
(a memory test requiring drawing) and the other multiple-choice tests,
18
the author devised the Visual Memory test which is a 30 item test using
letter-like forms. The choice forms vary from the sample on the same
dimensions that letters differ from each other, such as rotation or the
addition of elements.
Only two tests specifically testing the ability to discriminate a
figure from ics background could be found which were suitable for use
with young children. One was the Southern California Figure-Ground Visual
Perception Test (Ayres, 1966) which is a multiple choice test. The
stimulus plates involve both overlapping and embedded figures and the
child is allowed one minute to choose the three of the six choice figures
that are in the stimulus plate. The second figure-ground test is the
Figure-Ground subtest of the Developmental Test of Visual Perception
(Frostig, 1961) which involves tracing over specified overlapping figures.
There are some other tests which are closely related such as the Form
Constancy subtest of the Developmental Test of Visual Perception (Frostig)
which requires discrimination of a particular geometric form regardless
of its size or surroundings. The Visual Closure Test of the Illinois
Test of Psycholinguistic Abilities (ITPA) involves locating only partially
depicted objects in a complex scene. Tests such as the Street Gestalt
Test used by Goins (1958) and the Visual Automatic Test devised by Kass
(1962) which requires the naming of objects whose silhouette or outline
has a number of areas missing probably have a strong figure-ground
component. These last three tests involve pictures rather than non-
meaningful figures.
Tasks requiring the matching of a sample or choosing the odd figure
strictly on the basis of physical characteristics tend to show a strong

19
ceiling effect at six to seven years unless the figures used are very
complex. The Position in Space subtest of Developmental Test of Visual
Perception (Frostig) requires either matching or choosing the odd picture
on the basis of the position of all or parts of the figure. A number of
items on the Visual Memory Test (Wood, 1971) contain choices that are
rotated or reversed versions of the standard. The battery of tests used
by Coins (1958) included several tests involving matching on various
physical dimensions but these tests used letters or pictures. Tests
involving match-to-sample tasks for school age children have generally
involved meaning or conceptual "relationships as the basis for matching
rather than physical similarity. Two examples would be the Visual Reception
and Visual Association subtests of the Illinois Test of Psycholinguistic
Abilities (Kirk, McCarthy, and Kirk, 1968) which use photographs or
outline drawings of objects. The child must choose the objects which
are conceptually similar or related.
There have been questions raised as to whether there really are a
number of discrete visual perception skills. The results of the various
studies differ. Ayres (1966) has found relatively low correlations (.12
and .38) between the Southern California Figure-Ground Visual Perception
Test and Figure-Ground subtest of the Developmental Test of Visual Per-
ception (Frostig, 1961) that supposedly measure the same skill, i.e.,
figure-ground discrimination. O'Connor (1969) found product moment
correlations of .63 between the Frostig and the Bender Gestalt and .62
betWeen the' Frostig and the Harrison Reading Readiness Test. A canonical
analysis of the Developmental Test of Visual Perception (Frostig), the
Metropolitan Reading Readiness Test and the Gates Reading Readiness Test

20
found them to possess an underlying common perceptual function (Ohnmacht
and Olson, 1968). Corah and Powell (1963) found the intercorrelations
with the Frostig to vary from .18 to .57. However, factor analytic
studies of the Frostig (e.g., Olson, 1968; Ward, 1970) have found the
five subtests to possess a single common perceptual factor.
Intelligence tests often contain items requiring visual discrimina-
tion or memory skills. Memory items on the Stanford Binet Intelligence
Scale (Terman and Merrill, 1960) include such tasks as reproducing a bead
chain, finding a matching picture after the stimulus is removed, and
reproducing a design exposed for 10 seconds. The Detroit Tests of
Learning Aptitude (Baker and Leland, 1967) include subtests that require
the naming of pictures or letters from memory plus a subtest requiring
the reproduction or completion of designs after the stimulus is exposed
for 10 seconds. Other visual discrimination tasks include such items as
Pictorial Similarities and Differences on the Stanford Binet Intelligence
Scale and Picture Completion subtest on the Wechsler. Intelligence Scale
for Children. The Wechsler Intelligence Scale for Children contains maze
items which require visual as well as motor skills. There are a number
of other items that require visual discrimination skills in addition to
a variety of cognitive skills.
Another major category of tests containing visual discrimination
and memory items is that of the reading readiness tests (e.g., Metropoli-
tan Readiness Tests, Reading Aptitude Tests, Lee-Clark Reading Readi-
ness
.
Test). Although verbal materials such as words or letters may be
'used, many of the subtests use them as forms rather than symbols in tasks
such as match-to-sample which only require detecting similarities or

21
differences on the physical characteristics of the stimuli.
Visual Perception Skills and Academic Achievement
As is reflected in the inclusion of visual tasks in the reading
readiness tests, educators have believed for some time that visual dis
crimination skills are important in the development of reading skill
(e.g., Bond and Wagner, 1950; Gates, 1937; Gray, 1925; Tinker, 1929;
Vernon, 1959). Intu4tively, the ability to discriminate between different
visual forms and to remember those forms seems essential to learning to
match sounds with letters and words. Barrett (1969) describes the three
major current views of reading as: reading as decoding, reading as
involving perception and cognition, and reading as involving perceptual,
cognitive, and affective responses. According to all three views, reading
requires sufficient visual perceptual skills to distinguish letters and
words. Vernon (1959) describes these skills as involving the perception
of "small meaningless shapes containing a good deal of detail." He
describes the child as having particular problems with the orientation
of shapes and the order of shapes in a sequence. Betts (1948), for ex
ample, sums up the opinion of a number of educators when he says "The
ability to be a good observer of the likenesses and differences among
word forms appears to be an important factor in reading ... In short,
the ability to make visual discriminations among word forms generally
is conceded to be basic to readiness for initial instruction in reading"
(page 220). DeBoir.and.Dallthan (1964) after deSCribing the' imPOrtance
of visual perception go on to say "Improvement in Making such discrimina
tions can be brought about through training" (page 68).

22
A variety of visual discrimination tests have been developed in an
effort to predict readiness to read and the probability of success in
learning to read. Educators would like to be able to measure when a
child is "ready" to learn to read so that instruction is not started too
soon or delayed too long. For the children who are not yet ready, but
because of chronological age are in the first grade, they want to know
what essential skills the child lacks so that appropriate training can
be provided.
Barrett (1965a) has provided an excellent review of studies measuring
visual discrimination at the beginning of first grade and reading achieve-
ment later in first grade. Of the various tasks used to predict reading
readiness, naming letters shows the highest correlation with reading
achievement (Barrett, 1965a). This particular skill, however, is ex-
tremely dependent on the child's environment (e.g., Dunn, 1959). Letter
names have to be taught, i.e. the child cannot discover the names of
letters without assistance. For this reason, many educators have thought
that other tasks, particularly those using nonverbal materials gave a
better indication of the child's "potential" ability to learn to read.
Supposedly, this type of task does not penalize children from different
cultural or socio-economic groups.
Different studies have found somewhat different visual perception
tasks to have the highest correlation with performance on a reading test.
At the first grade level visual discrimination tests tend to have a
higher correlation with reading performance than chronological age or
intelligence (e.g., Bryan, 1964; Petty, 1939). This relationship appears
to decrease with age and generally by the third or fourth grade non-

23
significant correlations between scores on visual discrimination tests
and reading achievement tests are the rule (Bryan, 1964; Phelan, 1940;
Sister Mary of the Visitation, 1929).
Where both tests using letter or words as stimuli and tests using
digits or pictures have been used in the saiae study, the tests -sing
words or letters generally show a higher correlation with reading tests
(e.g., Ashlock, 1965; Goins, 1958). However, there have been tests using
forms or pictures as stimuli with correlations of .47 to .60 with reading
achievement tests (e.g., Goins, 1958; Keogh, 1963; Monroe, 1935; Murray,
1966; Potter, 1959). The highest correlations have tended to occur when
the test required copying the figure instead of other tasks such as
matching (Barrett, 1965a).
Particular stress has been placed by some authors on the ability to
discriminate changes in spatial orientation. Silver and Hagin (1970)
state that: "In our experience 80% of the children with reading dis-
abilities have difficulty with the orientation of visual stimuli in space.
This is at a level of visual recognition and does not involve verbal
symbols" (p. 448). Wechsler and Hagin (1964) found a correlation of .43
between the Lamb Chop Test (involves judging the position of a figure
shaped like a lamb chop) and first grade reading readiness scores.
When Silver and Hagin (1970) retested 18 reading disability cases 10
years later, these individuals still showed problems in orientation of
figures in space and figure-ground relationships.
Two studies suggest that the format of the test and its relationship
to procedures used in classroom reading instruction might be important.
Keogh (1963) found higher correlations between the Bender Gestalt and

24
first grade reading when the Bender Gestalt was administered to a group
using large cards held up in the front of the room. Gates (1940) found
that a word-card matching test in which the stimulus was exposed on a
card for a short period of time and then remov'd made a significant
contribution to the predictive value of the Gates Reading Readiness
Tests quite independent of the predictive value of the word matching
tests which left the stimulus exposed for comparison.
25
PROBLEM
Research Design
There are two parts to this study: Experiment I was designed to
examine the effects of age and school experience on performance. Experi-
ment II was designed to evaluate the effect of different school experience
with age controlled.
Experiment I
In this part of the study it was essential to separate the effects
of age from those of school experience. For this reason, a number of the
usual research designs were not suitable. In cross-sectional studies
where children of various ages are tested at one point in time, age and
school experience cannot be separated. That is, the amount of school
experience is held constant within each grade level but age and school
experience differ across grades. To control for this confounding, cross-
sectional sampling needs to be done at more than one testing time. Simi-
larly in a conventional longitudinal design, as a child increases in
age he also increases in amount of school experience so the effects of
the two factors also cannot be determined separately.
Schaie (1965) has proposed some sequential paradigms which permit
independent analysis of at least two of the three sources of develop-
mental change: age, cohort, and time of measurement. In his designs age
represents changes in an individual over time, cohort represents ),:le
changes between generations, and time of measurement relates to changes in
the environment between times of measurement. In this study, which
involved a fairly short time period with school-age children, these factors

26
still existed but had somewhat different implications. Children born
within six months of each other probably will not reflect much of a
difference due to genetic or cultural differences. However, they will
have differences in their grade placement at any given age. Time of
measurement, as defined here, will reflect the amount of school experience.
The time-sequential method outlined by Schaie (1965) permits in-
ferences as to age differences as well as differences related to the time
of measurement. There is also an estimate of the interaction of age and
time of measurement which is confounded with cohort differences. In this
instance it was assumed that there were no significant cohort differences
due to genetic or out of school environmental differences when the cohorts
were not separated by more than one year. This type of design (Table 2)
requires measurement of each of several age groups at several times of
measurement.
Table 2
Time Sequential Design
Time of measurement
Age at time of testing October April
Younger A
Older
Such a design permits comparison of groups that are the same age
with a grcup of different age but with the same amount of school expe-
rience with:

27
Age differencesA +C-B- D.
2
Also groups with the same amount of school experience can be compared
with groups that are the same age when tested but have a different amount
of school experience with:
Time differencesA +B-C- D
2
In addition, representatives of the same cohort are tested at each of the
two times. This can be compared to groups of different cohorts which match
on one of the factors.
Interaction =A +D-C- B
2
Experiment I used the same sequential design and kindergarten children.
There were independent samples of two age groups, 5 years and 4 months
and 5 years 10 months, tested at each of two testing times, October and
April. An analysis of variance was used to evaluate the results.
Experiment II
A second design proposed by Schaie, the cross-sequential design,
was also adapted for use in the present study. The cross sequential
design involves the factorial manipulation of cohort and time of measure-
ment. The cohort variable was of special interest here because of school
regulations regarding a child's birthdate and admission to school. That
is, it was possible to choose samples of children who were matched on
chronological age but who, nevertheless, differed in school experience
by a complete year. The cross-sequential design is schematized in
Table 3.

28
Table 3
Cross Sequential Design
Time of measurement
Cohort October April
Pre cut-off birthdate 'E E'
Post cut-off birthdate F F'
The design permits comparison of groups of children that are the
same age but who differ in grade placement with:
Cohort differences =E + E' - F F'
2
The time of measurement variable confounds the amount of school experience
with age differences; i.e. the testing in. April reflects differences
attributable to the increased age as well as increased school experience.
This part of the study was designed to evaluate the role of school
experience with age controlled. Control of the variable was accomplished
by using children whose birthdates were as close as possible to the cut-
off date (December 1) for class placement with the results that the
total age range for the two groups was about one month. The same children
were measured in both October and April (see Table 4):4
Several possible problems do exist with this design but they did
not seem insurmountable. One possible factor is the practice effect
associated with repeated testing. However, with asix month interval
and the types of tests being utilized, this should not have been a

29
Table 4
Groups Tor Experiment II
Cohort
Time of measurement
October April
Kindergarten 5-10 6-4
First grade 5-11 6-5
significant factor in the results of this study. Another possible problem
was attrition. The most likely causes for this, such as moving and ill-
ness, are likely not related to the variables being studied. Demotiag
a child to a lower grade might be related to the skills being studied
but rarely does this occur in the middle of first grade or kindergarten.
More serious was the fact that raw scores had to be used in order to
analyze all the tests as standard scores were not available for some of
the tests. It is conceivable that the raw scores do not occur on a scale
with even intervals. The average scores of the kindergarten and first
grade groups were likely to be different so that different parts of the
scale were predominantly used for the two groups. It is highly unlikely
that this influenced the results on all tests but might have affected the
results on some of the tests.
An analysis of variance was also used to analyze this set of results.
However, the time of measurement effect was confounded with both an
increase in school experience and age. Thus, only the cohort variable
and the interaction were considered important.
30
Hypotheses
Experiment I
1, Kindergarten children who are the same age but differ by six
months in the length of school experience will not show
significant differences in scores on visual perception tests.
2. Kindergarten children who have had equal amounts of school
experience but differ by six months in chronological age will
not show significant differences in scores on visual percep-
tion tests.
3. The effect of school experience on performance on visual
perception tests is the same for kindergarten children of
different chronological ages.
Experiment II
1. Children who are in the first grade will not perform signifi-
cantly better on visual perception tests than children of the
same chronological age who are in kindergarten.
2. Changes in performance on visual perception tests will be the
same for children of the same age regardless of whether they
are in kindergarten or first grade.
Both experiments
1. For the subjects tested, chronological age or amount or type
of school experience will have the same effect on performance
on all visual perception tests regardless of what the test
purports to measure or the type of response required.
31
Existing data for visual perception tests show differences in the
average performance of children of different ages up to about age 8 or
10. However, increases in age are positively correlated with increases
in school experience. It is conceivable that the improvement in per-
formance is due entirely to school experience rather than any internal
maturational factor related to chronological age. Or, of course, per-
formance may be affected by both school experience and age. Another
possibility is that children of different ages react differently to
similar school experiences. For example, a younger child may lack the
neurological organization needed to obtain maximal benefit from training
in visual discrimination skills that occurs in the classroom.
In most school systems there is a difference in the time spent,
stress upon, and even the type of visual perception tasks included in
the curricula of kindergarten versus first grade. One could argue that
activities in kindergarten, including "reading readiness" activities,
should markedly improve performance in a child assumed to have had little
formal training in visual perception skills before that time. In con-
trast the considerable amounts of time involved in letter discrimination
while reading and writing may have a greater effect on performance on
visual perception tests.
In Experiment I children of different ages had received the same
school experiences while in Experiment II children of the same age
received different school experiences. Thus, the interaction between
age and school experience could ::ake several forms.
A wide variety of tasks are included under the rubric of visual
perception tests. One variable is the type of response. A number of

32
the tests require the child to draw the stimulus. In this instance a
number of factors related to the motor response such as skill in handling
a pencil could affect the child's performance. This type of test could
show a strong school effect from practice while a multiple choice test
using similar stimuli and requiring comparable visual discrimination
skills might not show a school effect. If there is indeed more than
one type of processing skill involved in the perception of visual stimuli
the effect of age and school experience may be different for different
skills. Perhaps skill in figure-ground discrimination is related to
non-school related factors such as neural maturation while skill in form
discrimination is strongly affected by school experience.
Scores Analyzed
Raw scores were analyzed for all the tests and subtests in the
study. For most of the tests except the Bender Gestalt this score repre-
sented the number of items correct. On subtest III (Form Constancy) of
the Developmental Test of Visual Perception any incorrect items marked
were subtracted from the total correct. On the ITPA Visual Sequential
Memory subtest the child received two points if the stimulus was reproduced
correctly on the first try and One point if correct on the second pre-
sentation. It was possible to earn half points on Visual III for repro-
ductions that were recognizable but not completely accurate.
The score on the Bender Gestalt using the Koppitz scoring system
is an error score with two to four possible errors on each figure scored
for a total of 30 for the nine designs. Since the higher the score the
poorer the child's performance a negative correlation with this test has

33
the same meaning as a positive correlation between the other tests.
Where available standard scores were used for a second analysis.
Since the same raw score would be assigned a different standard score
depending on the chronological age of the child, any difference between
groups of children that are different ages should be accentuated. In
both experiments the six month difference in age between groups was
sufficient to place the older and younger groups in different norm
groups. The ITPA and Frostig have published standard scores for three
month age groups. For the ITPA these scores have a mean of 36 and a
standard deviation of 6. For the Frostig the scaled score is the per-'
ceptual age (the age for which that raw score is the average) divided
by the chronological age, multiplied by 10 and adjusted to the nearest
whole number.
The Southern California Visual Perception Test (SCFG) has standard
scores for six month age groups with a mean of 0 and a standard deviation
of 1. To avoid the negative scores these were transformed into a scale
with a mean of 50 and a standard deviation of 10. The Bender Gestalt
does not have published standard scores but Koppitz (1964) does give the
mean and standard deviation for six month groups of the normative popu-
lation. These were used to establish standard scores with a mean of 50
and a standard deviation of 10.
The published data on the Visual III test by Ilg and Ames (1964)
does not include standard scores or standard deviations so this test
could not be included in the analysis of standard scores. The Visual
Memory test devised by the author has not been standardized.

34
METHOD
Subjects
Children from the Urbana Public Schools were selected on the basis
of their birthdate. Eight of the nine elementary schools in the District,
agreed to participate in the study. The one school declining was in a
predominantly black neighborhood with children bussed in from the uni-
versity married students housing complex. However, black children are
bussed to all the other schools on a percentage basis so their representa-
tion in the sample should have been reasonably similar to that of the
community as a whole. No attempt was made to secure any background in-
formation such as race or socio-economic group.
Lists of children in regular classrooms who had birthdates in certain
specified months were secured from each school. Subjects were selected
by starting at a certain date and choosing successively younger or older
children until the number needed had been selected. The groups were as
shown in Table 5.
Table 5
Subjects
Testing date Group Grade Birthdates Males FemalesC.A. atTesting
October A K 6/9/66 to 6/30/66 10 5 5-4
October B& E K 12/16/65 to 12/20/65 8 7 5-10
October F 1 1.1/11/65 to 11/29/65 7 8 5-11
April C K 11/3/66 to 11/21/66 9 6 5-4
April D K 6/2/66 to 6/11/66 4 11 5-10
April E' K 12/16/65 to 12/30/65.
8 7 6-4
April F' 1 11/11/65 to 11/29/65 7 8 6-5

35
During the October testing a total of four children had to be dropped
from the study, two because the parents refused to give permission, one
because of involvement in another research project, and one because the
teacher asked that the child not be removed from the classroom.
Tests Used
There were two major criteria for the selection of tests:
1. The test involved the discrimination of line figures as forms
rather than as meaningful symbols.
2. The test was suitable for use with five and six year old children.
Whenever possible two related tests which differed in the mode of
response were utilized. For example both subtest II (FigureGround) of
the Developmental Test of Visual Perception (Frostig, 1961) and the
Southern California Figure-Ground Visual Perception Test (Ayres, 1966)
test the ability to detect individual forms in line drawings with em-
bedded and overlapping forms but the form of response is quite different
for the two tests. The Frostig Figure-Ground subtest requires accurate
tracing of the individual forms while on the SCFG the child points to
the correct form from several alternatives.
There are also tests in which the mode of response is the same, but
the visual perceptual skills needed differ. One example is the SCFG
and the Visual Memory Test which are both multiple-choice tests. This
arrangement provided some cross-check as to whether the results were
influenced by the mode of response. For example, it could be possible
that improvement in fine motor coordination due to 'age-related matura-
tional changes could cause performance on tests requiting drawing or

36
tracing to show a strong age component regardless of any visual per-
ceptual skills needed.
This overlapping of tests also restricted the variety of skills that
could be studied. It was thought to be more desirable to make a thorough
appraisal of a few skills than sample a wide variety of skills.
There were two testing sessions about 45 minutes to an hour in
length. During one session each child was tested on five relatively
brief tests in the following order:
1. Visual Memory Test
2. Bender Visual Motor Gestalt Test
3. ITPA Visual Sequential Memory subtest
4. Southern California Figure-Ground Visual Perception Test
5. Monroe Visual III
The Visual Memory Test was devised by the author and consists of
two demonstration and 30 test item cards containing a stimulus figure
on one side of the 5 X 8 card and four choice figures on the other side.
The stimulus figures are letter-like forms similar to those used by the
Gibsons (e.g., Gibson, Gibson, Pick and Osser, 1962). In the final
version there are 21 cards with single figures, seven with two figures
and two with three figures. These were selected from a pool of 50 items
on the basis of their correlation with the total score on the test by
40 four year old children tested at the nursery school at Children's
Research Center. The four choice figures on the opposite side of the
card differ from the stimulus in some of the ways alphabet letters
differ from each other such as position in space, addition or subtrac-
tion of elements, and relationship of the parts to the whole. The child

37
is shown the stimulus for five seconds and then the card is turned over
to the choice figures and he is asked to "Find one like it here" (for
complete directions see the Appendix). There are two trial items with
separate cards so that the stimulus and choices can be shown to the child
simultaneously in order to teach him the task. All 30 items are admin-
istered (takes 5 to 10 minutes) and the score is the total number of
items correct. The test was designed to test the child's recognition
memory for material similar to letters and short words. The use of the
letter-like forms should help eliminate auditory images being used to
remember the forms and equalize the children's experience with the stimuli
which would not be the case with letters.
The-Bender Visual Motor Gestalt Test (Bender, 1938) requires the
child to copy nine designs on a blank sheet of paper. Using the scoring
system by Koppitz (1964), the number of "errors" present were added up
to obtain the raw score. The raw scores were transformed to normative
scores by using Table 6 in Koppitz (1964) which gives the means and
standard deviations of test scores of the normative sample in six month
intervals. A transformation scale with a mean of 50 and a standard
deviation of 10 was used to assign normative scores. The normative data
were based on the records of more than 1,100 children between the ages
of five and ten. A study by Miller, Loewenfeld, Lindner, and Turner
(1963) found Pearson product-moment correlations of .88 to .96 between
test scores by five raters. In a test-retest study of kindergarten and
first grade classes and a four month interval the Kendall Rank Correla-
tion coefficients were .55 to .66 (Koppitz, 1964).

38
The Visual Sequential subtest of the Illinois Test of Psycholin-
guistic Abilities involves the reconstruction of sequences of two to
eight chips containing nonmeaningful figures. The child is shown the
sequence for five seconds and then asked to put the corresponding chips
in the tray in the same order as the stimulus. If he fails on the first
attempt he is given a second trial. The test is discontinued when the
child fails both trials of two consecutively listed items. The score is
the total points on the basis of two points for each item passed on the
first trial and one point for each item passed on the second trial. The
scaled scores in the manual are at three month intervals with the mean
performance of the standardization sample equal to a score of 36 with a
standard deviation of 6. The internal consistency coefficients ranged
from .60 to .96 for different ages of children. In a five month test-
retest study the correlations ranged from .28 to .71 with the lower
correlations occurring in the older groups of children (Paraskevopoulos
and Kirk, 1969).
The Southern California Figure-Ground Visual Perception Test requires
the child to indicate the three of the six choice figures which are
in the stimulus plate of embedded or overlapping figures. The test is
discontinued after a total of five errors. The raw score is the total
correct choices. The published standard scores have a mean of zero and
a standard deviation of 1 for six month age intervals. To avoid the
negative scores these standard scores were transformed onto a scale with
a mean of 50 and a standard deviation of 10. The norms for children from
four to eleven are based on 1,164 children. A test-retest study with a
one week interval yielded coefficients of correlation of .37 to .52 (Ayres,
1966).

39
The Gesell Institute has established norms for five to ten year old
children for the Visual III subtest of the Monroe Reading Aptitude Tests
(Ilg and Ames, 1964; Monroe, 1935). This test uses four sets of four
nonmeaningful figures. After a set of figures has been displayed for
ten seconds the child is told, "Now draw as many of the pictures as you
can remember." Each form is scored as pass or fail with a half point
score possible. Norms are based on 700 examinations but only 301 dif-
ferent children. Only means are given so it was not possible to compute
standard scores. No studies of reliability could be found.
The Developmental Test of Visual Perception (Frostig, 1961) was
administered during the other testing session. This test has five separate
subtests. Test I (Eye-Motor Coordination) requires the child to draw
straight or curved lines within increasingly narrow boundaries or to a
target. Although this test Is not concerned with visual form perception
it was administered to keep the standard form of test administration.
Test II (Figure-Ground Discrimination) requires the tracing of figures
which intersect and overlap with other figures. Test III (Form Constancy)
requires tracing only circles and squares which occur in. varying sizes
and positions and different surroundings on a page full of other figures.
Test IV (Position in Space) involves the discrimination of the differences
between figures in rotated and reversed positions. Test V (Spatial
Relations) requires the reproduction of patterns of straight lines
connecting pairs of dots. On subtests II, IV, and V the raw score is
one point for each correct item. On subtest III one point is subtracted
from the total correct for each incorrect figure the child outlines.
The published standard scores are computed from perceptual ages which
40
are the average age at which that score is achieved. To obtain the
standard score the perceptual age is divided by the chronological age
(mean for each three month span), multiplied by 10 and adjusted to the
nearest whole number. The norms for the Frostig are for children from
three to nine and are based on 2,116 unselected children. A two week
testretest study of kindergarten and first grade children yielded
product moment correlations of .33 to .83 (Frostig et al., 1964).
Testing Procedures
The Frostig was usually administered to groups of two or three
children while the other five tests were administered to individual
children in the other testing session. The number of days between the
two testing sessions ranged from two to fourteen days with a mean of
seven days in both the October and April testing. During the October
testing 33 children were administered the Frostig in their first session
and 27 were administered the Frostig during their second session. During
the April testing the figures were 34 and 26. Whenever possible the
two sets of tests were administered by different examiners but nine
children had the same examiner for both sessions in October and 19 during
the April testing. There were a total of 11 examiners but the author
did approximately half the testing.

RESULTS
Experiment I
41
Table 6 provides the means and standard deviations for the raw and
the transformed scores. The transformed scores were obtained for each
child and each test by using the scoring procedure and norms for each
of the tests taken, whereas the raw scores reflect the number of items
correct (or incorrect on each test). Since suitable normative data were
not available for the Visual Memory and Visual III tests they had to be
eliminated from the analysis of transformed scores. Tables 7 and 8
provide the results of the multivariate and univariate analyses of
variance and the discriminant functions for these data. Tables 9 and
10 provide the intercorrelation matrices for the raw (Table 9) and the
transformed (Table 10) scores. It should be noted that the Bender
Gestalt provides an error score so a lower raw score indicates better
performance.
As seen in Table 7, none of the multivariate analysis of variance
F-ratios for the raw scores were statistically significant in this
experiment. On the univariate analysis of variance the main effect for
Time of Measurement for the Bender Gestalt was statistically significant
(2. < .006), reflecting superior performance under April testing. The
analysis for the data from the ITPA Visual Sequential Memory subtest
revealed statistical significance for the main effect of Age (12. < .04),
with older children performing better than younger ones. All other
F-ratios failed to reach statistical significance.
In Table 9 the correlations with the Bender Gestalt are negative
because this test has an error score. Although there is considerable

Table 6
Means and Standard Deviations for Age and Time of Measurement
Groups in Experiment I
Raw Scores
Transformed Scores
October
April
October
April
5-4
5-10
5-4
5-10
5-4
5-10
5-4
5-10
XS.
D.
XS.D.
XS.
D.
XS.D.
XS.
D.
XS.
D.
XS.
D:
XS.
D.
ITPA Visual Sequential
Memory
15.0
3.7
16.7
2.4
16.0
3.4
17.7
3.0
36.0
5.4
36.6
3.7
37.6
5.0
38.3
4.5
Bender Gestalt
12.0
4.8
13.9
3.5
9.6
4.8
9.7
4.4
54.4
13.0
38.9
9.1
61.0
12.8
50.1
11.6
Visual Memory
16.7
2.7
17.3
3.7
17.4
4.0
18.7
4.4
----
Southern California
Figure-Ground
13.2
2.9
13.2
4.0
13.8
3.8
14.6
3.4
54.6
8.6
52.9
13.6
54.3
10.9
57.8
11.3
Visual III
3.6,
1.7
4.3
2.6
3.9
2.1
3.8
1.3
----
DTVP II Figure-Ground
13.7
4.1
12.6
4.7
14.3
4.0
14.1
4.5
11.1
2.2
9.5
1.9
11.5
2.5
10.3
1.9
DTVP III Form 'Constancy
6.7
3.5
6.2
3.2
6.7
3.6
9.5
'4.0
10.9
2.6
9.3
2.4
10.8
2.8
11.8
2.9
DTVP IV Position in Space
5.4
1.7
5.5
1.5
5.9
1.8
5.6
1.6
11.3
2.1
9.4
1.4
12.4
2.5
11.0
2.3
DTVP V Spatial Relations
3.9
2.0
3.6
2.3
4.1
2.3
4.3
2.5
11.4
1.9
10.3
2.1
11.9
2.5
11.0
2.5

43
Table 7
Effect of Age and Time of Measurement on Raw ScorePerformance in Experiment I
(Multivariate and Univariate ANOVA)
F ratio and standardized discriminantfunction coefficients
Test Age Time Age X Time
All tests
ITPA Visual Sequential Memory
Bender Gestalt
Visual Memory
Southern California Figure-Ground
Visual III
DTVP II Figure-Ground
DTVP III Form Constancy
DTVP IV Position in Space
DTVP V Spatial Relations
F9,48
= 1.09 F948 = 1.66 F9,48
= .79
(NS) (NS) (NS)
F = 4.30 F = 1.39 F = .01(2. < .04) (NS) (NS)
-.798 -.013 -.166
F = .77 F = 8.27 F = .58(NS) (2. < .006) (NS)
-.886 1.300 -.619
F = 1.01 F = 1.15 F = .14(NS) (NS) (NS)
-.192 .062 .205
F = .19 F = 1.17 F = .19(NS) (NS) (NS)
-.418 -.038 .002
F = .43 F = .02 F = .62(NS) (NS) (NS)
-.125 .391 -.722
F = .35 F = .90 F = .13(NS) (NS) (NS)
.099 .352 -.064
F = 1.42 F = 3.14 F = 3.14(NS) (2. < .08) < .08)
.357 -.638 .881
F = .006 F = .50 F = .30(NS) (NS) (NS)
-.013 -.074 -.504
F = .003 F = .55 F = .16(NS) (NS) (NS)
.135 .604 -.157

44
Table 8
Effect of Age and Time of Measurement on Transformed ScorePerformance in Experiment I
(Multivariate and Univariate ANOVA)
F ratio and Standardized DiscriminantCoefficients
Test Age Time Age X Time
All tests
ITPA Visual Sequential Memory
Bender Gestalt
F849 = 5.42 F849 = 2.13 F849 = .81
(a < .0001) (a < .05) (NS)
F = .25 F = 1.69 F = .001(NS) (NS) (NS)
-.404 .144 -.143
F = 17.74 F = 8.12 F = .55(R. < .0001) (ja < .0006) (NS)
.959 -.791 .374
Southern California Figure-Ground F = .08 F = .60 F = .75(NS) (NS) (NS)
-.613 .010 .253
DTVP II Figure-Ground
DTVP III Form Constancy
DTVP IV Position in Space
DTVP V Spatial Relations
F = 5.89 F = 1.08 F = .11(a < .02) (NS) (NS)
-.082 .333 -.688
F = .14 F = 2.81 F = 3.14(NS) (a < .10) (a < .08)-.054 -.011 1.11
F = 8.56 F = 5.48 F = .22(1 < .005) (a < .02) (NS)
.110 -.851 -.289
F = 2.94 F = 1.10 F = .03(a < .09) (NS) (NS)
.421 -.662 -.199
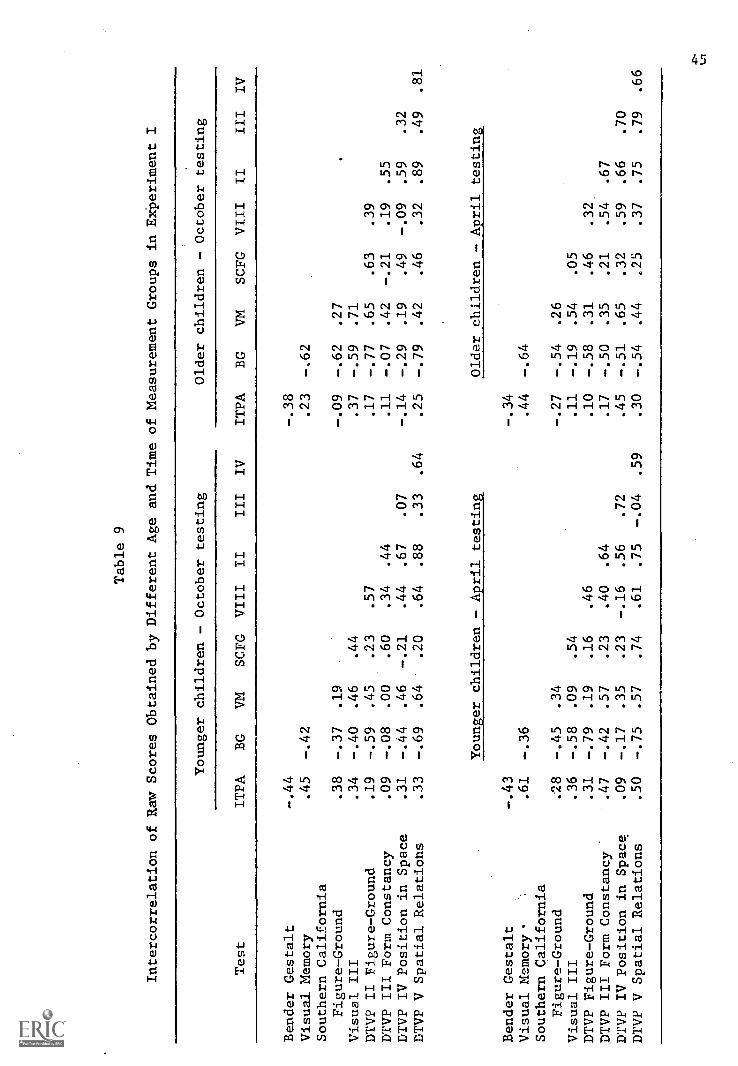
Table 9
Intercorrelation of Raw Scores Obtained by Different Age and Time of Measurement Groups in Experiment I
Test
Younger children - October testing
Older children - October testing
ITPA
BG
VM
SCFG
VIII
II
III
IV
ITPA
BG
VM
SCFG
VIII
II
III
IV
Bender Gestalt
-.44
-.38
Visual Memory
.45
-.42
.23
-,62
Southern California
Figure -- Ground
.38
-.37
.19
-.09
-.62
.27
Visual III
.34
-.40
.46
.44
.37
-.59
.71
DTVP II Figure-Ground
.19
-.59
.45
.23
.57
.17
-.77
.65
.63
.39
DTVP III Form Constancy
.09
-.08
.00
.60
.34
.44
.11
-.07
.42
-.21
.19
.55
DTVP IV Position in Space
.31
-.44
.46
-.21
.44
.67
.07
-.14
-.29
.19
.49
-.09
.59
.32
DTVP V Spatial Relations
.33
-.69
.64
.20
.64
.88
.33
.64
.25
-.79
.42
.46
.32
.89
.49
.81
Younger children - April testing
Older children - April testing
Bender Gestalt
-.43
-.34
Visual Memory.
.61
-.36
.44
-.64
Southern California
Figure-Ground
.28
-.45
.34
-.27
-.54
.26
Visual III
.36
-.58
.09
.54
.11
-.19
.54
.05
DTVP Figure-Ground
.31
-.79
.19
.16
.46
.10
-.58
.31
.46
.32.
DTVP III Form Constancy
.47
-.42
.57
.23
.40
.64
.17
-.50
.35
.21
.54
.67
DTVP IV Position in Space
.09
-.17
.35
.23
-.16
.56
.72
.45
-.51
.65
.32
.59
.66
.70
DTVP V Spatial Relations
.50
-.75
.57
.74
.61
.75
-.04
.59
.30
-.54
.44
.25
.37
.75
.79
.66

Table 10
Intercorrelation of Transformed Scores Obtained by Different Age, and
Time of Measurement Groups in Experiment I
...11
MO
YA
I.ii.
.W
Younger children - October testing
Older children - October testing
Test
ITPA
BG
SCFG
II
III
IV
ITPA
BG
SCFG
II
III
IV
Bender Gestalt
Southern California Figure-Ground
DTVP II Figure-Ground
DTVP III Form Constancy
DTVP IV Position in Space
DTVP V Spatial Relations
.44
.37
.22
.12
.32
.28
.38
.51
.10
.43
.66
.15
.60
-.15
.23
.35
.37
.80
.22
.13
.46
.44
.05
.57
.48
.12
.46
.23
.84
.40
.10
.75
.08
.02
.06
.44
.38
.11
.63
.04
.65
.10
Bender Gestalt
Southern. California Figure-Ground
DTVP II Figure-Ground
DTVP III Form Constancy
DTVP IV Position in Space
DTVP V Spatial Relations
Younger children - April testing
Older children - April testing
.41
-.09
.62
.05
.62
.56
.13
.05
.23
.54
.31
.39
.12
.35
.46
.20
.74
.45
.84
.38
.48
.33
-.32
.16
.16
.37
.32
.55
.47
.49
.49
.61
.41
.22
.28
.25
.67
.71
.72
.75
.78
.71

47
variation from group to group there are some consistencies. The various
subtests of the Developmental Test of Visual. Perception are fairly highly
correlated except for Figure-Ground and Position in Space subtests in
two groups. Correlations tended to be higher between tests which require
the drawing the stimulus (such as the Bender Gestalt and Spatial
Relations subtest of the DTVP) than between drawing tests and those with
other modes of response. Generally, tests (e.g., the Southern California
Figure-Ground test and the Figure-Ground subtest (II) of the Frostig)
which purport to measure the same skill such as memory of figure-ground
discrimination do not show higher correlations with each other than with
other tests designed to test different skills (e.g., the other subtests
of the Frostig).
In contrast to the results of the raw score MANOVA (Table 7), the
analysis of the transformed scores (Table 8) revealed loth main effects,
Age and Time of Measurement, to be statistically significant.
On the ANOVA's of individual tests, the Bender Gestalt again showed
a significant F-ratio for Time of Measurement similar to that seen with
the raw scores. However, the transformed scores Age effect was also
highly significant, revealing better performance by the younger children.
The Figure-Ground (II) subtest of the Frostig also showed a significant
age effect with the transformed scores. Using the transformed scores
the Position in Space (IV) subtest of the DTVP showed a significant Time
of Measurement effect. All other F-ratios including all of those for
the interaction failed to reach statistical significance.
In determining the transformed scores, the younger and older children
were compared to different groups of children as the norms for the tests

48
were given in three or six month intervals. Thus the children five years
four months old were generally compared to children five years to five
years five months old while the older children were compared to children
five years six months to five years eleven months old. The changes
this made in the transformed score assigned to a given raw score were
quite complex as can be seen to some extent by comparing the younger
and older_groap means and standard deviations in Table 6.
Experiment II
The means and standard deviations of the raw and transformed scores
are given in Table 11. Tables 12 and 13 provide the results of the
multivariate and univariate analyses of variance and the discriminant
functions for these data. Tables 14 and 15 provide the intercorrelation
matrices for the raw and transformed scores.
In the multivariate analyses of variance of the raw scores the main
effect for Time of Measurement was significant (2. < .001). This experi-
ment involved a repeated measurement design so there are several factors
contributing to the difference in performance in April versus October.
In the univariate analyses, there were a number of statistically signifi-
cant effects; i.e., the main effects for Time of Measurement for the
Bender Gestalt and Figure-Ground and Spatial Relations subtest of the
Frostig (2. < .01) and the Southern California Figure-Ground and Form
Constancy and Position in Space subtests of the Frostig < .05) re-
flected better performance for the April testing. In addition, the main
effect for Grade placement was significant (2. < .05) for the ITPA Visual
Sequential Memory subtest and the Bender Gestalt, revealing better

Table 11
Means and Standard Deviations for Grade
Placement and Time of Testing Groups in Experiment
II.
Raw Scores
Transformed Scores
Test
October
April
October
April
K1st
K1st
K1st
K1st
3E
S.D.
XS.D.
XS.D.
XS.D.
XS.D.
XC.D.
XS.D.
XS.D.
ITPA Visual Sequential
Memory
17.2
2.7
19.7
3.2
18.2
2.8
20.2
3.1
37.3
4.2
41.1
5.1
36.8
5.0
39.4
7.1
Bender Gestalt
13.8
3.3
9.5
3.3
7.6
5.3
6.5
3.3
38.9
8.7
51.3
9.0
52.1
12.5
54.8
7.6
Visual Memory
17.8
4.1
17.3
4.3
19.0
2.8
18.5
3.6
----
Southern California
Figure-Ground
13.1
3.8
14.0
3.2
15.1
2.6
14.7
4.0
52.7
13.0
57.0
11.4
55.9
9.1
54.6
13.7
Visual III
4.6
2.7
5.6
2.0
4.8
2.4
5.7
2.0
----
DTVP II Figure-Ground
12.8
4.9
15.1
4.2
14.5
5.3
17.1
2.2
9.8
2.2
10.7
1.9
9.5
2.0
11.0
1.8
DTVP III Form 'Constancy
6.8
4.1
8.7
3.8
9.1
3.5
8.7
4.7,
9.7
3.0
11.7
2.9
10.8
2.5
10.6
3.4
DTVP IV Position in Space
5.4
1.6
6.3
1.0
6.5
1.4
6.3
1.4
10.7
2.1
11.5
1.1
11.1
1.9
10.2
2.1
DTVP V Spatial Relations
3.6
2.3
5.0
1.4
4.2
2.3
5.5
1.2
10.2
2.0
11.4
1.5
11.0
2.0
11.3
1.3

50
Table 12
Effect of Grade Placement and Time of Measurement on Raw ScorePerformance in Experiment II
(Multivariate and Univariate ANOVA)
F ratio and standardized discriminantfunction coefficients
Test Grade Time Grade X Time
All tests
ITPA Visual Sequential Memory
Bender Gestalt
Visual Memory
F9,20
= 1.17 F9,20
= 11.66 F9,20
= 1.69
(NS) < .0001)
F = 5.19 F = 3.38 F = .26(ja < .03) (2. < .08) (NS)
-.434 -.361 -.307
F = 4.36 F = 73.21 F = 8.61(ja < .05) (l < .0001) (e. < .01)
1.185 .991 .769
F = .18 F = 2.73 F = .002(NS) (NS) (NS)
. 799 -.246 -.112
Southern California.Figure-Ground F = .05 F = 6.12 F = 1.24(NS) (2. < .02) (NS)
.675 .047 -.120
Visual III
DTVP II Figure-Ground
DTVP III Form Constancy
DTVP IV Position in Space
DTVP V Spatial Relations
F 1.75 F = .10 F = .02(NS) (NS) (NS)
. 081 .038 -.117
F = 2.99 F = 8.73 F = .07(ja < .09) < .01) (NS)
-.478 -.445 -.053
F = .29 F = 4.13 F = 4.14(NS) (ja < .05) (p < .05)
-.077 -.333 -.604
7_ .70 F = 5.88 F = 4.58(NS) (2_ < .02) (2. < .04)
-.269 .038 -.338
F = 2.50 F = 10.75 F = 2.29(NS) (2_ < .01) (NS)
.501 -.245 -.083

51
Table 13
Effect of Grade Placement and Time of Measurement on Transformed ScorePerformance in Experiment II
(Multivariate and Univariate ANOVA)
F ratio and standardized discriminantfunction coefficients
Test Age Time Age X Time
All tests F8,21
= 1.02 F821 = 5.93 F821 = 2.22
(NS) < .0005) < .07)
ITPA Visual Sequential Memory F = 3.15 F = 1.17 F = .31fp_ < .09) (NS) (NS)
.310 .064 .284
Bender Gestalt F = 5.04(2. < .03)
F = 34.00(11 < .0001)
F = 11.28(j < .002)
.946 1.179 .874
Southern California Figure-Ground F = .14 F = .04 F = 1.99(NS) (NS) (NS)
-.596 -.283 -.026
DTVP II Figure-Ground F = 3.43 F = 0 F = .51< .07) (NS) (NS)
.654 .324 .075
DTVP III Form Constancy F = .72 F = 0 F = 5.90
DTVP IV Position in Space
(NS) (NS) (2. < .02)
-.060 .342 .701
F = 0 F = 1.32 F = 4.54(NS) (NS) (2 < .04)-.044 -.811 -.253
DTVP V Spatial Relations F = 1.64 F = 1.63 F = 2.28(NS) (NS) (NS)
-.811 .312 .191
9

Table 14
Intercorrelation of Raw Scores Obtained by Different Grade Placement and
Time of Testing Groups in Experiment II
Kindergarten children - October testing
First grade children - October testing
Test
ITPA
BG
VII
SCFG
VIII
II
III
IV
ITPA
BG
VM
SCFG
VIII
II
III
IV
Bender Gestalt
Visual Memory
Southern California
Figure-Ground
Visual III
DTVP II Figure-Ground
DTVP III Form Constancy
DTVP IV Position in Space
DTVP V Spatial Relations
-.45
.42
.04
.42
.36
.39
.03
.36
-.56
-.58
-.63
-.76
-.12
-.32
-.78
.24
.72
.68
.61
.38
.42
.22
.63
-.12
.39
.43
.49
.31
.64
.39
.53
.37
.80
.24
.40
.42
.08
-.09
.13
.46
.34
-.10
.18
.10
-.57
-.50
-.12
-.30
-.82
-.23
-.43
.29
-.06
.21
.39
.01
.10
.48
.34
.70
.15
.20
.15
.20
.36
.12
.40
.01
.85
.07
.38
.03
Bender Gestalt
Visual Memory'
Southern California
Figure-Ground
Visual III
DTVP II Figure-Ground
DTVP III Form Constancy
DTVP IV Position in Space
DTVP V Spatial Relations
Kindergarten children - April testing
First grade children - April testing
.03
-.35
.23
.57
.37
.40
.33
.47
.71
-.36
-.52
-.69
-.61
-.11
-.30
-.65
.28
.67
.53
.04
.36
.38
.46
.55
.05
.09
.42
.61
.10
.32
.65
.38
.38
.58
.14
.10
.65
.08
-.09
.13
.46
.34
-.10
.18
.10
-.50
-.50
-.12
-.30
-.82
-.23
-.43
.29
-.06
.21
.39
.01
.10
.48
.34
.70
.15
.20
.15
.20
.36
.12
.40
.01
.85
.C7
.38

r
Table 15
Intercorrelation of Transformed Scores Obtained by Different
Grade Placement and
Time of Testing Groups in Experiment II
Kindergarten children - October testing
First grade children - October testing
Test
ITPA
BG
SCFG
II
III
IV
ITPA
BG
SCFG
II
III
IV
Bender Gestalt
.46
.18
Southern California Figure-Ground
.03
..58
-.26
.48
DTVP II Figure-Ground
.27
.53
.54
.11
.40
.46
DTVP III Form Constancy
.39
.12
.13
.60
-.38
.51
.57
.27
DTVP IV Position in Space
.04
.28
.35
.39
.29
.05
.41
.08
.13
.14
DTVP V Spatial Relations
.27
.72
.39
.74
.36
.44
.24
.71
.27
.34
.45
.51
Kindergarten children - April testing
First grade children - April testing
Bender Gestalt
Southern California Figure-Ground
DTVP II Figure-Ground
DTVP III Form Constancy
DTVP IV Position in Space
DTVP V Spatial Relations
.37
.58
.41
.35
.50
.70
.53
.62
.16
.47
.66
.45
.11
.27
.41
.55
.33
.53
.16
.09
.67
-.16
.14
-.02
-.28
.17
-.07
.51
.39
.84
.14
.39
.40
.66
.32
.19
.53
.04
.80
.11
.36
.12
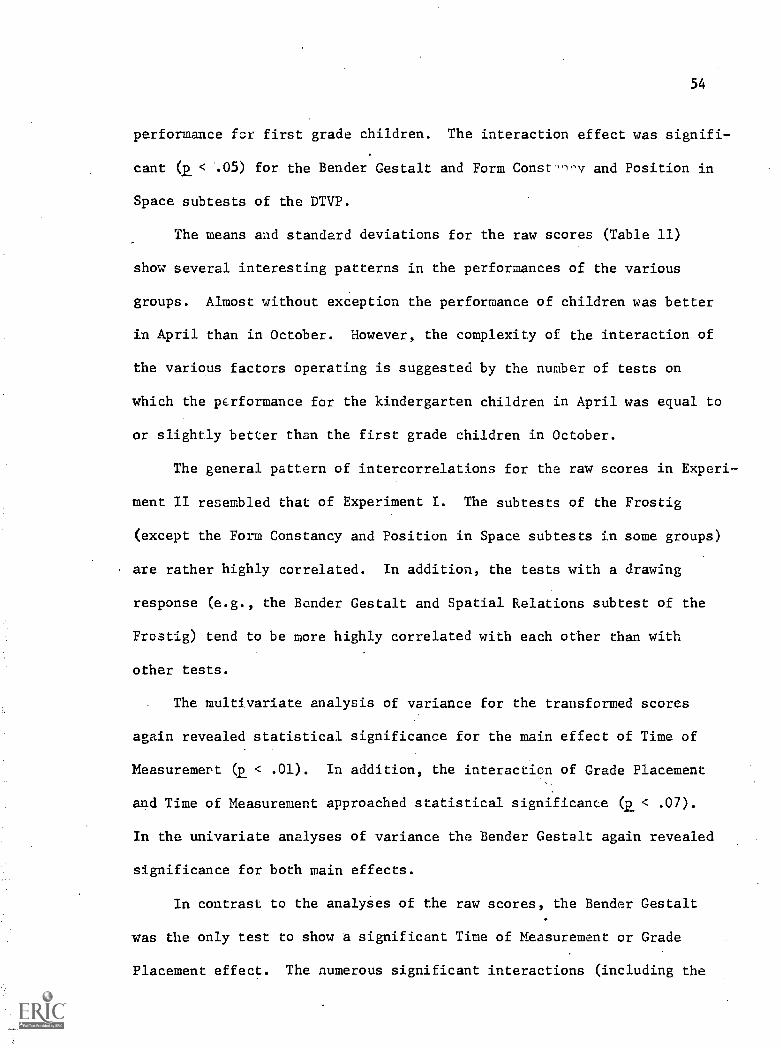
54
performance for first grade children. The interaction effect was signifi-
cant (2. < .05) for the Bender Gestalt and Form Const,nry and Position in
Space subtests of the DTVP.
The means and standard deviations for the raw scores (Table 11)
show several interesting patterns in the performances of the various
groups. Almost without exception the performance of children was better
in April than in October. However, the complexity of the interaction of
the various factors operating is suggested by the number of tests on
which the performance for the kindergarten children in April was equal to
or slightly better than the first grade children in October.
The general pattern of intercorrelations for the raw scores in Experi-
ment II resembled that of Experiment I. The subtests of the Frostig
(except the Form Constancy and Position in Space subtests in some groups)
are rather highly correlated. In addition, the tests with a drawing
response (e.g., the Bender Gestalt and Spatial Relations subtest of the
Frostig) tend to be more highly correlated with each other than with
other tests.
The multivariate analysis of variance for the transformed scores
again revealed statistical significance for the main effect of Time of
Measurement (11 < .01). In addition, the interaction of Grade Placement
and Time of Measurement approached statistical significance (2 < .07).
In the univariate analyses of variance the Bender Gestalt again revealed
significance for both main effects.
In contrast to the analyses of the raw scores, the Bender Gestalt
was the only test to show a significant Time of Measurement or Grade
Placement effect. The numerous significant interactions (including the

55
Bender Gestalt and the Frostig Form Constancy and Position in Space
subtests) in general, revealed greater differences in performance between
the kindergarten and first grade groups at the October testing. This
is especially apparent for the Bender Gestalt test.
In this experiment the difference in normative groups to which the
children were compared occurs as part of the difference in the two times
of measurement. Thus the same children were compared to one norm group
in October and to a different (older) group in April. This could be a
factor in the generally higher F-ratios for the Time of Measurement for
the transformed scores.

56
DISCUSSION
The Role of Age Factors
In Experiment I there were two different age groups (5 years 4 months
and 5 years 10 months). Within each age group were two subgroups with
different amounts of school experience (children of each age were tested
in October and April). When raw scores for the two age groups were
compared the difference in scores on only one test reached statistical
significance.
These results appear to contradict the published normative data for
the various tests. However, several factors need a closer examination.
Using the Illinois Test of Psycholinguistic Abilities (Kirk,' McCarthy,
and Kirk, 1968) norms as an example (since it has norms at three month
intervals over a fairly wide age range), a question is raised whether
the difference in performance between age groups is really as large as
is suggested by the way the norms are published. Scale values are given
( for groups of children spanning only three months and also an age equiva-
lent is given for every raw score. If two adjacent age groups are
compared the difference in scaled scores for any given raw score is
usually one or two points. However the standard deviation of the scaled
scores is 6 so the difference is not really very large. It seems quite
possible that the differences in performance between age groups in the
normative sample three or even six months apart would not be statistically
significant if subjected to an analysis of varian 1.
Since the transformed scores assigned to the raw scores vary with
the child's age, it was expected that the transformation would change

57
the relative performance of each group represented in Experiment I. The
anticipated result was that the difference in mean scores for the two
age groups would decrease since the same raw score for the older group
would generally be assigned a lower transformed score than the same raw
score earned by a younger child. 'In fact, the pattern of the transformed
scores showed that the younger children manifested better relative per-
formance than the older children, particularly at the October time of
testing. This result suggests that the difference in the performance
of the norm groups is related to the average amount of school experience
children of a particular age have had. -In other words; when children of
a given age with less than average school experience are compared to the
appropriate (i.e., equal CA) norm group, their performance would be
underestimated because of being assigned a score based on the performance
of a group with more school experience. The opposite result would occur
with a group of children with more than the average amount of school
experience. This would explain why a negative relationship between age
and performance occurred for the analyses involving the transformed
scores.
The child's age at the time of testing defines his cohort and thus
his position in the range of ages present in the classroom. In this
experiment there was essentially one group each from the youngest and
oldest children plus two groups from the middle of the age span. There
was no significant age by time of testing interaction effect seen on any
of the tests which suggests that the effect of school experience for the
two extreme groups is not different from that for the two middle groups.
However this type of design does not permit a comparison of the school
58
effect on the youngest and oldest children as they are not tested at the
same point in time.
In Experiment II age was only one of the factors associated with
the differences in the two times of measurement. In addition, the time
of measurement included six months of additional but different (kinder-
garten versus first grade) school experience for the two groups plus
potential influences of the effect of repeated testing. This confounding
makes it difficult to judge the role of increased age in the differences
in performance seen at the two times of testing. There were significant
differences in performance on six of the nine tests with two of the
other three tests approaching the .10 level of significance. The multi-
variate analysis of variance showed a significant (p < .0001) Time of
Testing effect but the Bender Gestalt contributeeheavily to this. These
results indicate that an increase in age combined with the other factors
is related to a significant improvement of test performance but the
design does not permit an analysis of the effects of the several con-
founded factors.
The Role of. School Experience
In Experiment I there was a six months difference in school expe-
rience between the two times of testing (October versus April). When
the raw scores of children of the same age (at the time of testing, not
the same cohort) were compared the performance on only one test, the
Bender Gestalt, revealed significant differences. The Bender Gestalt
requires a child to reproduce a design and it is fairly easy to see a
relationship between this skill and being able to print letters accurately.

59
All but possibly one kindergarten included writing letters and words in
its prograffi.
The lack of significant differences for the raw score analyses on
the other tests suggests that at least in this experiment school expe-
rience was not a powerful influence on performance. However, the means
in Table 6 show there was a difference in performance on almost all
tests but that it was fairly small in terms of the variability within
the group as expressed by the standard deviations. In most instances,
the difference between time of testing groups was at least as large as
between different age groups. This combined with the fact that the age
effect did not generally reach. significant levels either suggests that
school experience should not be excluded as a possibly very important
factor but that further study is needed to determine its relative role.
In general, the pattern of results in Experiments I and II provide
an interesting picture. The analyses of the raw scores from both experi-
ments suggest the absence of statistically significant effects attribu-
table either to school experience or chronological age. This was true
even though small but generally consistent differences in performance
were revealed across all tests, these differences favoring the children
tested later in the school year.
The analyses of the transformed scores in Experiment I, however,
indicated statistically significant effects attributable to both school
experience and chronological age, the relationship being positive in
the case of the former and negative for the latter variable. This
pattern of results suggest:

60
1. that age differences in normative patterns on the tests are
likely due to the fact that the norm groups on which the
tests were standardized differed both in terms of chronologi-
cal age and school experience, and
2. that amount of school experience is the likely factor res-
ponsible for the performance differences among age groups
revealed in the norms on the various tests.
In other words, cross-age comparisons (with school experience controlled)
involving normative scores places the older children within a class at
a relative disadvantage since the norms were developed on groups where
chronological age and school experience covaried.
Since grade placement groups a whole year's age span of children
together, the relationship between age and school experience is somewhat
complex. Essentially what happens is that the youngest children in
each grade would have had more school experience than the average for
their age and the oldest would have had less than average. If the
transformed scores for the youngest (5-4 in April) and the oldest (5-10
in October) are compared to the mean for their age group, it can be seen
that the mean for the youngest group is above the mean of the norm
group and the mean for the oldest group is below the norm group on all
but two tests.
Similarly, comparisons across levels of school experience should
yield positive influences of schooling when the scores are transformed.
It should be noted that such conclusions are possible only if school
experience is the primary factor influencing performance on the tests
used in the present study.

61
These interpretations are partially supported by the results of
Experiment II where the results reflected in the analyses of the raw and
transformed scores were very similar.- In this instance both the kinder-
garten and first grade children were compared to the same norm group
because of their similarity in ages. Thus one group was not differen-
tially favored over the other. Where the transformation involved dif-
ferent norm groups (in the time of measurement effect) statistically
significant differences were revealed.
In the analyses of the grade placement effect in Experiment II a
number of the tests failed to show significant differences in the two
groups. However, the two times of testing for each group were combined
for these analyses. Most of the tests failing to show a significant
main effect for grade placement effect did yield a significant interaction
effect. This interaction effect was due to a greater improvement in per-
formance by kindergarten children in comparison to the first grade
children. Thus averaging the scores for the kindergarten group at the
two times of testing tends to obscure the difference-which existed at
the October time of testing.
Experiment II involved a comparison of two groups of children
(kindergarten and first grade) who had different amounts of school
experience prior to the first testing and who, between the two times
of testing, had different types of school experience. It is possible
that the tests used in the present study are those whose task demands
are closely related to the types of readiness actinides included in
the kindergarten curriculum. If it were possible to plot a learning
curve for a task such as judging differences in position in space there
62
might well be a steep acceleration at the beginning of kindergarten
(which is generally the first time this aspect of visual stimuli is
stressed) with little improvement thereafter. With this reasoning,
school experience may be viewed as influencing performance primarily for
the kindergarten children. Again, however, these comments relate to the
analyses of the transformed scores.
If there is, however, an interaction between the type of school
experiences a child had and his chronological age then the picture is
more complicated. In this experiment the kindergarten children were
the oldest intheir class while the first-grade children were the youngest.
It is possible that the first-grade children lacked some factor such as
neurological maturity needed to benefit maximally from first grade ex-
periences.
Visual Perception Tests
.ere are a number of elements of the results of this study which
lead to questions about the current use and interpretation of visual
perception tests. One concerns what the tests aye actually measuring.
Tables 9, 10, 14, and 15 give the intercorrelations seen in the various
groups. Although there are some similarities, there is also considerable
sample to sample variation. Most of these tests have fairly low test-
retest reliability, so correlations should be interpreted with care.
Tests which are described as testing essentially the same skill such
as the two figure-ground tests, the Southern California Figure-Ground
test and Figure-Ground subtest of the Frostig, and three visual memory
tests, the ITPA Visual Sequential Memory subtest, Visual Memory, and
63
Visual III, in general did not correlate more highly with each other
than with other tests. There was a tendency for performance on tests
requiring accuracy in drawing the stimulus such as the Bender Gestalt
anc:. the Spatial Relations subtest of the Frostig to show a stronger
relationship with one another. It would appear there are some identi-
fiably different aspects of visual perceptual skills in addition to a
basic underlying skill possibly related to the effectiveness with which
the child uses the various structures of the visual apparatus. However,
it is quite likely we have not even begun to identify the specific
factors, let aThne devise appropriate tests.
There is an additional problem in that the child must make some kind
of response in order for us to measure his performance. On a task as
complex as reproducing designs, as is used on the Bender Gestalt, clinical
experience has suggested that there are a number of possible factors
that can affect a child's performance. One is indeed related to visual
skills such as the ability to scan effectively to form an accurate
Gestalt or the ability to match on different stimulus characteristics
such as angle, or relative size. However, children with subtle disorders
of the motor system may be unable to reproduce the design although they
know perfectly well what they are to draw and how what they have drawn
differs from the sample. Other children may have good motor skills but
have difficulty in visually guiding what they do. Until such time as
a matrix of tests are developed which vary only on a single factor
related to the task demands, it is unlikely that we will be able to
investigate the relationship between the various visual perceptual skills
now described in the literature.
64
Several aspects of the statistical results of this study suggest
caution in the numerical aspects of test interpretation. For example,
the performance did not differ for groups of children who differed in
age by six months and had the same school experience. The test manuals
present data in such a way that it is easy to be led into thinking that
there is a fairly good-sized change in performance from one age group
to another. For example, the manual for the Developmental. Test of Visual
Perception (Frostig et al., 1964) presents standardization curves,
plotting raw scores versus chronological age, which climb upward fairly
rapidly between the ages of three and eight. Norm tables are given
with the scaled scores for all tests for one age together in a table,
rather than for all ages on each test, making it difficult to compare the
differences in performance from one age group to the next. Generally,
the standard deviation of the scaled scores is large enough that the same
scaled score is not assigned to more than one raw score, in fact there
is often a several point difference. It is all too easy to lose sight
of the size of the standard deviation and get the impression that the
differences in performance between the age groups is larger than it
really is.
Not only do we need to consider the size of the differences in
group means but also the variability within the group. The range of
scores within each of the experimental groups in this study was con-
siderab1., particularly in light of the limited number of items on some
of the tests. Except for the Visual Memory test, and the ITPA Visual
Sequential Memory subtest there were eight or less items in each test.
Even when the test had a large number of items the actual number of

65
items that discriminated well at that age range was small. With the
limited points available on each subtest, scores even two standard
deviations above or below the mean were not possible on many of the
tests.
The variability within versus between groups particularly needs
to be considered when age equivalents are given for raw scores. A child
whose score falls within one standard deviation of the mean for his
norm group may "earn" an age equivalent a year or more different from
his chronological age. It is all too easy to label a child as deficient
or retarded in terms of a skill when his "true score" is really quite
typical for his age. Furthermore, the test- retest reliability for these
tests is only moderate at best.
There has been a fair amount of discussion about some of the dif-
ficulties caused by having several short subtests purporting to measure
different skills. One side of the argument says that to sum these scores
together is like putting apples and oranges together and describing how
much fruit you have. This gives a figure which is not very helpful if
you want to make an apple pie. This is the view expressed by those who
stress the importance of discrete visual perceptual skills (e.g., Frostig,
Ayres). A major criticism of such tests has been that the test relia-
bility is too poor for the small sample of behavior taken in each subtest.
Even if there are discrete visual perceptual skills you fail to measure
them with sufficient accuracy to be useful. Hopefully, as the inter-
relationships of the various types of skills needed for various visual
"tasks are better understood a different type of test structure will be
possible. This would include a gross screening test with complex tasks

66
requiring several skills so that all the skills would be needed to pass
the test but an inordinate number of items would not be needed. Corre-
lated with this would be a matri% of tests involving known and limited
combinations of skills which could be used to determine specifically
why a particular child fails at certain tasks.
The present results also permit some tentative suggestions regarding
the basis for establishing norms on the tests. The present normative
scoring procedure used on the tests utilizes chronological age as the
base. The results of the present study suggest the absence of a relation-
ship between performance and chronological age when school experience
is controlled. As already suggested, it is likely that current pro-
cedures for selecting normative samples result in the confounding of
chronological age-related factors and the amount of school experience.
Furthermore, the analyses relating to the transformed scores in Experiment
I suggested that school experience was the primary factor contributing
to the performance differences in the normative samples. If this
reasoning is correct, the performance of older children within a grade
would be underestimated in relation to normative profiles. If this is
the case, a strong argument can be made for using norms based on grade
placement

67
SUMMARY
Restatement of Purpose
This study attempted to investigate the effects of school experience
on visual perception tests involving line figures and forms. These
tests, which are generally used to "diagnose" the causes of school dif-
ficulties, have norms which are based on chronological age and do not
take into account the amount of school experience.
If the various activities in the kindergarten and first grade curricula
designed to develop visual skills do indeed foster such development one
would expect to see differences in performance related to the amount of
school experience. The average performance for children of a given age .
such as 5 years 4 months should be higher if they are tested in the
spring near the end of kindergarten rather than in the fall when school
experience is just beginning. This would result in children with dif-
ferent birthdates showing different average levels of a skill due to the
relationship of chronological age and school experience.
There were ,two experiments in this study. Experiment I attempted
to examine the independent and interactive influences of school experience
and chronological age in kindergarten children. Experiment II attempted
to compare the effects of kindergarten and first grade curricula on
performance on visual perception tests.
Procedure
Children were selected on the basis of birthdate from eight of the
nine elementary schools in Urbana, Illinois. Therewere 15 children in
each of the groups.

68
In Experiment I a time-sequential design as outlined by Schaie
(1965) was used. This design permits inferences as to age differences
as well as differences related to the time of measurement. The ages
were 5 years 4 months and 5 years 10 months and the testing times were
in October and April.
Time of testing
Age October April
Younger 5-4 5-4
Older 5-10 5-10
In Experiment II, a test-retest design was used with kindergarten
and first grade children whose birthdays were close to the December 1
cut-off date so the two groups were less than one month apart in age.
Testing dates were October and April.
Tests chosen had to meet two major criteria:
1. The test involved the discrimination of line figures as
forms rather than as symbols with meaning.
2. The test was suitable for use with five and six-year-old
children.
An attempt was made to include more than one test of what appeared
to be a similar processing task but which had different types of response
such as multiple-choice versus copying.
The tests chosen were:
1.
2.
3.
The Developmental Test of Visual Perception (Frostig, 1961)
Visual Memory Test (Wood, 1971)
Visual Motor Gestalt Test (Bender, 1938; Koppitz, 1964)

69
4. The Visual Sequential Memory subtest of the Illinois Test
of Psycholinguistic Abilities (Kirk, McCarthy, and Kirk,
1968)
5. The Southern California Figure-Ground Visual Perception
Test (Ayres, 1966)
6. Visual III from the Reading Aptitude Tests (Monroe, 1935)
There were two testing sessions of 45 minutes to an hour, at least
two days apart. In one session the Developmental Test of Visual Percep-
tion was administered, usually to a group of two or three children.
In the other session tests 2 to 6 were administered to individual children
in the order listed.
Results
In Experiment I the multivariate analysis of variance of the raw
score performance on the tests showed that all F-ratios for the tests
as a group failed to reach statistical significance. On the individual
analyses of variance the ITPA Visual Sequential Memory subtest had an
Age F-ratio significant at the .05 level, and the Bender-Gestalt had a
Time of Measurement F-ratio significant at the .01 level. All other
individual F-ratios failed to reach statistical significance in the raw
score analyses. However, the analyses of the transformed scores indicated
that the amount of school experience was positively related to performance
and that chronological age was negatively related to performance.
In Experiment II the multivariate analysis of variance showed that
the F-ratio for the Time of Measurement was significant at the .01 level.
This factor confounded an increase in age, school experience, and

70
familiarity with the tests. On the individual analyses of variance five
tests had significant F-ratios'on the Time of Measurement factor the
Bender-Gestalt, Southern California Figure-Ground Visual Perception test
and three of the subtests of the Developmental Test of Visual Perception.
Two tests had significant F-ratios on the Grade Placement factor -- the
ITPA Visual Sequential Memory subtest and the Bender-Gestalt. There were
also three significant F-ratios for the Grade by Time of Measurement inter-
action. These occurred with the Bender-Gestalt and Form Constancy and
Position in Space subtests of the Developmental Test of Visual Perception.
These interactions suggested that kindergarten children manifested greater
improvement from October to April than did first-grade children. The
results of the analyses of the transformed scores were similar to those
of the raw scores.
Implications
The lack of clear-cut results in this study suggest a need for
further investigation of the role of training in performance on visual
perception tests. Although the test results generally did not show a
statistically significant school experience effect, neither was there a
significant difference in the groups six months apart in age. The dif-
ferences in groups of children six months different in age with the same
school experience were actually quite small. Only when a difference in
school experience and familiarity with the tests was combined with a six
months difference in age did significant differences appear on most of
the tests. -
A closer look atthe size of the standard deviations and the dif-
ferences in mean performance of different age groups is needed. It is

71
extremely rare to find a test where the difference in the mean scores for
groups even a full year apart in age is as large as one standard deviation.
If the age equivalent scores are used it is quite possible for a child
whose_ score is within one standard deviation of the mean for his age group
to be assigned ane equivalent one year or more below his chronological
age with the implication that he has a serious lag in the development of
that skill.
In Experiment II the interaction effects indicate a greater change
in six months for the kindergarten children in comparison to the first
qra(id children. It appears that probably there is a comparatively more
rapid change in certain skills at the beginning of a child's formal school
experience with a relative leveling off of the curve later. This pattern
could be different in communities where attendance at structured nursery
school is common or where public kindergartens do not exist. Particular
caution should be used when interpreting the scores of clhldren just
beginning school or who are of kindergarten age but not yet in school.
Most critical is the finding that the present normative groups
based on age penalize the child who is among the older children in his
grade. In contrast the younger children in a grade tend to have per-
formances above average for their age group, presumably because they
have had more school experience than the average for their age. Although
renorming the present tests on the basis of grade placement is probably
impractical, the manuals should mention the role of school experience.
Particularly for the five and six year old children who would be starting
school the size of the variation related to grade placement should be in-
vestigated and reported so it could be used in interpretation of the scores.

72
Although the relatively low test-retest correlation of the test
scores limits the accuracy of correlations between scores on different
tests, the number of high correlations between tests supposedly measuring
different skills (as well as some very low correlations between tests
described as measuring-the same skill) suggest the need for further stUdy
of what the present tests are really measuring and how accurately they
discriminate between differences in abilities essential to academic
success.

73
LIST OF REFERENCES
Ashlock, P. The visual perception of children in the primary grades andits relation to reading performance. In J. A. Figurel (Ed.),Reading and inquiry. Proceedings of the International ReadingAssociation, 1965, 10, 331-332.
Ayres, A. J. Southern California Figure-Ground Visual Perception Test.Los Angeles: Western Psychological Services, 1966.
Baker, H. J., & Leland, B. Detroit Tests of Learning Aptitude, ExaminersHandbook. Indianapolis: Bobbs-Merrill, 1967.
Baltes, P. B., Baltes, M. M., & Reinert, G. The relationship between timeof measurement and age in cognitive development of children: Anapplication of cross-sectional sequences. Human Development, 1970,13 258-268.
Barrett, T. C. The relationship between measures of pre-reading visualdiscrimination and first grade reading achievement: A review ofthe literature. Reading Research Quarterly, 1965, 1, 51-76. (a)
Barrett, T. C. Visual discrimination tasks as predictors of first gradereading achievement. Reading Teacher, 1965, 18, 276-282. (1)
Barrett, T. C. Goals of the reading program: The basis for evaluation.In A. Beery, T. C. Barrett, & W. R. Powell (Eds.), Elementaryreading instruction. Boston: Allyn and Bacon, Inc., 196.
Beery, K. E. Visual-motor integration. Chicago: Follett PublishingCompany, 1967.
Bender, L. A visual motor Gestalt test and its clinical use. AmericanOrthopsychiatric Association Research Monograph #3, 1938.
Benton, A. L. A visuaJ retention test for clinical use. New York: ThePsychological Corporation, 1946.
Betts, E. A. Factors in-readiness for reading. Educational Administra-tion and Supervision, 1948, 19, 199-230.
Bond, G. L., & Wagner, E. B. Teaching the child to read. New York: TheMacMillan Company, 1950.
Bryan, Q. R. Relative importance of intelligence and visual perception inreading achievement. California Journal of Educational Research,1964, 15, 44-48.
Carter, L. B. The effect of early school entrance on the scholasticachievement of elementary school children in the Austin PublicSchools. Journal of Educational Research, 1956, 50, 91-103.

74
Corah, N. L., & Powell, B. J. A factor analytic study of the FrostigDevelopmental Test of Visual Perception. Perceptual and MotorSkills, 1963, 16, 59-63:
Craddick, R. A. WISC and WAIS as a function of season birth. Psychologi-calRepolits, 1966, 18, 259-264.
DeBoer, J. J., & DallTen, M. The teaching of reading. New York: Holt,Rinehart & Wi:Aon, Inc., 1964.
Dennis, R., & Dennis, M. Dennis Visual Perception Scale. Los Angeles:Western Psychological Services, 1971.
Dickinson, D. J., & Larson, D. J. The effects of chronological age inmonths on school achievement. Journal of Educational Research,1963, 56, 492-493.
Dunn, S. S. Review of the Harrison Stroud Reading Readiness Profiles.In O. K. Buros (Ed.), The fifth mental measurements yearbook.Highland Park, N. J.: The Gryphon Press, 1959.
Fellows, B. S. The discrimination process and development. New York:Pergamon Press, 1968.
Fialkin, H. N., & Beckman, R. O. The influence of month of birth on theintelligence scores of adults. Journal of Genetic Psychology, 1938,52, 203-209.
Frostig, M. Developmental Test of Visual Perception. Palo Alto, Calif.:Consulting Psychologists Press, 1961.
Frostig, M. et al. The Marianne Frostig Developmental Test of VisualPerception, 1963 standardization. Perceptual and Motor Skills,1964, 19, 463-499.
Frostig, M., & Horne, D. The Frostig Program for the Development ofVisual Perception. Chicago: Follett Publishing Company, 1964.
Gates, A. I. The necessary mental age for beginning reading. Elementary.School Journal, 1937, 37, 497-508.
Gates, A. I. Further evaluation of reading readiness tests. ElementarySchool Journal, 1940, 40, 577591.
'libson, E. J., Gibson, J. J., Pick, A. D., & Osser, H. A developmentalstudy of the discrimination of letter-like forms. Journal ofComparative and Physiological Psychology, 1962, 56, 897-906.
Goins, J. T. Visual perceptual abilities and early reading progress.University of Chicago Sunplementary Educational Monograph, 1958,No. 87.

75
Goodenough, F. L. Intelligence and month of birth. Psychological Bulletin,1940, 37, 442.
Graham, F. K., & Kendall, B. S. Memory-For-Designs Test; Revised GeneralManual. Perceptual and Motor Skills, 1960, Monograph 2-VII.
Gray, W. S. Summaryof investigations relating to reading.Chicago Supp1q4entary Educational Monograph, 1925, No.
Hake, H. W. Form discrimination and the invariance of form.(Ed.), Pattern recognition. New York: John Wiley and1966.
University of28.
In L. UhrSons, Inc.,
Hall, R. V. Does entrance age affect achievement? Elementary SchoolJournal, 1963, 63, 391-396.
Hildreth, G. H., Griffiths, N. L., & McGauvran, M. E. MetropolitanReadiness Tests.' New York: Harcourt, Brace, and World, Inc., 1966.
Hirst, W. E. Entrance age: A predictor variable for academic success?Reading Teacher, 1970, 23, 547-555.
Huntington, E. Season of birth. New York: Wiley and Sons, 1938.
Ilg, F. L., & Ames, L. B. School readiness: Behavior tests used at theGesell Institute. New York: Harper and Rows 1964.
Jinks, R. An investigation into the effect of date of birth on subsequentschool performance. Educational Research, 1964, 6, 220-225.
Kass, C. E. Some psychological correlations of severe reading disability(Dyslexia). (Doctoral dissertation, University of Illinois).Ann Arbor, Mich.: University Microfilms, 1962, No. 62-6271.
Keogh, B. K. Form copying tests for prediction of firSt grade reading.In 27th Yearbook Claremont Reading Conference, 1963.
King, I. B. Effect of age of entrance into Grade I upon achievement inelementary school. In V. M. Noll and R. P. Noll (Eds.), Readingsin educational psychology. New York: The MacMillan Company, 1962.
Kirk, S. A., McCarthy, J. J., & Kirk, W. D. Illinois Test of Psycho-linguistic Abilities. Champaign, Ill.: University of IllinoisPress, 1968.
Koppitz, E. M. The Bender Gestalt Test for. Young Children. New York:Grune & Stratton, inc., 1964.
Lee, J. M., & Clark, W. W. Lee-Clark Reading. Readiness Test, 1962Revision. Monterey, Ca/if.: California Test Bureau, 1962.
76
Lodge, T. Variation in Stanford-Binet IQ's of preschool children accordingto the months in which examinations were given. Journal of Psy-chology, 1938, 6, 385-395.
Lord, E., & Wood, L. Diagnostic values in a visual-motor test. AmericanJournal of Orthopsychiatry, 1942, 12, 414-428.
Miller, L. C., Loewepfeld, R., Lindner, R., & Turner, J. Reliabilityof Koppitz scoring system for the Bender. Gestalt. Journal ofClinical Psychologz, 1953, 19, 2111.
Miller, W. D., & Norris, R. C. Entrance age and school success. Journalof School Psychology, 1967, 6, 47-60.
Mills, C. A. Mental and physical development as influenced by season ofconception. Human Biology, 1941, 13, 378-389.
Monroe, M. Reading aptitude tests. Boston: Houghton Mifflin Company,1935.
Murray, B. B. A suggested method forpre-school identification of readingdisability. Knoxville: Tennessee University Psychological Clinicy-1966.
O'Connor, W. J. The relationship between the Bender Gestalt Test and theMarianne Frostig Developmental Test of Visual Perception. In G. D.Spache (Ed.), Reading disability and_perception. Proceedings of .
the International Reading Association, 1969, 13, 72-81.
Ohnmacht, F.. W., & Olson, A. V. Canonical analysis of reading readipessmeasures and the Frostig-Developmental Test of Visual Perception.'Educational and Psychological Measurement, 1968, 28, 479-484.
Olson, A. V. Factor analytic studies of the Frostig Developmental Test ofVisual Perception. Journal of Special Education, 1968, 2, 429-433.
Orme J. E. Intelligence, season of birth and climatic temperature.British Journal of psychology, 1963, 54, 273-276.
Paraskevopoulos, J. N., & Kirk, S. A. The development and.2sychometriccharacteristics of the Revised Test of Psycholinguistic Abilities.Urbana, 111.: University of Illinois Press, 1969.
Petty, M. C. An experimental study of certain factors influencing readingreadiness. Journal of Educational Psycholoa, 1939, 30, 215-230.
Phelan, Sister Mary B. Visual perception in relation to variance inreading and spelling: A statistical analysis. Catholic Universityof America Educational Research Bulletin, 1940, 12(3).

77
Pintner, R., & Forlano, G. The influence of month of birth on intelli-gence quotients. Journal of Educational Psychology, 1933, 24,561-584.
Potter, M. C. Perception of symbol orientation and early reading success.Teachers College Contributions to Education, 1949(939).
Roberts, J. A. F. Intelligence and season of conception. British MedicalJournal, March:,4, 1944, 320.
Rosen, C. L. An experimental study of visual perceptual training andreading achievement in first grade. Perceptual and Motor Skills,1966, 22, 979-986.
Rosenthal, M. A comparison of reading readiness achievement of kinder-garten children of disparate entrance avis. Queens College,City University of New York, 1969.
Schaie, K. W. A general model for the study of developmental problems.Psychological Bulletin, 1965, 64, 92-107.
Silver, A. A., & Hagin, R. A. Maturation of perceptual functions inchildren with specific reading disability. Reading Teacher, 1966,19, 253-259.
Silver, A. A., & Hagin; R. A.- Visual perception in children with readingdisabilities. In F. A. Young and D. B. Lindsley (Eds.), Earlyezperience and visual information processing in perceptual andreadindisorders. Washington, D. C.: National Academy ofSciences, 1970.
Sister Mary of the Visitation. Visual perception in reading and spelling:A statistical analysis. Catholic University of America EducationalResearch Bulletin, 1929, 4(1).
Spache, G. D., & Spache, E. B. Reading_ in the elementary school, Boston:Allyn and Bacon, Inc., 1964.
Stern, C., & Lombard, A. An instrument to measure visual discriminationin young children. 'Perceptual and Motor Skills, 1968, 26, 1207-1210.
Terman, L. M., &,Merrill, M. A. Stanford-Binet Intelligence Scale, Manualfor the Third Revision Form L-M.' Boston: Houghton Mifflin Company,1960.
Tinker, M. Visual apprehension and perception in reading. Psycholo gical
Bulletin, 1929, 26, 223-240.
Vernon,-M. D. The perceptual process in reading. Reading Teacher, 1:69,13, 2-8.
78
Vernon, M. D. Perception through experience. New York: Barnes & Noble,1970.
Ward, J. The factor structure of the Frostig Developmental Test of. VisualPerception. British Journal of Educational Psychology, 1970, 40,
65-67.
Wechsler, D. Wechsler Intelligence Scale for Children. New York: ThePsychological Corporation, 1949.
Wechsler, D., & Hagin, R. L. The problem of axial rotation in readingdisability. Perceptual and Motor Skills, 1964, 19, 319-326.
Weiner, P. S. A. revision of the Chicago Test of Visual Discrimination.Elementary School Journal, 1968, 68, 373-380.
Wheelock, W. H. An investigation of visual discrimination training forbeginning readers. In H. K. Smith (Ed.), Perception and reading.Proceedings of the international Reading Association, 1968, 12(4).
Williams, J. P. Effects of discrimination and reproduction training onability to discriminate letter-like forms. Paper presented at theannual meeting of the American Educational Research Association,1968.
Williams, P. Date of birth, backwardness and educational organization.British Journal of Educational Psycholoa, 1964, 34, 247 255.
Winter Haven Lions Research Foundation. Perceptual Forms Test. Winter.
Haven. Florida, 1960.
Wood, P. A, Viuual Memory Test. Unpublished, 1971.

APPENDIX
Instructions for the Visual Memory Test
'Demonstration
79
Present stimulus card A with response card A face down underneathit. Display for 5 seconds, saying TAKE A GOOD LOOK AT THIS DESIGN SOYOU CAN REMEMBER EXACTLY WHAT IT LOOKS LIKE. At the end of the 5 secondsturn the two cards over together so only the response card is exposed,FIND ONE LIKE IT HERE. After the child has indicated a choice, pull outthe stimulus card, and reexpose so the child can check his response.If a correct choice, YES, THAT ONE IS THE SAME pointing to stimulus andchoice. If not correct, NOT QUITE. POINT TO THE ONE THAT IS EXACTLYTHE SAME. If able to find the correct chr,_ce, YES, THAT ONE IS THE SAME.If he still does not indicate the correct choice, put the stimulus cardnext to the correct choice and ask him if the designs are alike (if hedoes not say they are the same, have him show you how they are different).Then place stimulus card next to previous choice and ask him if theyare exactly the same (if he says yes, assist him in seeing the difference).It is important that the child realize that only one design will beexactly the same as the stimulus.
Demo B is given in the same way except the fact that there are twoparts to the design is stressed both by pointing to both parrs and saying:SOME OF THE DESIGNS WILL HAVE MORE THAN ONE PART. BE SURE TO LOOK ATALL OF THE DESIGN SO YOU CAN REMEMBER I.T. Correction procedure is thesame as with-Demonstration A.
Administration
GOOD, NOW LET'S TRY SOME MORE DESIGNS. Display the stimulus cardfor 5 seconds saying, TAKE A GOOD LOOK. Turn the card over, FIND ONELIKE IT DERE. Tha verbal cues can be dropped later if the child isperforming smoothly. Reexposure of the stimulus is not permitted.If the child gc_s restless and does not use the whole 5 seconds evenwhen prompted, the exposure time can be shortened. Use remarks such asGOOD, YOU LOOKED AT ALL THE DESIGNS to encourage looking at all theresponse items and to discourage a position preference. Other remarksof encouragement such as YOU ARE DOING A NICE JOB can be used if needed.Tracing of the design should be gently discouraged as it does not permitlooking at all of the more complex designs with the 5 seconds.
Instructions for. Visual III of the Monroe Reading Aptitude Tests
"WE ARE GOING TO DRAW SOME 'PICTURES ON THIS FIRST LINE. PUT YOURFINGER ON THE PLACE WHERE YOU ARE TO DRAW THE PICTURES. NOW, I WILLSHOW YOU THE PICTURES THAT YOU WILL DRAW. KEEP LOOKING AT THEM, BUTDO NOT DRAW THEM UNTIL I TAKE THEM AWAY." Examiner exposes the first

APPENDIX (continued) 80
card of set III for exactly 10 seconds. Remove and say "NOW, DRAW ASMANY OF THE PICTURES AS YOU DAN REMEMBER." Proceed in the same mannerfor the 2nd, 3rd, and 4th cards of set III, each time having the childindicate the appropriate llne upon which to draw the pictures and warningthem to wait until the card is removed before drawing.
If the child startstO draw while the pictures are still exposed,hold his pencil for him. If he looks elsewhere before the 10 secondsare up, it may be necessary to remind him to take a good look at all thepictures. If he appears distressed because he can remember only a fewof the pictures, encourage him by telling him that he is doing nicely andthat it doesn't matter if he can't remember every design; just draw theones he can remember.
Instructions for Administration of the Bender Gestalt Test(from Koppitz, E. M. The Bender Gestalt Test for Young Children)
Seat the child comfortably at an uncluttered table on which twosheets of paper, size 8-1/2" X 11", and a #2 pencil with an eraser havebeen placed. After rapport has been established show the stack of Bendercards to the child and say: "I HAVE NINE CARDS HERE WITH DESIGNS ON THEMFOR YOU TO COPY. HERE IS THE FIRST ONE. NOW GO AHEAD AND MAKE ONE-JUSTLIKE IT." After the child has adjusted the position of the paper tosuit himself, place the first Bender card, Figure A, at the top of theblank paper in front of the child. No comments are made while observa-tions and notes are made on the child's test behavior. There is no timelimit on this test. When a child has finished drawing a figure, the cardwith the stimulus design is removed and the next card is put in front ofhim and so on. All nine cards are presented in this fashion in orderlysequence.
If the child asks questions concerning the number of dots or the sizeof the drawings,. etc. he should be given a noncommittal answer like;"Make. it look as much like the picture on the card as you can." He shouldbe neither encouraged nor discouraged from erasing or making severalattempts at drawing a design. It has been found practical to discouragethe counting of dots on Figure 5 since this requires much time and addslittle new information. The children who count dots on Figure 5 alsotend to count dots and circles of Figures 1, 2, and 3. When a child beginsto count dots on Figure 5 the examiner may say: "You do not have to countthose dots, just make it look like the picture." If the child still per-sists in counting the dots, it then takes on diagnostic significance.The indications are that the child is most likely quite perfectiouisticor compulsive. If the child has filled most of the sheet of paper andturns it sideways to fit in Figure 8 into the remaining space, this shouldbe noted on the protocol as this Is not considered ,a rotation of design.
Each child is permitted to use as much paper (or as little) as hedesires. If he asks for more than the two sheets of paper provided, heshould be given additional paper without comment.

APPENDIX (continued)
For directions for the Southern California FigureGround VisualPerception Test see Ayres, 1966.
For directions for the Visual Sequential Memory subtest see themanual for the Illinois TeSt of Psycholinguistic Abilities by Kirk,McCarthy, and Kirk, 1968.
81
For directions for..Ahe Developmental Test of Visual Perception see
Frostig, 1961.

V
APPENDIX (continued) 82

L
APPENDIX (contiroled) 83
DOX11 O
EIO
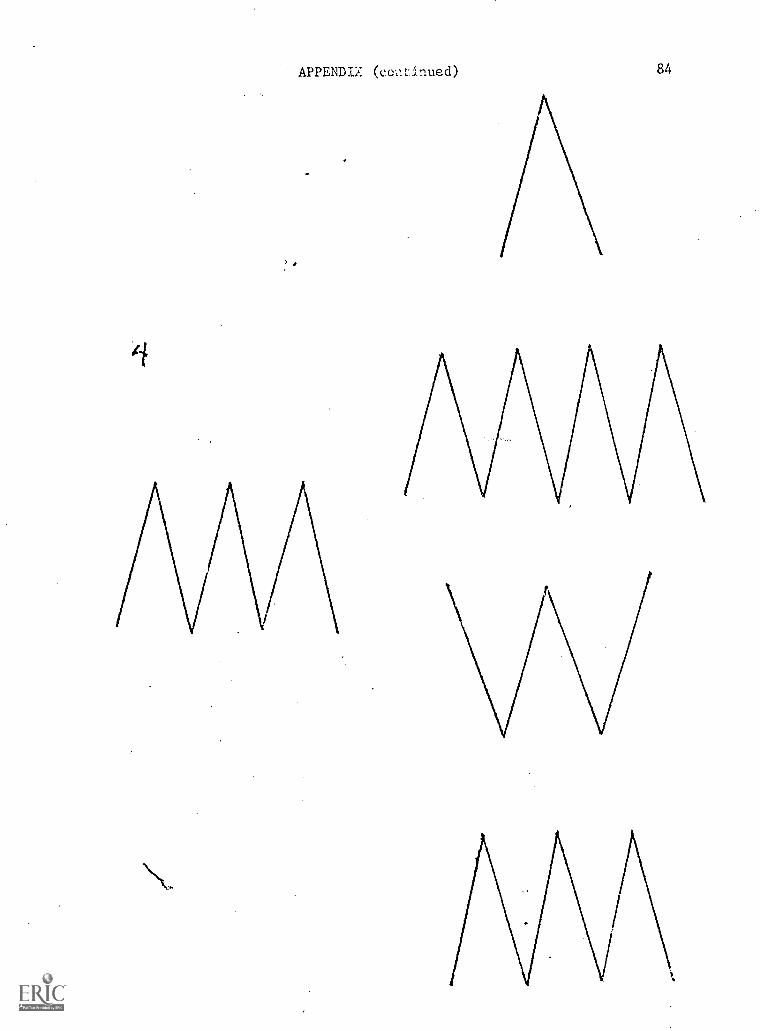
APPENDIX (c.o.,!t inued) 84

APPENDIX (continued) 85
.9

APPENDIX (continued) 86
0.perear .=1.02
1.11...wore. ono.

.2 7
APPENDI (c.c.11L-inued) 87
AL
Top Related