


Languages
Pages
Legal

www.gnshealthcare.com
Leveraging Innovation to
Improve Medication Adherence
DISCOVERING WHAT WORKS. AND FOR WHOM.
Health Innovators SeriesNovember 11, 2014
GNS Healthcare OverviewAccelerate intelligent interventions
► Maximize intervention ROI by predicting impact for each individual
► Personalized analytics solution that delivers unmatched speed to value
– Maximize the value of interventions by matching members to interventions based on patient-centered predictions
– Optimizes member communications
– Integrates easily in existing health plan business processes
– Measure and continuously improve intervention effectiveness
Today’s Topic: Meaningful Adherence™
Optimizes medication adherence interventions by matching individuals with their most effective intervention
2
3
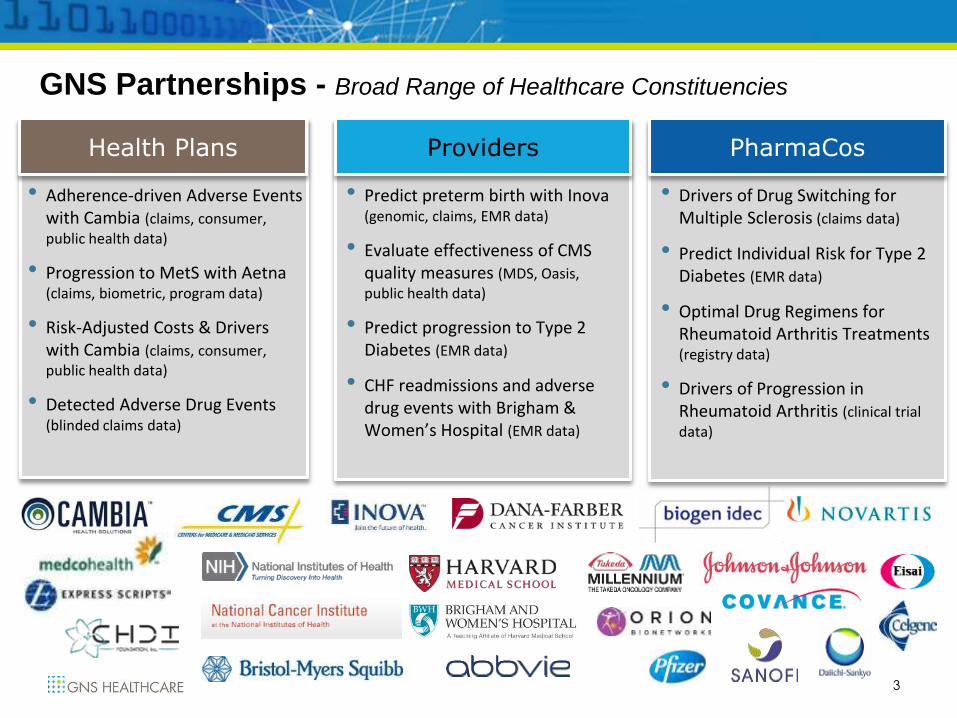
• Drivers of Drug Switching for Multiple Sclerosis (claims data)
• Predict Individual Risk for Type 2 Diabetes (EMR data)
• Optimal Drug Regimens for Rheumatoid Arthritis Treatments (registry data)
• Drivers of Progression in Rheumatoid Arthritis (clinical trial data)
• Predict preterm birth with Inova (genomic, claims, EMR data)
• Evaluate effectiveness of CMS quality measures (MDS, Oasis, public health data)
• Predict progression to Type 2 Diabetes (EMR data)
• CHF readmissions and adverse drug events with Brigham & Women’s Hospital (EMR data)
• Adherence-driven Adverse Events with Cambia (claims, consumer, public health data)
• Progression to MetS with Aetna (claims, biometric, program data)
• Risk-Adjusted Costs & Drivers with Cambia (claims, consumer, public health data)
• Detected Adverse Drug Events (blinded claims data)
PharmaCosProvidersHealth Plans
GNS Partnerships - Broad Range of Healthcare Constituencies
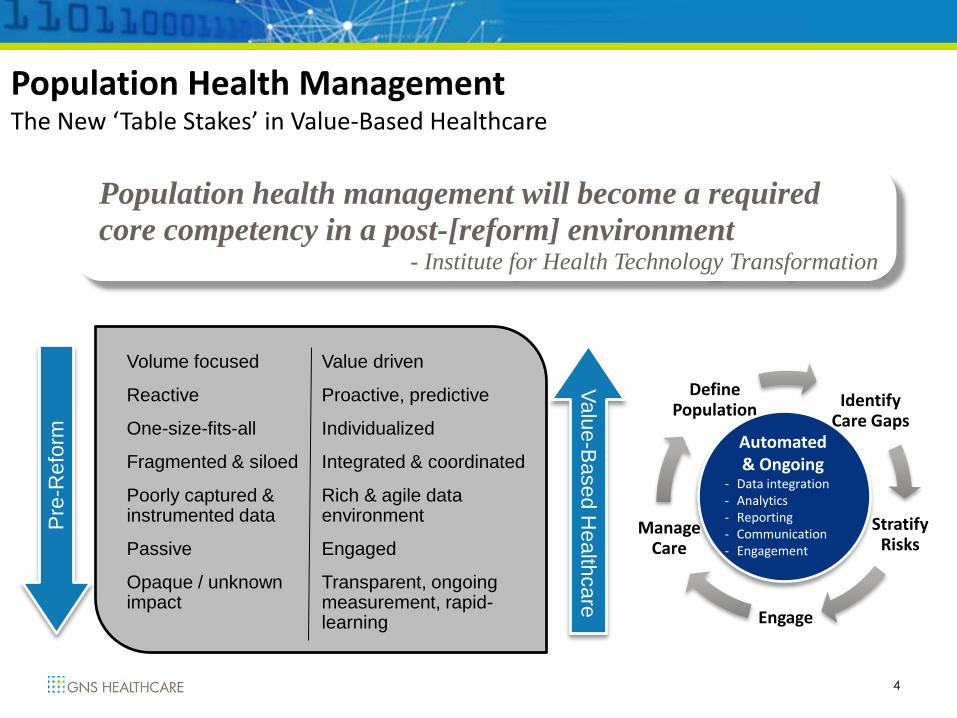
Population Health ManagementThe New ‘Table Stakes’ in Value-Based Healthcare
4
Identify Care Gaps
Stratify Risks
Engage
Manage Care
Define Population
Volume focused
Reactive
One-size-fits-all
Fragmented & siloed
Poorly captured & instrumented data
Passive
Opaque / unknown impact
Value driven
Proactive, predictive
Individualized
Integrated & coordinated
Rich & agile data environment
Engaged
Transparent, ongoing measurement, rapid-learning
Pre
-Refo
rm
Valu
e-B
ased H
ealth
care
Population health management will become a required
core competency in a post-[reform] environment- Institute for Health Technology Transformation
Automated & Ongoing
‐ Data integration‐ Analytics‐ Reporting‐ Communication‐ Engagement
5
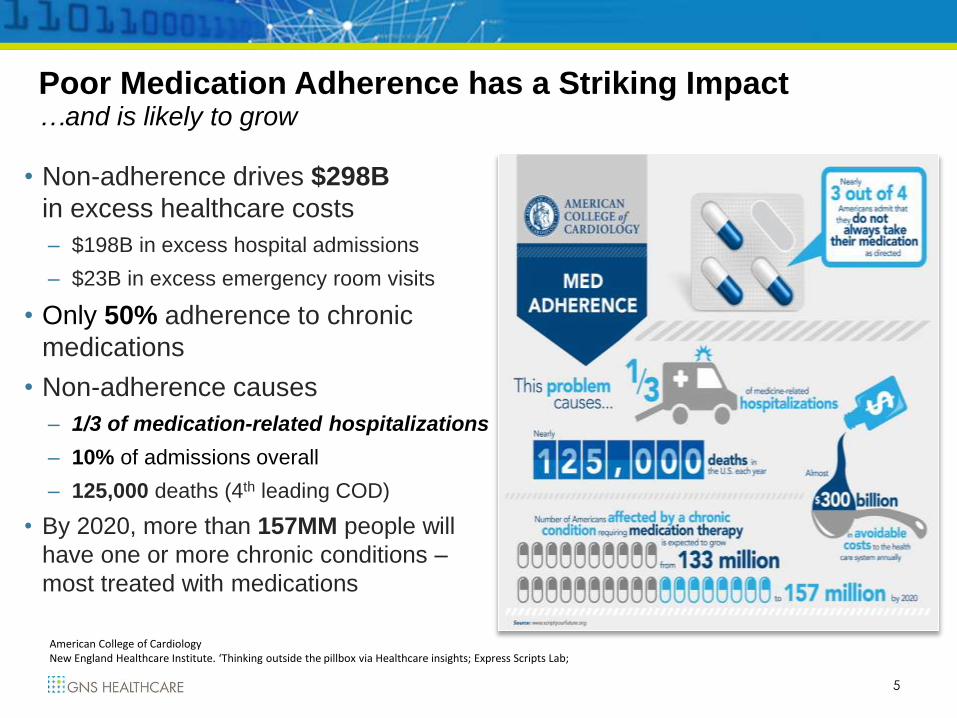
Poor Medication Adherence has a Striking Impact…and is likely to grow
• Non-adherence drives $298B
in excess healthcare costs
– $198B in excess hospital admissions
– $23B in excess emergency room visits
• Only 50% adherence to chronic
medications
• Non-adherence causes
– 1/3 of medication-related hospitalizations
– 10% of admissions overall
– 125,000 deaths (4th leading COD)
• By 2020, more than 157MM people will
have one or more chronic conditions –
most treated with medications
American College of CardiologyNew England Healthcare Institute. ‘Thinking outside the pillbox via Healthcare insights; Express Scripts Lab;
6
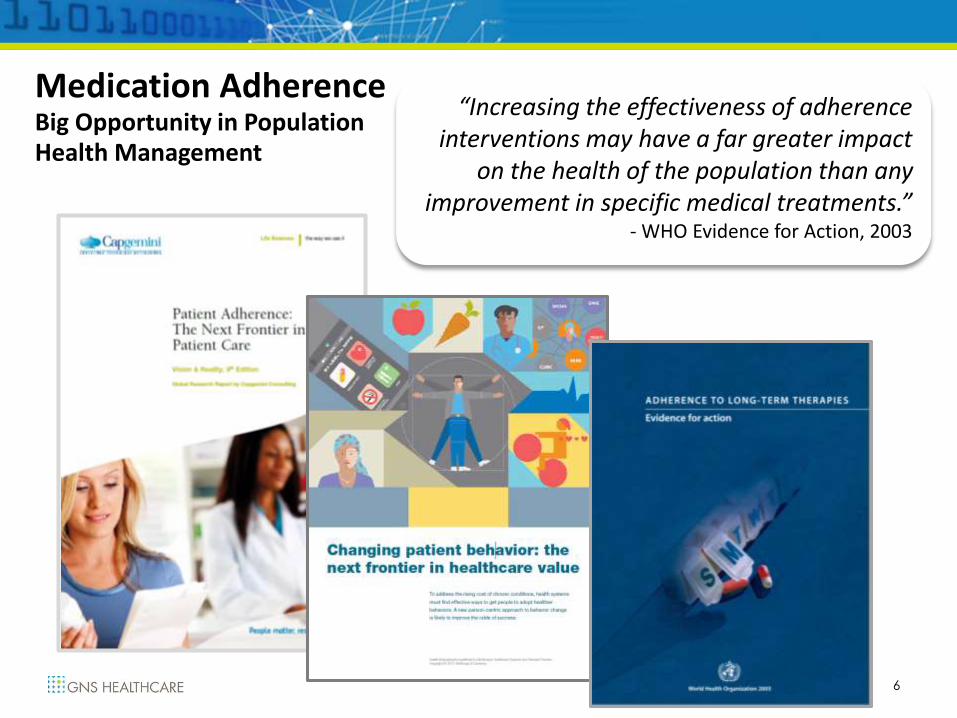
“Increasing the effectiveness of adherence interventions may have a far greater impact
on the health of the population than any improvement in specific medical treatments.”
- WHO Evidence for Action, 2003
Medication AdherenceBig Opportunity in Population Health Management
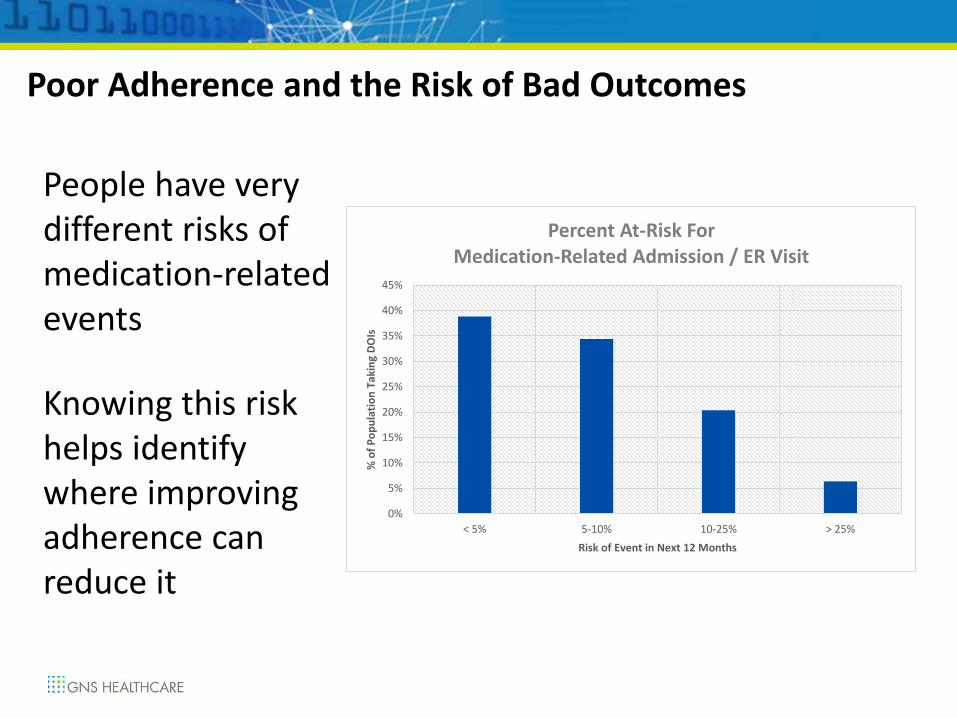
Poor Adherence and the Risk of Bad Outcomes
0%
5%
10%
15%
20%
25%
30%
35%
40%
45%
< 5% 5-10% 10-25% > 25%
% o
f P
op
ula
tio
n T
akin
g D
OIs
Risk of Event in Next 12 Months
Percent At-Risk For Medication-Related Admission / ER Visit
People have very different risks of medication-related events
Knowing this risk helps identify where improving adherence can reduce it
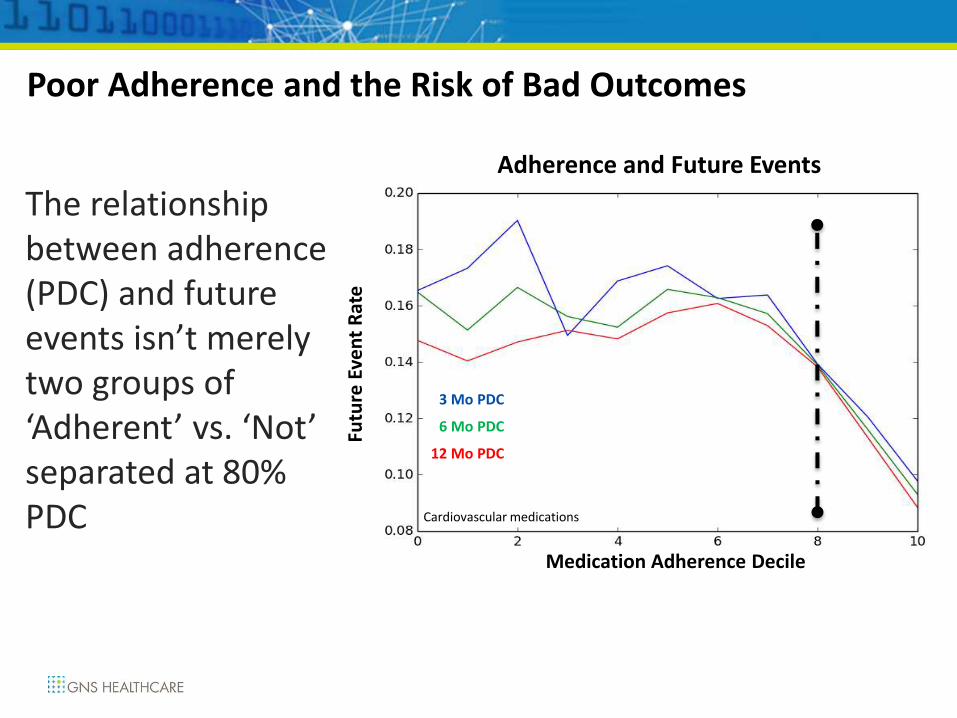
The relationship between adherence (PDC) and future events isn’t merely two groups of ‘Adherent’ vs. ‘Not’ separated at 80% PDC
Poor Adherence and the Risk of Bad Outcomes
Medication Adherence Decile
Futu
re E
ven
t R
ate
3 Mo PDC
6 Mo PDC
12 Mo PDC
Cardiovascular medications
Adherence and Future Events
9
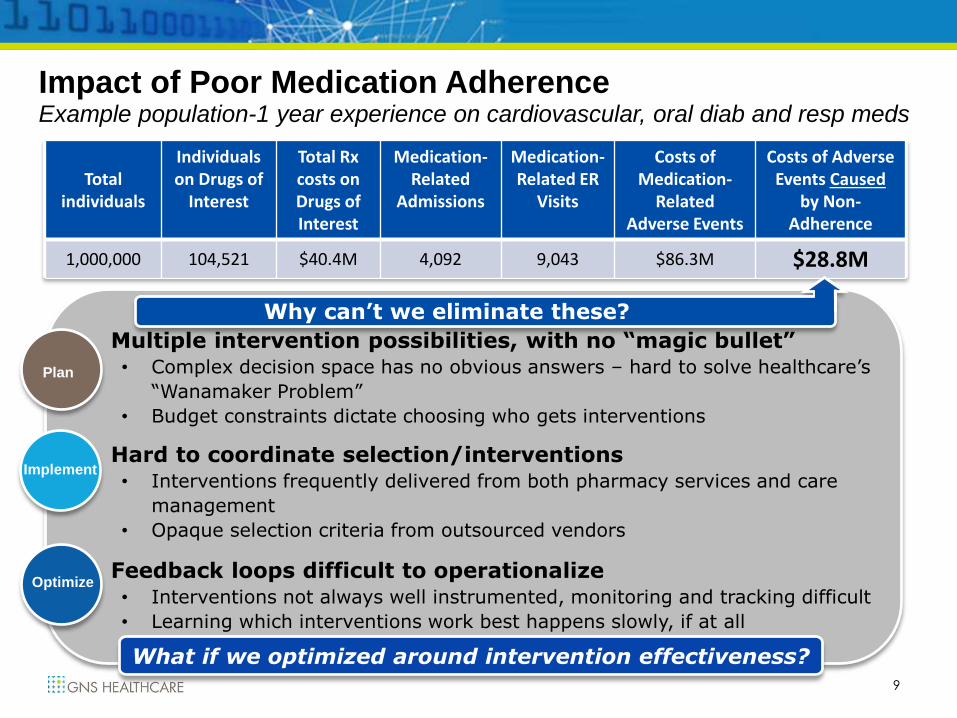
Impact of Poor Medication AdherenceExample population-1 year experience on cardiovascular, oral diab and resp meds
Total individuals
Individuals on Drugs of
Interest
Total Rx costs on Drugs of Interest
Medication-Related
Admissions
Medication-Related ER
Visits
Costs of Medication-
RelatedAdverse Events
Costs of AdverseEvents Caused
by Non-Adherence
1,000,000 104,521 $40.4M 4,092 9,043 $86.3M $28.8M
Multiple intervention possibilities, with no “magic bullet”• Complex decision space has no obvious answers – hard to solve healthcare’s
“Wanamaker Problem”
• Budget constraints dictate choosing who gets interventions
Hard to coordinate selection/interventions• Interventions frequently delivered from both pharmacy services and care
management
• Opaque selection criteria from outsourced vendors
Feedback loops difficult to operationalize• Interventions not always well instrumented, monitoring and tracking difficult
• Learning which interventions work best happens slowly, if at all
Plan
Implement
Optimize
What if we optimized around intervention effectiveness?
Why can’t we eliminate these?
10
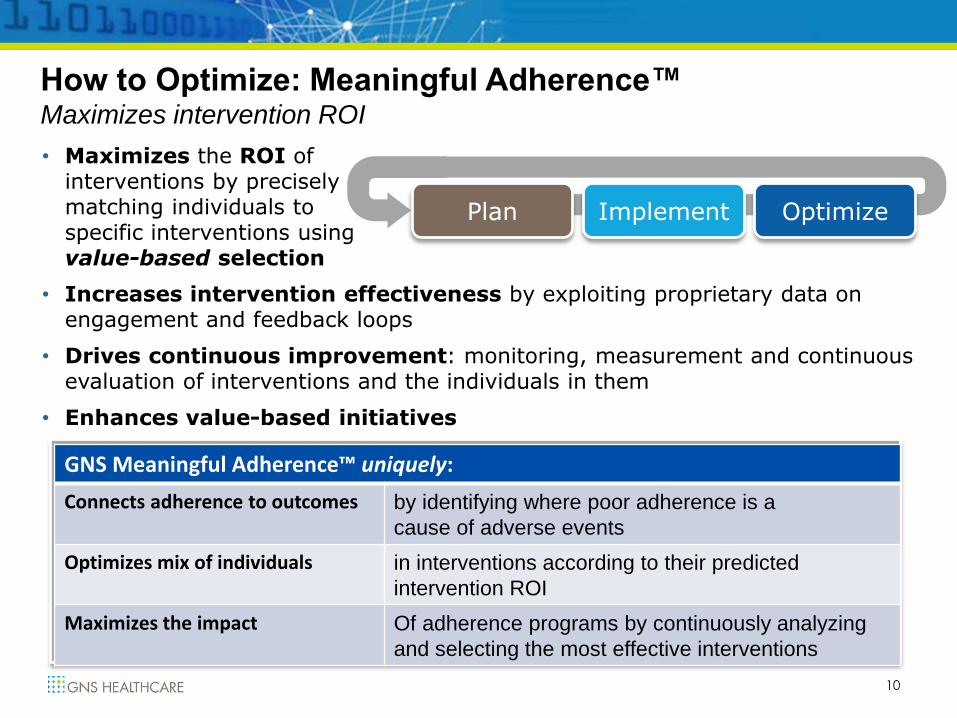
• Maximizes the ROI of interventions by precisely matching individuals to specific interventions using value-based selection
Implement
GNS Meaningful Adherence™ uniquely:
Connects adherence to outcomes by identifying where poor adherence is a
cause of adverse events
Optimizes mix of individuals in interventions according to their predicted
intervention ROI
Maximizes the impact Of adherence programs by continuously analyzing
and selecting the most effective interventions
How to Optimize: Meaningful Adherence™Maximizes intervention ROI
• Increases intervention effectiveness by exploiting proprietary data on engagement and feedback loops
• Drives continuous improvement: monitoring, measurement and continuous evaluation of interventions and the individuals in them
• Enhances value-based initiatives
Plan OptimizeImplement
0
10,000
20,000
30,000
40,000
50,000
60,000
70,000
80,000
0-10% 10-20% 20-30% 30-40% 40-50% 50-60% 60-70% 70-80% 80-90% 90-100%
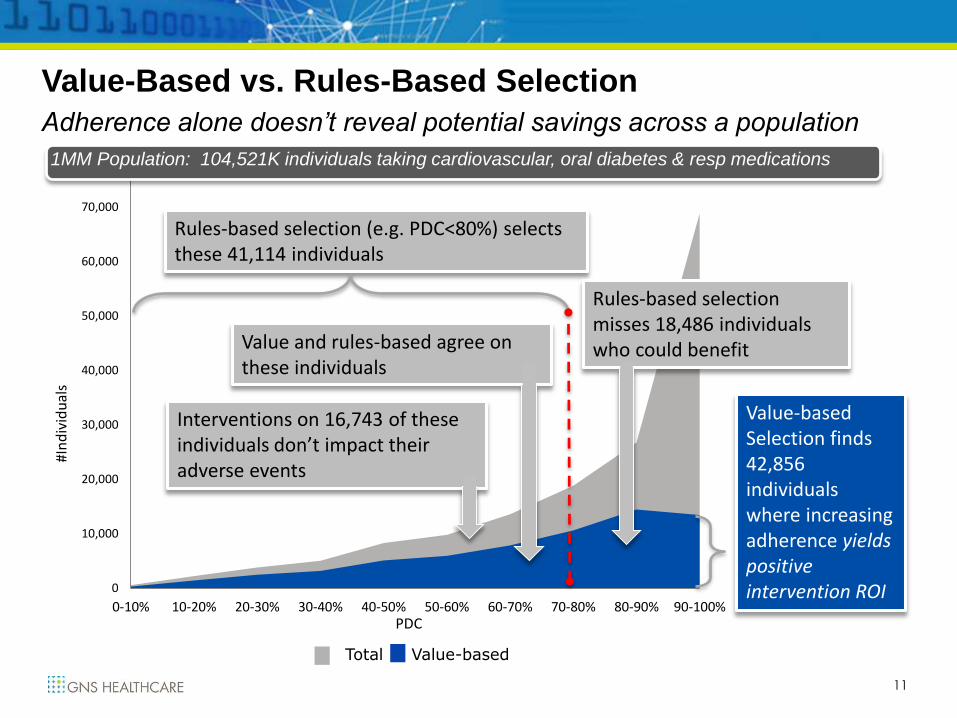
Rules-based selection (e.g. PDC<80%) selects these 41,114 individuals
Interventions on 16,743 of these individuals don’t impact their adverse events
Value-based Selection finds42,856 individuals where increasing adherence yields positive intervention ROI
11
Value-Based vs. Rules-Based Selection
Adherence alone doesn’t reveal potential savings across a population
1MM Population: 104,521K individuals taking cardiovascular, oral diabetes & resp medications
#In
div
idu
als
Value and rules-based agree on these individuals
Rules-based selection misses 18,486 individuals who could benefit
PDC
Total Value-based
0
10,000
20,000
30,000
40,000
50,000
60,000
70,000
80,000
0-10% 10-20% 20-30% 30-40% 40-50% 50-60% 60-70% 70-80% 80-90% 90-100%
12
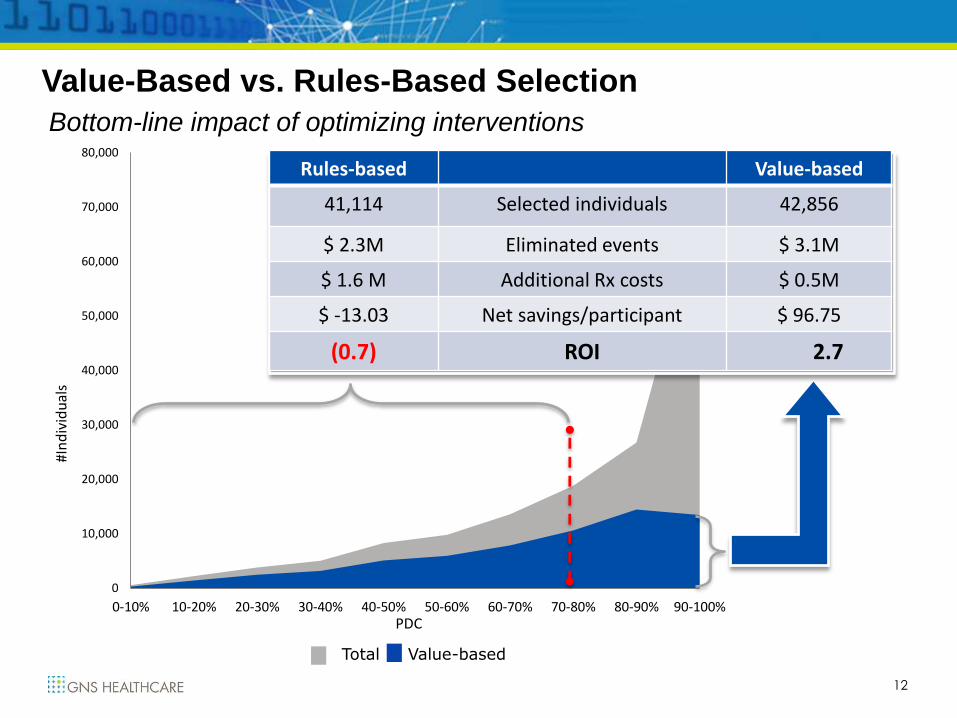
Value-Based vs. Rules-Based Selection
Bottom-line impact of optimizing interventions
#In
div
idu
als
PDC
Total Value-based
Rules-based Value-based
41,114 Selected individuals 42,856
$ 2.3M Eliminated events $ 3.1M
$ 1.6 M Additional Rx costs $ 0.5M
$ -13.03 Net savings/participant $ 96.75
(0.7) ROI 2.7
13
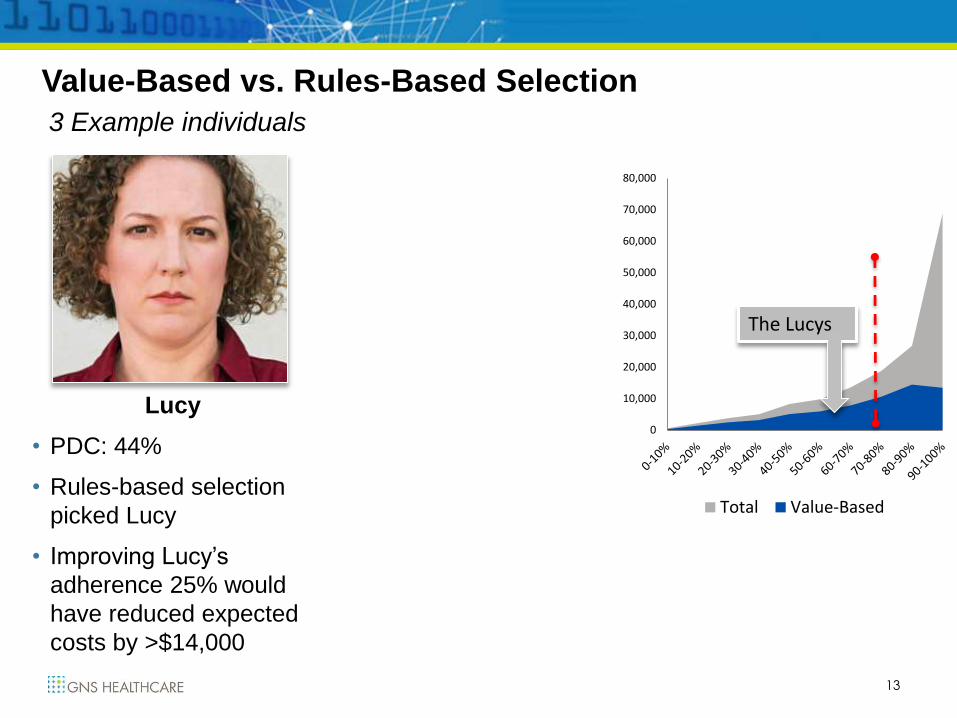
Lucy
• PDC: 44%
• Rules-based selection
picked Lucy
• Improving Lucy’s
adherence 25% would
have reduced expected
costs by >$14,000
Value-Based vs. Rules-Based Selection
3 Example individuals
0
10,000
20,000
30,000
40,000
50,000
60,000
70,000
80,000
Total Value-Based
The Lucys
14
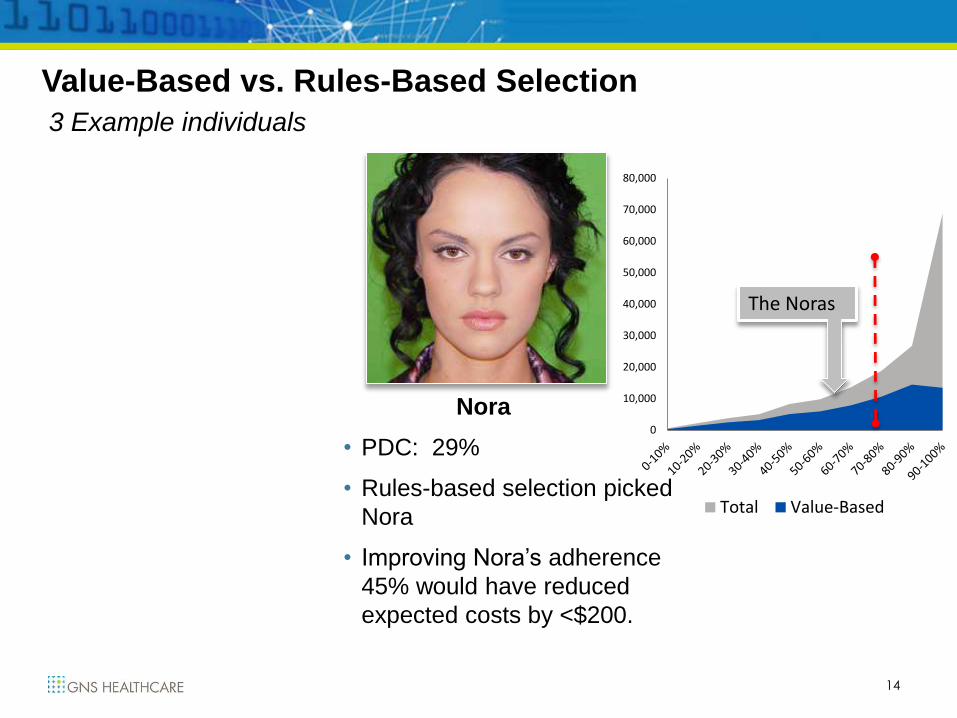
Nora
• PDC: 29%
• Rules-based selection picked
Nora
• Improving Nora’s adherence
45% would have reduced
expected costs by <$200.
Value-Based vs. Rules-Based Selection
3 Example individuals
0
10,000
20,000
30,000
40,000
50,000
60,000
70,000
80,000
Total Value-Based
The Noras
15
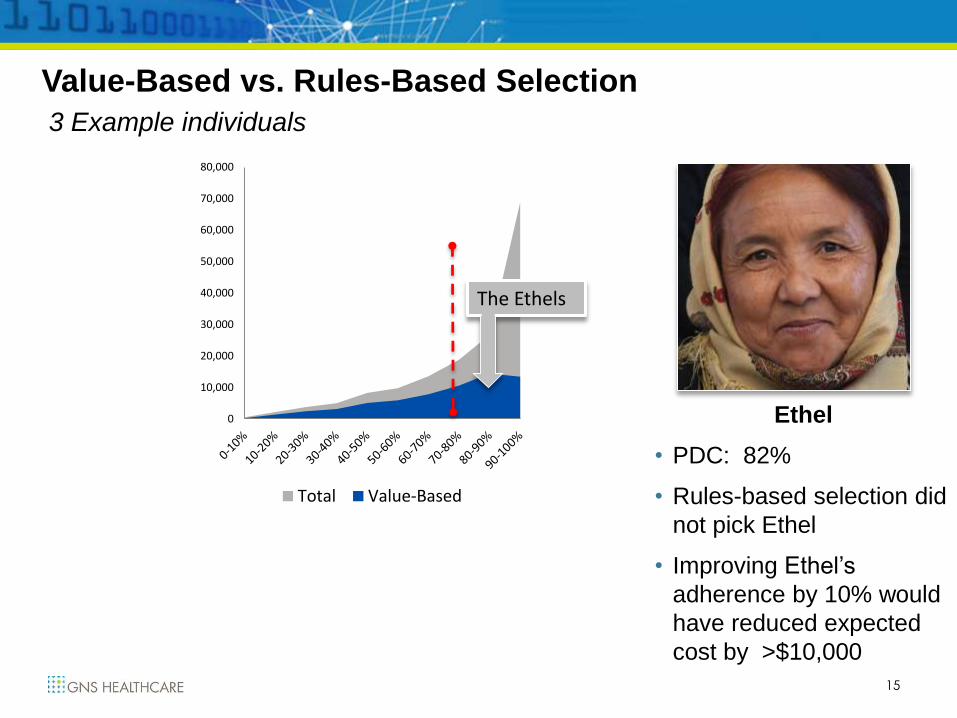
Ethel
• PDC: 82%
• Rules-based selection did
not pick Ethel
• Improving Ethel’s
adherence by 10% would
have reduced expected
cost by >$10,000
Value-Based vs. Rules-Based Selection
3 Example individuals
0
10,000
20,000
30,000
40,000
50,000
60,000
70,000
80,000
Total Value-Based
The Ethels
16
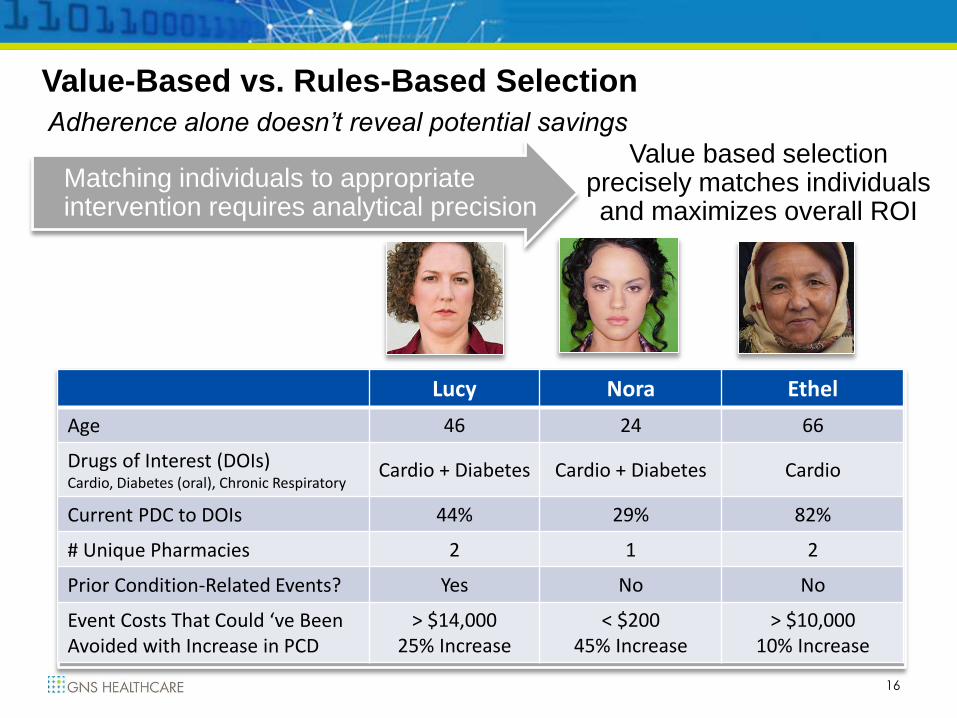
Matching individuals to appropriate intervention requires analytical precision
Value-Based vs. Rules-Based Selection
Adherence alone doesn’t reveal potential savings
Value based selection precisely matches individuals and maximizes overall ROI
Lucy Nora Ethel
Age 46 24 66
Drugs of Interest (DOIs)Cardio, Diabetes (oral), Chronic Respiratory
Cardio + Diabetes Cardio + Diabetes Cardio
Current PDC to DOIs 44% 29% 82%
# Unique Pharmacies 2 1 2
Prior Condition-Related Events? Yes No No
Event Costs That Could ‘ve Been Avoided with Increase in PCD
> $14,00025% Increase
< $20045% Increase
> $10,00010% Increase
17
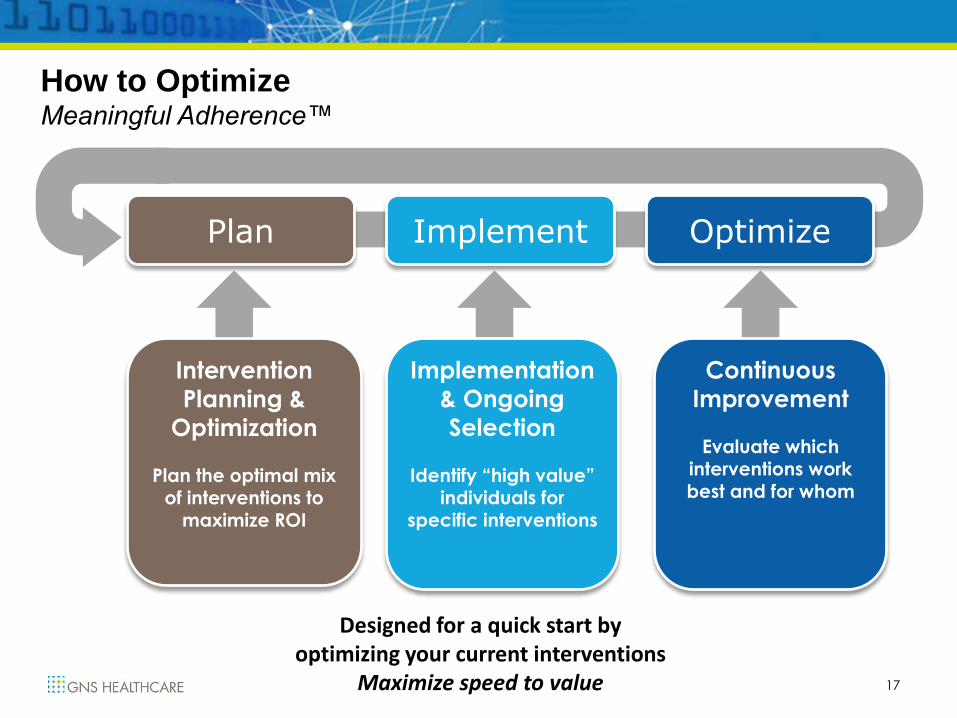
Designed for a quick start by optimizing your current interventions
Maximize speed to value
How to OptimizeMeaningful Adherence™
Plan OptimizeImplement
Intervention
Planning &
Optimization
Plan the optimal mix of interventions to
maximize ROI
Implementation
& Ongoing
Selection
Identify “high value” individuals for
specific interventions
Continuous
Improvement
Evaluate which interventions work best and for whom
18
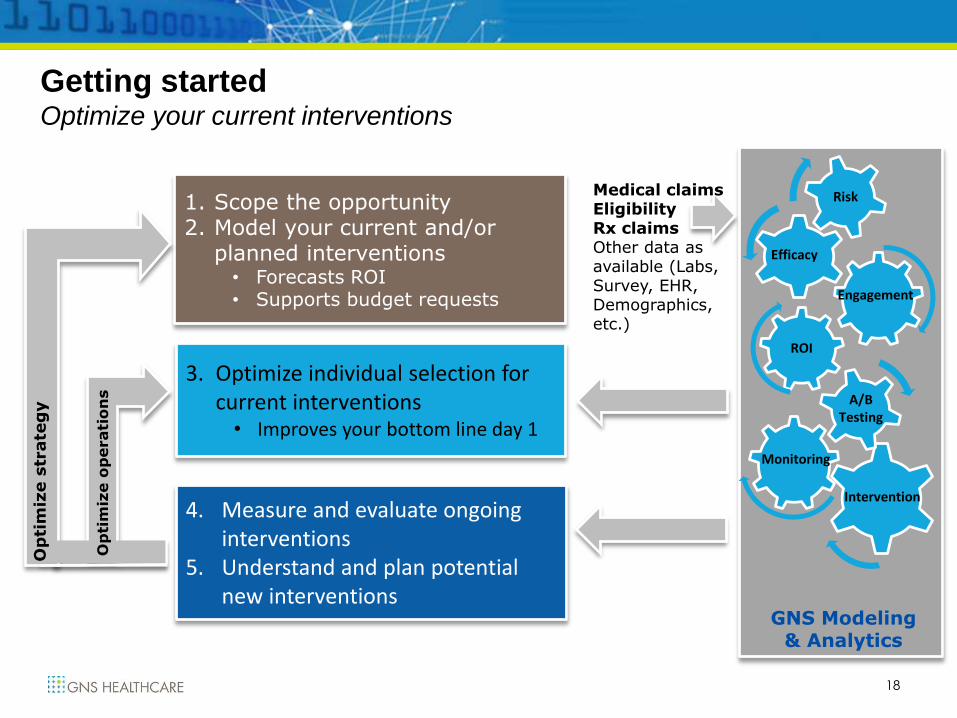
Risk
GNS Modeling & Analytics
Medical claimsEligibilityRx claimsOther data as available (Labs, Survey, EHR, Demographics, etc.)
Engagement
Efficacy
ROI
1. Scope the opportunity2. Model your current and/or
planned interventions• Forecasts ROI• Supports budget requests
3. Optimize individual selection for current interventions
• Improves your bottom line day 1
4. Measure and evaluate ongoing interventions
5. Understand and plan potential new interventions
Monitoring
A/BTesting
Intervention
Getting startedOptimize your current interventions
Op
tim
ize o
perati
on
s
Op
tim
ize s
trate
gy
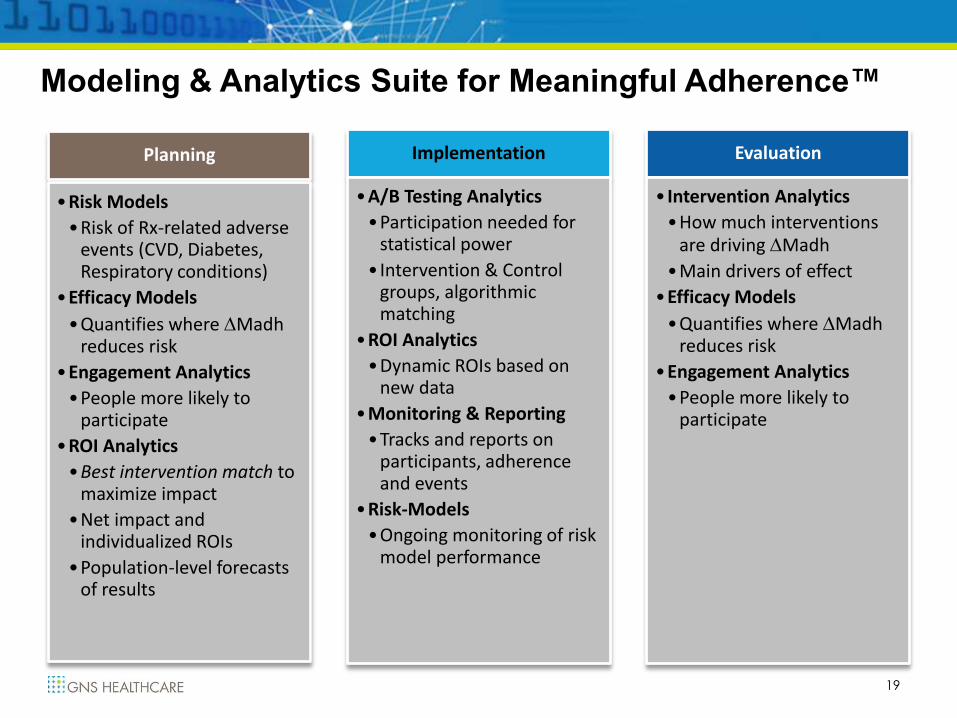
Planning
•Risk Models
•Risk of Rx-related adverse events (CVD, Diabetes, Respiratory conditions)
•Efficacy Models
•Quantifies where Madh reduces risk
•Engagement Analytics
•People more likely to participate
•ROI Analytics
•Best intervention match to maximize impact
•Net impact and individualized ROIs
•Population-level forecasts of results
Implementation
•A/B Testing Analytics
•Participation needed for statistical power
• Intervention & Control groups, algorithmic matching
•ROI Analytics
•Dynamic ROIs based on new data
•Monitoring & Reporting
•Tracks and reports on participants, adherence and events
•Risk-Models
•Ongoing monitoring of risk model performance
Evaluation
• Intervention Analytics
•How much interventions are driving Madh
•Main drivers of effect
•Efficacy Models
•Quantifies where Madh reduces risk
•Engagement Analytics
•People more likely to participate
19
Modeling & Analytics Suite for Meaningful Adherence™
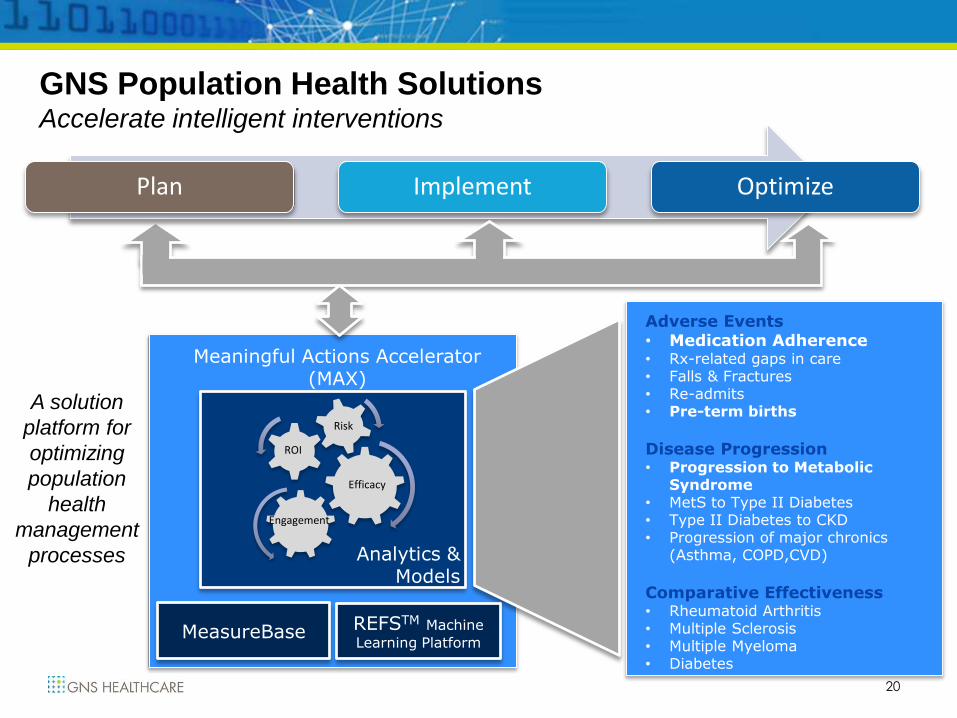
Meaningful Actions Accelerator (MAX)
Analytics &Models
Risk
MeasureBase
Plan Implement Optimize
Engagement
Efficacy
Adverse Events• Medication Adherence• Rx-related gaps in care• Falls & Fractures• Re-admits• Pre-term births
Disease Progression • Progression to Metabolic
Syndrome• MetS to Type II Diabetes• Type II Diabetes to CKD• Progression of major chronics
(Asthma, COPD,CVD)
Comparative Effectiveness • Rheumatoid Arthritis• Multiple Sclerosis• Multiple Myeloma• Diabetes
20
A solution
platform for
optimizing
population
health
management
processes
ROI
GNS Population Health SolutionsAccelerate intelligent interventions
REFSTM Machine
Learning Platform
“With the arrival of the data-intensive computing paradigm, [we have] reach a Janus moment, where we are both looking forward and backward.”
– Clifford Lynch
We Have Reached a Janus Moment
Data-Intensive Discovery
But, it Will be Worth it!
• To reward value, we must know what is valuable
• Adherence is a bright-spot of opportunity ‐ Build Population Health Mgt competencies
‐ Forge new partnerships and re-imagine business models
• Use analytics to identify & drive value– Identify and individualize opportunities
– Harness ‘test & learn’ environments whose analytics learn and re-orient to new circumstances
– Accelerate data-driven, value-based innovations
Achieving Value-Based Healthcare Won’t Be Easy…
The First Theorem of Science“It is impossible to convince anyone of any true thing that will cost him money.”
- Robert Laughlin, Different Universe
Top Related