


Languages
Pages
Legal

(c) AZOTH Analytics November 2016
Global Coronary Stents Market (Bare Metal, Drug-Eluting,
Bioresorable): Analysis By Segment, By Region, By Country
(2016-2021)
• By Segment - Bare Metal stents (BMS),
Drug-Eluting Stents (DES), Bioresorbable
Stents;
• By Region - North America, Europe, APAC,
ROW;
• By Country - USA, Canada, UK, Germany,
India, Japan, China, Brazil, UAE
• Market Entry Strategies for Global Players
• Coronary Stents - Pipeline Analysis
(c) AZOTH Analytics
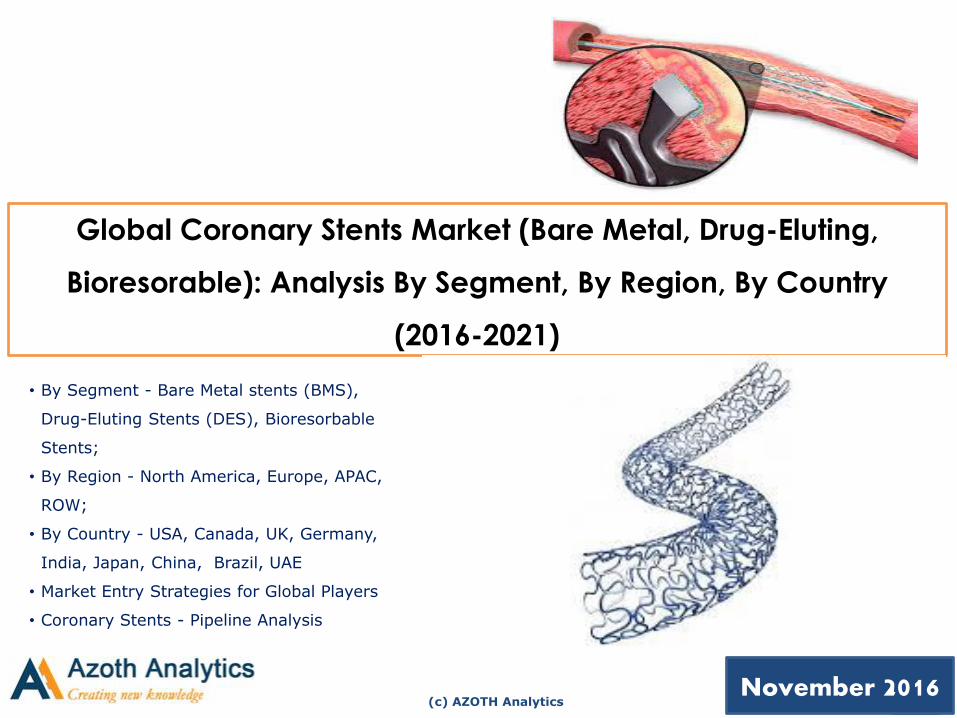
Table of Contents
2
S.No Particulars Page No.
1. Research Methodology 15
2. Executive Summary 16
3. Strategic Recommendations
3.1. Bioresorbable Stents as the Future Market 18
3.2. Focus on Lowering of ASP in Coronary Stents 19
3.3. Opportunities in APAC Region 20
4. Global Coronary Stents Market: An Overview
4.1. Product Overview 21
4.2. Global Coronary Stents Market 27
4.2.1. By Value (Historic 2011-15) 28
4.2.2. By Value ( Forecast 2016E-2021F) 28
4.3. Global Coronary Stent Market, By Segments 31
4.3.1. In Percentage (2015) 31
4.3.2. In Percentage (2021F) 31
4.4. Global Bare Metal Stents, By Value 32
4.4.1. By Value (Historic 2011-15) 32
4.4.2. By Value ( Forecast 2016E-2021F) 32
4.5. Global Drug Eluting Stents, By Value 33
(c) AZOTH Analytics
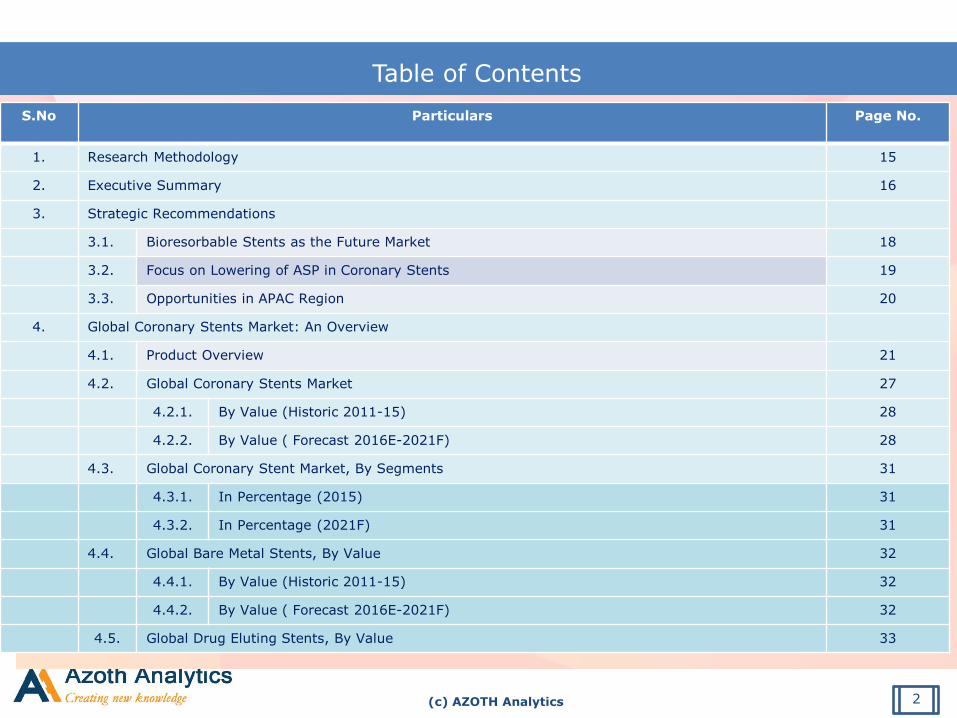
Table of Contents
3
S. No Particulars Page No.
4.5.1. By Value (Historic 2011-15) 33
4.5.2. By Value ( Forecast 2016E-2021F) 33
4.6. Global Bioresorbable Stents Market, By Segments 34
4.6.1. By Value (Historic 2011-15) 34
4.6.2. By Value ( Forecast 2016E-2021F) 34
4.7. Global Coronary Stent Market, By Region 35
4.7.1. In Percentage (2015) 35
4.7.2. In Percentage (2021F) 35
4.8. Coronary Stents : Pipeline Analysis 36
5. North America Coronary Stent Market: An Overview 44
5.1. North America Coronary Stent Market , By Value 45
5.1.1. By Value (Historic 2011-15) 45
5.1.2. By Value ( Forecast 2016E-2021F) 45
5.2. North America Bare Metal Stent Market , By Value 49
5.2.1. By Value (Historic 2011-15) 49
5.2.2. By Value ( Forecast 2016E-2021F) 49
5.3. North America Drug Eluting Stent Market , By Value 50
5.3.1. By Value (Historic 2011-15) 50
5.3.2. By Value ( Forecast 2016E-2021F) 50
5.4. North America Bioresorbable Stent Market , By Value 51
(c) AZOTH Analytics
Table of Contents
S. No Particulars Page No.
5.4.1. By Value ( 2011-2021F) 51
5.5. North America Coronary Stent Market, By Country , By Percentage 52
5.5.1. In Percentage (2015) 52
5.5.2. In Percentage (2021F) 52
5.6. North America Coronary Stent Market, By Country (USA, Canada) (2011-2021F) 53
5.5.1. USA Coronary Stents Market, By Value 54
5.5.1.1. By Value ( 2011-2021F) 54
5.5.1. Canada Coronary Stents Market, By Value 59
5.5.1.1. By Value ( 2011-2021F) 59
6. Europe Coronary Stent Market: An Overview 61
6.1. Europe Coronary Stent Market , By Value 62
6.1.1. By Value (Historic 2011-15) 62
6.1.2. By Value ( Forecast 2016E-2021F) 62
6.2. Europe Bare Metal Stent Market , By Value 65
6.2.1. By Value (Historic 2011-15) 65
6.2.2. By Value ( Forecast 2016E-2021F) 65
6.3. Europe Drug Eluting Stent Market , By Value 66
6.3.1. By Value (Historic 2011-15) 66
6.3.2. By Value ( Forecast 2016E-2021F) 66
4
(c) AZOTH Analytics
Table of Contents
S. No Particulars Page No.
6.4. Europe Bioresorbable Stent Market , By Value 67
6.4.1 By Value (Historic 2012-15) 67
6.4.2. By Value ( Forecast 2016E-2021F) 67
6.5. Europe Coronary Stent Market, By Country , By Percentage 68
6.5.1. In Percentage (2015) 68
6.5.2. In Percentage (2021F) 68
6.6. Europe Coronary Stent Market, By Country (UK, Germany(2011-2021F) 69
6.6.1. UK Coronary Stents Market, By Value 70
6.6.1.1. By Value ( 2011-2021F) 70
6.6.2. Germany Coronary Stents Market, By Value 73
6.6.2.1. By Value ( 2011-2021F) 73
7. APAC Coronary Stent Market: An Overview 76
7.1. APAC Coronary Stent Market , By Value 77
7.1.1. By Value (Historic 2011-15) 77
7.1.2. By Value ( Forecast 2016E-2021F) 77
7.2. APAC Bare Metal Stent Market , By Value 80
7.2.1. By Value (Historic 2011-15) 80
7.2.2. By Value ( Forecast 2016E-2021F) 80
7.3. APAC Drug Eluting Stent Market , By Value 81
7.3.1. By Value (Historic 2011-15) 81
5
(c) AZOTH Analytics
Table of Contents
S. No Particulars Page No.
7.3.2. By Value ( Forecast 2016E-2021F) 81
7.4. APAC Bioresorbable Stent Market , By Value 82
7.4.1. By Value ( Forecast 2011-2021F) 82
7.5. APAC Coronary Stent Market, By Country , By Percentage 83
7.5.1. In Percentage (2015) 83
7.5.2. In Percentage (2021F) 83
7.6. APAC Coronary Stent Market, By Country (China, Japan, India(2011-2021F) 84
7.6.1. China Coronary Stents Market, By Value 85
7.6.1.1. By Value ( 2011-2021F) 85
7.6.2. Japan Coronary Stents Market, By Value 88
7.6.2.1. By Value ( 2011-2021F) 88
7.6.3. India Coronary Stents Market, By Value 91
7.6.3.1. By Value ( 2011-2021F) 91
8. ROW Coronary Stent Market: An Overview 94
8.1. ROW Coronary Stent Market , By Value 95
8.1.1. By Value (Historic 2011-15) 95
8.1.2. By Value ( Forecast 2016E-2021F) 95
8.2. ROW Bare Metal Stent Market , By Value 98
8.2.1. By Value (Historic 2011-15) 98
8.2.2. By Value ( Forecast 2016E-2021F) 98
6
(c) AZOTH Analytics
Table of Contents
S. No Particulars Page No.
8.3. ROW Drug Eluting Stent Market , By Value 99
8.3.1. By Value (Historic 2011-15) 99
8.3.2. By Value ( Forecast 2016E-2021F) 99
8.4. ROW Bioresorbable Stent Market , By Value 100
8.4.1. By Value ( Forecast 2012-2021F) 100
8.5. ROW Coronary Stent Market, By Country , By Percentage 101
8.5.1. In Percentage (2015) 101
8.5.2. In Percentage (2021F) 101
8.6. ROW Coronary Stent Market, By Country (Brazil, UAE) (2011-2021F) 102
Brazil Coronary Stents Market, By Value 102
8.6.1.1. By Value ( 2011-2021F) 102
UAE Coronary Stents Market, By Value 104
8.6.2.1. By Value ( 2011-2021F) 104
9. Market Dynamics
9.1. Trends 108
9.2. Drivers 114
9.3. Challenges 118
10. Pricing Structure 120
7
(c) AZOTH Analytics
Table of Contents
S. No Particulars Page No.
11. Policy and Regulatory Land scape 123
12. M&A and Licensing Route to the Coronary Stents Market 129
13. SWOT Analysis 136
14. Porter Five Force Model 137
15. Product Benchmarking 140
16. Company Profiling 141
16.1. Terumo Corporation 142
16.2. Boston Scientific 145
16.3. Stentys SA 147
16.4. MicroPort Scientific Corporation 148
16.5. Biotronik 150
16.6. Elixir Medical Corporation 151
16.7. Biosensors Inc. 152
16.8. Medtronic 153
16.9. Abbott Laboratories 155
16.10. Kyoto Medical Planning 157
17. About Us and Disclaimer 158
8
(c) AZOTH Analytics
List of Figures
Figure No. Figure Title Page No.
Figure 1: Global Coronary Stent Market Size, By Value, 2011-2021F (USD Billion) 28
Figure 2: Number of Annual Deaths Due to Cardiovascular Diseases 29
Figure 3: Life and Non Life Insurance Penetration in Select Countries 2015 in Percentage 30
Figure 4: Global Coronary Stent Market Segment Share 2015 In Percentage 31
Figure 5: Global Coronary Stent Market Segment Share 2021 In Percentage 31
Figure 6: Global Bare Metal Stent Market, By Value , Historic(2011-2015) in USD Billion 32
Figure 7: Global Bare Metal Stent Market, By Value , Forecast(2016E-2021F) in USD Billion 32
Figure 8: Global Drug Eluting Stent Market, By Value , Historic(2011-2015) in USD Billion 33
Figure 9: Global Drug Eluting Stent Market By Value , Forecast(2016E-2021F) in USD Billion 33
Figure 10: Global Bioresorbable Stent Market, By Value , Historic(2011-2015) in USD Million 34
Figure 11: Global Bioresorbable Stent Market By Value , Forecast(2016E-2021F) in USD Million 34
Figure 12: Global Coronary Stent Market Region Share 2015 In Percentage 35
Figure 13: Global Coronary Stent Market Region Share 2021 In Percentage 35
Figure 14: North America Coronary Stent Market, By Value , Historic(2011-2015) in USD Billion 45
Figure 15: North America Coronary Stent Market By Value , Forecast(2016E-2021F) in USD Billion 45
Figure 16: Payment for Cardiology Services in USA 48
Figure 17: North America Bare Metal Stent Market, By Value , Historic(2011-2015) in USD Million 49
Figure 18: North America Bare Metal Stent Market By Value , Forecast(2016E-2021F) in USD Million 49
Figure 19: North America Drug Eluting Stent Market, By Value , Historic(2011-2015) in USD Billion 50
9
(c) AZOTH Analytics
List of Figures
Figure No. Figure Title Page No.
Figure 20: North America Drug Eluting Stent Market By Value , Forecast(2016E-2021F) in USD Billion 50
Figure 21: North America Bioresorbable Stent Market By Value , Forecast(2016E-2021F) in USD Million 51
Figure 22: North America Coronary Stent Market, By Country – 2015(%) 52
Figure 23: North America Coronary Stent Market, By Country – 2021F(%) 52
Figure 24: USA Coronary Stent Market, By Value , Historic(2011-2015) in USD Billion 54
Figure 25: USA Coronary Stent Market By Value , Forecast(2016E-2021F) in USD Billion 54
Figure 26: Percentage of Population Suffering From Cardiovascular Disease in USA (2009-2012) 56
Figure 27: Direct and Indirect Costs Associated With Major Heart Diseases in USA (USD Billion) (2009-2012) 56
Figure 28: Canada Coronary Stent Market, By Value , Historic(2011-2015) in USD Million 59
Figure 29: Canada Coronary Stent Market By Value , Forecast(2016E-2021F) in USD Million 59
Figure 30: Europe Coronary Stent Market, By Value , Historic(2011-2015) in USD Billion 62
Figure 31: Europe Coronary Stent Market By Value , Forecast(2016E-2021F) in USD Billion 62
Figure 32: Cost of CVD in 2014 in some European Countries 63
Figure 33: Europe Bare Metal Stent Market, By Value , Historic(2011-2015) in USD Million 65
Figure 34: Europe Bare Metal Stent Market, By Value , Forecast(2016E-2021F) in USD Million 65
Figure 35: Europe Drug Eluting Stent Market, By Value , Historic(2011-2015) in USD Billion 66
Figure 36: Europe Drug Eluting Stent Market By Value , Forecast(2016E-2021F) in USD Billion 66
Figure 37: Europe Bioresorbable Stent Market, By Value , Historic(2011-2015) in USD Million 67
Figure 38: Europe Bioresorbable Stent Market By Value , Forecast(2016E-2021F) in USD Million 67
Figure 39: Europe Coronary Stent Market, By Country – 2015(%) 68
Figure 40: Europe Coronary Stent Market, By Country – 2021F(%) 68
10
(c) AZOTH Analytics
List of Figures
Figure No. Figure Title Page No.
Figure 41: UK Coronary Stent Market, By Value , Historic(2011-2015) in USD Million 70
Figure 42: UK Coronary Stent Market By Value , Forecast(2016E-2021F) in USD Million 70
Figure 43: Germany Coronary Stents Market, By Value , Historic(2011-2015) in USD Million 73
Figure 44: Germany Coronary Stents Market By Value , Forecast(2016E-2021F) in USD Million 73
Figure 45: Others Coronary Stent Market, By Value , Historic(2011-2015) in USD Million 75
Figure 46: Others Coronary Stent Market By Value , Forecast(2016E-2021F) in USD Million 75
Figure 47: APAC Coronary Stent Market, By Value , Historic(2011-2015) in USD Billion 77
Figure 48: APAC Coronary Stent Market By Value , Forecast(2016E-2021F) in USD Billion 77
Figure 49: APAC Bare Metal Stent Market, By Value , Historic(2011-2015) in USD Million 80
Figure 50: APAC Bare Metal Stent Market, By Value , Forecast(2016E-2021F) in USD Million 80
Figure 51: APAC Drug Eluting Stent Market, By Value , Historic(2011-2015) in USD Million 81
Figure 52: APAC Drug Eluting Stent Market By Value , Forecast(2016E-2021F) in USD Million 81
Figure 53: APAC Bioresorbable Stent Market, By Value , Historic(2011-2015) in USD Million 82
Figure 54: APAC Bioresorbable Stent Market By Value , Forecast(2016E-2021F) in USD Million 82
Figure 55: APAC Coronary Stent Market, By Country – 2015(%) 83
Figure 56: APAC Coronary Stent Market, By Country – 2021F(%) 83
Figure 57: China Coronary Stent Market, By Value , Historic(2011-2015) in USD Million 85
Figure 58: China Coronary Stent Market By Value , Forecast(2016E-2021F) in USD Million 85
Figure 59: Japan Coronary Stent Market, By Value , Historic(2011-2015) in USD Million 88
Figure 60: Japan Coronary Market By Value , Forecast(2016E-2021F) in USD Million 88
11
(c) AZOTH Analytics
List of Figures
Figure No. Figure Title Page No.
Figure 61: India Coronary Stent Market, By Value , Historic(2011-2015) in USD Million 91
Figure 62: India Coronary Stent Market By Value , Forecast(2016E-2021F) in USD Million 91
Figure 63: ROW Coronary Stent Market, By Value , Historic(2011-2015) in USD Million 93
Figure 64: ROW Coronary Stent Market By Value , Forecast(2016E-2021F) in USD Million 93
Figure 65: ROW Coronary Stent Market, By Value , Historic(2011-2015) in USD Million 95
Figure 66: ROW Coronary Stent Market By Value , Forecast(2016E-2021F) in USD Million 95
Figure 67: ROW Bare Metal Stent Market, By Value , Historic(2011-2015) in USD Million 98
Figure 68: ROW Bare Metal Stent Market, By Value , Forecast(2016E-2021F) in USD Million 98
Figure 69: ROW Drug Eluting Stent Market, By Value , Historic(2011-2015) in USD Billion 99
Figure 70: ROW Drug Eluting Stent Market By Value , Forecast(2016E-2021F) in USD Billion 99
Figure 71: ROW Bioresorbable Stent Market, By Value , Historic(2011-2015) in USD Million 100
Figure 72: ROW Bioresorbable Stent Market By Value , Forecast(2016E-2021F) in USD Million 100
Figure 73: ROW Coronary Stent Market, By Country – 2015(%) 101
Figure 74: ROW Coronary Stent Market, By Country – 2021F(%) 101
Figure 75: Brazil Coronary Stent Market, By Value , Historic(2011-2015) in USD Million 102
Figure 76: Brazil Coronary Stent Market By Value , Forecast(2016E-2021F) in USD Million 102
Figure 77: UAE Coronary Stent Market, By Value , Historic(2011-2015) in USD Million 104
Figure 78: UAE Coronary Stent Market By Value , Forecast(2016E-2021F) in USD Million 104
Figure 79: Causes of Death in UAE 105
Figure 80: Others Coronary Stent Market, By Value , Historic(2011-2015) in USD Million 106
12
(c) AZOTH Analytics
List of Figures and Tables
Figure No. Figure Title Page No.
Figure 81: Others Coronary Stent Market By Value , Forecast(2016E-2021F) in USD Million 106
Figure 82: Average Price of Bare-metal stents 121
Figure 83: Average Price of Drug Eluting stents 122
Figure 84: Cardiac And Vascular Business, By Segment-2015 143
Figure 85: Cardiac And Vascular Business, By Geography - 2015 143
Figure 86: Revenue, By Segment-2015 (in Percentage) 146
Figure 87: Revenue, By Geography - 2015 146
Figure 88: Revenue, By Segment-2015 (in Percentage) 149
Figure 89: Revenue, By Geography - 2015 149
Figure 90: Revenue, By Segment-2015 (in Percentage) 154
Figure 91: Cardiac and Vascular Group Revenue, By Geography - 2015 154
Figure 92: Revenue, By Segment-2015 (in Percentage) 156
Figure 93: Overall Revenue, By Geography - 2015 156
13
Table No. Table Title Page No.
Table 1: Number of Physicians in Cardiology in Canada in 2016 60
Table 2: Average Price of Bare-metal stents 121
Table 3: Average Price of Drug Eluting stents 122
Table 4: Cardio and Vascular Business Revenue By Segment (in USD Billion) 144
(c) AZOTH Analytics 14
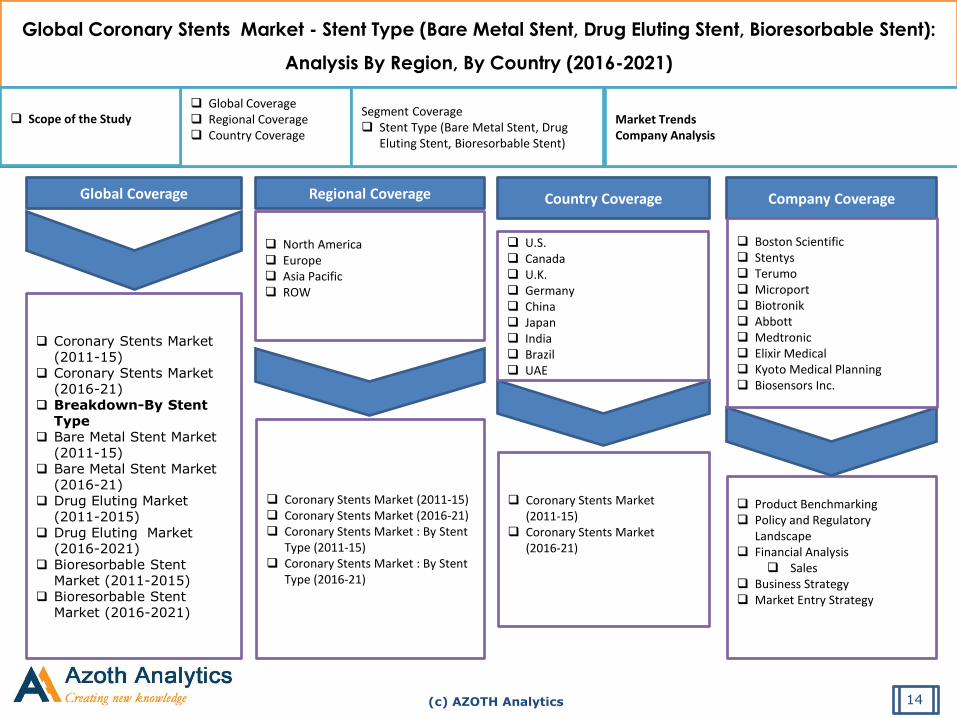
Coronary Stents Market (2011-15)
Coronary Stents Market (2016-21)
Breakdown-By Stent Type
Bare Metal Stent Market (2011-15)
Bare Metal Stent Market (2016-21)
Drug Eluting Market (2011-2015)
Drug Eluting Market (2016-2021)
Bioresorbable Stent Market (2011-2015)
Bioresorbable Stent Market (2016-2021)
Global Coverage Regional Coverage
Global Coronary Stents Market - Stent Type (Bare Metal Stent, Drug Eluting Stent, Bioresorbable Stent):
Analysis By Region, By Country (2016-2021)
Coronary Stents Market (2011-15) Coronary Stents Market (2016-21) Coronary Stents Market : By Stent
Type (2011-15) Coronary Stents Market : By Stent
Type (2016-21)
North America Europe Asia Pacific ROW
Country Coverage
Coronary Stents Market (2011-15)
Coronary Stents Market (2016-21)
U.S. Canada U.K. Germany China Japan India Brazil UAE
Company Coverage
Product Benchmarking Policy and Regulatory
Landscape Financial Analysis
Sales Business Strategy Market Entry Strategy
Boston Scientific Stentys Terumo Microport Biotronik Abbott Medtronic Elixir Medical Kyoto Medical Planning Biosensors Inc.
Global Coverage Regional Coverage Country Coverage
Scope of the Study
Segment Coverage Stent Type (Bare Metal Stent, Drug
Eluting Stent, Bioresorbable Stent)
Market Trends Company Analysis
(c) AZOTH Analytics
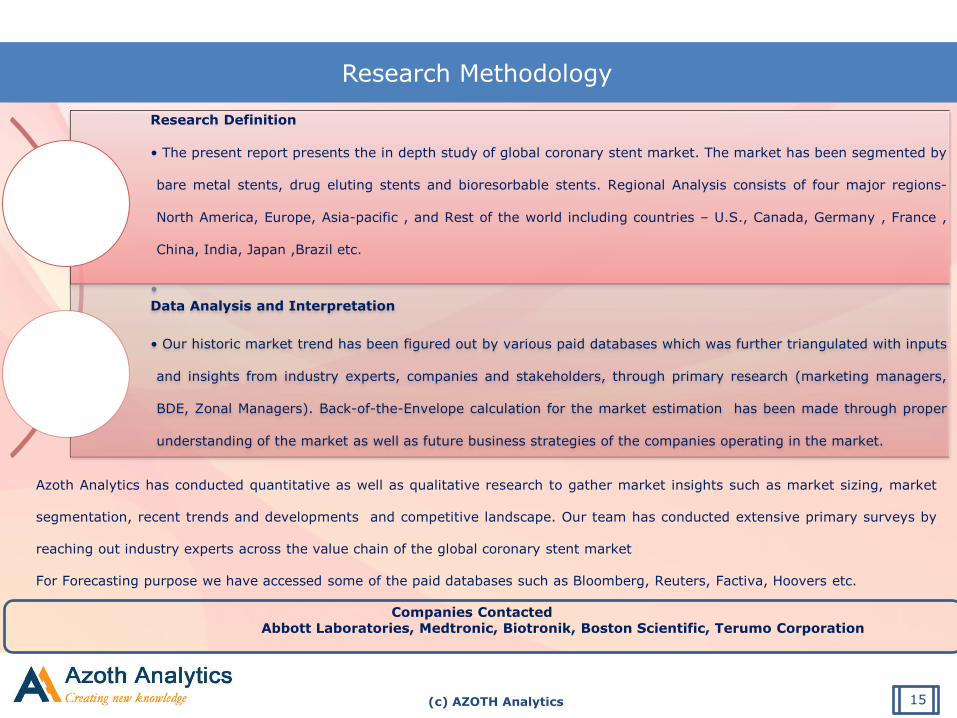
Research Methodology
Research Definition
• The present report presents the in depth study of global coronary stent market. The market has been segmented by
bare metal stents, drug eluting stents and bioresorbable stents. Regional Analysis consists of four major regions-
North America, Europe, Asia-pacific , and Rest of the world including countries – U.S., Canada, Germany , France ,
China, India, Japan ,Brazil etc.
•
Data Analysis and Interpretation
• Our historic market trend has been figured out by various paid databases which was further triangulated with inputs
and insights from industry experts, companies and stakeholders, through primary research (marketing managers,
BDE, Zonal Managers). Back-of-the-Envelope calculation for the market estimation has been made through proper
understanding of the market as well as future business strategies of the companies operating in the market.
Azoth Analytics has conducted quantitative as well as qualitative research to gather market insights such as market sizing, market
segmentation, recent trends and developments and competitive landscape. Our team has conducted extensive primary surveys by
reaching out industry experts across the value chain of the global coronary stent market
For Forecasting purpose we have accessed some of the paid databases such as Bloomberg, Reuters, Factiva, Hoovers etc.
Companies Contacted Abbott Laboratories, Medtronic, Biotronik, Boston Scientific, Terumo Corporation
15
(c) AZOTH Analytics
Global Bare Metal Stent Market , By Value
16
2011 2012 2013 2014 20152016 2017 2018 2019 2020 2021
CAGR: x% CAGR: x%
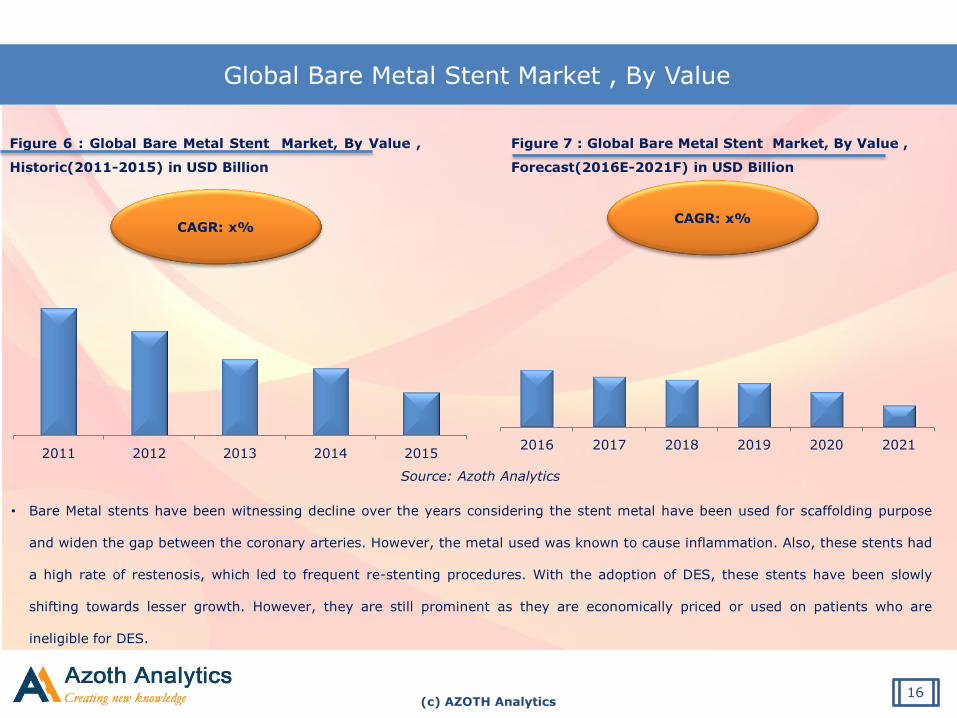
Figure 6 : Global Bare Metal Stent Market, By Value ,
Historic(2011-2015) in USD Billion
Figure 7 : Global Bare Metal Stent Market, By Value ,
Forecast(2016E-2021F) in USD Billion
• Bare Metal stents have been witnessing decline over the years considering the stent metal have been used for scaffolding purpose
and widen the gap between the coronary arteries. However, the metal used was known to cause inflammation. Also, these stents had
a high rate of restenosis, which led to frequent re-stenting procedures. With the adoption of DES, these stents have been slowly
shifting towards lesser growth. However, they are still prominent as they are economically priced or used on patients who are
ineligible for DES.
Source: Azoth Analytics
(c) AZOTH Analytics
Global Drug Eluting Stent Market , By Value
17
2011 2012 2013 2014 2015 2016 2017 2018 2019 2020 2021
CAGR: x% CAGR: x%
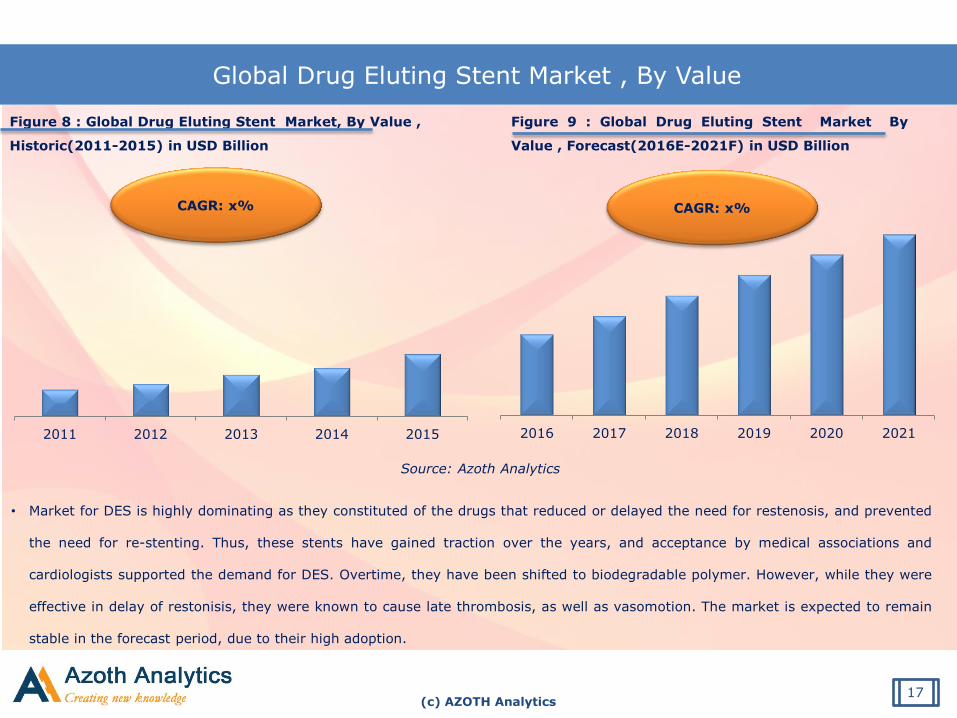
Figure 8 : Global Drug Eluting Stent Market, By Value ,
Historic(2011-2015) in USD Billion
Figure 9 : Global Drug Eluting Stent Market By
Value , Forecast(2016E-2021F) in USD Billion
• Market for DES is highly dominating as they constituted of the drugs that reduced or delayed the need for restenosis, and prevented
the need for re-stenting. Thus, these stents have gained traction over the years, and acceptance by medical associations and
cardiologists supported the demand for DES. Overtime, they have been shifted to biodegradable polymer. However, while they were
effective in delay of restonisis, they were known to cause late thrombosis, as well as vasomotion. The market is expected to remain
stable in the forecast period, due to their high adoption.
Source: Azoth Analytics
(c) AZOTH Analytics
Global Bioresorbable Stent Market , By Value
18
2012 2013 2014 2015 2016 2017 2018 2019 2020 2021
CAGR: x% CAGR: x%
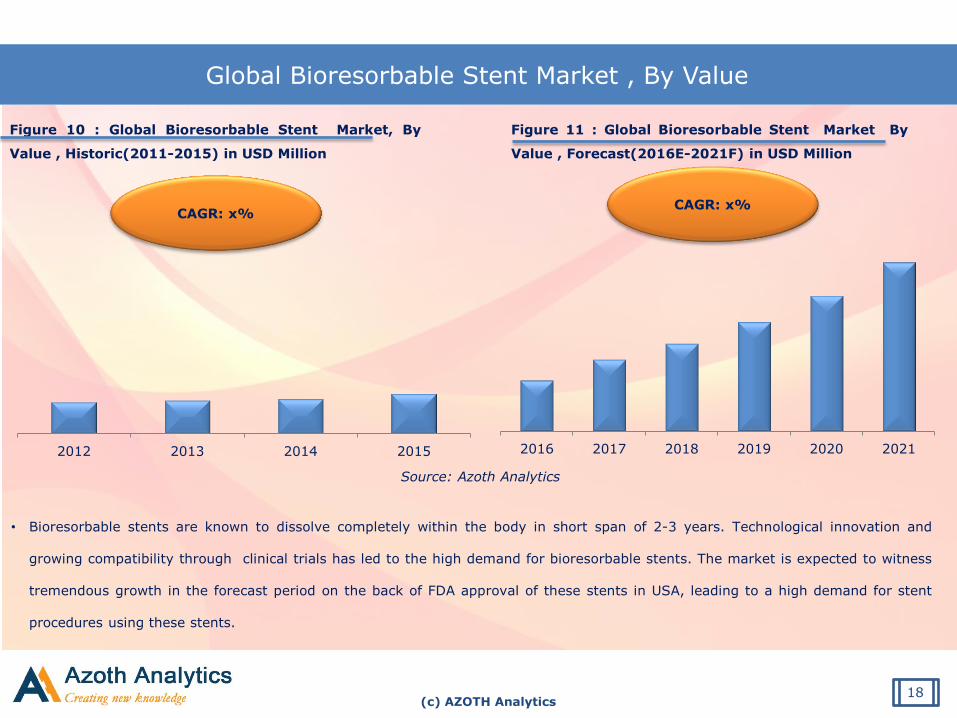
Figure 10 : Global Bioresorbable Stent Market, By
Value , Historic(2011-2015) in USD Million
Figure 11 : Global Bioresorbable Stent Market By
Value , Forecast(2016E-2021F) in USD Million
• Bioresorbable stents are known to dissolve completely within the body in short span of 2-3 years. Technological innovation and
growing compatibility through clinical trials has led to the high demand for bioresorbable stents. The market is expected to witness
tremendous growth in the forecast period on the back of FDA approval of these stents in USA, leading to a high demand for stent
procedures using these stents.
Source: Azoth Analytics
(c) AZOTH Analytics
About Azoth Analytics Pvt Ltd.
Azoth Analytics creates in-depth research reports by recording, interpreting and analyzing information through primary and secondary
research. Our strategic market sizing and data dredging techniques include secondary research, interviews with key market players and
industry experts and use of industry specific statistical tools which helps in designing and planning effective research for our global and
local clients. We provide customized market research reports revealing the hidden truths on different verticals like pharmaceutical, oil and
gas, retail, telecommunications, real estate, logistics, energy, healthcare, technology, FMCG, food & beverages and media sectors .
Related Reports:
Disclaimer: Azoth Analytics report information is based mainly on interviews and therefore, is subject to fluctuation. Azoth Analytics
therefore, takes no responsibility for any incorrect information supplied to us by industry experts, manufacturers or users. Azoth does
not warranty the completeness of the information and data. Also, analysis provided in the report are meant for customers’ internal use
only and not for general publication or disclosure to third parties.
19
Top Related