


Languages
Pages
Legal


Geomorphic Flux From Himalayan Flashflood Equates to >1000 yrs
Average Erosion Rate
1Sinclair, H. D., 1Mudd, S., 1,2Hobley, D., 1Naylor, M., 1Dallas. K.,,1Le Divellec, T., 1Grieve, S.,
1The University of Edinburgh, Edinburgh, UK.
2University of Colorado, Boulder, US

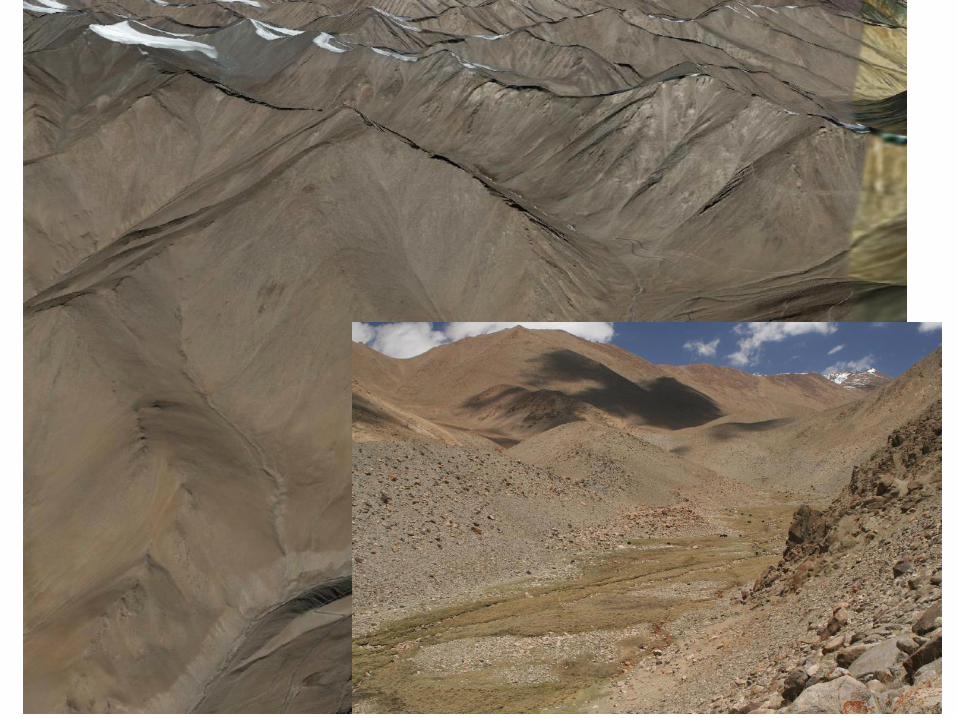
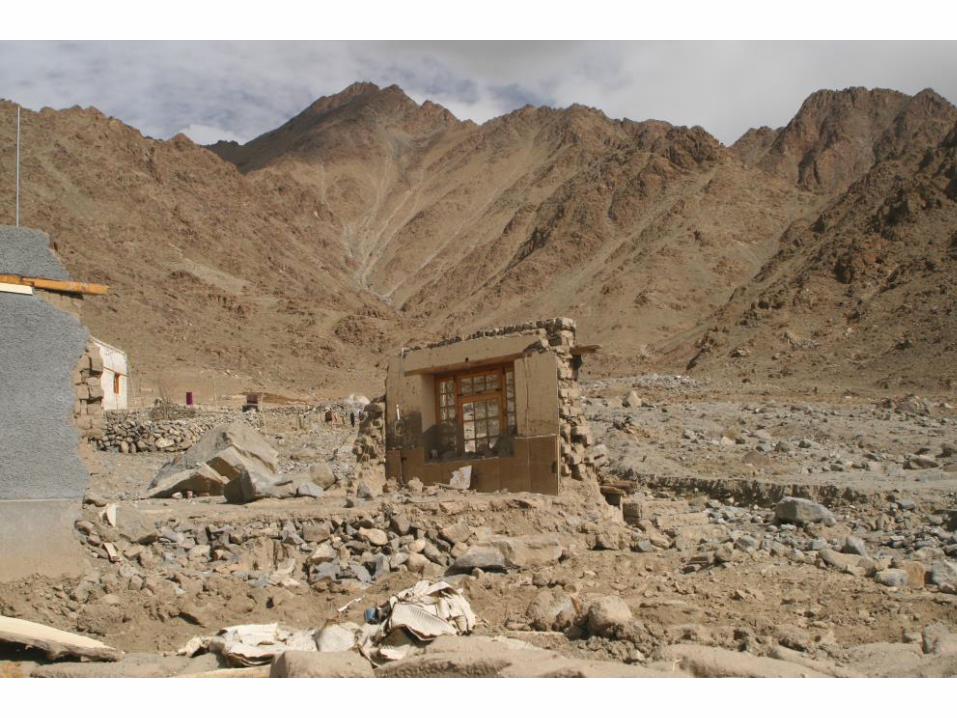
Extreme Monsoon Events Leh, Ladakh, 2010
Kedarnath, Uttarakhand, 2013
How can we use geomorphic data to understand the distribution and relative magnitude of these events?
Bookhagen and Burbank, 2006, Geophys. Res Letts.


On Aug 6th 2010 a ‘cloudburst’ devastated the region – single rain gauge missed main impact

Rasmussen and Houze (2012)
Event reconstructed using TRMM and modelled as a Mesoscale Convective System

Wolff and Fisher, 2008, Am. Met. Soc.
Melbourne, Florida
So true scale of storm events and hence their relative magnitude difficult to assess from meteorology data
20km

Hobley et al., 2012, Geology


Hobley et al., 2012, Geology

100 km
Leh
50km
But how significant was this event?
Geomorphic data relocates highest impact storm to northeast of Indus River

n = 281
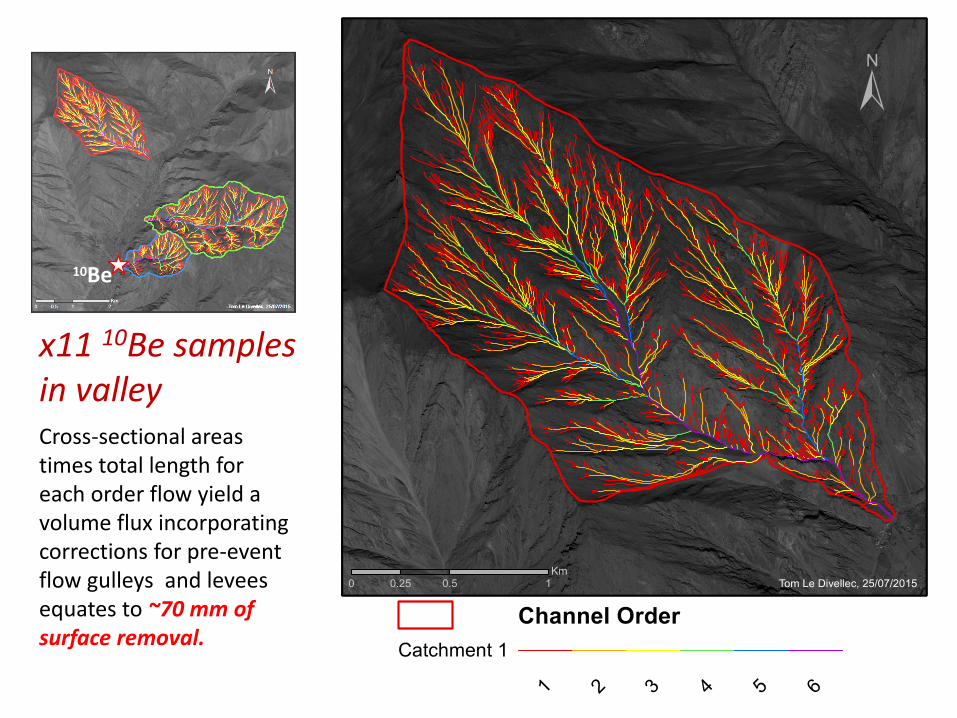
x11 10Be samples in valley
10Be
Cross-sectional areas times total length for each order flow yield a volume flux incorporating corrections for pre-event flow gulleys and levees equates to ~70 mm of surface removal.
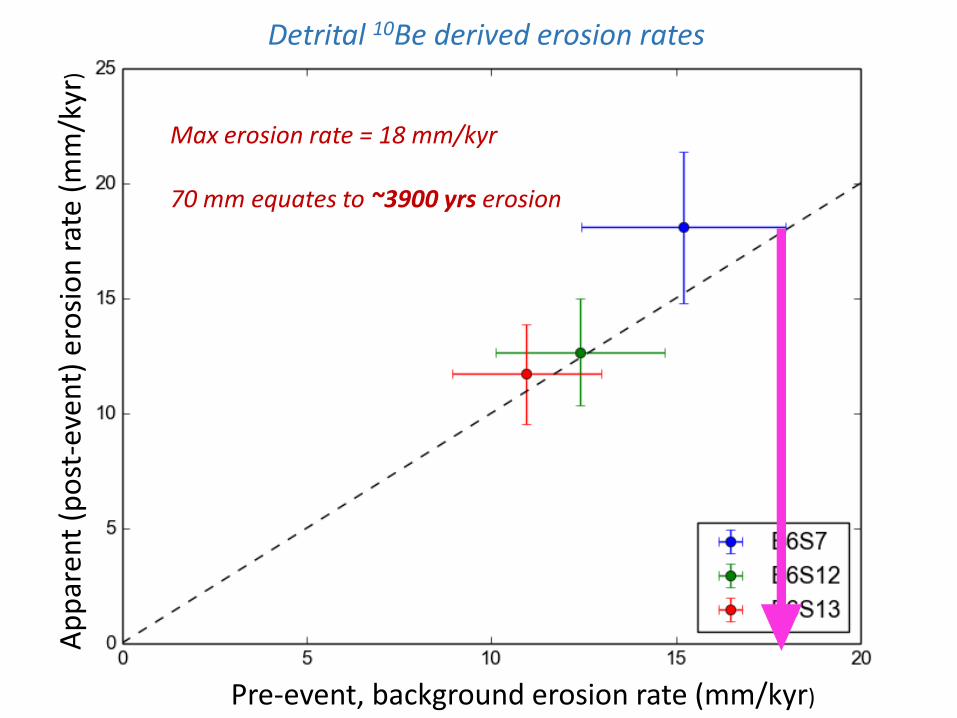
Pre-event, background erosion rate (mm/kyr)
Ap
par
ent
(po
st-e
ven
t) e
rosi
on
rat
e (m
m/k
yr)
Detrital 10Be derived erosion rates
Max erosion rate = 18 mm/kyr 70 mm equates to ~3900 yrs erosion

What is the depth of surface stripping required to correct apparent concentrations?
20
10 5
10Be shift suggests average surface removal was 5-20 cm; comparable to volume flux of 7cm
Ap
par
ent
(po
st-e
ven
t) e
rosi
on
rat
e (m
m/k
yr)
Pre-event, background erosion rate (mm/kyr)

>80% of debris channels by length have average depth of <16 cm (i.e. 1st and 2nd order channels) generated on highest slopes
Put Figure of slope/channel order here
Slope (degrees) Fl
ow
wid
th (
m)

Conclusions
• Geomorphic data required to resolve short-lived convective storms
• Ladakh 2010 mobilised a surface flux that represents > 3000 yrs of background erosion
• Majority of flux sourced from numerous shallow debris flow gulleys on steep slopes

No clear evidence of a trend in intense rainfall events since 1951 – Ghosh et al., 2014 Nature Cl. Change
Increased monsoonal precipitation intensity (storms) have been increasing – rain gauge data (eg. Goswami et al., 2006, Science)
Rain Gauge data across India, but poor in Himalaya

Map out debris Flows at different orders

Methodology
1) Map debris flows and establish a stream ordering 2) Width/depth scaling relationship established for 281
sites covering full range 3) Find average cross-sectional area for each stream
order by plotting cumulative frequency of streams order and of channel cross-sectional area and assigning the same proportionate division from the channel orders to the cross-sectional areas. Also cross-checked that assigned area/orders are correct based known location of measurements.
4) Obtain slope corrected lengths from remote imager for each order and multiply by average cross-sectional area.

Evidence of shortening rates Terrace data
0.03 0.02 0.02 0.03
0.02
0.03
0.02
0.09
0.07
0.07
0.08
0.07
New data
Munack et al., 2014
Erosion rates (mm/yr) derived from detrital 10Be in quartz
0.04
0.02
0.02
Dortsch et al., 2011
0.013, 0.009
20km
flux equates to 800-1200yrs of erosion

Devrani et al., 2015, Geophys. Res. Letts Kedarnath, Uttarakhand, 2013

Devrani et al., 2015, Geophys. Res. Letts

Devrani et al., 2015, Geophys. Res. Letts

Mehta et al., 2012

2013
1413-1980 (Wasson et al., 2013)

Conclusions
• Geomorphic analysis is the only technique that yields high resolution reconstruction and relative magnitude of extreme storm events in Himalaya
• Ladakh and Uttarakhand events represent the biggest events in last 1000-10,000 yrs.
• Does this represent a change to the system?

Fleitmann et al., 2007., Q. Sci Rev.
Higher monsoon rainfall

Unaffected valley above Ney (Basgo)

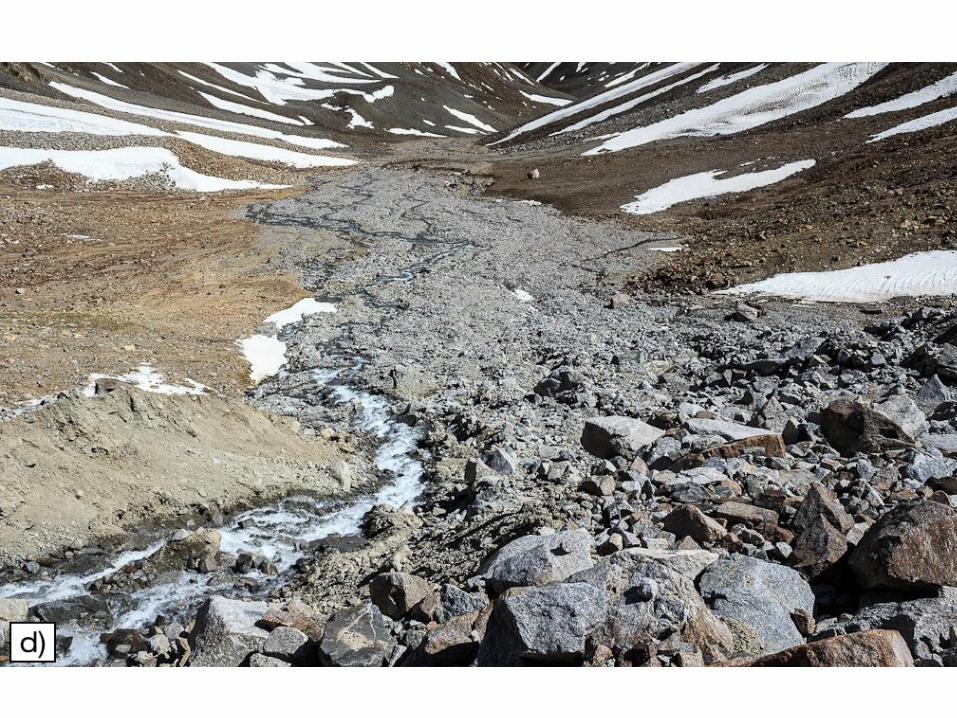
Debris flows from side valleys and widening and aggradation of main valley in Basgo
Muddy debris flow
Rocky debris flow
Widening of principle channel

Measurements of debris flow size


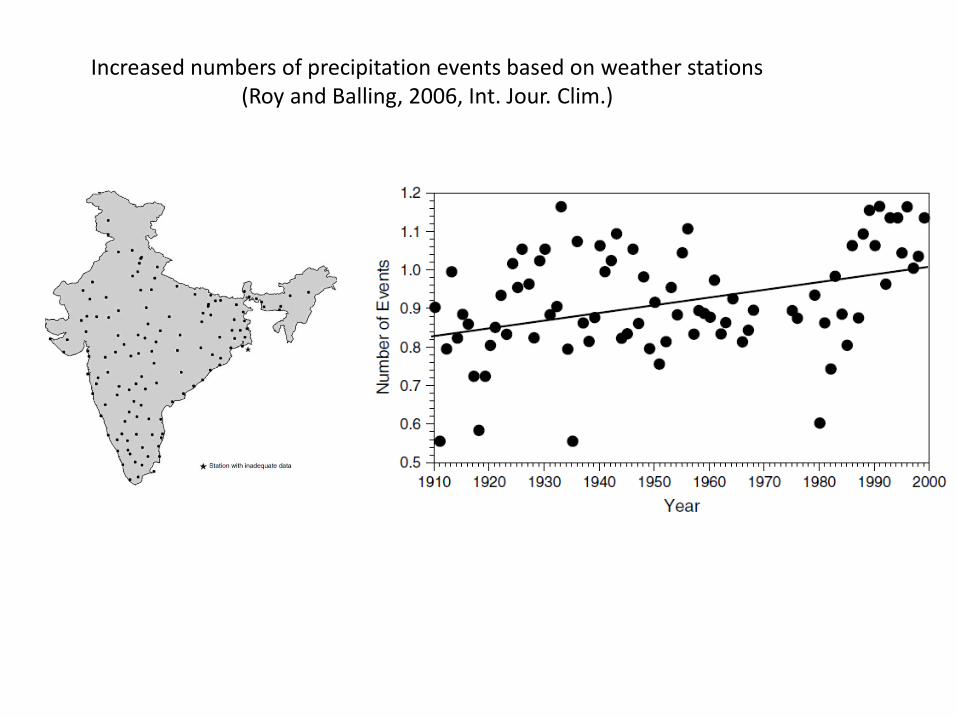
Increased numbers of precipitation events based on weather stations (Roy and Balling, 2006, Int. Jour. Clim.)

BASGO 10Be samples:
BAS11
BAS5
BAS2
B6S7 34.30627 77.33621
B6S12 34.25405 77.2935
B6S13 34.26511 77.29596
BASGO-02-BGS7 34.30627 77.33621
BASGO-04-BGS12 34.25405 77.2935
BASGO-05-BGS13 34.26511 77.29596
Top Related