


Languages
Pages
Legal


Geography of Religion In USA
Chap 6 ReligionEnvs 204
1

Objectives
• Spatial Distribution of Religion in USA– Sources of Data and Trends– Regional Distributions
• Explanations for Differential Distribution– Immigration into the USA– Internal Migration
• Speculation on Consequences– Political Behavior– Community Stability
2
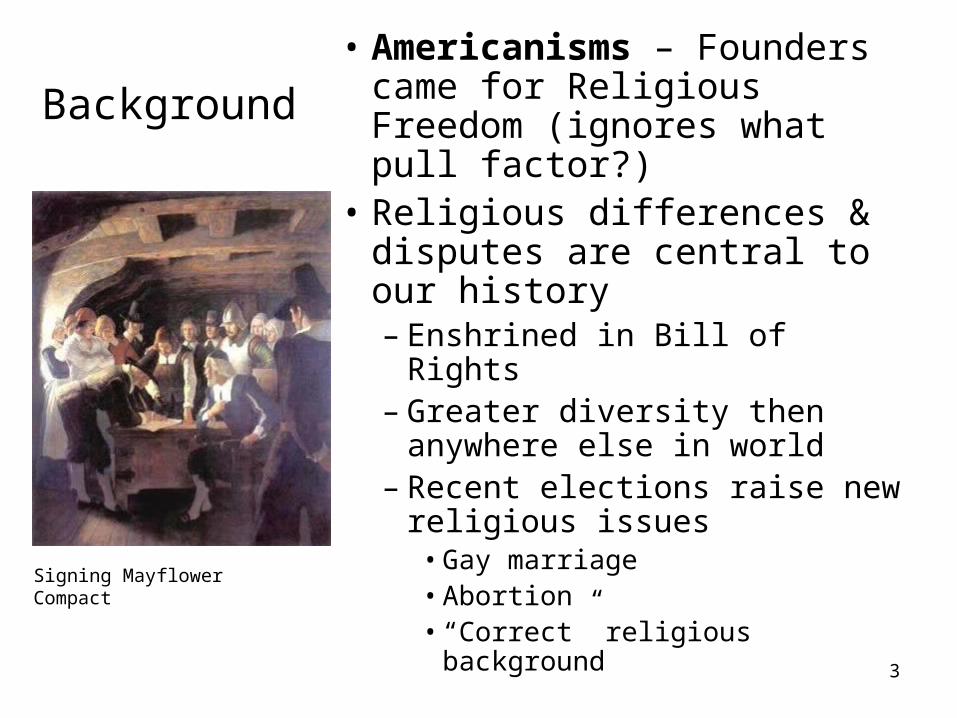
• Americanisms – Founders came for Religious Freedom (ignores what pull factor?)
• Religious differences & disputes are central to our history– Enshrined in Bill of Rights– Greater diversity then
anywhere else in world– Recent elections raise new
religious issues• Gay marriage• Abortion• “Correct” religious background
Background
3
Signing Mayflower Compact
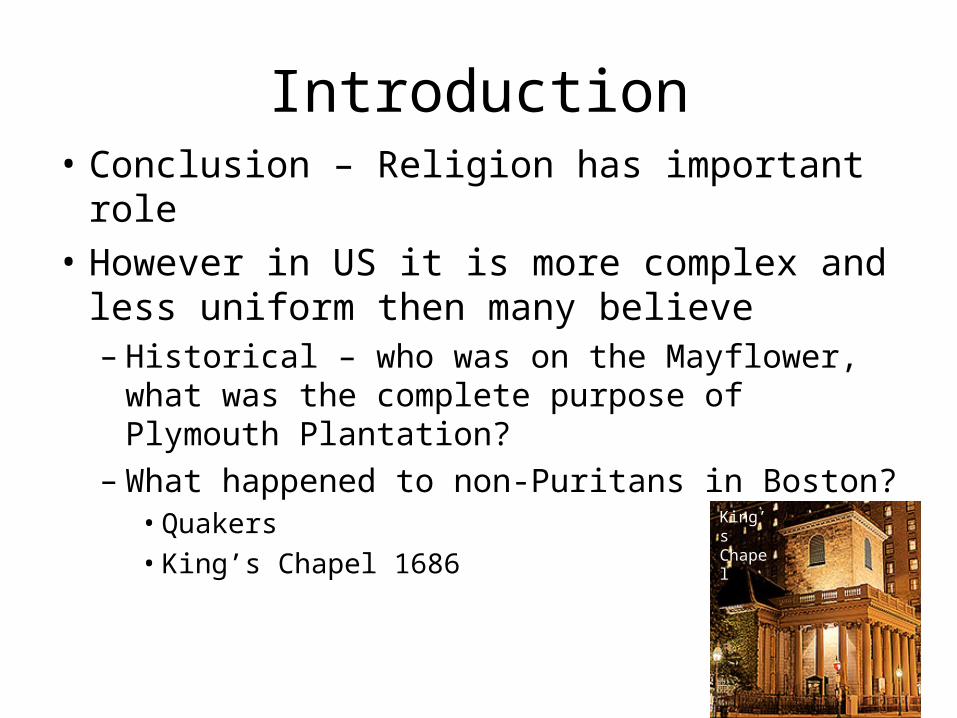
Introduction• Conclusion – Religion has important role
• However in US it is more complex and less uniform then many believe– Historical – who was on the Mayflower, what
was the complete purpose of Plymouth Plantation?
– What happened to non-Puritans in Boston?• Quakers• King’s Chapel 1686
4
King’s Chapel
Religious Make up
• Data – what is available– Census? – Not available– Where else available?
• Religious body data– Different groups different rules– Practicing?
» Protestants» Catholics» Others
– Problem – data not uniform, unsatisfactory
5
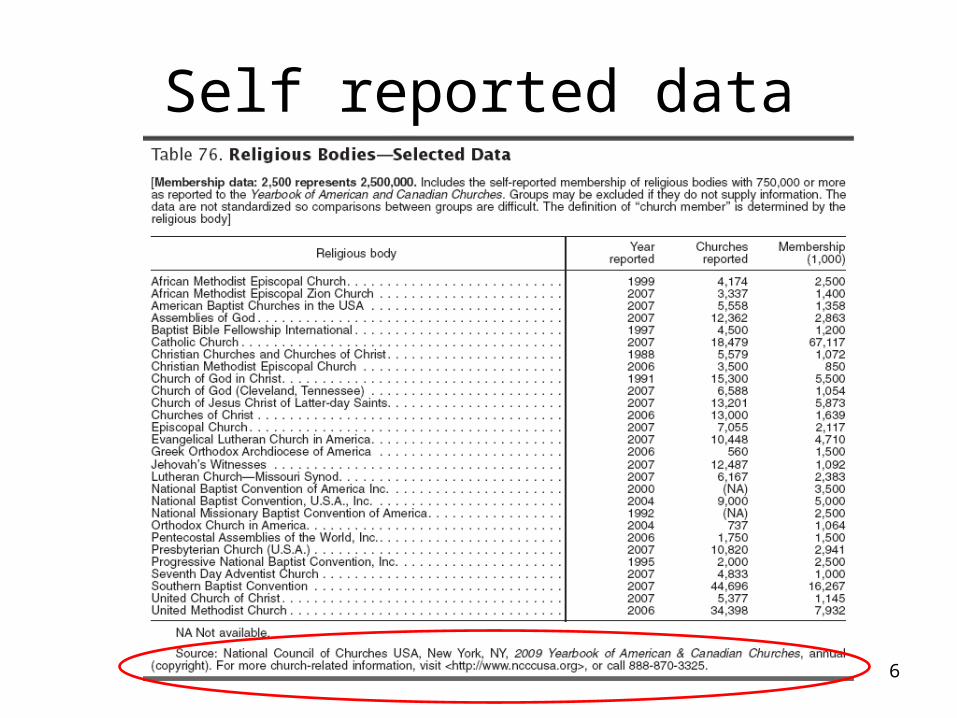
Self reported data
6
Polls
• Pew, Harris, National Survey of Religious Identification (NSRI), American Religious Identity Survey (ARIS),…
• Source
file:///F:/Egeo201/Religion/rel_USA.html
7
8
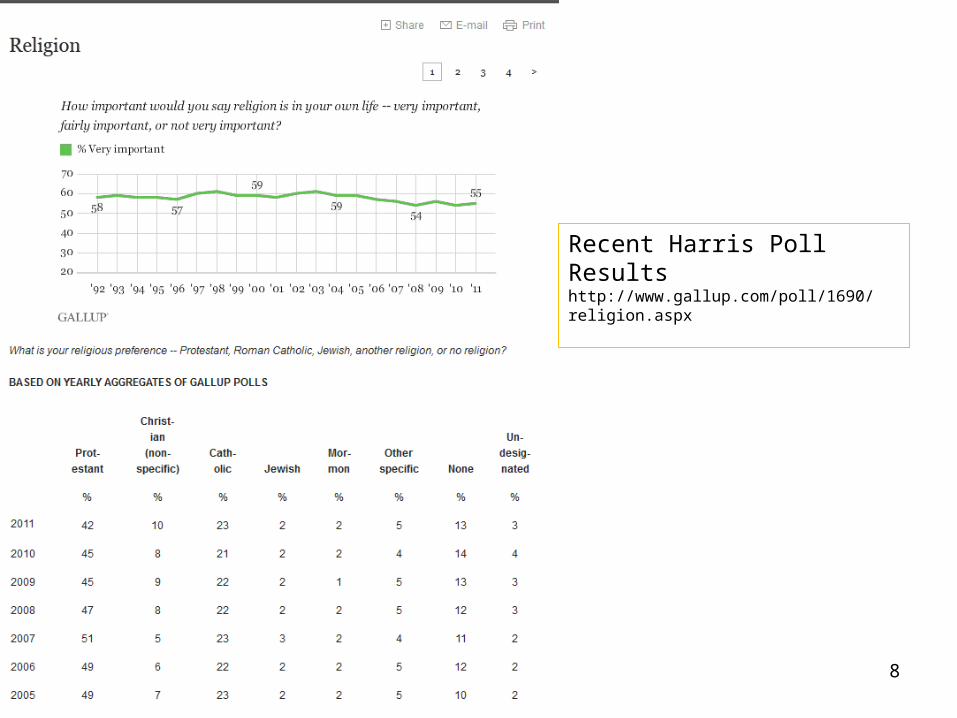
Recent Harris Poll Resultshttp://www.gallup.com/poll/1690/religion.aspx
1990 Est. 2001 Est. 2004 Est.% of U.S.
Pop.,%
Change
Adult Pop. ADULT Pop. Total Pop. 20001990 - 2000
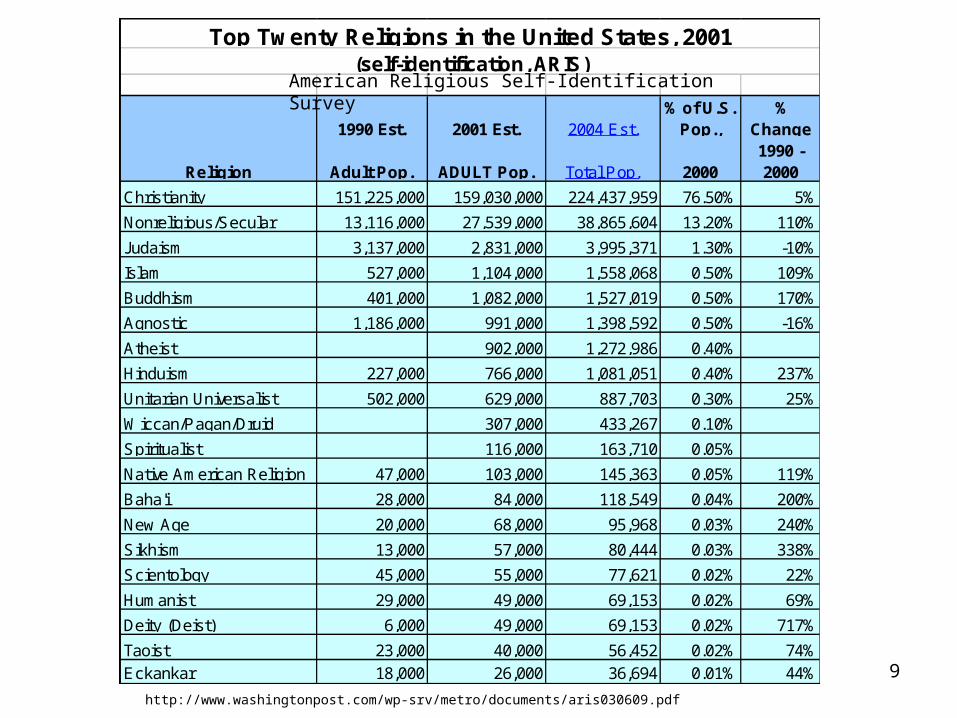
Christianity 151,225,000 159,030,000 224,437,959 76.50% 5%
Nonreligious/Secular 13,116,000 27,539,000 38,865,604 13.20% 110%
Judaism 3,137,000 2,831,000 3,995,371 1.30% -10%
Islam 527,000 1,104,000 1,558,068 0.50% 109%
Buddhism 401,000 1,082,000 1,527,019 0.50% 170%
Agnostic 1,186,000 991,000 1,398,592 0.50% -16%
Atheist 902,000 1,272,986 0.40%
Hinduism 227,000 766,000 1,081,051 0.40% 237%
Unitarian Universalist 502,000 629,000 887,703 0.30% 25%
Wiccan/Pagan/Druid 307,000 433,267 0.10%
Spiritualist 116,000 163,710 0.05%
Native American Religion 47,000 103,000 145,363 0.05% 119%
Baha'i 28,000 84,000 118,549 0.04% 200%
New Age 20,000 68,000 95,968 0.03% 240%
Sikhism 13,000 57,000 80,444 0.03% 338%
Scientology 45,000 55,000 77,621 0.02% 22%
Humanist 29,000 49,000 69,153 0.02% 69%
Deity (Deist) 6,000 49,000 69,153 0.02% 717%
Taoist 23,000 40,000 56,452 0.02% 74%Eckankar 18,000 26,000 36,694 0.01% 44%
Religion
Top Twenty Religions in the United States, 2001(self-identification, ARIS)
9
http://www.washingtonpost.com/wp-srv/metro/documents/aris030609.pdf
American Religious Self-Identification Survey

Survey Response %, June 1996 %, March 2001 %, March 2002Protestant 53 53 52Catholic 23 23 24Mormon 2 2 2Orthodox 1 1 *Non-denominational 1 0 0Something else (Specify) 1 * 2Not practicing any religion 1 0 0Don't know/Refused 2 3 2TOTAL CHRISTIAN 84% 82% 82%
Largest Branches of Christianity in the U.S.(self-identification, Pew Research Council)
10
11
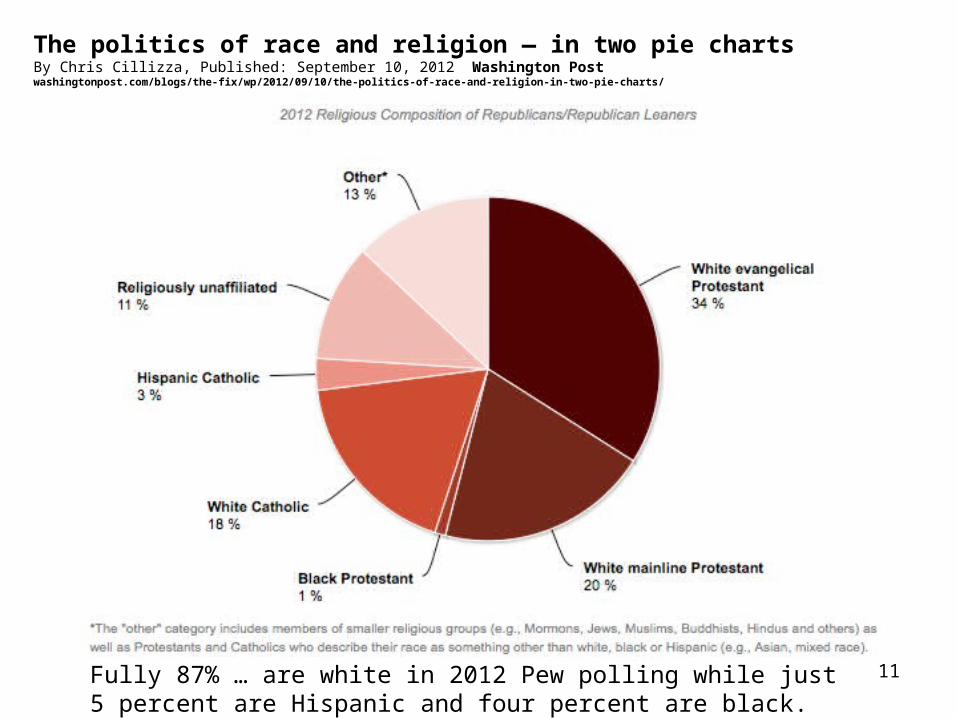
The politics of race and religion — in two pie chartsBy Chris Cillizza, Published: September 10, 2012 Washington Post washingtonpost.com/blogs/the-fix/wp/2012/09/10/the-politics-of-race-and-religion-in-two-pie-charts/
Fully 87% … are white in 2012 Pew polling while just 5 percent are Hispanic and four percent are black.

12Sixty-one percent of Democrats and Democratic-leaners are white while 21 percent are black and 10 percent are Hispanic.

Summary
• Note the great variation in estimates of percentage and numbers of Christians (82% vs. 71%)
• Note the growing importance of Non-Christians
• Thus we can only make broad statements – use with caution
13

14

15
Church or Synagog Attendance shows slightly differerent pattern

Regional Concentrations
From Religious Atlas of USAhttp://www.valpo.edu/geomet/geo/courses/geo200/religion.html
16

17
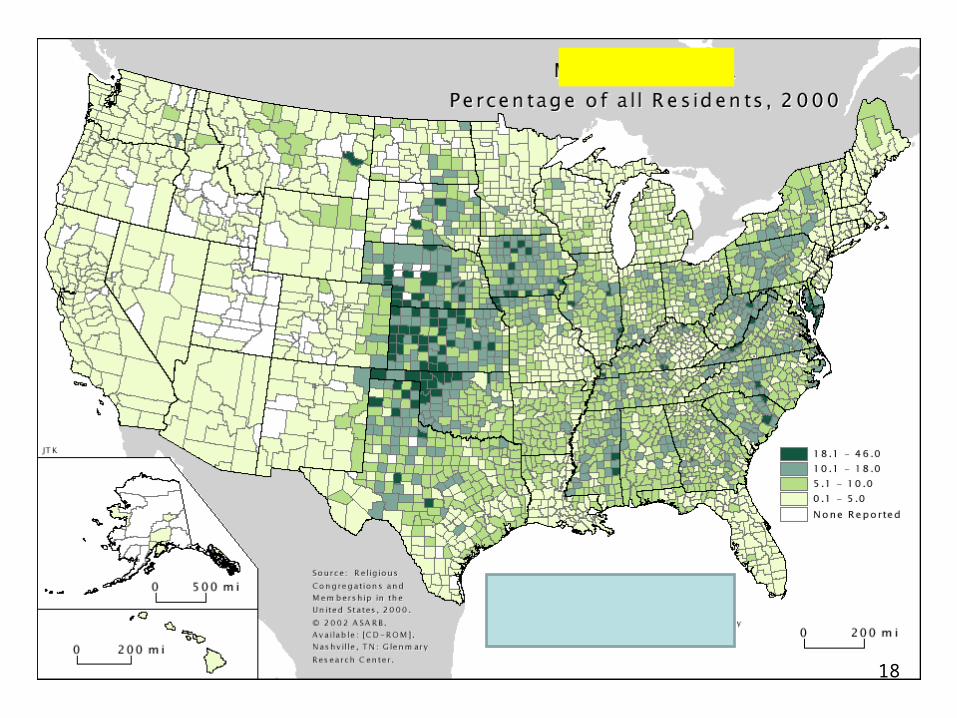
18

19

20
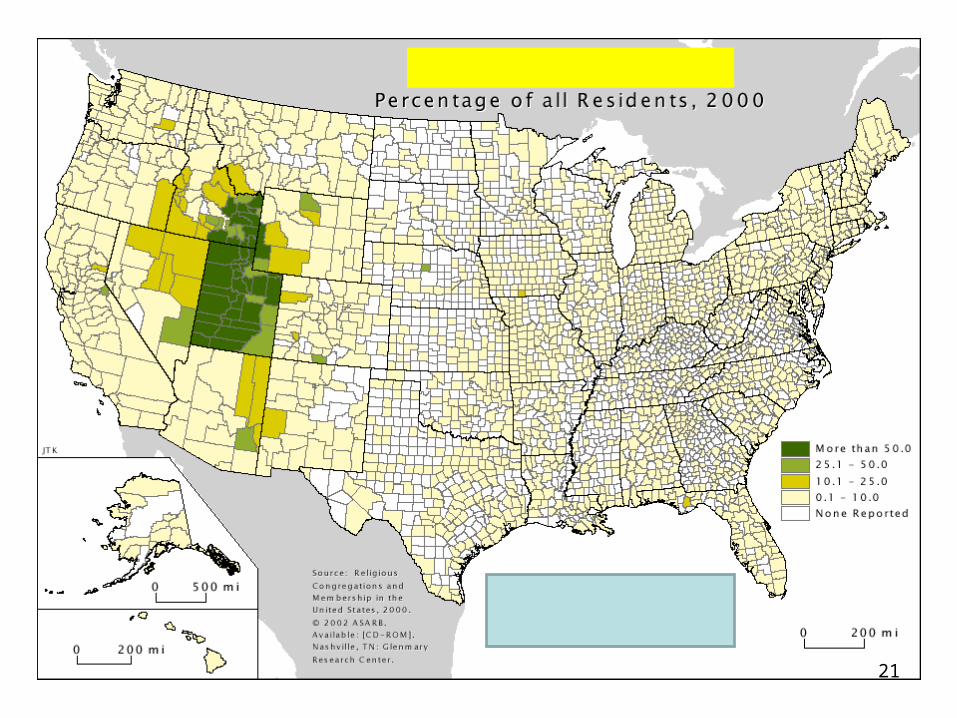
21

22

23

Urban & Rural Patterns
24

25
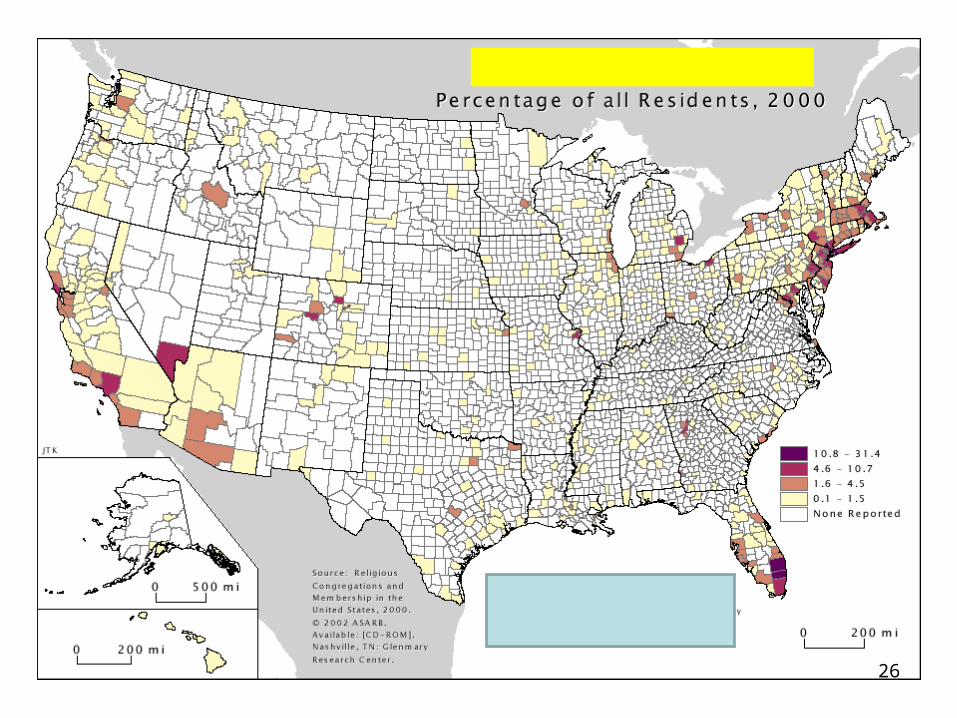
26
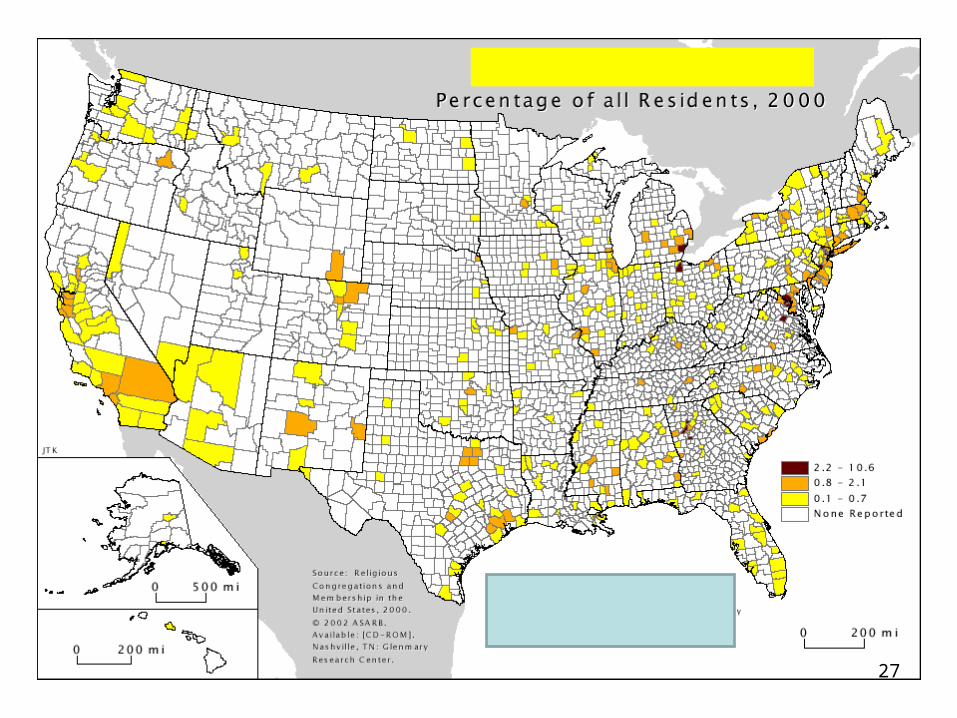
27

28
Patterns
• Largest Group varies by Region
29

30
Clear Spatial Patters for Religious Groups
• Urban vs Rural
• East vs West/ or North vs South
• Largest national group
• Politically split religions
• The frozen north? Or Garrison Keller’s buddies.
31

Speculation• Religious Affiliation will continue to effect
nation• Regional differences will change
– More merging of older groups– Current Expansion of Evangelicals– Continued increase of internal migration– New immigrants bring religion to borders– Increase of religiously non-affiliated
• Greater diversity of electorate in the future, more difficult to play the religion card?
32

33

34
Top Related