


Languages
Pages
Legal


FY ended March 2018Consolidated Financial Results
May 10, 2018
Index
1. Consolidated Financial Results P. 3
2. Forecast - FY ending March 2019 P. 6
3. Capital Expenditures/Depreciation and amortization P. 8
4. Information by Segment P. 11
5. Return to Shareholders P. 15
6. References P. 16
FY ended March 2018 Consolidated Financial Results 2

Net Sales Operating Income
FY ended March 2018 Consolidated Financial Results 3
1. Consolidated Financial Results
Highlights
• Increase in Net Sales, due mainly to an increase in sales volume of pyrotechnic devices and plastics, as well as the revision of selling prices
• Decrease in Operating Income due mainly to rising raw material and fuel procurement prices and a fire at the Ohtake Plant
2017/3 2018/3
440.1 64.358.9
2017/3 2018/3
Income attributable to Owners of Parent
43.2
37.1
2017/3 2018/3
463.0
(billion yen)
1. Consolidated Financial Results
FY ended March 2018 Consolidated Financial Results 4
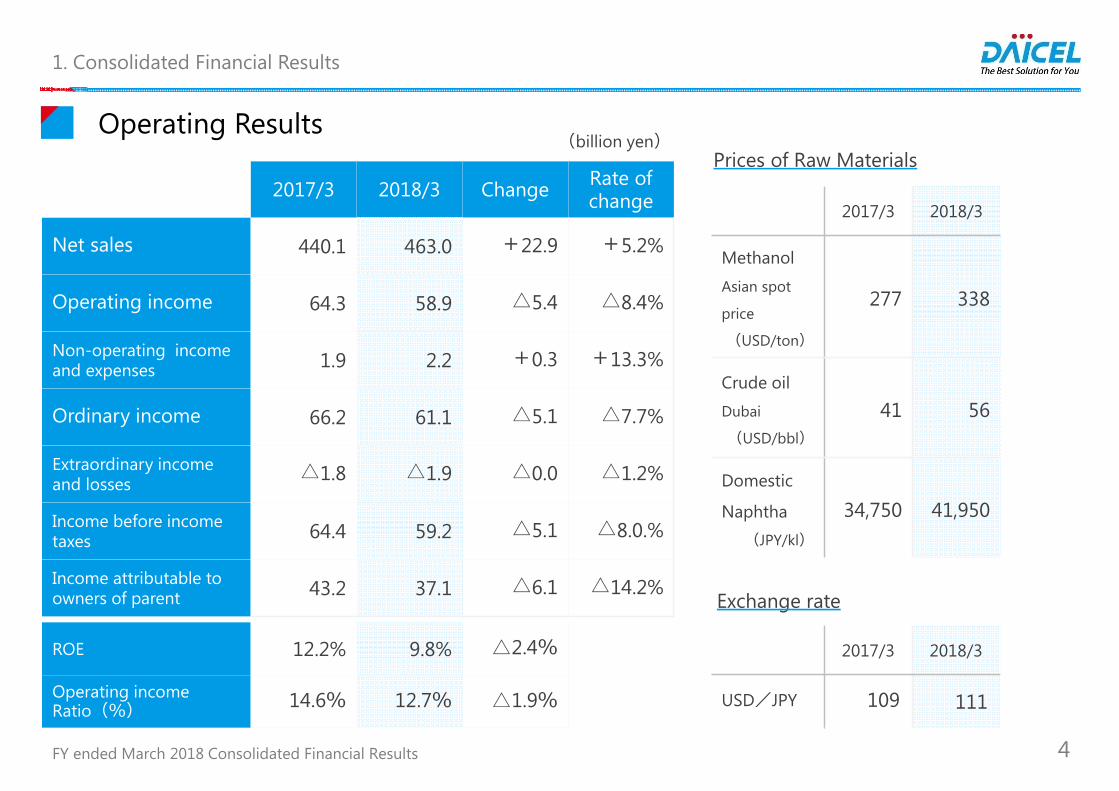
Operating Results
2017/3 2018/3 Change Rate of change
Net sales 440.1 463.0 +22.9 +5.2%
Operating income 64.3 58.9 △5.4 △8.4%
Non-operating income and expenses 1.9 2.2 +0.3 +13.3%
Ordinary income 66.2 61.1 △5.1 △7.7%
Extraordinary income and losses
△1.8 △1.9 △0.0 △1.2%
Income before income taxes 64.4 59.2 △5.1 △8.0.%
Income attributable toowners of parent 43.2 37.1 △6.1 △14.2%
Exchange rate
ROE 12.2% 9.8% △2.4%
Operating incomeRatio(%) 14.6% 12.7% △1.9%
2017/3 2018/3
USD/JPY 109 111
2017/3 2018/3
Methanol
Asian spot
price
(USD/ton)
277 338
Crude oil
Dubai
(USD/bbl)41 56
Domestic
Naphtha(JPY/kl)
34,750 41,950
Prices of Raw Materials(billion yen)
1. Consolidated Financial Results
FY ended March 2018 Consolidated Financial Results 5
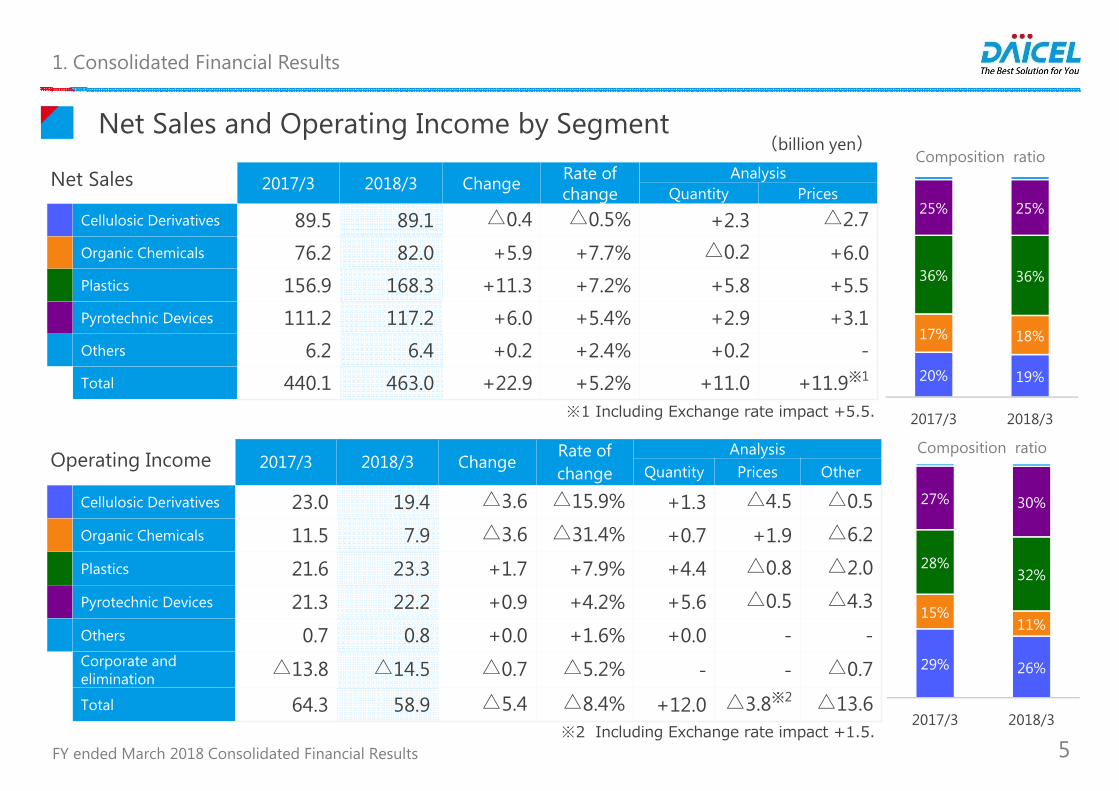
Net Sales and Operating Income by Segment
2017/3 2018/3 Change Rate of change
AnalysisQuantity Prices
Cellulosic Derivatives 89.5 89.1 △0.4 △0.5% +2.3 △2.7Organic Chemicals 76.2 82.0 +5.9 +7.7% △0.2 +6.0Plastics 156.9 168.3 +11.3 +7.2% +5.8 +5.5Pyrotechnic Devices 111.2 117.2 +6.0 +5.4% +2.9 +3.1Others 6.2 6.4 +0.2 +2.4% +0.2 -Total 440.1 463.0 +22.9 +5.2% +11.0 +11.9※1
2017/3 2018/3 ChangeRate of change
AnalysisQuantity Prices Other
Cellulosic Derivatives 23.0 19.4 △3.6 △15.9% +1.3 △4.5 △0.5
Organic Chemicals 11.5 7.9 △3.6 △31.4% +0.7 +1.9 △6.2
Plastics 21.6 23.3 +1.7 +7.9% +4.4 △0.8 △2.0
Pyrotechnic Devices 21.3 22.2 +0.9 +4.2% +5.6 △0.5 △4.3
Others 0.7 0.8 +0.0 +1.6% +0.0 - -Corporate andelimination
△13.8 △14.5 △0.7 △5.2% - - △0.7
Total 64.3 58.9 △5.4 △8.4% +12.0 △3.8※2 △13.6
(billion yen)
20% 19%
17% 18%
36% 36%
25% 25%
2017/3 2018/3
Composition ratio
29% 26%
15%11%
28%32%
27% 30%
2017/3 2018/3
Composition ratio
Net Sales
Operating Income
※1 Including Exchange rate impact +5.5.
※2 Including Exchange rate impact +1.5.

2. Forecast - FY ending March 2019
FY ended March 2018 Consolidated Financial Results 6
Forecast
2018/3(Results)
2019/3(Forecast) Change Rate of
change
Net sales 463.0 478.0 +15.0 +3.2%
Operating income 58.9 51.0 △7.9 △13.5%
Ordinary income 61.1 53.0 △8.1 △13.2%
Income attributable toowners of parent 37.1 37.0 △0.1 △0.2%
Operating incomeRatio(%) 12.7% 10.7% △2.0%
2017/3(Results)
2018/3(Forecast)
USD/JPY 111 110
2017/3(Results)
2018/3(Forecast)
Methanol
Asian spot
price
(USD/ton)
338 330
Crude oil
Dubai
(USD/bbl)56 62
Domestic
Naphtha(JPY/kl)
41,950 47,000
(billion yen)
Exchange rate
Prices of Raw Materials

2. Forecast - FY ending March 2019
FY ended March 2018 Consolidated Financial Results 7
2018/3(Results)
2019/3(Forecast) Change Rate of
change
Cellulosic Derivatives 89.1 86.6 △2.5 △2.8%Organic Chemicals 82.0 87.0 +5.0 +6.0%Plastics 168.3 183.1 +14.8 +8.8%Pyrotechnic Devices 117.2 114.0 △3.2 △2.7%Others 6.4 7.3 +0.9 +14.2%Total 463.0 478.0 +15.0 +3.2%
2018/3(Results)
2019/3(Forecast) Change Rate of
change
Cellulosic Derivatives 19.4 15.5 △3.9 △19.9%Organic Chemicals 7.9 12.0 +4.1 +51.6%Plastics 23.3 23.7 +0.4 +1.9%Pyrotechnic Devices 22.2 15.5 △6.7 △30.1%Others 0.8 0.8 +0.0 +6.2%Corporate andelimination △14.5 △16.5 △2.0 △13.6%Total 58.9 51.0 △7.9 △13.5%
19% 18%
18% 18%
36% 38%
25% 24%
2018/3 2019/3 (F)
Composition ratio
26% 23%
11% 18%
32%35%
30% 23%
2018/3 2019/3 (F)
Composition ratio
Forecast - Net Sales and Operating income by Segment -
Net Sales
Operating income
(billion yen)

FY ended March 2018 Consolidated Financial Results 8
3. Capital Expenditures/Depreciation and amortization
Depreciation and amortization
Capital Expenditures
14.9 13.58.3 4.5 2.6
6.4 5.89.2
7.818.9
2.3 4.3 5.14.7
5.46.2
15.1 12.6
11.3
13.60.9
1.6 4.3
2.5
3.5
30.6
40.3 39.5
30.8
44.0
2015/3 2016/3 2017/3 2018/3 2019/3Forecast
Others/Corporateand eliminationsPyrotechnic Devices
Plastics
Organic Chemicals
Cellulosic Derivatives
6.2 6.7 9.3 9.5 8.1
4.5 4.45.4 7.1
6.06.3 5.6
5.04.9
4.85.3 5.9
7.98.5
9.21.2 1.3
1.41.7 1.9
23.4 23.929.0
31.7 30.0
2015/3 2016/3 2017/3 2018/3 2019/3Forecast
Others/Corporateand eliminationsPyrotechnic Devices
Plastics
Organic Chemicals
Cellulosic Derivatives
(billion yen)

FY ended March 2018 Consolidated Financial Results 9
Major Capital Expenditures Plansin FY ending March 2019
Major Capital Expenditures PlansAfter April 1, 2019
Organic Chemicals• Renewal of CO(Carbon Monoxide) plant• New facility for innovation, “Innovation Center
Arai” (at Arai Plant) Plastics
• Increase in production capacity of Engineering Plastic Compounds (Taiwan, Malaysia)
Pyrotechnic Devices• New production facility for initiators in China• Increase in production capacity for inflators• Installation of demonstration facility for gas
generants• Implementation of globally integrated
management system utilizing image processing technology
Organic Chemicals• New plant for 1.3BG (under consideration) Plastics
• Increase in POM production capacity (under consideration)
• Installation of new clean coaters for development of functional films
Pyrotechnic Devices• Increase inflator production capacity • New facility for innovation, “Innovation Center
Harima” (at Harima Plant) Common to Segments
• Integrated Production Center (IPC) at Ohtake Plant• New facility for developing and assuring functions
at Aboshi Plant• New boiler at Aboshi Plant
3. Capital Expenditures/Depreciation and amortization
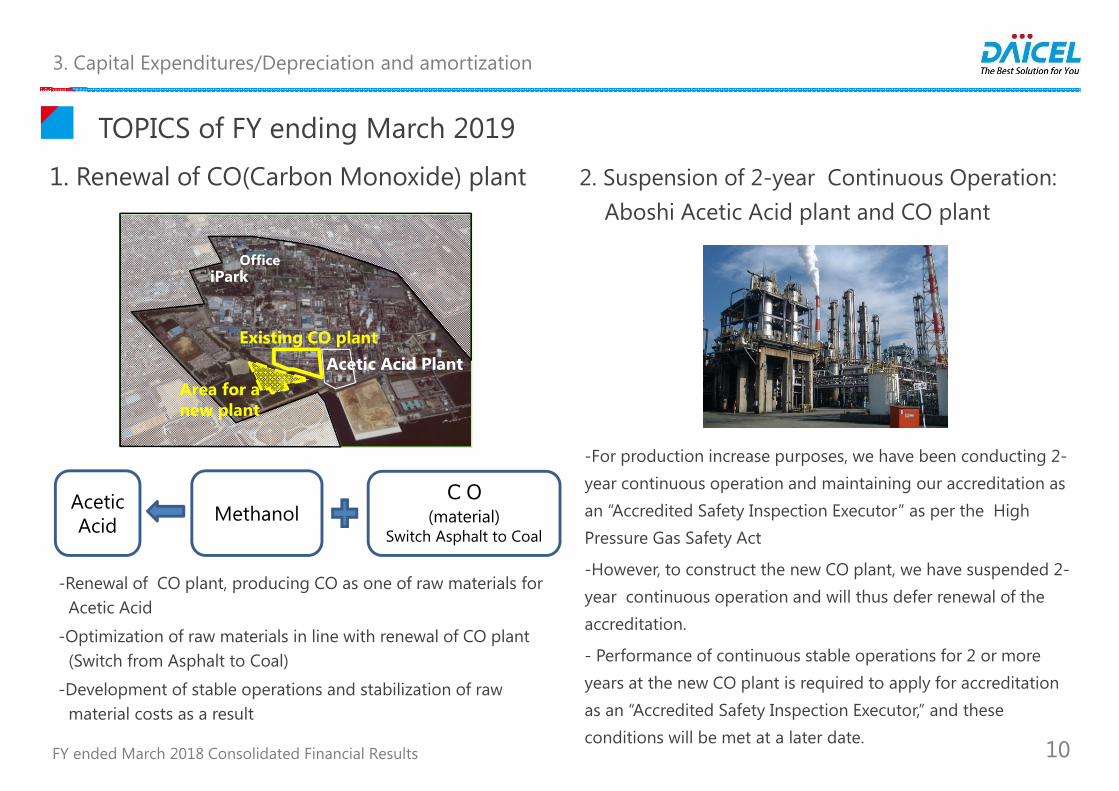
1. Renewal of CO(Carbon Monoxide) plant
-Renewal of CO plant, producing CO as one of raw materials for Acetic Acid
-Optimization of raw materials in line with renewal of CO plant (Switch from Asphalt to Coal)
-Development of stable operations and stabilization of raw material costs as a result
FY ended March 2018 Consolidated Financial Results 10
TOPICS of FY ending March 2019
Acetic Acid Methanol
CO(material)
Switch Asphalt to Coal
iParkOffice
Existing CO plantAcetic Acid Plant
Area for a new plant
2. Suspension of 2-year Continuous Operation: Aboshi Acetic Acid plant and CO plant
-For production increase purposes, we have been conducting 2-year continuous operation and maintaining our accreditation as an “Accredited Safety Inspection Executor” as per the High Pressure Gas Safety Act
-However, to construct the new CO plant, we have suspended 2-year continuous operation and will thus defer renewal of the accreditation.
- Performance of continuous stable operations for 2 or more years at the new CO plant is required to apply for accreditation as an “Accredited Safety Inspection Executor,” and these conditions will be met at a later date.
3. Capital Expenditures/Depreciation and amortization

FY ended March 2018 Consolidated Financial Results 11
4. Information by Segment
Net Sales
Operating income
Net Sales △0.4 billion yen(Exchange rate impact +1.4 billion yen)
Operating Income △3.6 billion yen
89.5 89.1 86.6
2017/3 2018/3 2019/3Forecast
(billion yen)
23.019.4
15.5
2017/3 2018/3 2019/3Forecast
(billion yen)
Cellulosic Derivatives
(Cellulose Acetate:Flat) Demand decreased for LCD film applications
Demand increased for other applications
( Acetate Tow for Cigarette Filters:Slightly Decrease) Increased in sales volume due to our efforts in strengthening
relationships with main customers and developing new customers
Decline in selling price due to softening of the market
2019/3 Forecast:Decrease in sales and income
Cellulose acetate: Decreased demand for LCD film applications, and increase for other applications such as acetate tow for cigarette filters
Acetate Tow for Cigarette Filters: In world-wide glut, but full-capacity operation will be maintained. Increase in sales volume, decline in selling price
Decrease due mainly to the negative impact of the softening of the market and an increase in raw material and fuel prices.
FY ended March 2018 Consolidated Financial Results 12
4. Information by Segment
Net Sales
Operating income
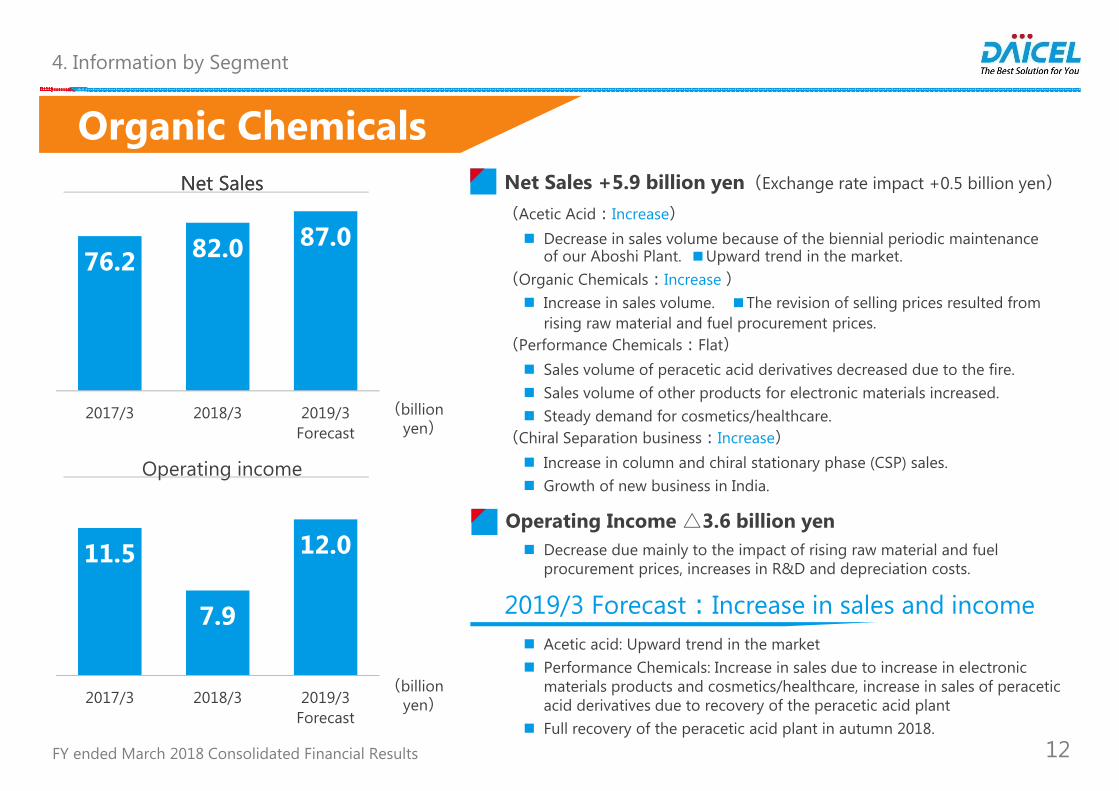
Organic ChemicalsNet Sales Net Sales +5.9 billion yen(Exchange rate impact +0.5 billion yen)
Operating Income △3.6 billion yen
76.2 82.0 87.0
2017/3 2018/3 2019/3Forecast
(billion yen)
11.5
7.9
12.0
2017/3 2018/3 2019/3Forecast
(billion yen)
(Acetic Acid:Increase) Decrease in sales volume because of the biennial periodic maintenance
of our Aboshi Plant. ■Upward trend in the market.(Organic Chemicals:Increase ) Increase in sales volume. ■The revision of selling prices resulted from
rising raw material and fuel procurement prices.(Performance Chemicals:Flat) Sales volume of peracetic acid derivatives decreased due to the fire. Sales volume of other products for electronic materials increased. Steady demand for cosmetics/healthcare.
(Chiral Separation business:Increase) Increase in column and chiral stationary phase (CSP) sales. Growth of new business in India.
2019/3 Forecast:Increase in sales and income Acetic acid: Upward trend in the market Performance Chemicals: Increase in sales due to increase in electronic
materials products and cosmetics/healthcare, increase in sales of peraceticacid derivatives due to recovery of the peracetic acid plant
Full recovery of the peracetic acid plant in autumn 2018.
Decrease due mainly to the impact of rising raw material and fuel procurement prices, increases in R&D and depreciation costs.
FY ended March 2018 Consolidated Financial Results 13
4. Information by Segment
Net Sales
Operating income
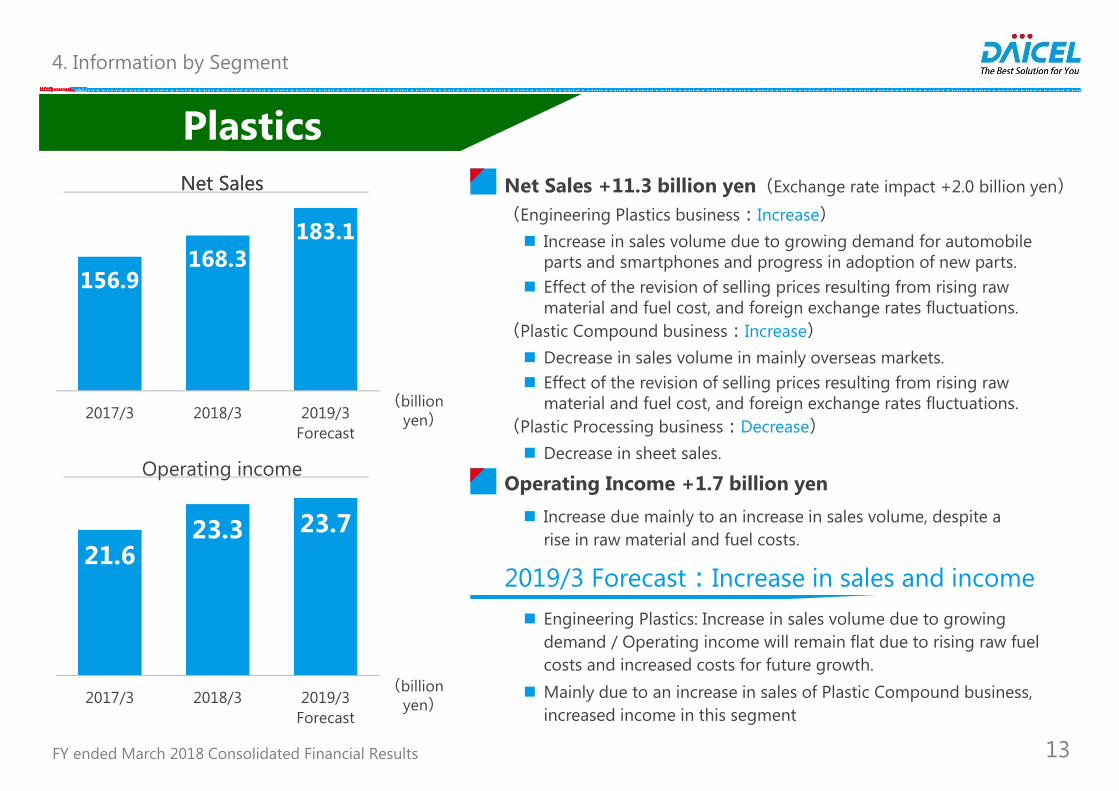
PlasticsNet Sales Net Sales +11.3 billion yen(Exchange rate impact +2.0 billion yen)
Operating Income +1.7 billion yen
(Engineering Plastics business:Increase) Increase in sales volume due to growing demand for automobile
parts and smartphones and progress in adoption of new parts. Effect of the revision of selling prices resulting from rising raw
material and fuel cost, and foreign exchange rates fluctuations.(Plastic Compound business:Increase) Decrease in sales volume in mainly overseas markets. Effect of the revision of selling prices resulting from rising raw
material and fuel cost, and foreign exchange rates fluctuations.(Plastic Processing business:Decrease) Decrease in sheet sales.
2019/3 Forecast:Increase in sales and income
Increase due mainly to an increase in sales volume, despite a rise in raw material and fuel costs.
Engineering Plastics: Increase in sales volume due to growing demand / Operating income will remain flat due to rising raw fuel costs and increased costs for future growth.
Mainly due to an increase in sales of Plastic Compound business, increased income in this segment
156.9168.3
183.1
2017/3 2018/3 2019/3Forecast
(billion yen)
21.623.3 23.7
2017/3 2018/3 2019/3Forecast
(billion yen)
FY ended March 2018 Consolidated Financial Results 14
4. Information by Segment
Net Sales
Operating income
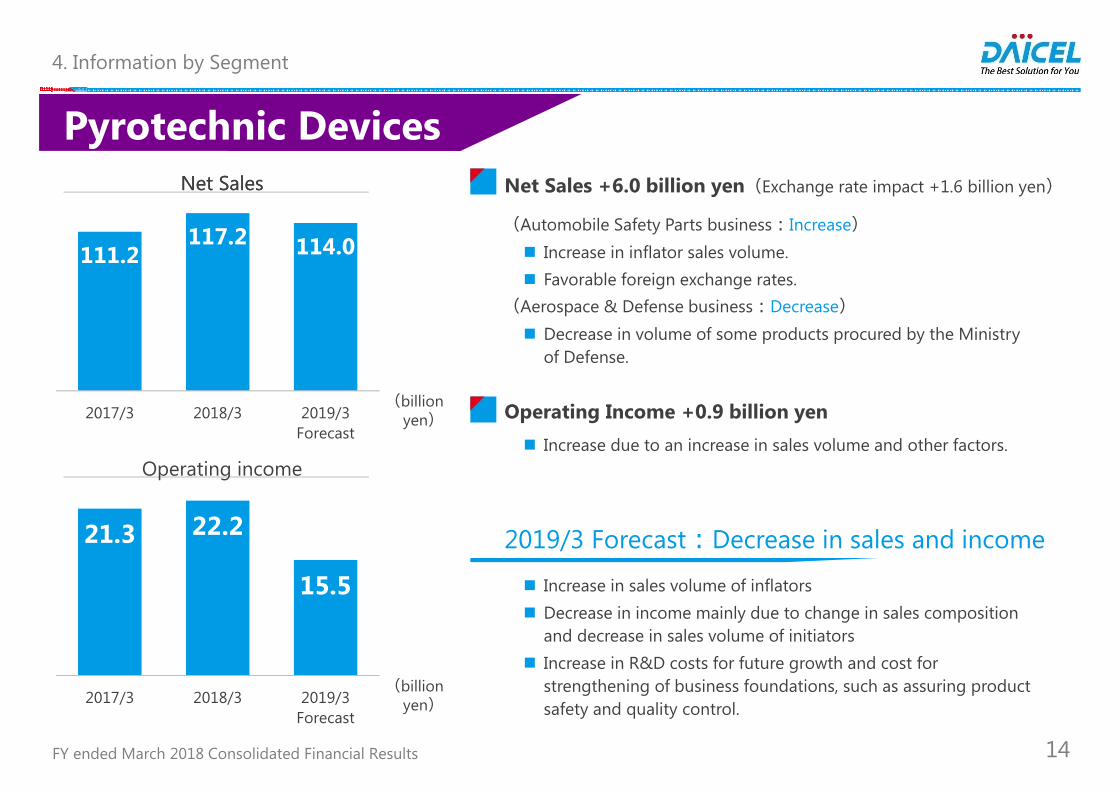
Pyrotechnic DevicesNet Sales Net Sales +6.0 billion yen(Exchange rate impact +1.6 billion yen)
Operating Income +0.9 billion yen
(Automobile Safety Parts business:Increase) Increase in inflator sales volume. Favorable foreign exchange rates.
(Aerospace & Defense business:Decrease) Decrease in volume of some products procured by the Ministry
of Defense.
2019/3 Forecast:Decrease in sales and income
Increase in sales volume of inflators Decrease in income mainly due to change in sales composition
and decrease in sales volume of initiators Increase in R&D costs for future growth and cost for
strengthening of business foundations, such as assuring product safety and quality control.
Increase due to an increase in sales volume and other factors.
111.2117.2 114.0
2017/3 2018/3 2019/3Forecast
(billion yen)
21.3 22.2
15.5
2017/3 2018/3 2019/3Forecast
(billion yen)

5. Return to Shareholders
15 21 26 30 32 32
23.1 23.6 22.6 24.1
29.7 29.3
2014/3 2015/3 2016/3 2017/3 2018/3 2019/3Forecast
Dividends(yen/share) dividend payout ratio(%)
FY ended March 2018 Consolidated Financial Results 15
Return to Shareholders
Dividends(yen/share)
2018/3(Results)
2019/3(Forecast)
For 1st half 16 16
For 2nd half 16 16
Annual 32 32
FY ended March 2018 FY ending March 2019
• Dividends for 2nd half : 16 yen per share, Annual dividends : 32 yen per share *Comparison with the previous year : 2 yen dividend increase
• Buyback of 7.5 million shares of company stock for approximately 10 billion yen.
• Forecast of Annual dividends : 32 yen per share
• Intent to buy back 8.3 million shares of company
stock for maximum 10 billion yen.
REFERENCES
FY ended March 2018 Consolidated Financial Results 16

6. References
FY ended March 2018 Consolidated Financial Results 17
Trend in Net Sales and Operating Income and Forecast
10393 87 79 82
100110
120109 111 110
321253
303375 372
439345
267 277338 330
Exchange rate(USD/JPY) Exchange rate(USD/JPY)
Methanol(Asian spot price)(USD / ton)Methanol(Asian spot price)(USD / ton)
378.0
320.2353.7 341.9 358.5
413.8443.8 449.9 440.1
463.0 478.0
10.6
20.9
32.7
20.426.2
37.9
51.3
64.3 64.358.9
51.0
'09/3 '10/3 '11/3 '12/3 '13/3 '14/3 '15/3 '16/3 '17/3 '18/3 '19/3
Forecast
■Net Sales /Operating income■Net Sales /Operating income
(billion yen)

FY ended March 2018 Consolidated Financial Results 18
Consolidated Balance SheetMar. 31, 2017 Mar. 31, 2018 Change Remarks
Total current assets 307.2 354.6 +47.4Cash, deposits and short-term investment securities 96.9 129.3 +32.4Notes and accounts receivable-trade 88.3 93.3 +4.9
Inventories 100.7 109.3 +8.6Other 21.3 22.7 +1.4
Total non-current assets 292.5 289.5 △ 3.0Property, plant and equipment 185.2 184.0 △ 1.1 Acquisition+29.3, Depreciation△30.0,
Retirement△0.4
Intangible fixed assets 9.6 8.6 △ 1.0Investments and other assets 97.7 96.9 △ 0.8
Total assets 599.7 644.1 +44.4Liabilities 200.3 230.5 +30.3
Interest-bearing liabilities 72.3 99.7 +27.5 Bonds+30.0, Interest-bearing liabilities ratio 15.5%
Other 128.0 130.8 +2.8Total net assets 399.4 413.5 +14.1 Capital adequacy ratio 59.8%
Total liabilities and net assets 599.7 644.1 +44.4
(billion yen)
6. References
FY ended March 2018 Consolidated Financial Results 19
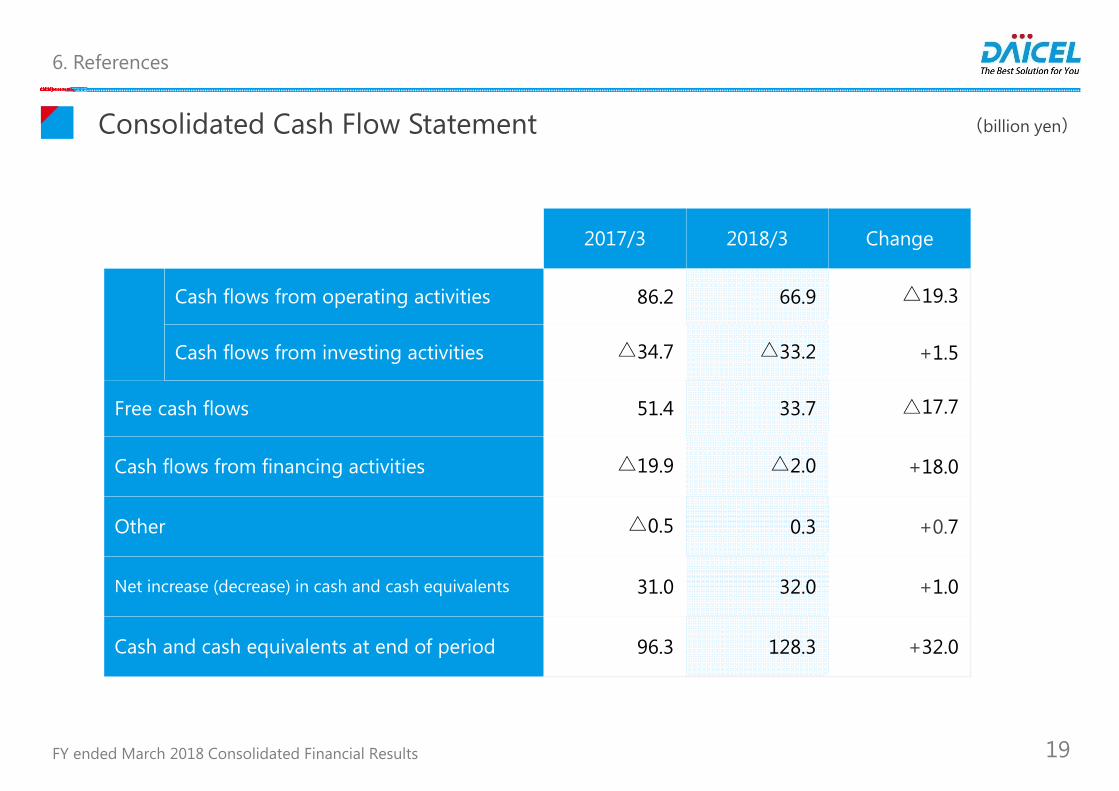
Consolidated Cash Flow Statement
2017/3 2018/3 Change
Cash flows from operating activities 86.2 66.9 △19.3
Cash flows from investing activities △34.7 △33.2 +1.5
Free cash flows 51.4 33.7 △17.7
Cash flows from financing activities △19.9 △2.0 +18.0
Other △0.5 0.3 +0.7
Net increase (decrease) in cash and cash equivalents 31.0 32.0 +1.0
Cash and cash equivalents at end of period 96.3 128.3 +32.0
(billion yen)
6. References
FY ended March 2018 Consolidated Financial Results 20
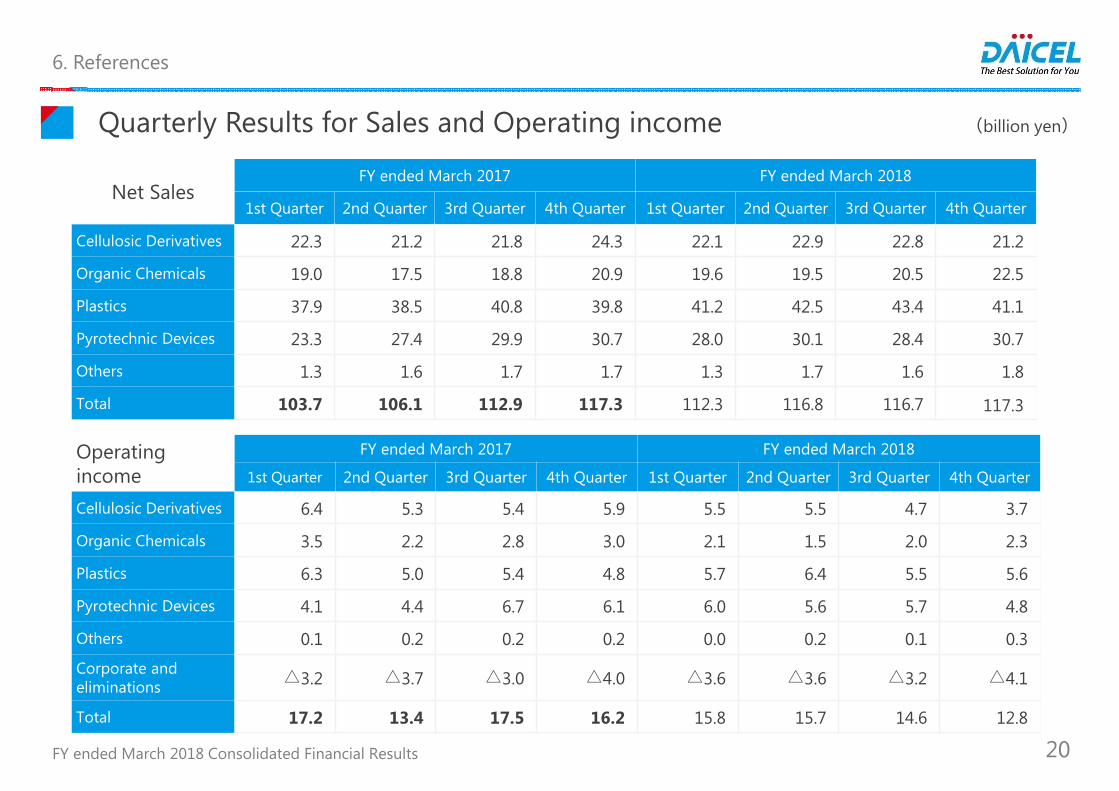
Quarterly Results for Sales and Operating income
Net SalesFY ended March 2017 FY ended March 2018
1st Quarter 2nd Quarter 3rd Quarter 4th Quarter 1st Quarter 2nd Quarter 3rd Quarter 4th Quarter
Cellulosic Derivatives 22.3 21.2 21.8 24.3 22.1 22.9 22.8 21.2
Organic Chemicals 19.0 17.5 18.8 20.9 19.6 19.5 20.5 22.5
Plastics 37.9 38.5 40.8 39.8 41.2 42.5 43.4 41.1
Pyrotechnic Devices 23.3 27.4 29.9 30.7 28.0 30.1 28.4 30.7
Others 1.3 1.6 1.7 1.7 1.3 1.7 1.6 1.8
Total 103.7 106.1 112.9 117.3 112.3 116.8 116.7 117.3
Operating income
FY ended March 2017 FY ended March 2018
1st Quarter 2nd Quarter 3rd Quarter 4th Quarter 1st Quarter 2nd Quarter 3rd Quarter 4th Quarter
Cellulosic Derivatives 6.4 5.3 5.4 5.9 5.5 5.5 4.7 3.7
Organic Chemicals 3.5 2.2 2.8 3.0 2.1 1.5 2.0 2.3
Plastics 6.3 5.0 5.4 4.8 5.7 6.4 5.5 5.6
Pyrotechnic Devices 4.1 4.4 6.7 6.1 6.0 5.6 5.7 4.8
Others 0.1 0.2 0.2 0.2 0.0 0.2 0.1 0.3
Corporate and eliminations △3.2 △3.7 △3.0 △4.0 △3.6 △3.6 △3.2 △4.1
Total 17.2 13.4 17.5 16.2 15.8 15.7 14.6 12.8
(billion yen)
6. References

FY ended March 2018 Consolidated Financial Results 21
Forecast - Financial Forecast -
FY ended March 2018 (Results) FY ending March 2019 (Forecast) Change(B)-(A)1st half 2nd half Total(A) 1st half 2nd half Total(B)
Cellulosic Derivatives 45.1 44.0 89.1 43.1 43.5 86.6 △2.5
Organic Chemicals 39.1 42.9 82.0 43.0 44.0 87.0 +5.0
Plastics 83.7 84.5 168.3 90.6 92.5 183.1 +14.8
Pyrotechnic Devices 58.1 59.1 117.2 55.1 58.9 114.0 △3.2
Others 3.0 3.4 6.4 3.2 4.1 7.3 +0.9
Net sales 229.0 233.9 463.0 235.0 243.0 478.0 +15.0
Cellulosic Derivatives 11.0 8.3 19.4 8.5 7.0 15.5 △3.9
Organic Chemicals 3.6 4.3 7.9 6.0 6.0 12.0 +4.1
Plastics 12.2 11.1 23.3 12.0 11.7 23.7 +0.4
Pyrotechnic Devices 11.6 10.5 22.2 7.9 7.6 15.5 △6.7
Others 0.3 0.5 0.8 0.3 0.5 0.8 +0.0Corporate and eliminations
△7.2 △7.3 △14.5 △8.2 △8.3 △16.5 △2.0
Operating income 31.5 27.4 58.9 26.5 24.5 51.0 △7.9
Ordinary income 33.1 27.9 61.1 27.5 25.5 53.0 △8.1
Income attributable to owners of parent 19.6 17.5 37.1 19.0 18.0 37.0 △0.1
(ref.)Exchange rate USD/JPY 111 111 111 110 110 110
(billion yen)
6. References

FY ended March 2018 Consolidated Financial Results 22
R&D
0.9 0.9 1.0 1.5 1.4
2.9 3.2 3.44.2 4.3
3.5 3.5 3.43.6 3.9
2.8 3.1 3.2
3.65.64.0
4.75.8
6.0
6.8
14.015.3
16.8
18.8
22.0
2015/3 2016/3 2017/3 2018/3 2019/3Forecast
Others/Corporate andeliminations
PyrotechnicDevices
Plastics
OrganicChemicals
CellulosicDerivatives
(billion yen)
6. References
FY ended March 2018 Consolidated Financial Results 23
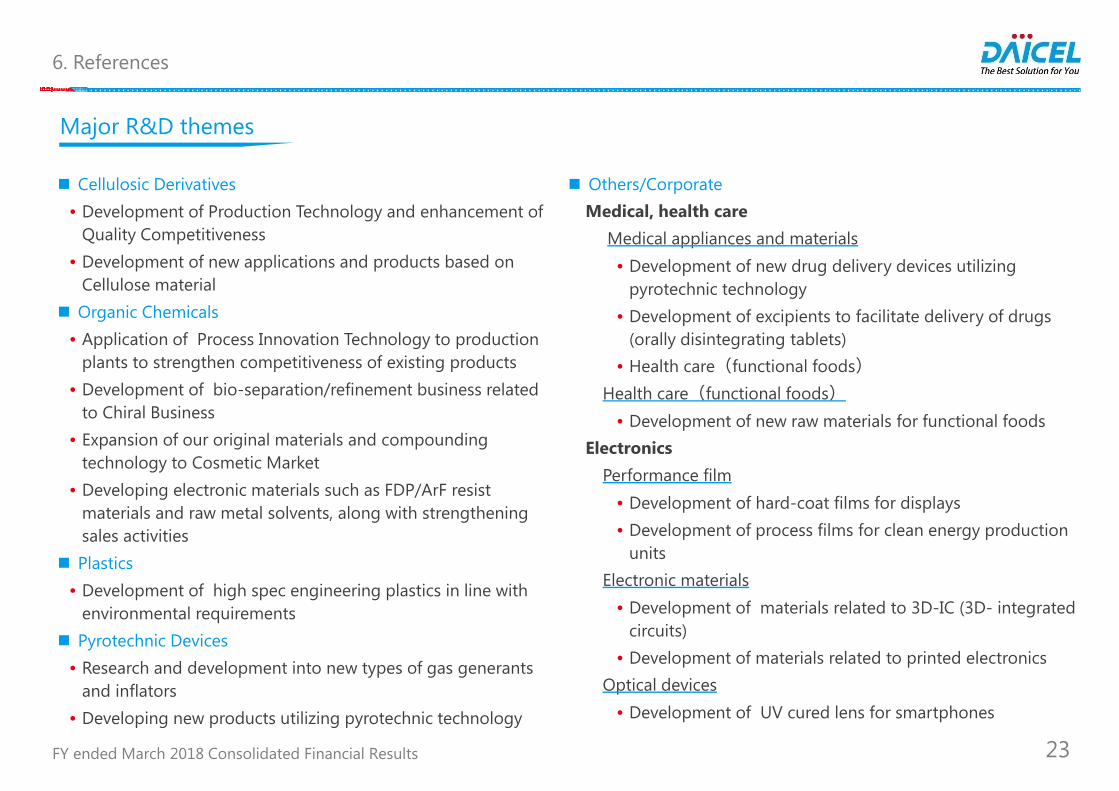
Major R&D themes
Others/CorporateMedical, health care
Medical appliances and materials• Development of new drug delivery devices utilizing
pyrotechnic technology• Development of excipients to facilitate delivery of drugs
(orally disintegrating tablets)• Health care(functional foods)
Health care(functional foods)• Development of new raw materials for functional foods
ElectronicsPerformance film
• Development of hard-coat films for displays• Development of process films for clean energy production
unitsElectronic materials
• Development of materials related to 3D-IC (3D- integrated circuits)
• Development of materials related to printed electronicsOptical devices
• Development of UV cured lens for smartphones
Cellulosic Derivatives• Development of Production Technology and enhancement of
Quality Competitiveness• Development of new applications and products based on
Cellulose material Organic Chemicals
• Application of Process Innovation Technology to production plants to strengthen competitiveness of existing products
• Development of bio-separation/refinement business related to Chiral Business
• Expansion of our original materials and compounding technology to Cosmetic Market
• Developing electronic materials such as FDP/ArF resist materials and raw metal solvents, along with strengthening sales activities
Plastics• Development of high spec engineering plastics in line with
environmental requirements Pyrotechnic Devices
• Research and development into new types of gas generantsand inflators
• Developing new products utilizing pyrotechnic technology
6. References
FY ended March 2018 Consolidated Financial Results 24
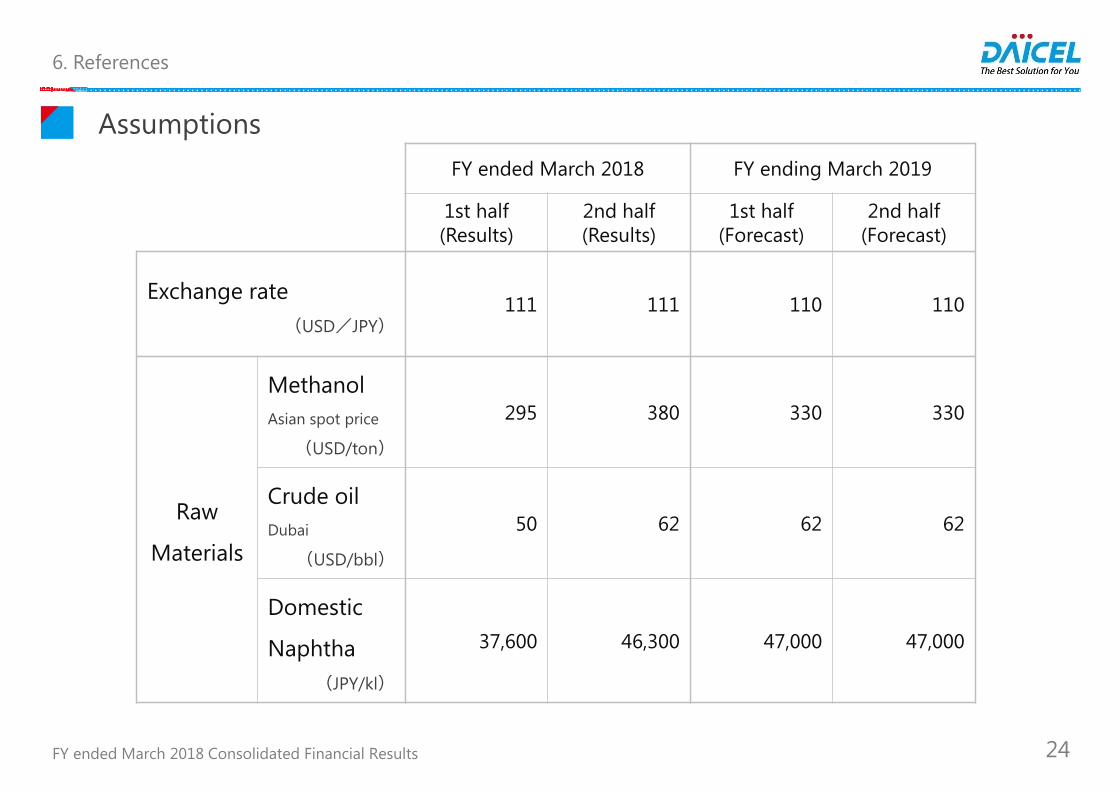
AssumptionsFY ended March 2018 FY ending March 2019
1st half(Results)
2nd half(Results)
1st half(Forecast)
2nd half(Forecast)
Exchange rate(USD/JPY)
111 111 110 110
Raw
Materials
MethanolAsian spot price
(USD/ton)
295 380 330 330
Crude oilDubai
(USD/bbl)
50 62 62 62
Domestic
Naphtha(JPY/kl)
37,600 46,300 47,000 47,000
6. References

25
Notes regarding Forward-Looking Statements
The purpose of this document is to provide information and not to persuade
any individual to take any action in response to the information contained in
this document. Daicel has made the greatest possible effort to prepare this
document with accurate information. The information in this document,
however, may be inaccurate and may involve risk, and we do not guarantee
the accuracy or reliability of this information.
The reader is advised that the use of the information in this document is at
your own risk. Any investment according to the prospects, target values, etc.
appearing in this document might result in a loss. Daicel accepts no
responsibility for such an eventuality.
All rights reserved by Daicel Corporation.
This document shall not be copied or distributed to a third party without the permission of Daicel Corporation.
FY ended March 2018 Consolidated Financial Results
FY ended March 2018 Consolidated Financial Results
Top Related