


Languages
Pages
Legal

Funding OpportunitiesPremium Transit CorridorsMOVING PROJECTS FORWARD
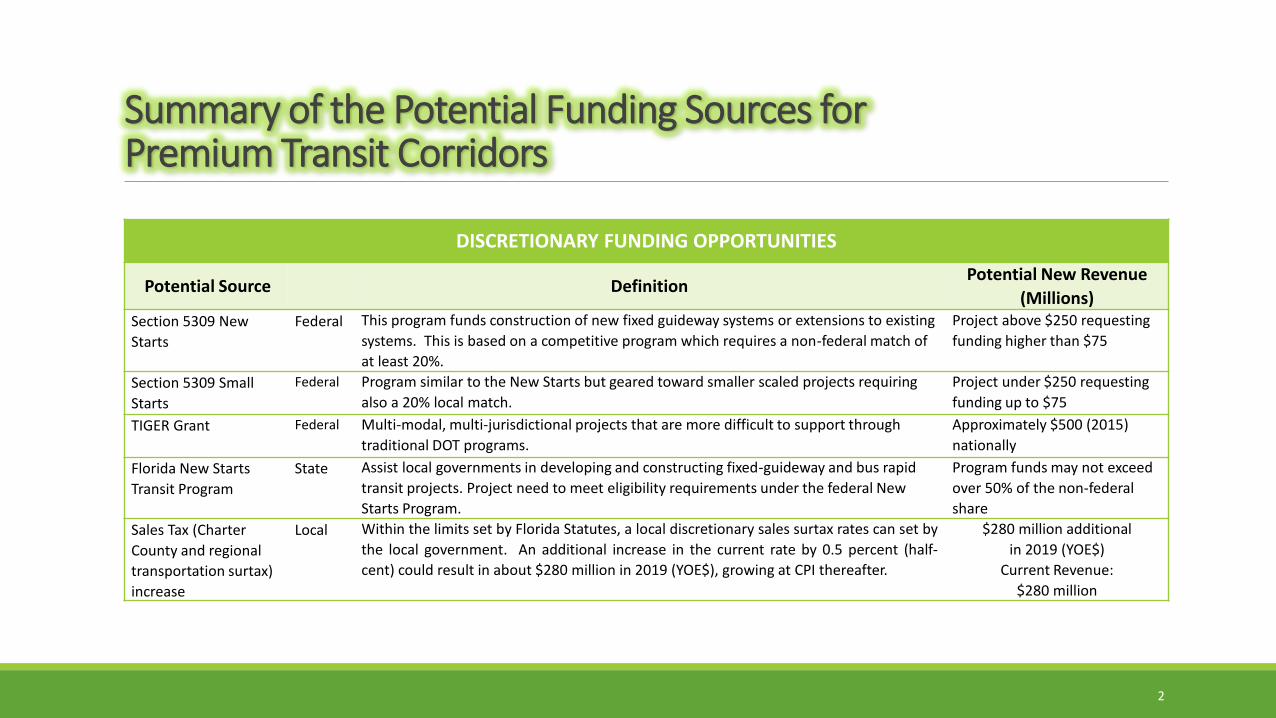
Summary of the Potential Funding Sources forPremium Transit Corridors
DISCRETIONARY FUNDING OPPORTUNITIES
Potential Source DefinitionPotential New Revenue
(Millions)Section 5309 New
Starts
Federal This program funds construction of new fixed guideway systems or extensions to existing
systems. This is based on a competitive program which requires a non-federal match of
at least 20%.
Project above $250 requesting
funding higher than $75
Section 5309 Small
Starts
Federal Program similar to the New Starts but geared toward smaller scaled projects requiring
also a 20% local match.
Project under $250 requesting
funding up to $75
TIGER Grant Federal Multi-modal, multi-jurisdictional projects that are more difficult to support through
traditional DOT programs.
Approximately $500 (2015)
nationally
Florida New Starts
Transit Program
State Assist local governments in developing and constructing fixed-guideway and bus rapid
transit projects. Project need to meet eligibility requirements under the federal New
Starts Program.
Program funds may not exceed
over 50% of the non-federal
share
Sales Tax (Charter
County and regional
transportation surtax)
increase
Local Within the limits set by Florida Statutes, a local discretionary sales surtax rates can set by
the local government. An additional increase in the current rate by 0.5 percent (half-
cent) could result in about $280 million in 2019 (YOE$), growing at CPI thereafter.
$280 million additional
in 2019 (YOE$)
Current Revenue:
$280 million
2

Summary of the Potential Funding Sources forPremium Transit Corridors
DISCRETIONARY FUNDING OPPORTUNITIES
Potential Source DefinitionPotential New Revenue
(Millions)Vehicle Mile Travel
(VMT) Tax State
Local
Application of VMT tax to replace the motor fuel-based taxes is now widely debatedamong state and federal government officials. If a $0.01 per mile (1 cent per mile) VMTtax is imposed, it is projected to generate about $137 million in revenue in 2019 (YOE$).The 2040 LRTP Travel Demand Forecast estimated an increase in countywide VTM fromweekday VMT of 42.2 million in 2010 to about 55.6 million in 2040.
$137 million additional
annual revenue
in 2019 (YOE$)
Current Revenue: $0
VMT Tax does not currently
exist
Additional Real
Property Ad Valorem
Tax
Local Property tax revenues are calculated by multiplying the Taxable Value by theadopted/forecasted millage for the fiscal year. An additional $0.25 per $1,000 of taxableproperty value (0.25 mills) charged on the top of the current County millage rate couldgenerate about $57 million in additional property tax revenue in 2019 growing with theCPI thereafter.
$57 million additional
in 2019
Current Revenue:
$ 1.37 billion
Local Option Gas Tax
(LOGT) increase
Local Within the limits set by Florida Statutes, County governments are authorized to levy a taxof 1 up to 5 cents on every net gallon of motor fuel sold within a county. The current rateis 3 cents per gallon of motor fuel. To impose an additional 2 cent per gallon tax wouldrequire an extraordinary vote of the county commission or a countywide referenduminitiated by the commission.
$20 million additional
in 2019
Current Revenue:
$21 million
3

Summary of the Potential Funding Sources forPremium Transit Corridors
DISCRETIONARY FUNDING OPPORTUNITIES
Potential Source DefinitionPotential New Revenue
(Millions)Miami-Dade County
Parking garages -
Additional Parking Fee
Local If an additional $0.50 per day fee (with no discounts) is imposed as a parking surcharge
for the existing 9,000 MDT spaces and 5,000 ISD spaces, it may generate additional $2
million annually provided all spaces are filled (but this projection does not address a loss
in transit ridership resulting from the increased cost of travel).
$2 million additional
in 2019
Current Revenue:
$2 million
Additional Hotel
Occupancy TaxLocal
State
Miami-Dade collects three types of hotel occupancy taxes or Transient Rental Taxes: a 2
percent Tourist Development Tax, a 3 percent Convention Development and 1 per cent
Professional Sports Franchise Tax. With the 6 percent Florida sales tax, Miami-Dade
would get an additional tourist tax of 6 percent bringing the total tax charged on the
hotel occupancy to 12 percent. An increase in tax rate by another 0.5% could generate
about $9 million in 2019 (YOE$).
$9 million additional
in 2019
Current Revenue:
$89 million
Transportation
Infrastructure Finance
and Innovation Act
(TIFIA)
Federal The Transportation Infrastructure Finance and Innovation Act (TIFIA) program provides
Federal credit assistance in the form of direct loans, loan guarantees, and standby lines
of credit to finance surface transportation projects of national and regional significance.
Based on project needs
4

Summary of the Potential Funding Sources forPremium Transit Corridors
DISCRETIONARY FUNDING OPPORTUNITIES
Potential Source DefinitionPotential New Revenue
(Millions)State of Florida
Infrastructure Bank
(SIB)
State The State Infrastructure Bank (SIB) can provide loans and other assistance to public and
private entities carrying out or proposing to carry out projects eligible for assistance
under state and federal law.
Based on project needs
Tolls:
Miami-Dade Expressway Authority
Turnpike Enterprise
Local Toll is a payment or fee exacted by the state and/or local authorities for some right or
privilege, as for passage along a road or over a bridge.
A toll revenue bond is used to build a public project such as a bridge, tunnel or
expressway. The principal and interest repayments are supplied by revenues from tolls
paid by users of the public project in question.
limited transit corridor
opportunities
Tax Increment
Financing (TIF)
Local A tax increment is the difference between the amount of property tax revenue
generated before TIF district designation and the amount of property tax generated after
TIP designation. Only property taxes generated by the incremental increase in value of
TIF district are available for TIF projects. Tax rates do not change when a TIF is created.
Under evaluation by CITT
5

Summary of Alternatives by Premium Transit Corridors
CORRIDOR
LOCALLY-PREFERRED ALTERNATIVE OR INITIAL VISION PER THE RECENT ACTIVITY TARGETED FUNDING SOURCE
TECHNOLOGYRIDERSHIP
(FORECAST YEAR)
CAPITAL COST
in $M (YEAR)TECHNOLOGY
CAPITAL COST IN
$M (YEAR)Federal State Local
AirportLink Metrorail 560 (2012) Completed
Beach 1 Light Rail ~ 17,000 (2025) 774 (2013) Light Rail 1 532 (2013)
Douglas Light Rail ~ 9,300 (2010) 310 (2013) BRT
East-West
(MIC to SW 8th
Street/SW 137th
Avenue)
Metrorail ~ 27,500 (2030) 2,300 (2019) Express Bus 2 25 (2015)
BRT 170 (2015)
CSX Commuter
Rail 3102+ (2015) Under Evaluation
North Metrorail ~ 9,600 (2012) 1,400 (2016) BRT 153 (2015)
Northeast 4 Commuter Rail ~ 36,000 (2035) 810 (2012) EBS 32 (2013)
Kendall BRT/DLRT ~ 7,000 (2030) 443 (2006) BRT 141 (2015)
South BRT/Metrorail + 3,200 (2030) 398 (2005) Under Evaluation
1: As of May 4, 2015, two cities and FDOT are pursuing different light rail portions.
2: Express bus is referred to as enhanced bus in the MPO’s TIP and LRTP.
3: Estimate for minimum operating segment and does not include cost of using / acquiring CSX right-of-way.
4: Capital cost estimate for Tri-Rail Coastal Link is (TRCL) for three counties.
6

Beach Corridor
Light Rail Transit Option
Direct Connection
Highlights
• Technology: LRT
• Corridor Length: 6.5 miles
• Est. Capital Cost: $532M (ROW not included)
• Est. Annual M&O Costs: $22M
• Est. Ridership: 17,000 (2025)
Current StatusThe Policy Executive Committee (PEC) approved Resolution #01-15 on May, 4, 2015:
• The project will be developed in three (3) stages, but will be compatible in terms of design, technology, fare collection and be operated and maintained by one entity.
• The project should be LRT operating on a dedicated lane.
• The cities of Miami and Miami Beach will proceed with their own environmental analysis.
7

Beach Corridor Funding Options
Other Potential Funding Sources
• Causeway Tolling(not favored by the parties involved)
• Additional parking fee
• Local Option Gas Tax (LOGT)
• Concessions/Advertising/Naming Rights
Proposed Potential Funding Sources for Value Capture(Beach Corridor Transit Connection Study)
• Tax Increment Financing yield: $18 million/year
• Special Assessment District yield: $12 million/year
• 1% local option surtax to the Tourist and Convention Development Tax yield: $10 million/year
• Total: ~$40 million/year
Potential Funding Sources
• Local Funds
Citizens Independent Transportation Trust (CITT)
City of Miami
City of Miami Beach
• StateLimited participation
• FederalVery limited or no participation due to the fact the cities are not following a federal process
8

Douglas CorridorHighlights
• Technology: BRT
• Corridor Length: 5.5 miles
• Est. Capital Cost: $55M (ROW not included)
• Est. Annual M&O Costs: $2.1M
• Current Daily Ridership: 4,046 passengers (May 2015)
Current StatusThe Bus Rapid Transit (BRT) Implementation Plan along Transit Corridors requested by the MPO Governing Board on Summer 2014 was completed in in April 2015.
• Pending for additional actions:
Development of PD&E
Funding
Moving to design, ROW acquisition and construction
MIC
Douglas Rd. Metrorail Station
NW
37
thA
ve.
SR-836
SW 8th St.
SW 22nd St.
9

Douglas Corridor Funding Options
Other Potential Funding Sources
• Tax Increment Financing (TIF) District
• Special Assessment District
• Business Improvement Districts (BID)
• Local Option Gas Tax (LOGT)
• Transportation Alternative Program (TAP)
• National Highway System (NHS)
• Strategic Intermodal System (SIS)
• State Transit Block Grant
• Additional parking fee
• Concessions/Advertising/Naming Rights
• P-3 (As a delivery mechanism)
Potential Funding Sources
• Local Funds
County (CITT – Sales Tax)
City of Miami Proposed Transportation Trust
• State
Florida New StartsUp to 50% of non-federal share
State Infrastructure Bank (SIB)
• Federal
Small StartsUp to $75M – 20% local match
Urban Funds
TIFIA Loan
SW 37 Avenue – just south of Flagler StreetNot to scale – for illustrative purposes
10
South Link - Busway
11
• The South Link Study was completed in 2005. The Locally Preferred Alternative (LPA) included:
Metrorail Extension to SW 104th Street - $101.6M
Enhanced BRT from SW 104th Street to Homestead - $210.0M
Grade Separation - $86M
Total - $397M
• Alternative to extend Metrorail to Homestead - $1.6B
Current Status
• South Link Update
Evaluate the alternatives considered in 2005
and update the costs
Analyze pros and cons for each alternative
Tentatively to be completed by First Quarter
of 2016
• Evaluation of Multimodal Options in South Miami-Dade
To identify and evaluate transit, roadway and non-motorized
improvements to develop a transportation plan for the area.
Tentatively to be completed by Fall of 2016

Busway Recommendations
Recommendations
• Improve existing services along the Busway
Maximize exiting resources
Implement a trunk and feeder system along the corridors
• Complete the two proposed studies
South Link Update
Evaluation of Multimodal Options in South Miami-Dade
• Based on the results of the studies, select a Locally Preferred Alternative (LPA)
Funding Sources
• LPA shall identify potential funding sources, as appropriate.
• Re-evaluate alternative proposed by MDX
12
• Move to:
PD&E
Design
ROW Acquisition
Construction
Operation
Possible simultaneously implementation of Douglas and the Busway Corridors
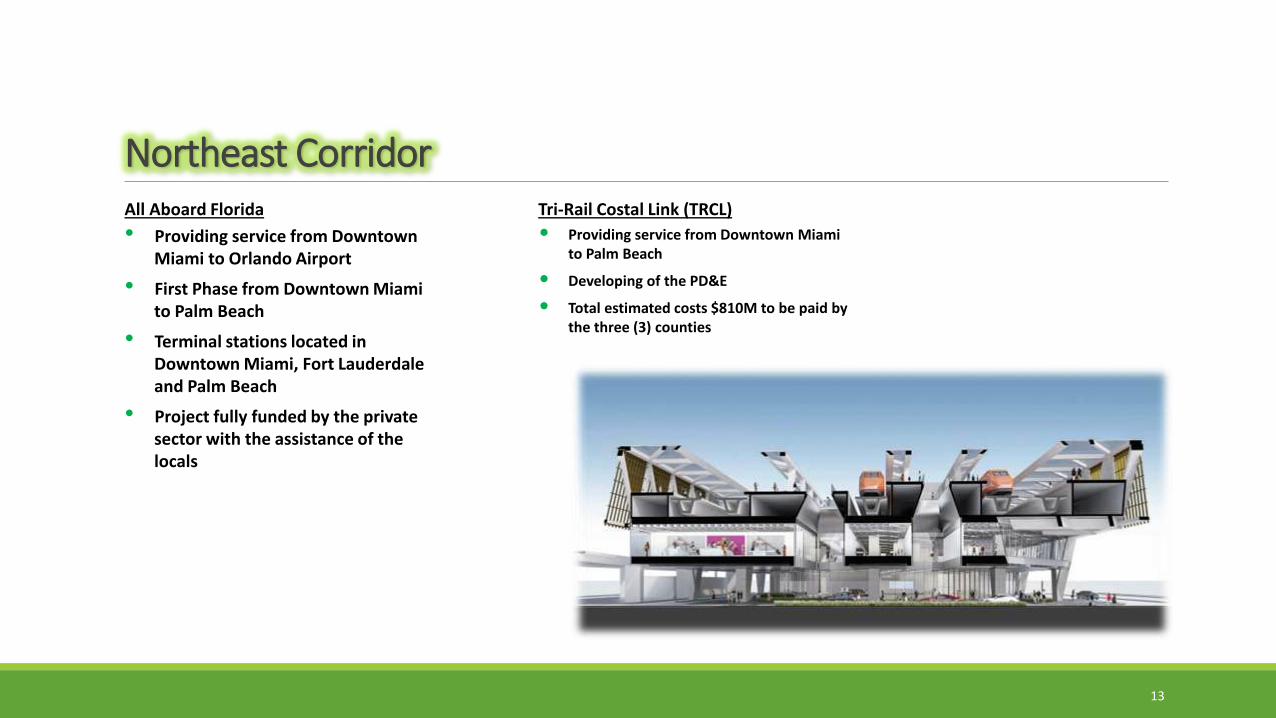
Northeast CorridorAll Aboard Florida
• Providing service from Downtown Miami to Orlando Airport
• First Phase from Downtown Miami to Palm Beach
• Terminal stations located in Downtown Miami, Fort Lauderdale and Palm Beach
• Project fully funded by the private sector with the assistance of the locals
Tri-Rail Costal Link (TRCL)
• Providing service from Downtown Miami to Palm Beach
• Developing of the PD&E
• Total estimated costs $810M to be paid by the three (3) counties
13

East-West Corridor
CSX Commuter Services
• Study underway
MIC to NW 107th Avenue
Minimum Operating Service
Preliminary estimated capital cost about $102M
ROW costs are not included
• Need to negotiate with CSX the acquisition of the ROW
SR-836 Express Bus Service
• This project is fully funded through state and local funds
• Expected to be in operation by the end of 2017
14
Flagler StreetFIU
SR-836
Downtown
Miami
NW 12th St.
MIC
This corridor includes three components:
• BRT on Flagler Street (already discussed)
• SR-836 Express Bus Service
• CSX Commuter Services

Flagler Street CorridorHighlights
• Technology: BRT
• Corridor Length: 12.0 miles
• Est. Capital Cost: $170M (ROW not included)
• Est. Annual M&O Costs: $6.4M
• Current Daily Ridership: 10,768 passengers (May 2015)
Current StatusIn February 19, 2015, the MPO Governing Board approved under Resolution #01-15 the development of the Project Development and Environmental (PD&E) for this corridor. This PD&E will be conducted by FDOT in coordination with Miami-Dade transit (MDT) and the MPO.
• Pending for additional actions:
Development of the Scope of Services
Initiate consultant selection process
Start PD&E scheduled for First Quarter of 2016
Flagler Street
FIU
SR-836 Downtown
Miami
Flagler Street – east of NW 37 AveNot to scale – for illustrative purposes
15
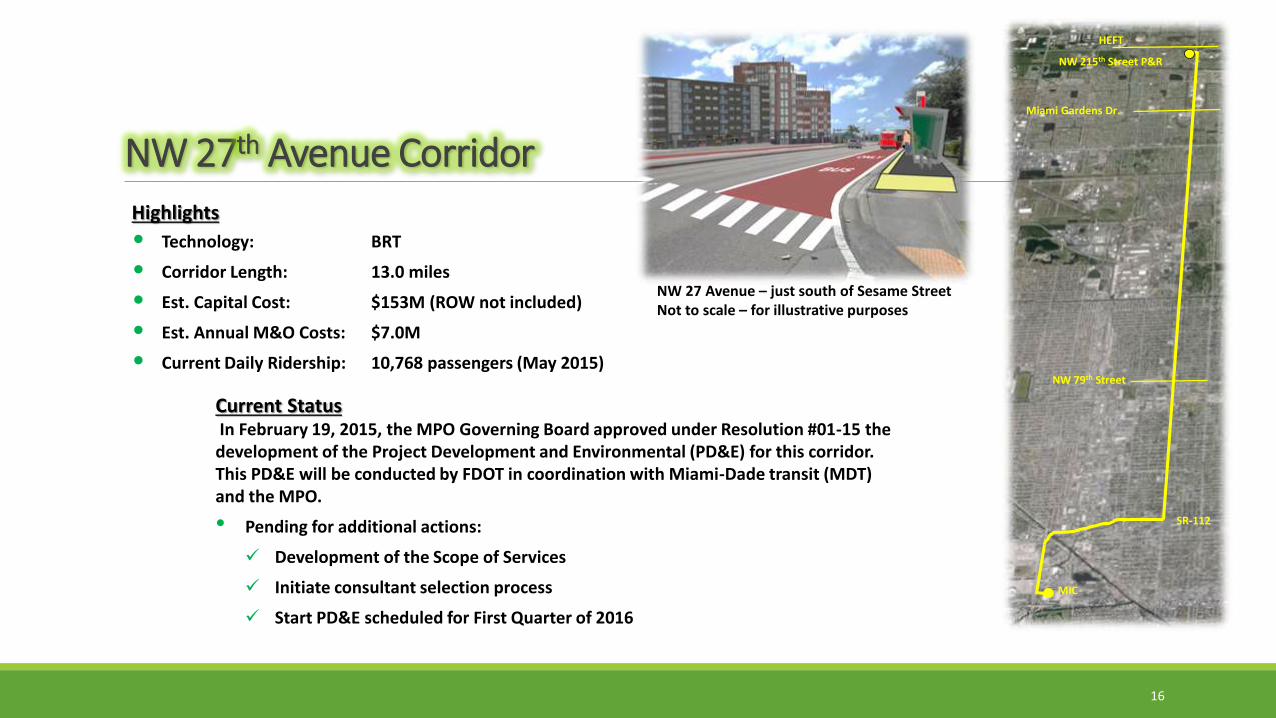
NW 27th Avenue CorridorHighlights
• Technology: BRT
• Corridor Length: 13.0 miles
• Est. Capital Cost: $153M (ROW not included)
• Est. Annual M&O Costs: $7.0M
• Current Daily Ridership: 10,768 passengers (May 2015)
Current StatusIn February 19, 2015, the MPO Governing Board approved under Resolution #01-15 the development of the Project Development and Environmental (PD&E) for this corridor. This PD&E will be conducted by FDOT in coordination with Miami-Dade transit (MDT) and the MPO.
• Pending for additional actions:
Development of the Scope of Services
Initiate consultant selection process
Start PD&E scheduled for First Quarter of 2016
NW 215th Street P&R
MIC
SR-112
HEFT
Miami Gardens Dr.
NW 79th Street
NW 27 Avenue – just south of Sesame StreetNot to scale – for illustrative purposes
16
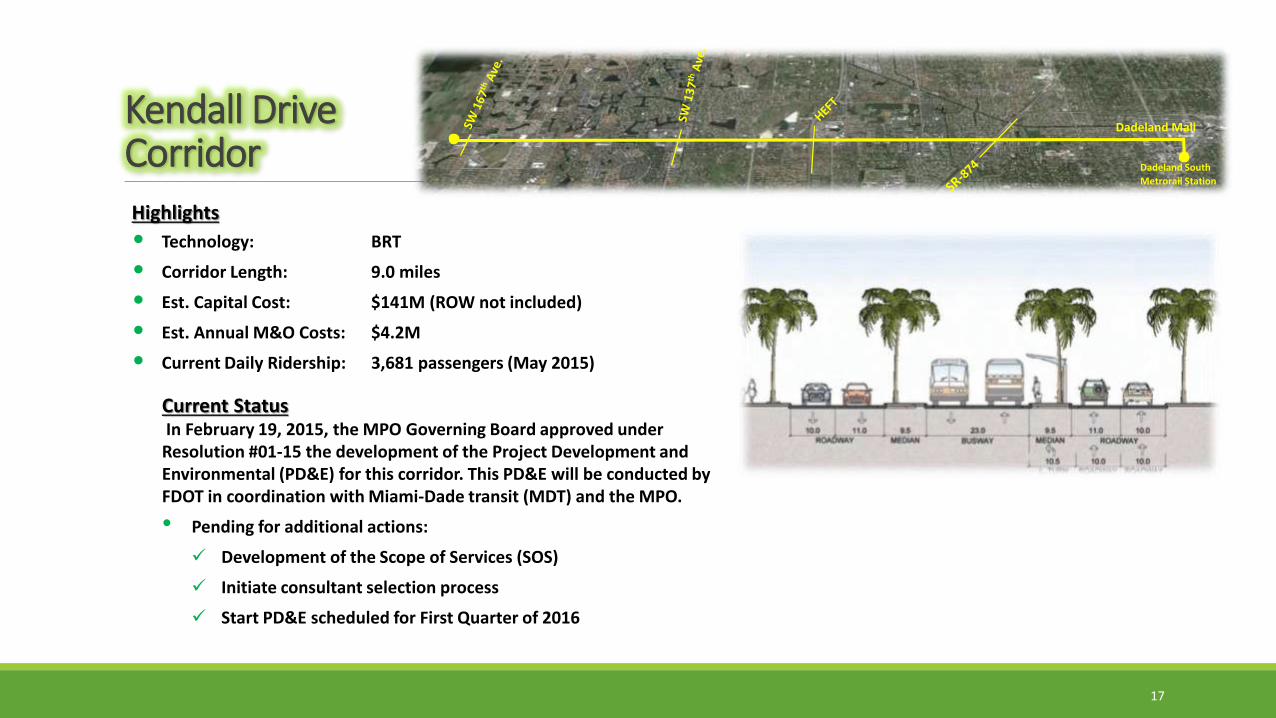
Kendall Drive CorridorHighlights
• Technology: BRT
• Corridor Length: 9.0 miles
• Est. Capital Cost: $141M (ROW not included)
• Est. Annual M&O Costs: $4.2M
• Current Daily Ridership: 3,681 passengers (May 2015)
Current StatusIn February 19, 2015, the MPO Governing Board approved under Resolution #01-15 the development of the Project Development and Environmental (PD&E) for this corridor. This PD&E will be conducted by FDOT in coordination with Miami-Dade transit (MDT) and the MPO.
• Pending for additional actions:
Development of the Scope of Services (SOS)
Initiate consultant selection process
Start PD&E scheduled for First Quarter of 2016
17
Dadeland Mall
Dadeland South
Metrorail Station

Funding Options for Implementing BRTs
18
The proposed funding sources does not preclude or limit the use of other available funding sources for the implementation of thethree (3) BRTs. These funds may include:
• Special Assessment District
• Business Improvement Districts (BID)
• Transportation Alternative Program (TAP)
• State Transit Block Grant
• Additional parking fee
• Additional hotel Occupancy Tax
• Concessions/Advertising/Naming Rights
• P-3 (As a delivery mechanism)
• Florida New Starts - Up to 50% of non-federal share
• Federal Small Starts - Up to $75M – 20% local match
• Local Option Gas Tax (LOGT) - Could generate $20M/year
• State Infrastructure Bank (SIB)
• Transportation Infrastructure Finance and Innovation Act TIFIA Loan
• Tax Increment Financing (TIF) District Currently, CITT is conducting corridor studies
• Use of tolls revenues for capital costs related to the implementation of transit premium projects:
FDOT – Managed Lanes
Florida Turnpike Enterprise
Miami-Dade Expressway Authority (MDX)

THANK YOU!
19
Top Related