


Languages
Pages
Legal

FUNDING MODELS FOR THE FINANCING OF WATER INFRASTRUCTURE IN
SOUTH AFRICA: A FRAMEWORK AND COMPARATIVE ANALYSIS OF
ALTERNATIVES
A Research Report
presented to the
Graduate School of Business Leadership
University of South Africa
In partial fulfilment of the
requirements for the
MASTERS DEGREE IN BUSINESS ADMINISTRATION,
UNIVERSITY OF SOUTH AFRICA
by
CORNELIUS RUITERS
(Student Number: 72065648)
MAY 2011

2
DECLARATION
I, Cornelius Ruiters, declare that this thesis is my own, unaided work. It is being submitted in
partial fulfillment of requirements for the Masters Degree in Business Administration (MBA)
in the University of South Africa, Pretoria. It has not been submitted before for any degree or
examination in any other University.
___________________________
02 day of May 2011

3
Acknowledgement
I would like to extent my sincere gratitude to the staff members of the following
organisations who avail themselves to be interviewed, participated in the focus workshops
and answered the questionnaire:
• Department of Water Affairs
• Department of Cooperative Governance and Traditional Affairs (National)
• Department of Cooperative Governance and Traditional Affairs (KwaZulu-Natal
Province)
• Department of Local Government and Housing (Limpopo Province)
• Department of Energy
• Department of Public Enterprises
• Department of Trade and Industry
• National Treasury
• Trans-Caledon Tunnel Authority
• Komati Basin Water Authority
• Lesotho Highland Development Agency
• ESKOM
• SASOL
• Industrial Development Corporation
• South African Local Government Association and Municipalities
• Banking Council of South Africa
• Development Bank of Southern African
• World Bank
• Development experts
• Water Boards, i.e. Umgeni Water Board, Rand Water, and Mhlathuze Water Board
Thanks goes to all those who have encouraged me with this study and given the necessary
technical assistance, where needed.

4
Executive Summary
Following two decades of under-investment, vital elements of South African water
infrastructure is in serious disrepair, if not in a crisis. The government is challenged by the
cumulative demands of sustained economic growth; as well as the new trade and investment
opportunities in the post-financial crisis period. There is a serious backlog in water
infrastructure investment, for the development and management of water resources and water
services. This under-investment is estimated at more than R110 billion. The three spheres of
government – national, provincial and local– which have served South Africa well in past
decades now appear unable and ill-equipped to grapple with the present planning and
delivery challenge.
Water infrastructure investment began to decline in the 1990s as the South African
governments increased the share of public consumption expenditure in their budgets at the
expense of public investment. Fiscal policies of budget surpluses and debt reduction have
reinforced this decline. Government capital expenditure as a share of GDP, which was
around 7.2 per cent in the early 1990s, has now fallen to a low of 3.6 per cent of GDP.
Government has been the main provider of infrastructure in South Africa and remains so in
the water sector. Government administration and institutional structures continue to shape
and influence infrastructure investment. South Africa’s constitutional system of government
imposes unique complexities and constraints on infrastructure investment compared with
many other countries. The national government (national treasury) traditionally had a pivotal
role in shaping water infrastructure investment. The interplay of governments’ fiscal policies
of budget surplus/debt reduction and political considerations present an apparently
insurmountable obstacle to overcoming the backlog in South Africa’s infrastructure – and in
putting in place fresh institutional structures and funding models for effective strategies
leading to prompt water infrastructure provision.
This research project identified a number of funding models (14) for the financing of water
infrastructure development projects. However, the classic public provision model of
government planned, installed and financed infrastructure with pricing at marginal cost or on
a loss–making basis – with returns recovered through the taxation system – continues to
characterise much of South Africa’s publicly provided water infrastructure. Nowadays, water
infrastructure is split between fully public, and mixed ownership (water agencies and/or
entities); Public-Private Partnerships (PPP) in the water sector is not yet a full reality. Further
innovation in water infrastructure investment, including closing the circle between public and

5
private-sector capital, is required. Complex issues of pricing, access, public policy and
regulation, risk–sharing, tendering processes, taxation and governance have arisen as key
challenges that will influence whether private provision of water infrastructure can grow as a
viable new model in South Africa. Sustainability has introduced a further new dimension
into the calculus of water infrastructure provision. Thus, a framework that takes account of
environmental and social aspects, as well as economic aspects, is now widely accepted as
necessary.
Although water user tariffs of various types partially fund some of the water infrastructure,
the link between cost and use is not well-established in the public’s mind. Reinforcing this
relationship could lead to conservation measures and would also make it much easier to
create stable funding vehicles that do not depend solely on the national revenue fund/general
tax revenues. In order to encourage funding vehicles that use private or non-government
funds, the initiatives should be encouraged, i.e. investment banks, commercial banks, public
water agencies and entities. The government should also create a stable investment
environment through political commitment (but not interference), consistency, a regular and
predictable flow of deals, and suitable framing legislation. This will ensures life cycle
costing and the establishment of true user costs. A reasonable transfer of risk to the public
sector should be a minimum government requirement of any partnership with the private
sector. The well-established link between investment in public infrastructure and economic
competitiveness means South Africa must act now if it is to avoid a widening water
infrastructure gap.
6
Key Words
Department of Water Affairs
Funding models
Infrastructure deficit
Infrastructure development and rehabilitation
Infrastructure funding gap
Medium Term Expenditure Framework
National Revenue Fund
National Treasury
Operations and maintenance
Public Entities and Agencies
Public-Private Partnerships
Private sector markets
Raw Water Pricing Strategy
Return on Investment
Socio-economic growth and infrastructure
Water charges
Water tariffs
Water infrastructure

7
TABLE OF CONTENTS
DECLARATION ................................................................................................................. 2
ACKNOWLEDGEMENT .................................................................................................. 3
EXECUTIVE SUMMARY ................................................................................................. 4
KEY WORDS ...................................................................................................................... 6
LIST OF FIGURES .......................................................................................................... 12
LIST OF TABLES ............................................................................................................ 13
GLOSSARY OF TERMS AND CONCEPTS .................................................................. 14
ABBREVIATIONS AND ACRONYMS .......................................................................... 18
CHAPTER 1: INTRODUCTION ................................................................................. 21
1.1 BACKGROUND ..................................................................................... 21
1.2 THE PROBLEM IN CONTEXT ........................................................................ 22
1.3 PROBLEM REVIEW ..................................................................................... 24
1.4 PROBLEM STATEMENT ............................................................................... 24
1.4.1 Choosing the problem .............................................................................. 24
1.4.2 Problem overview .................................................................................... 25
1.5 RESEARCH OBJECTIVES ............................................................................. 25
1.6 IMPORTANCE/BENEFITS OF THE STUDY ....................................................... 26
1.7 LIMITATIONS AND DELIMITATIONS ............................................................ 26
CHAPTER 2: PROBLEM ANALYSIS AND THEORETICAL CONSIDERATIONS . 28
2.1 INTRODUCTION ......................................................................................... 28
2.2 PROBLEM ANALYSIS .................................................................................. 28
2.2.1 The extent of the problem ......................................................................... 28
2.2.2 The necessary investment in water infrastructure ..................................... 29
2.2.3 Economic growth and infrastructure ........................................................ 29
2.2.4 The decline in infrastructure investment ................................................... 30
2.2.5 Government involvement .......................................................................... 30
2.3 PROBLEM STATEMENT OBJECTIVES ............................................................ 31
2.4 PROBLEM REVIEW THEMES ........................................................................ 31

8
2.3 THEORETICAL CONSIDERATIONS ............................................................... 32
2.3.1 Concept of the Current Water Infrastructure Funding Models .................. 32
2.3.2 Financial analyses ................................................................................... 33
2.3.2.1 General principles for application of financial analyses ........................... 34
i) Financial analyses for a social (municipal water supply) project ........... 34
ii) Financial analyses for project with different sponsorships ..................... 34
iii) Financial analyses with multiple financing sources ............................... 35
iv) Financial analyses of multi-unit and multi-purpose infrastructure
programme .............................................................................................. 35
v) Cost allocations and subsidies ................................................................. 35
vi) Financial analyses of commercial schemes ............................................. 35
2.3.3 Economic analysis .................................................................................... 36
i) Local infrastructure costs as a consideration in economic analysis .......... 36
ii) Allocation of costs of multi-purpose projects ............................................ 36
iii) Models for estimating economic effects due to infrastructure development 36
2.4 INFORMING THE QUESTIONNAIRE AND DEVELOPING THE BUSINESS CASE ..... 37
2.5 CONCLUSION ............................................................................................ 37
CHAPTER 3: LITERATURE REVIEW ........................................................................ 38
3.1 INTRODUCTION ......................................................................................... 38
3.2 LITERATURE REVIEW AND IDENTIFYING OF METHODOLOGIES ...................... 38
3.3 THEORY BASE OF THE RESEARCH PROJECT ................................................ 39
3.3.1 Perspective on funding of water infrastructure and development .............. 39
3.3.2 Water infrastructure conditions in South Africa ........................................ 43
3.3.2.1 Water infrastructure conditions................................................................ 43
3.3.2.2 Water sector value chain and funding in South Africa ............................. 44
3.3.3.2 The Economic Issues of Water Infrastructure Implementation ................. 45
3.4 CONCLUSION ............................................................................................ 46
CHAPTER 4: RESEARCH METHODS ......................................................................... 47
4.1 INTRODUCTION ......................................................................................... 47
4.2 POPULATION AND SAMPLE ......................................................................... 47
4.3 DATA COLLECTION METHODS .................................................................... 48
4.3.1 Primary data collection ............................................................................ 49
4.3.2 Secondary data collection ........................................................................ 51

9
4.3.3 Data types ................................................................................................ 51
4.3.4 Data validation ........................................................................................ 54
4.4 RELIABILITY AND VALIDITY ISSUES ........................................................... 55
4.4.1 Reliability ................................................................................................ 55
4.4.2 Validity including threats to validity/improving validity ........................... 55
4.5 DATA ANALYSIS ........................................................................................ 56
4.5.1 Descriptive and Inferential statistics ........................................................ 57
4.5.1.1 Descriptive statistics ................................................................................ 57
4.5.1.2 Inferential Statistical Analysis ................................................................. 57
4.6 CONCLUSION ............................................................................................ 57
CHAPTER 5: RESEARCH RESULTS ........................................................................ 59
5.1 INTRODUCTION ......................................................................................... 59
5.2 PRINCIPLES FOR THE FUNDING MODELS ...................................................... 59
5.3 IDENTIFYING THE FUNDING MODELS FOR WATER INFRASTRUCTURE .......... 62
5.3.1 Funding by the National Revenue Fund (on-budget) – Water Resources
Infrastructure ........................................................................................... 63
5.3.2 Funding through grants (MIG, RBIG, Equitable Share; Conditional Grants)
from the National Revenue Fund (on-budget) - Water Services
Infrastructure ........................................................................................... 65
5.3.2.1 Municipal Infrastructure Grant (MIG) ..................................................... 65
5.3.2.1.1 Municipal infrastructure delivery and management failure ............ 66
5.3.2.1.2 Required Expenditure by Infrastructure type .................................. 70
5.3.2.1.2.1 Capital requirements ................................................................... 70
5.3.2.1.2.2 Operating requirements .............................................................. 71
5.3.2.2 Regional Bulk Infrastructure Grant (RBIG) ............................................. 72
5.3.2.3 Equitable Share and Conditional Grants .................................................. 74
5.3.2.4 Infrastructure Operations and Maintenance Grants .................................. 75
5.3.3 Funding through the development of a tariff model (via balance sheet) -
Public Entities and other Agencies ........................................................... 75
5.3.3.1 Pricing Strategy for Water Use Charges .................................................. 75
5.3.3.2 Marginal Cost of Water .......................................................................... 80
5.3.3.2.2 Bulk Water Tariffs ............................................................................. 83
5.3.3.2.3 Municipal Water Tariffs .................................................................... 84
5.3.3.2.3.1 Residential Domestic Water Tariffs ............................................ 84
10
5.3.3.2.3.2 Commercial Water Tariffs .......................................................... 86
5.3.3.2.3.3 Industrial Water Tariffs .............................................................. 88
5.3.3.2.3.4 Comparison of Municipal Water Tariffs .................................... 89
5.3.3.3 National Water Tariff ............................................................................... 89
5.3.3.3 Water Trading Entity ............................................................................... 91
5.3.3.3.1 Water infrastructure management .................................................. 91
5.3.3.3.2 Revenue management and benchmarking ........................................ 92
5.3.3.4 Water Boards .......................................................................................... 93
5.3.4 Funding through the raising of funds on the financial markets (off-budget) -
Special Purpose Vehicle ........................................................................... 94
5.3.4.1 Trans- Caledon Tunnel Authority (TCTA) .............................................. 94
5.3.4.2 Komati Basin Water Authority ................................................................ 96
5.3.5 Funding through Private-Public-Partnerships .......................................... 96
5.3.6 Funding through private sector markets ................................................... 97
5.3.6. 1 Private sector investment tools ................................................................. 98
5.3.6. 2 Pension funds and infrastructure investment ............................................. 98
5.3.6. 3 Dedicated financial institution for infrastructure ....................................... 99
5.3.7 Demand (market) risk funding model for water infrastructure .................. 99
5.3.8 Innovative financing models ................................................................... 101
5.4 ALTERNATIVE FUNDING MODELS ............................................................. 103
5.5 COMPARATIVE ANALYSIS: SOLVING THE WATER INFRASTRUCTURE PROBLEM
............................................................................................................... 109
5.6 CONCLUSION .......................................................................................... 110
CHAPTER 6: DISCUSSION ......................................................................................... 114
6.1 MODELS OF WATER INFRASTRUCTURE PROVISION .................................... 114
6.2 CHARACTERISTICS AND CRITERIA OF A FUNDING BUSINESS MODEL ........... 115
6.2.1 Funding of the First Generation of Water Infrastructure ........................ 116
6.2.2 Funding Models for National Level Water Infrastructure ....................... 116
6.2.3 Funding Models for Local Level water infrastructure ............................. 118
6.2.4 Funding Models for Regional Level Water Infrastructure ....................... 119
6.3 FUNDING THROUGH WATER TARIFFS ........................................................ 119
6.4 FUNDING THROUGH PUBLIC-PRIVATE PARTNERSHIPS (PPP) ..................... 120
6.5 FUNDING THROUGH PRIVATE SECTOR MARKETS ....................................... 121
6.6 DEMAND (MARKET) RISK MANAGEMENT .................................................. 121
11
6.7 INNOVATIVE AND ALTERNATIVE FUNDING/FINANCING MODELS ................ 123
6.8 FINANCIAL AND ECONOMIC ANALYSES, REQUIREMENTS INSTRUMENTS ..... 124
6.8.1 Financial analyses and requirements ..................................................... 124
6.8.2 Economic analyses and requirements ..................................................... 124
6.9 COMPARATIVE ANALYSIS ........................................................................ 127
6.9 CONCLUSION .......................................................................................... 129
CHAPTER 7: CONCLUSIONS AND RECOMMENDATIONS .............................. 130
7.1 CONCLUSIONS ......................................................................................... 130
7.1.1 Investment and maintenance backlogs .................................................... 130
7.1.2 Recent government initiatives ................................................................. 131
7.1.3 Finding the money (Funding Models) ..................................................... 133
7.1.4 How will the government implement the new investment strategies? ....... 133
7.2 RECOMMENDATIONS ............................................................................... 134
REFERENCES ................................................................................................................ 140
APPENDICES ................................................................................................................. 151
APPENDIX 1: POSSIBLE FUTURE LARGE-SCALE WATER RESOURCE DEVELOPMENTS,
PRIMARILY FOR DOMESTIC, URBAN, INDUSTRIAL OR MINING PURPOSES ..... 151
APPENDIX 2: POSSIBLE FUTURE LARGE-SCALE WATER RESOURCE DEVELOPMENTS,
PRIMARILY FOR IRRIGATION PURPOSES ..................................................... 152
APPENDIX 3: QUESTIONNAIRE FOR THE COLLECTION DATA FOR THE DEVELOPMENT OF
FUNDING MODEL FOR WATER INFRASTRUCTURE ....................................... 153
APPENDIX 4: MODELS AND DEFINITIONS OF GENERIC RANGE OF NON-TRADITIONAL DELIVERY
............................................................................................................... 159
APPENDIX 5: STANDARDISED ASSUMPTIONS FOR THE CALCULATIONS OF UNIT REFERENCE
VALUES (URV) OR MARGINAL COST FOR WATER INFRASTRUCTURE PROJECTS
(AFTER BASSON, 2010) ............................................................................ 162

12
LIST OF FIGURES
FIGURE 3.1: WATER SECTOR VALUE IN SOUTH AFRICA ....................................................................... 44
FIGURE 4.1: FINANCIAL (FUNDING) INFORMATION MANAGEMENT PROCESS WATER CHARGES/TARIFFS.
.............................................................................................................................................................. 50
FIGURE 5.1: NATIONAL WATER INFRASTRUCTURE FRAMEWORK POLICY WITH KEY PERFORMANCE
INDICATORS FOR WATER INFRASTRUCTURE IN SOUTH AFRICA. ........................................................... 60
FIGURE 5.2: MAIN FUNDING FLOWS FOR WATER INFRASTRUCTURE IN SOUTH AFRICA. ..................... 64
FIGURE 5.3: MUNICIPAL FINANCIAL FRAMEWORK FOR WATER INFRASTRUCTURE AT LOCAL
GOVERNMENT. ....................................................................................................................................... 66
FIGURE 5.4: CAPITAL EXPENDITURE PER INFRASTRUCTURE CLASS AT MUNICIPAL LEVEL. ................. 67
FIGURE 5.5: REQUIRED CAPITAL EXPENDITURE VERSUS AVAILABLE FUNDING. ................................. 68
FIGURE 5.7: FUNDING SURPLUS/SHORTFALL OVERALL AND PER MUNICIPAL SERVICE........................ 70
FIGURE 5.8: THE WATER COST AND PRICING FOR WATER SUPPLY AND WATER INFRASTRUCTURE IN
SOUTH AFRICA. ..................................................................................................................................... 78
FIGURE 5.9: FUNDING AND COST RECOVERY FOR WATER INFRASTRUCTURE IN SOUTH AFRICA. ....... 78
FIGURE 5.10: FUNDING OF WATER INFRASTRUCTURE THROUGH THE BALANCE SHEET (TARIFF MODEL
AND PRIVATE SECTOR MARKETS, IF NEEDED) IN SOUTH AFRICA.......................................................... 79
FIGURE 5.11: DIFFERENT TARIFF STRUCTURES FOR WATER USING DIFFERENT WATER
INFRASTRUCTURE .................................................................................................................................. 79
FIGURE 5.12: TOTAL COST OF THE BUSINESS FOR THE WATER SUPPLY INFRASTRUCTURE .................. 83
FIGURE 5.13: THE AVERAGE PROVINCIAL TARIFFS FOR COMMERCIAL AND INDUSTRIAL USERS. ........ 87
FIGURE 5.14: THE AVERAGE MUNICIPAL WATER SUPPLY TARIFFS FOR DOMESTIC USERS ARE SHOWN
PER PROVINCE. ...................................................................................................................................... 90
FIGURE 5.15: REMAINING USEFUL LIFE (RUL) OF WATER INFRASTRUCTURE IN SOUTH AFRICA. ....... 90
FIGURE 5.16: OPERATIONS MODEL OF TCTA FOR THE IMPLEMENTATION OF WATER INFRASTRUCTURE
PROJECTS. .............................................................................................................................................. 95
FIGURE 5.17: PROMOTER FINANCE AND FINANCE MODELS FOR PUBLIC-PRIVATE PARTNERSHIPS FOR
WATER INFRASTRUCTURE DEVELOPMENT IN SOUTH AFRICA. .............................................................. 97
FIGURE 5.18: RISK MODEL FOR THE WATER INFRASTRUCTURE DEVELOPMENT PROJECTS IN SOUTH
AFRICA. ............................................................................................................................................... 100
FIGURE 5.19: WATER INFRASTRUCTURE FUNDING FLOW PROCESS. .................................................. 101
FIGURE 5.20: POSSIBLE FUNDING BUSINESS MODEL FOR WATER INFRASTRUCTURE (ADOPTED FROM
CASADESUS-MASANELL AND RICART, 2011) ..................................................................................... 102

13
LIST OF TABLES
TABLE 4.1: REPRESENTATIVE SAMPLE OF SECONDARY STUDIES AND/OR REPORTS USED IN THE
RESEARCH. ........................................................................................................................... 52
TABLE 5.1: CURRENT LEVELS OF ACCESS TO BASIC SERVICES ............................................. 65
TABLE 5.2: CAPITAL REQUIREMENTS (RAND BILLIONS) OF HIGH, MEDIUM, LOW CAPACITY
MUNICIPALITIES ................................................................................................................... 71
TABLE 5.3: OPERATING REQUIREMENTS (RAND BILLIONS) OF HIGH, MEDIUM, LOW CAPACITY
MUNICIPALITIES. .................................................................................................................. 72
TABLE 5.4: FUNDING REQUIREMENTS AGAINST CURRENT BUDGET ALLOCATIONS PER
CATEGORY (IN RAND BILLIONS) ............................................................................................ 73
TABLE 5.5: USER FEES FOR WATER INFRASTRUCTURE FACILITIES ......................................... 80
TABLE 5.6: USING A HYPOTHETICAL EXAMPLE ONE COULD WORK OUT THE MARGINAL COST. . 81
TABLE 5.7: APPLIED MODELLING FOR THE 2010 WATER TARIFFS PER BLOCK. ......................... 86
TABLE 5.8: AVERAGE COMMERCIAL TARIFFS FOR 2010 ......................................................... 87
TABLE 5.9: BENCHMARKING OF THE WTE WITH OTHER INFRASTRUCTURE PUBLIC ENTITIES IN
SOUTH AFRICA. ................................................................................................................... 93
TABLE 5.10: ENVISAGED GOVERNMENT FINANCIAL SUPPORT MODELS, ALTERNATIVE FUNDING
MODELS, IN THE ORDER OF PREFERENCE .............................................................................. 104

14
GLOSSARY OF TERMS AND CONCEPTS
Backlog: generally refers to an accumulation over time of work waiting to be done or
orders to be fulfilled.
Build-own-operate-transfer (BOOT) or build-operate-transfer (BOT): is a form of
project financing, wherein a private entity receives a concession from the private or public
sector to finance, design, construct, and operate a facility stated in the concession contract.
This enables the project proponent to recover its investment, operating and maintenance
expenses in the project. Due to the long-term nature of the arrangement, the fees are usually
raised during the concession period. The rate of increase is often tied to a combination of
internal and external variables, allowing the proponent to reach a satisfactory internal rate of
return for its investment.
Brownfield development: is a term commonly used to describe problems needing the
development and deployment of new systems in the immediate presence of existing (legacy)
applications/systems. In contemporary civil engineering, Brownfield development means
places where new infrastructure may need to be designed and erected considering the other
structures and services already in place.
Conditional grants: means conditional allocations to provinces, local government or
municipalities from the national government’s share of revenue raised nationally, which are
provided for and whose purpose is specified in the annual Division of Revenue Act referred
to in section 214(1)(c) of the Constitution of the Republic of South Africa, 1996.
Cost-benefit analysis or BCA (Benefit-Cost Analysis): is a term that refers both to helping
to appraise, or assess, the case for a project, programme or policy proposal; an approach to
making economic decisions of any kind. Under both definitions the process involves,
whether explicitly or implicitly, weighing the total expected costs against the total expected
benefits of one or more actions in order to choose the best or most profitable option. Benefits
and costs are often expressed in money terms, and are adjusted for the time value of money,
so that all flows of benefits and flows of project costs over time (which tend to occur at
different points in time) are expressed on a common basis in terms of their “present value.”

15
Catchment Management Agency: where water management is charge with the
responsibility of coordinating the activities with water users, provinces, municipalities and
other bodies.
Discounting: the rationale for adopting discounting in benefit-cost analysis is two fold.
Firstly, it is assumed that we prefer consumption now rather than later and equally that we
would prefer to put off making expenditures. Secondly, since the investment required for the
project precludes those resources being invested elsewhere in the economy, it is obviously
desirable not to undertake the project if those resources could generate a higher return if
invested elsewhere in the economy.
Emerging markets: are nations with social or business activity in the process of rapid
growth and industrialization. At 2010, more than 40 emerging markets in the world, with the
economies of China and India considered to be the largest.
Economies of scale: are both pervasive and critical in water infrastructure management.
Arise as a function of size, a single large plant, at least up to some point, having lower unit
costs than many small plants providing the same throughput.
Economies of scope: That is, managing all aspects of water infrastructure management will
result in a lower cost strategy than trying to manage each separately and in isolation. The
second rationale, is that purely local solutions will be suboptimal from the perspective as a
whole, so increasing total costs. This is not a claim that there are economies of scale but that
local solutions will often simply shift the problem on to another place.
Estimation of costs: when developing a business plan for a new or existing company,
product, or project, planners typically make cost estimates in order to assess whether
revenues/benefits will cover costs (see cost-benefit analysis). This is done in both business
and government. Costs are often underestimated resulting in cost overrun during
implementation. Main causes of cost underestimation and overrun are optimism bias and
strategic misrepresentation. Reference class forecasting was developed to curb optimism bias
and strategic misrepresentation and arrive at more accurate cost estimates. Cost Plus, is
where the Price = Cost plus or minus X%, where x is the percentage of built in overhead or
profit margin.

16
Economic externalities: the positive or negative impact of one person’s actions on
another so as to either change the amount or value of resources available to that person or to
change the enjoyment they gain from consumption.
Equitable share: local government’s share of nationally raised revenue is allocated between
municipalities using a formula that takes account of the different demographics and service
levels in municipalities. The equitable share formula ensures that each municipality receives
a share that allows it to meet its basic service obligations, taking account of both the
operational costs of providing those services and administrative and governance costs
incurred in running a municipality. Allocations are corrected to account for the varying
ability of municipalities to raise their own revenues.
Equity: is the residual claim or interest of the most junior class of investors in assets, after
all liabilities are paid. If valuations placed on assets do not exceed liabilities, negative equity
exists. In an accounting context, represents the remaining interest in assets of a company,
spread among individual shareholders of common or preferred stock.
Financial year: means the financial year commencing on 1 April in a particular calendar
year and ending on 31 March of the following calendar year.
Greenfield investment: is the investment in a manufacturing, office, or other physical
company-related structure or group of structures in an area where no previous facilities exist.
Greenfield Investing is often mentioned in the context of Foreign Direct Investment. Green
field investments occur when multinational corporations enter into developing countries to
build new factories and/or stores.
Infrastructure: is the basic physical and organizational structures needed for the operation
of a society or enterprise, or the services and facilities necessary for an economy to function.
The term typically refers to the technical structures that support a society, such as roads,
water supply, sewers, electrical grids, telecommunications, and so forth.
Infrastructure investment gap: capture all investment needs, in particular concerning
capital replacement. If tariff revenues remain constant in real terms, utilities face a funding
gap of the same magnitude. However, the funding gap would disappear if municipalities
increased water and sanitation spending at a real rate of growth.

17
Marginal cost: costs are measured as the difference from the baseline, if there is no
difference, there is no cost.
Off-budget: achieve self-funding by usually having funding through fees for services
rendered. Some have the ability to raise revenue bonds. The public agency or entity issues
tax-exempt industrial revenue bonds to finance public business ventures mainly to revitalize
infrastructure development in depressed areas.
Opportunity cost: the cost of using a resource for some purpose is given by the value of that
resource if used for the best alternative use.
Public–private partnership (PPP): describes a government service or private business
venture which is funded and operated through a partnership of government and one or more
private sector companies. These schemes are sometimes referred to as PPP, P3 or P3. PPP
involves a contract between a public-sector authority and a private party, in which the private
party provides a public service or project and assumes substantial financial, technical and
operational risk in the project.
Remaining Useful Life: is an engineering discipline focused on predicting the time at which
a component will no longer perform a particular function. Lack of performance is most often
component failure. The predicted time becomes then the remaining useful life (RUL). It is the
analysis of failure modes, detection of early signs of wear and aging, and fault conditions.
Return on Investment (Assets): investors are assumed to wat to maximize investment
return, generally agreed to be the total of income and capital gain over a particular period.
Risk: is commonly used in a number of different meanings: as a synonym for probability, as
one for expected value (probability times outcome), or to refer to potentially harmful events
of different kinds. Since a risk is always a “risk of”, this mixed usage is almost inevitable,
although ‘risk’ is only used in relation to undesirable events.
Uncertainty: is an ability to differentiate between a range, continuous or discrete, of
different possibilities. Although risk and uncertainty appear similar in nature, uncertainty is
fundamentally different from risk; the opposite of uncertainty is information which is
formally defined as that which destroys uncertainty.

18
ABBREVIATIONS AND ACRONYMS
ADB: Asian Development Bank
AfDB: African Development Bank
AFP: Alternative Finance and Procurement
AU: African Union
BC: British Columbia
BCA: Benefit-cost analysis
BOOT: Build-Own-Operate-Transfer
CMA: Catchment Management Agency
CPI: Consumer Price Index
CSIR: Council for Scientific and Industrial Research
DCOGTA: Department of Cooperative Governance and Traditional Affairs
DBSA: Development Bank of Southern Africa
DEA: Department of Environment Affairs
DoE: Department of Energy
DPE: Department of Public Enterprises
DPW: Department of Public Works
DSRP: Dam Safety Rehabilitation Programme
DTI: Department of Trade and Industry
DWA: Department of Water Affairs (after May 2009 and before April 1994)
DWAF: Department of Water Affairs and Forestry (between April 1994 and
May 2009)
EC: Eastern Cape
GDP: Gross Domestic Product
GNP: Gross National Product
GWS: Government Water Scheme
HDI: Historically Disadvantaged Individual
ICT: Information and Communication Technology
IDC: Industrial Development Corporation
IFG: Infrastructure Funding Gap
IIPF: Infrastructure Investment Public Fund
IPAP 2: Industrial Policy Action Plan 2
IWRM: Integrated Water Resource Management
kl: Kilolitre

19
KPI: Key Performance Indicator
KZN: KwaZulu-Natal
LED: Local Economic Development
LHWP: Lesotho Highlands Water Project
LM: Local Municipality
KOBWA: Komati Basin Water Authority
MDG: Millennium Development Goals
MIIF: Municipal Infrastructure Investment Framework
MIIU: Municipal Infrastructure Investment Unit
MIG: Municipal Infrastructure Grant
MTEF: Medium Term Expenditure Framework
MTSF: Medium Term Strategic Framework
NC: Northern Cape
NDFA: National Development Funding Agency
NGP: New Growth Path
NSDP: National Spatial Development Perspective
NRA: National Roads Agency
NWA: National Water Act, 1998 (Act No. 36 of 1998)
NWRI: National Water Resources Infrastructure
NWRS: National Water Resource Strategy
NT: National Treasury
OECD: Organisation for Economic Co-operation and Development
PFI: Private Finance Initiative
PFMA: Public Finance Management Act, 1999 (Act No. 1 of 1999)
PPP: Public-Private Partnerships
RBIG: Regional Bulk Infrastructure Grant
ROI: Return On Investment
RPA: Regional Planning Agency
RUL: Remaining Useful Life
SADC: Southern African Development Community
SAICE: South African Institution of Civil Engineering
SALGA: South African Local Government Association
SD: Standard Deviation
SFWS: Strategic Framework for Water Services
TCTA: Trans-Caledon Tunnel Authority

20
UK: United Kingdom
USAID: United States Agency for International Development
VAT: Value Added Tax
WB: World Bank
WC: Western Cape
WDCS: Waste Discharge Charge System
WfGD: Water for Growth and Development
WMA: Water Management Area
WRC: Water Research Commission
WRM: Water Resources Management
WSDP: Water Services Development Plans
WSP: Water Services Provider
WTE: Water Trading Entity
WTW: Water Treatment works
WSA: Water Services Act, 1997 (Act No. 107 of 1997)
WSAs: Water Services Authorities
WSOS: Water Services Operating Subsidy
WWTW: Waste Water Treatment Works

21
CHAPTER 1: INTRODUCTION
1.1 BACKGROUND
Increasingly, South African water is acknowledged as a strategic resource under threat, and
requiring more astute management. This holds true for most nations and poses a challenge to
governments, business and civil society on a global basis. A recent study by the 2030 Water
Resources Group elaborated on this, stating (DWAF, 2008): “In the world of water resources,
economic data is insufficient, management is often opaque, and stakeholders are
insufficiently linked. As a result, many countries struggle to shape implementable, fact-based
water policies. Water resources, therefore, face inefficient allocation and poor investment
patterns because investors lack a consistent basis for economically rational decision making”.
The Department of Water Affairs (DWA) is well aware of this challenge. Indeed, the Water
for Growth and Development Framework (DWAF, 2008), states clearly that: “In an effort to
elevate the status of water in terms of its value-add for growth and development and
accentuating the fact that this is a scare and vulnerable resource, the Department
acknowledges the importance of strengthening its regulatory role, providing support and
guidance to the plethora of stakeholders, affecting and influencing the sector”. The review of
the pricing strategy, development of the related infrastructure funding model and the
establishment of an economic water regulator will contribute to the realization of output 4 of
outcome 6 (Infrastructure) as contained in the government programme of action: - ‘create a
competitive, responsive and cost effective economic infrastructure.”
The Medium Term Strategic Framework (MTSF) and the government’s Outcomes-based
Programme articulate the importance of Infrastructure Development to support economic
growth of the country. Water is a key natural resource and a reliable and affordable water
supply underpins all economic and social development. Government’s targets also highlight
the need for Departments to address social development of poverty eradication, sustainable
and equitable development and job creation. The supply of water is viewed as a critical input
into the economy and the creation of opportunities for broad-based empowerment.
With the promulgation of the National Water Act, 1998 (DWAF, 1998), there has also been
new thinking around the way large water development projects will be developed, managed,
operated and maintained and the option of establishing a national utility for this purpose has
been investigated. Previously three options have been used for the development of large

22
scale water infrastructure (mainly dams and large raw water conduits such as tunnels and
canals):
• DWA has undertaken this directly (by far the most important in the past);
• Water boards or large municipalities have provided their own facilities ; and
• Special purpose institutions have been established, the most notable being the Trans-
Caledon Tunnel Authority (TCTA) which was established to develop the Lesotho
Highlands water scheme, and Komati Basin Water Authority (KOBWA) for the
development of the Driekoppies and Maguga dams.
1.2 The Problem in context
Water resources infrastructure development in South Africa is to ensure water security and
availability within specific water management areas. It must be emphasised that South Africa
is a water scarce country, subject to droughts and periodic floods. Future water availability
(surface water) will be impacted by climate change and variability. Thus, water demand
management and conservation (water use efficiency) must be an integral part of infrastructure
planning and development.
The research will be presented in terms of the various performance areas, i.e.:
• Relationships between infrastructure and development;
• Water infrastructure development and management;
• Infrastructure condition and capacity, i.e. operations and maintenance.
Various studies have shown a relationship between the amount of infrastructure and
economic strength of a country (Summers & Heston, 1991; Lang & Merino. 1993). It is
estimated that capital expenditure is approximately 20% of the Gross National Product (GNP)
represented expenditures by the public section (Goodman & Hastak, 2006). Furthermore, it
is estimated that 5% of GNP is spent to maintain, replace, and add to the capital stock owned
by governmental entities, and that about half of that amount is spent on the physical
infrastructure for water resources and supply, wastewater treatment, capital costs, operation
and maintenance (Goodman & Hastak, 2006).
Public infrastructure projects are planned in the following four broad categories:
• The development of new projects such as new water distribution system and a new
dam; or the provision of additional capacity or capability to an existing project

23
because of increased demand through the raising of a dam wall, or expansion of a
water treatment facility to accommodate new development;
• The rehabilitation, reconditioning, and/or reconstruction of an existing facility without
changing the capacity or capability of the facility;
• The routine maintenance and operation of infrastructure systems such as the water
supply; sewage and storm water, dams, and canals; including the preventive and
demand maintenance; and
• The modification of the operation and management of an existing facility to improve
its efficiency, extend its useful life, introduce alternative strategies, or incorporate
new technologies to maximize the operational capacity of the facility.
A DWA assessment of the state of existing water infrastructure identified a number of
inhibiting barriers (DWA, 2004):
• infrastructure maintenance is often one of the first spending cuts made in times of
tight budgets;
• Capital investment in infrastructure continues to be viewed sceptically; and
• Constrained budgets at all levels of government seem to render even modest
programmes and projects unaffordable.
The National Water Resources Strategy of South Africa (NWRS), Water for Growth and
Development (WfGD) and Strategic Framework for Water Services (SFWS) (DWAF, 2003,
2004, 2009) identified water infrastructure as the key to development for the following
objectives (1) efficiency, (2) reliability, (3) equity, (4) sustainability, (5) innovation, and (6)
revenue diversification. The NWRS, WfGD and SFWS state that these objectives are
complemented by two overarching goals - economic (productivity) growth and job creation.
The National Water Resources Strategy acknowledges that more than half of the water
management areas are in deficit, whilst a surplus still exists for the country as a whole,
demonstrating the regional differences in the country. The strategy suggests the following to
achieve a balance:
• Development of surface water resources: substantial potential for further development
of surface water resources in some parts of the country, through construction of
storage and transfer infrastructure
• Inter-catchment transfers: necessary in many cases in South Africa

24
• Development of water services infrastructure: water supply to domestic (urban and
rural) and industrial sectors
• Varying combinations of the above options: suggested for potential water resources
developments
1.3 Problem review
Water is a strategic natural resource and a reliable and affordable water supply underpins all
economic and social development. Governmental targets highlight the need to focus on social
development, poverty eradication, sustainability, equality and job creation. The supply of
water is viewed as a critical input into the economy and the creation of opportunities for
broad-based empowerment. These objectives require the DWA to refocus its Strategic Plan
accordingly towards the planning, financing and implementation of mega water resources
infrastructure development projects.
The purposes of doing this research are multiple and attempts to describe, explain,
understand, predict (foresee), critique and/or analyse new and existing information on the
funding (financing and economics) of water infrastructure projects. Based on research
findings, this research paper will make recommendations around improved funding,
management and governance.
1.4 Problem statement
1.4.1 Choosing the problem
The competition for the allocation of public financial resources for government priorities for
the development of mega water infrastructure projects to ensure availability and security
(sustainability) for socio-economic development necessitates research towards different
funding (financial and economic) models. Furthermore, the sustainability of the “efficient”
funding (business) models are needed for water infrastructure development in South Africa,
given future changes such as: 1) changes in fiscal or treasury allocations; 2) impact of
financial crisis or conditions on public sector budgets; and 3) the impact of the economic
environment on private (corporate or financial) and public funding.

25
Critical reflective analysis of research data will be an integral part of the research topic,
Funding models for the financing of water infrastructure in South Africa: A framework and
comparative analysis of alternatives.
1.4.2 Problem overview
The DWA traditionally funded water infrastructure development projects in South Africa.
These projects only favoured and benefited a privileged minority of the population in the pre-
1994 political era. No appropriate and alternative analyses and models have since been
suggested for the post–1994 period, with its growing demands on water infrastructure.. With
limited financial resources, more pressure has been placed on DWA to develop alternative
funding models for improved national water infrastructure management. Government has
also been urged to seek advice and analysis on relevant funding models implemented from
similar emerging economies in other parts of the world, e.g. Brazil, Mexico, Australia and
India (Mayle et al., 2001; Matta & Ashkenas, 2003).
1.5 Research objectives
For the research project specific and proper objectives were set. These objectives for the
research project were as follow:
• To describe the key sources of funding of water infrastructure
• To identify the funding (finance management and economic analyses) models for
financing water infrastructure development projects
• To identify comparative funding models in other emerging or developmental
economies, i.e. failures and successes, benchmarking, comparative analysis and best
management practices, from other countries.
• To ensure using research analysis to make recommendations
For the develop and customize funding (project finance management and economic analyses)
models for the financing of water infrastructure development projects in South Africa the
research analysis would take into the following:
• The efficiency of different funding (business) models
• The impact of the South African regulatory environment and of national policies with
an impact on the sources of funding of water infrastructure

26
• To benchmark and align the funding (project finance management and economic
analyses) models for the financing of water infrastructure development projects in
South Africa with international best practices and guidelines (i.e. World Bank,
African Development Bank, Southern African Development Bank, Asian
Development Bank, European Development Bank, European Directives, etc.)
1.6 Importance/benefits of the study
This research study and other various research methods and techniques will strengthen the
DWA’s position on infrastructure development:
• Upgrading water infrastructure development requirements, addressing water
infrastructure backlogs in South Africa
• Improved water sector culture, professionalism and practices; aimed especially at the
professional sector, providers, operators and advisors
• Funding and financing for improving water infrastructure development and systems
• A national water infrastructure situation and functional assessment framework
• Sustainable water infrastructure and asset management as part of the feasibility
studies required for water infrastructure
• Ensure that the South Africa’s economic infrastructure development targets are met in
terms of the country’s Medium Term Strategic Framework (MTSF)
1.7 Limitations and Delimitations
The study attempts to address a major financial constraint in general with regard the funding
of infrastructure in South Africa and therefore the following limitations:
• All the public finance structural problems for the funding of public infrastructure (in
particular water) will not be addressed in totality in the research project
• The scope of the research study will be limited to demand risk management, and the
application of relevant or appropriate financial tools
• Unfinished work in the DWA concerning the revision of the Raw Water Pricing
Strategy (DWAF, 2007) that must take into account the water tariff setting for the
water resources management in South Africa; and
The scope of the research study covers both water resources infrastructure and water supply
services (i.e. sanitation, waste water treatment works (WWTW), water treatment works

27
(WTW), and distribution networks). The delimitations of the research project will be as
follow:
• It will provide a platform or the building blocks for the funding initiatives of all
infrastructure development projects (i.e. energy, transportation, telecommunications,
etc.), management and operations
• Comparative analysis and benchmarking appraisal with the funding models of water
resources infrastructure in developing countries, where necessary; and
• Analysis of the financial structural problems that face the funding of (water resources)
infrastructure development projects in South Africa.
The material for the research topic is presented in seven chapters. Chapter 1 is devoted and
gives details to the background, the problem in context, problem review, problem statement,
research objectives, importance and benefits and limitations and delimitations of the research
topic. Chapter 2 deals with the problem analysis and theoretical considerations of the
research topic. It concentrates in-depth on the problem analysis with the focus on the
problem statement objectives, and problem review themes. However, the theoretical
considerations concentrates on the current water infrastructure funding models with emphasis
on financial and economic analyses and the development of the business case. Chapter 3 is
an important part of the thesis and gives the literature overview with the focus on identifying
existing methodologies and theory base for the research project. Chapter 4 is vital for the
success of the thesis and considered the heart of the thesis. It focuses on the population and
sample, data collection methods, and data analysis for the problem statement. Chapter 5
includes the research results and/or findings based on the research design, data collection and
data analysis. Chapter 6 deals with the discussions from the research results and give
direction in terms of the appropriate funding models that are needed for water infrastructure
development projects in South Africa. Chapter 7 includes the conclusions and
recommendations for the research topic.

28
CHAPTER 2: PROBLEM ANALYSIS AND THEORETICAL CONSIDERATIONS
2.1 Introduction
Through the problem analysis and theoretical considerations of the problem statement
objectives will be addressed or unpacked by means of a survey questionnaire, reports,
interviews and focus workshops. This forms the business case for the relevance of the
research project.
2.2 Problem analysis
The research topic, Funding models for the financing of mega water infrastructure in South
Africa: A framework and comparative analysis of alternatives necessitates research for the
development of mega water infrastructure projects to ensure water availability and security
(sustainability). A number of organizations have attempted to delineate the extent of South
Africa’s water infrastructure deficit and requirements, with limited success; but taken
together their efforts underscore the pressing need to address the following:
• a detailed inventory of both the extent and condition of public infrastructure which is
tracked on a yearly basis in order to measure the amount of progress, if any, on
reducing the infrastructure deficit; as it is not possible to develop a strong direction if
there is no true understanding of the scope of the problem; and
• new funding models to supplement existing funding as existing funding techniques
can no longer be relied upon to fully fund both the rehabilitation of existing public
infrastructure and the expansion required to accommodate growth.
2.2.1 The extent of the problem
Much of South Africa’s water infrastructure is at a crossroads. Following decades of under-
investment, vital elements of the nations’ infrastructure are in serious disrepair, if not in a
crisis. South Africa’s infrastructure – investment sunk in water infrastructure – is struggling
to cope with the cumulative demands of South Africa’s sustained period of economic growth
and the vast new trade and investment opportunities emerging. There is a serious backlog in
infrastructure investment, especially in water, estimated conservatively at R110 billion,
which requires immediate attention. Institutional structures – those of public entities – which
have served South Africa well in decades past now appear unable, and ill-equipped, to cope
with the nation’s present infrastructure planning and delivery challenge. Yet in South
Africa’s private sector, management skills and technical expertise in infrastructure

29
development and financing are world class. There is a mismatch between public- and private-
sector capabilities. Fiscal policies of budget surpluses and debt reduction pursued over the
last decade by governments in post-1994 South Africa have led to reduced public investment
in infrastructure. Even with large increases in tax revenues and aggressive “surpluses” of
government public entities, the water infrastructure investment required to meet South
Africa’s present and future needs has not materialised. Simultaneously, large capital
resources are accumulating in the private sector, particularly in superannuation and managed
funds, which could be increasingly tapped for infrastructure investment. Closing this circle –
between infrastructure capital needs and private-sector capital availability – should be a
priority.
2.2.2 The necessary investment in water infrastructure
Poor infrastructure (capital investment in water infrastructure) has been a long running sore
for the South African economy alongside education and skills (human capital investment).
However, competitive failings in these areas can be used to somewhat offset by competitive
successes elsewhere. The erosion of competitive strength in these areas over recent years has
once again highlighted the long running weaknesses elsewhere in the South Africa economy.
2.2.3 Economic growth and infrastructure
Efficient and productive infrastructure is a prerequisite for economic growth and
competitiveness. The economic services provided by water infrastructure are essential inputs
to production and are also in many cases final consumption goods and services. This
government-led development model remained largely unchanged in South Africa until the
1980s (cf. Vawda et al., 2011).
The adequacy of water infrastructure and its timely implementation and financing – whether
by public or private means – and its pricing are therefore essential questions for national
economic growth and competitiveness. Although they are not traded goods themselves,
infrastructure services are important inputs to all industries and hence to economic efficiency,
productivity and competitiveness. Continued productivity growth – in which infrastructure
plays a crucial role – will be particularly important in managing the emerging challenge of
South Africa’s growing population. Numerous studies have demonstrated the strong linkage
between infrastructure investment and economic growth. There is strong evidence that
investment in infrastructure has a positive and permanent effect on economic output, with a

30
1% increase in infrastructure spending increasing output by between 0.17 and 0.39%.
Moreover, investment in infrastructure generates higher returns than investment in other
sectors of the economy. Infrastructure investment impacts chiefly on the supply side of the
economy by improving economic efficiency and resource allocation.
2.2.4 The decline in infrastructure investment
Infrastructure investment began to decline in the 1990s as governments increased the share of
public consumption expenditure in their budgets at the expense of public investment. Fiscal
policies of budget surpluses and debt reduction have reinforced this decline. Government
capital expenditure as a share of GDP, which was around 7.2% in the 1970s and 1980s, has
fallen to a low of 3.6% of GDP. Business leaders, politicians, professional economists, local
governments, industry and community groups have increasingly expressed concern over the
decline in South Africa’s infrastructure investment and have stressed the need for action.
Professional evaluation led by the South African Institute of Civil Engineers has revealed the
very serious problems now facing South Africa (SAICE, 2011). Rating on a scale of “A” to
“D”, revealed that the water infrastructure class received a D-, however, indicating it was in
serious condition and need urgent attention, although sufficient for South Africa’s current and
immediate future needs.
2.2.5 Government involvement
Government has been the main provider of water infrastructure in South Africa and remains
so. Government administration and institutional structures continue to shape and influence
infrastructure investment in spite of the trend to corporatisation, privatisation and increased
private provision of infrastructure since post-1990s. Various proposals for the overhaul of
financial relations continue to be advanced and discussed, but progress is unpromising. The
interplay of governments’ fiscal policies of budget surplus/debt reduction, vexatious financial
relations, and political considerations present an apparently insurmountable obstacle to
overcoming the backlog in South Africa’s infrastructure – and in putting in place fresh
institutional structures for effective strategies leading to prompt water infrastructure
provision.

31
2.3 Problem statement objectives
The success of the research project will depend on the research findings to address the
following objectives:
• To describe the key sources of funding of water infrastructure – for this research
project the identification of the key sources for water infrastructure in the South
Africa. This will be done through the identification of government levels (spheres),
public entities and agencies, Public-Private Partnerships and/or private sector markets.
• To identify the funding (finance management and economic analyses) models for
financing water infrastructure development projects – through this research project the
most scientific funding models will be identified by survey a target population by
means of survey questionnaire, interviews with a targeted population and focus
workshops with relevant stakeholders to ensure the implementation of social and
economic water infrastructure projects. These must be in line with the recently
government approved MTSF, New Growth Path (NGP) and Industrial Policy Action
Plan 2 (IPAP2).
• To identify comparative funding models – comparisons will be done concerning the
usage or implementation of relevant funding models with other emerging or
developmental economies, i.e. failures and successes, benchmarking, comparative
analysis and best management practices, from other countries.
• To ensure using research analysis to make recommendations – will address
challenges, achievements, lessons and recommendations of possible strategic and
operational funding models following important research findings. It would be
beneficial to recommend from the established research findings specialised technical
and financial support mechanisms for water infrastructure development projects.
2.4 Problem review themes
To develop and customize funding (project finance management and economic analyses)
models for the financing of water infrastructure development projects in South Africa will
have the following themes:
• Theme 1: The efficiency of different funding (business) models.
• Theme 2: The sustainability of the “efficient” funding (business) models, given
future changes such as: 1) changes in fiscal or treasury allocations; 2) impact of

32
financial crisis or conditions on public sector budgets; and 3) the impact of the
economic environment on private (corporate or financial) and public funding.
• Theme 3: The impact of the South African regulatory environment and of
national policies with an impact on the sources of funding of water infrastructure.
• Theme 4: Comparative funding models in other emerging and/or developing
economies. However, the limitation is not a full extended analysis but a desk top
analysis that will inform my adopted model(s) or new funding model(s).
In addition, the hypotheses to be tested for the funding models for the financing of water
infrastructure in South Africa are:
• Current funding for the financing of water infrastructure is adequate and appropriate
and therefore no need for substantial changes or alterations; and
• Government and its public agencies and entities do have adequate financial resources
for the financing of water infrastructure.
2.3 Theoretical Considerations
2.3.1 Concept of the Current Water Infrastructure Funding Models
The post–1994 South Africa has placed more pressure on the National Treasury (NT) and
DWA to develop alternative funding (financing and economic) analyses and models for the
provision of improved national water infrastructure. Thus, government has sought advice and
analysis on relevant funding models from similar emerging economies, e.g. Brazil, Mexico,
Australia and India (cf. Mayle et al., 2001; Matta & Ashkenas, 2003).
Currently the DWA and DCOGTA, with NT, have implemented three programmes for the
provision and management of water infrastructure in South Africa (NT, 2011a, b):
• Water Infrastructure Management Programme – the purpose is to ensure a reliable
supply of water from bulk raw water resources infrastructure, with acceptable risk, to
meet sustainable demand objectives for South Africa, including soliciting and
sourcing of funding to implement, operate and maintain bulk raw water resources
infrastructure in an efficient and effective manner by strategically managing risks and
assets.
• Regional Implementation and Support Programme – the purpose is to co-ordinate
effective implementation of the departmental strategic goals and objectives at the

33
regional level, including the establishment of water resource management institutions.
Facilitate water conservation and demand management. Accelerate access to water
infrastructure in communities.
• Infrastructure and Economic Development – the purpose to support provincial and
local government programmes and systems for the promotion of economic and
infrastructure development.
The main purpose of the above current water infrastructure funding is to act as a guideline for
water infrastructure programme managers on how to formalize and source financing for the
implementation and maintenance of water infrastructure. Funding models are not universal
since the implementation environment of individual water infrastructure may differ thus,
requiring adjustment to the models. However, conceptual funding models can become very
important to water infrastructure development, since they can provide the water infrastructure
programme manager with answers to such questions as:
• Where and how to seek out funds?
• Over what period will the funds be disbursed? and
• What are the effects of funding on pricing policies?
The answers to the above questions are even more significant to South Africa, other emerging
and developing economies. This is true, since these nations are usually influenced by the
negative effects of having very limited financial resources, poor capital markets and
inadequate political governance structures (IIPF, 2001). Therefore, long term capital
financing models for water infrastructure implementation as the potential of becoming an
important tool for assisting water infrastructure programme managers of these nations in
sourcing, structuring and formalizing funding for water infrastructure implementation.
2.3.2 Financial analyses
Financial analyses are needed for most public and private project that involves capital
investments (cf. Park & Jackson, 1984; Hickling Corporation, 1991; Goodman & Hastak,
2006) (cf. Table 3). A financial analysis models for the research project may include (cf.
Goodman & Hastak, 2006):
• Estimates of the investment (capital) cost and annual cost of the project in terms of
monetary requirements;

34
• Schedule showing the breakdown of the investment cost by years, with separate
accounts of expenditures for construction and for the other categories of costs needed
to bring the project into operation;
• Estimates of portions of investment cost in domestic and foreign funds, especially
when foreign currencies are in short supply;
• Plan for financing the costs of the project investment, including the sources of funds
and the terms for repayment of each category of borrowing;
• Estimates of costs, revenues from the sale of products and services, and required
subsidies, on a year-by-year basis extending from the completion of construction to
the date when the repayment of all borrowed funds is completed, and beyond if
appropriate;
• Plan for the required annual subsidies, if any, and for working funds to enable
operation to commence and temporary cash flow requirements during the early years
of operation; and
• Additional statements of a financial nature depending on the regulatory agencies and
financial institutions involved in the project.
2.3.2.1 General principles for application of financial analyses
Some qualifications that are appropriate for financial analyses are briefly reviewed here.
i) Financial analyses for a social (municipal water supply) project
The selection of the recommended first phase of the project and the master plan IS normally
based on their capacity to satisfy the expected future demands for water, and also to do so
most economically as measured by investment cost, annual cost, and cost per unit of water
supply. In addition to the basic cost analyses, detailed financial and economic analyses are
carried out for all alternatives that appeared to be feasible from the standpoint of engineering
construction
ii) Financial analyses for project with different sponsorships
Financial analyses can depend on the type of sponsor. The principal parameters are assumed
to differ for three types of sponsors: (1) a municipal or other government agency; (2) an
investor-owned public utility, (3) a private entrepreneur, or (4) an industrial or commercial
user for their use.

35
iii) Financial analyses with multiple financing sources
The analyses can be patterned after an actual plan for a water supply in a European country
(cf. Goodman & Hastak, 2006). However, the analyses are representative for a situation
when multiple facilities and multiple sponsors of construction must be considered when
developing a financing plan.
iv) Financial analyses of multi-unit and multi-purpose infrastructure programme
Although not included here, it is recommended that for (economic and) financial analyses of
this type, account should be taken of periods when a project is not fully utilized. Low output
may occur in the initial years of operation due to partial construction or inadequate market
growth. The cost may also vary from year to year for at least two other reasons: (1) to reflect
the terms of financing resulting in uneven annual capital charges and (2) due to variations in
operation and maintenance costs (e.g., pumping cost varies with volume pumped) and
inflation effects.
v) Cost allocations and subsidies
The cost allocations may depend on: (1) legislation specific to a project; (2) government
agency policies applicable to certain types of projects; (3) legal requirements; (4) payment
capacities and availability of money for subsidies; or (5) other policies concerning project
beneficiaries.
vi) Financial analyses of commercial schemes
For a commercial scheme to be successful, it must have at least two practical ingredients: (1)
an effective concessionary agreement between one or more government jurisdictions and one
or more commercial partners; and (2) financial benefits to both government and commercial
interests.
From the above methodologies available to evaluate the broader financial impacts of
investments in public works projects, e.g. water infrastructure, the majority can create
economic and physical conditions that induce additional economic growth. All the financial
tools will be considered as important for water infrastructure project delivery. However,
these models and tools will not be addressed in-depth in this research project.

36
2.3.3 Economic analysis
In addition to financial analysis, economic analyses are also needed for most public and
private projects that involve capital investments, e.g. water infrastructure (cf. Park & Jackson,
1984; Hickling Corporation, 1991; Goodman & Hastak, 2006).
i) Local infrastructure costs as a consideration in economic analysis
An infrastructure project may include the growth of population and business in an area, e.g.
the development of water infrastructure (water supply and sewage facilities) in urban and
rural areas. The costs of these incremental infrastructure and services may not have been
included in the estimates of the construction costs.
ii) Allocation of costs of multi-purpose projects
The infrastructure planner may often have to perform a benefit-cost analysis for a project or a
group of projects with multiple purposes. He or she may also have to deal with facilities that
serve more than one project. The separable cost-remaining benefits (SCRAB) method
which allocates costs of projects can be used, e.g. a multipurpose water resources project
often includes a reservoir serving several purposes and projects (U.S. Inter-Agency
Committee on Water Resources, 1950, 1958).
iii) Models for estimating economic effects due to infrastructure development
• Microeconomic analyses - They deal largely with the evaluation of costs and benefits
for physical infrastructure projects that, except for externalities if they are significant,
affect individuals and organizations within a limited project area.
• Macroeconomic analyses - Economic growth studies are designed to capture the total
economic effects of a project or programme and may be classified in certain cases as
macroeconomic analyses.
From the various methodologies available to evaluate the broader economic impacts of
investments in public works projects, e.g. water infrastructure, can create economic and
physical conditions that can induce additional economic growth. The economic model
benefit-cost analysis, with the levels of sample complexity, data requirements, cost,

37
reliability, etc. will be considered as important for water infrastructure project delivery.
However, these models and tools will not be addressed in totality in this research project.
2.4 Informing the questionnaire and developing the business case
Research questions were used since enough is not known about the problem statement in
South Africa (cf. Appendix 3). The research questions were formulated and used as precisely
as possible what the research study will attempt to achieve or find out. Since it was difficult
to work with research questions only with regard to the research topic additional secondary
data were sourced in the form of review reports, documents, etc.
The research questions were formulated or set for testing or arguing the problem statement.
Both, the testing and arguing, will allow the problem statement to retain advantages that the
clear research topic offers, since they relate precisely to the research project. In addition,
through the survey questionnaire (primary data collection) and the review reports, documents,
etc. (secondary data collection) a business case for The funding models for the financing of
water infrastructure in South Africa was formulated and thus be presented for
implementation.
2.5 Conclusion
This chapter addressed the problem analysis and theoretical considerations of the research
topic. The problem analysis gave a detail account of the extent of the problem with the
indication that the necessary investment that is needed in water infrastructure since efficient
and productive infrastructure is needed for economic growth. The decline in infrastructure
since the 1990s government increased the share of public consumption expenditure in its
budget and thus the recent involvement by government as main increased provider of water
infrastructure funding is encouraging. The research themes identified efficiency,
sustainability and the impact of regulatory environment on the water infrastructure delivery.
The theoretical considerations gave the current water infrastructure funding models with their
associated shortcomings and/or limitations. Furthermore, they outlined the probable type of
financial and economic analyses that can be considered in the data collection and analysis to
ensure the appropriate results for the selection of the most relevant and workable funding
model(s). Lastly, the type of research questions formulated, as part of the surveys
(questionnaire), has resulted in the development of the business case for the research topic.
38
CHAPTER 3: LITERATURE REVIEW
3.1 Introduction
The purpose of the literature review is to convey to the reader what knowledge and ideas
have been formulated for this particular research topic and the strength and weaknesses of
them (Coldwell & Herbst, 2004; Lang, 2006). Literature review was based upon or defined
by a guiding concept, i.e. research objective, the problem statement.
The literature review does not consist merely of a list of readings, but also contains literature
or information that has been selected, as part of the planning, research and investigative
processes (cf. Open University, 2001). Thus, it required an insightful evaluation, description
and assessment of what is already known about the research problem or area, and relates to
the aims and objectives of the research project (TerreBlance et al., 2006; Open University,
2001).
The literature review was a re-iterative process whereby appropriate literature was selected,
to inform the research process, including the data collection and analysis. Notes were made
for reference and the formation of further themes. The literature search concentrated on a
few key concepts, especially where empirical work was involved.
3.2 Literature review and identifying of methodologies
Through the review of related literature a number of methodologies were identified as having
been employed by other researchers who studied similar problems. Therefore, the more a
particular methodology has been tested and adjusted for use in studying the specific research
problem. However, the research embraced any new and interesting methodologies
developed. Several ways were explored to record the research process in a written format
from the literature review, including:
• a research project journal to record ideas, hypotheses, observations,
materials, etc. – all aspects of the inquiry processes.
• a personal journal to record information about the process, relationships, etc.
• a formal report that states the research process, from hypothesis to literature
review, analysis, results and conclusions for presenting investigations.

39
Already the literature review has resulted in the research project being put into context by
showing how it fit into a broader research field of infrastructure planning, development and
financing (cf. Coldwell & Herbst, 2004; TerreBlance et al., 2006). Thus, it was used to gain
and demonstrate skills in two areas (cf. Coldwell & Herbst, 2004):
• Information-seeking – the ability to scan literature efficiently
• Critical appraisal – ability to apply principles of analysis to identify unbiased and
valid research studies
3.3 Theory Base of the Research Project
It is fundamental to understand the concept of water infrastructure, the inter-relationship of its
components and the implementation environment before attempting to structure the economic
issues associated with water infrastructure implementation. In partnership with all affected
stakeholders, the issues must be identified and implement solutions for the various challenges
experienced with the full funding of the water value chain (cf. Figures 3.1).
Healthy infrastructure is a necessary ingredient of a roust economy. Infrastructure systems
are a part of the nation’s economy through expenditures and infrastructure systems are also
necessary to accommodate economic expansion and productivity. A positive correlation can
be shown between the level of infrastructure development and economic productivity.
3.3.1 Perspective on funding of water infrastructure and development
Lang and Merino (1993) have estimated capital expenditures and found that the gross
national product (close to the gross domestic product, or GDP) was over $6 trillion dollars
per year in the early 1990s. Approximately 20% of the GNP was spent to maintain,
expenditures by the public sector. They estimated that 5% of GNP was spent to maintain,
replace, and add to the capital stock owned by governmental entities, and that about half of
that amount was spend on the physical infrastructure. The infrastructure data covered the
following types of infrastructure: high-ways, mass transit, rail, aviation, water transport,
water resources, water supply, and wastewater treatment. Later reports have painted similar
picture of overall spending, and the proportions for capital costs and for operation and
maintenance (O&M).

40
A World Bank Development Report (World Bank,1994), which focused on infrastructure for
development, studied investments in public utilities (power, piped gas, telecommunications,
water supply, sanitation and sewerage, and solid waste collection and disposal), public works
(major dam and canal works for irrigation, as well as roads), and other transportation sectors
(railways, urban transport, ports and waterways and airports). The World Bank surveyed
low-, middle-, and high-income countries. Infrastructure services represent a large share of
the economy, accounting for value-added of roughly 7 to 11% of GDP, with transport
comprising about 5 to 8% of total employment. Public infrastructure investment ranges form
2 to 8% (and averages 4%) of GDP. For developing countries, infrastructure typically
represents about 20% of total investment and 40 to 60% of public investment. The report
stated that even these shares understate the social and economic importance of infrastructure,
which has strong links to growth, poverty reduction, and environmental sustainability.
The World Bank Report on Africa’s Infrastructure (World Bank, 2010) indicated that
Africa’s infrastructure lags well behind that of other developing countries. Not only are
Africa’s infrastructure networks, i.e. water systems, power, etc., deficient in coverage, but the
price of the services provided is also exceptionally high by globally standards. Sub-Sahara
Africa has a combined infrastructure deficit for water and sanitation of estimated $93 billion
annually, however, these estimated are a lower bound. Thus, meeting Africa’s infrastructure
needs calls for a very substantial program of infrastructure investment and maintenance.
Some two-thirds of this total related to capital expenditure, and the remaining one-third to
operation and maintenance requirements (Brineco-Garmendia et al., 2008). The public sector
remains the dominant source of finance for water infrastructure. Public investment is largely
tax financed and executed through central government budgets, whereas the operating and
maintenance expenditure is largely financed from user charges and executed through state-
owned enterprises. Current levels of public finance are substantially higher to GDP, typically
absorbing 5-6% of total GDP. Looking only at investment, one finds that official
development assistance, private participation in infrastructure and non-OECD financiers
together exceed domestically financed public investment (Brineco-Garmendia et al., 2008).
The private sector is by far the largest source, on a par with domestic public investment.
The Asian Development Bank (ADB) (Sagar, 2006) indicated the challenges in infrastructure
project financing. Emerging economies in Asia need billions of dollars in private funding to
spark infrastructure investment. However, these economies have failed to attract a supply of
private investment in infrastructure projects. This can be attributed to weak tariff regulation,

41
reluctance to honour commitments, poor governance practices, weak accounting and
disclosure norms, etc. Thus, the ADB recognised for developing and implementing a new
model to replace the traditional methodologies for infrastructure project financing as market
players now desire bankable solutions for infrastructure project financing. In terms of the
private-public local currency model, there has been an emerging need to review, on a sector-
by-sector basis, the strengths and weaknesses of the processes that were used in the past to
implement infrastructure projects. It was imperative to develop bankable versions of these
models, ideally backed by the fundamental willingness and ability of customers to pay rather
than relying on government guarantees or public sector assurances. In implementing this new
model, local capital markets play an important role in providing infrastructure project
finance. Thus, the role of government in promoting infrastructure investment has changed in
character but not diminished.
Various other studies have also shown a relationship between the amount of infrastructure
and economic strength. Summers and Heston (1991) have shown that increasing GDP per
capita is associated with increasing levels of infrastructure. However, the studies were not
conclusive as to whether more infrastructure creates more wealth, or whether infrastructure
growth is a by-product of or follows economic growth. Furthermore, it is likely that the
relative importance of the linkages of these effects varies from country to country. Thus,
while infrastructure projects are often justified by governments and by international agencies
as employment and economic generators in developing countries, most professional
economists hold the view that they are not as efficient as other types of economic and social
programmes for these objectives.
The concluding report from the U.S. Army Corps of Engineers (1995) stated that
infrastructure studies identified the following public works goals as the primary objectives to
guide the infrastructure development; (1) efficiency, (2) reliability, (3) equity, (4)
sustainability, (5) innovation, and (6) revenue diversification. The report went on to state that
within a broader context, the preceding objectives are complemented by two overarching
goals that serve as national outcome-based performance indicators, i.e. productivity growth,
and competitiveness and jobs. In assessing the state of the infrastructure, the U.S. Army
Corps of Engineers (1995) identified a number of barriers that inhibit action on improving the
infrastructure:
• Public works maintenance is often one of the first spending cuts made in times of
tight budgets.

42
• Capital investment in public works continues to be viewed sceptically by many as
“pork barrel” spending.
• Constrained budgets at all levels of government seem to render even modest programs
and projects unaffordable.
• Significant advances in technology are prevalent, yet liability, regulatory, and
contracting concerns have resulted in relatively few innovative public works
applications.
• The accumulation of national (federal) and state regulations and mandates threatens to
distort local budgets and priorities.
• The implementation of necessary environmental statutes has created a complex series
of public works decision-making processes that often appears gridlocked.
Furthermore, through the U.S. Army Corps of Engineers (1995) number of studies of
individual topics the following principles are needed or must be considered for federal
agencies and for the state and local agencies involved in federal programs for the funding of
infrastructure :
1. Cost-effective management and maintenance. Adopt and encourage performance
measurement and assessment process, as well as maintenance planning and reporting
practices to reduce long-term costs through early identification of maintenance needs.
2. High-quality investments. Obtain maximum benefits compared to costs from all
federal infrastructure programs (directly provided, financially assisted, or regulated)
through the use of investment analysis.
3. Budget-sensitive financing. Federal infrastructure investments should be identified
through the preparation of financial plans and affordability analyses early in the
planning process, with full consideration of both traditional and non-traditional
funding sources, including demand management options to ensure efficient use.
4. Innovative technologies. Clear the path to the marketplace for new technologies
through an explicit, singular federal research and development strategy that provides a
strong link between the development and adoption processes, enhances the
partnership between the federal research community and the private sector, and
addresses the liability, regulatory, and contracting barriers to innovation diffusion.

43
3.3.2 Water infrastructure conditions in South Africa
3.3.2.1 Water infrastructure conditions
A number of recent studies have highlighted the poor condition of existing infrastructure and
inadequate operational maintenance and management at municipal level. Some of these
include:
• DWAF and CSIR study: A 2007/08 review of 500 rural projects to assess the quality
and standard of (complete and incomplete) MIG funded infrastructure projects, the
study indicated that rural water and sanitation projects were either: partially non-
compliant (B-rating) or non-compliant (C-rating). Many of the concerns related to
technical design flaws, poor quality, poor operation and maintenance and the need for
rehabilitation. In addition, the lack of proper management around metering, billing
and revenue collection were highlighted.
• DWA ‘Green Drop’ report: DWA found that 7.4% of all wastewater systems can be
classified as excellently managed, but the reality remains that about 55% of the
systems assessed scored between 0% and 49% meaning that drastic improvement is
required in terms of management practices.
• DWA ‘Blue Drop’ report: DWA assessed 787 water supply systems in 2010 and
found that 13% were in ‘excellent’ condition; 12% were ’very good’; 30% were
‘good’; while 21% needed attention and 24% needed urgent attention. Overall these
results, with 45% less than ‘good’, are concerning. However, DWA reports that this
performance is better than it was in 2009.
• SAICE’s recent publication in 2011and its presentation to the World Bank in 2009
highlights some of the reasons behind failed or delayed infrastructure projects. In this
case the survey reviewed MIG funded projects just after completion and was aimed at
assessing design and construction performance. The findings suggested that while
52% of projects surveyed were completed “satisfactorily with minor niggles” the
main challenges experienced relate to poor quality contracting (flawed procurement
process), inadequate design and poor performance on the part of the contractor. This
suggests that while civil engineering capacity is a constraint, a broader set of
challenges face municipalities in successfully implementing infrastructure projects.

44
3.3.2.2 Water sector value chain and funding in South Africa
Water infrastructure is hierarchical (cf. Figures 3.1, 5.8 and 5.11), based on administrative
and/or political boundaries (cf. Rajabifard, 2002; DWAF, 1997, 1998). The hierarchy ranges
from a national level to a local level (Figure 3.1) with the responsibility for the
implementation of each level varying from the government of the administrative boundaries
to a combination of private sector and different aspects of the public sector. Thus, the
questions which arise when designing funding models are:
• Are there different implementation strategies for the different levels of a water
infrastructure or are they just subsets or smaller versions of the global implementation
strategy? and;
• How does the answer to the above questions affect the funding policies?
WATER SECTOR VALUE CHAIN
Ministry Water Boards Municipalities
DWA
National
Water
Resource
Infrastructure
Branch
Water Trading
Entity
Water Boards
Municipalities
Water Service
Authorities
Metro
District
Local
Municipalities
HOUSE-
HOLDS
TRADE/
SERVICES
INDUSTRY
MINING
Irrigation
Eskom
Industry
Users
TCTA/WRC
Figure 3.1: Water sector value in South Africa

45
3.3.3.2 The Economic Issues of Water Infrastructure Implementation
The economic issues involved in the implementation of the water sector value chain are
covered by both strategic and operational management principles. Some of the more
challenging management issues that must be addressed by the water sector include:
• The economic viability of a water infrastructure (Benefit-cost Analysis);
• Strategic Planning
• Funding Models
• Pricing Policies
• The role of a water infrastructure in the economy; and
• The economic issues associated with water infrastructure operations.
The first phase of implementing water infrastructure involves the determination of whether or
not the water infrastructure is economically viable. This is usually achieved through a cost-
benefit analysis or feasibility studies (cf. Rhind, 2000). A number of research studies have
been carried out in this area to determine the value of water infrastructure (Kuiper, 1971;
DWAF, 2004). However, researchers in general are still ignoring the next phase of the
implementation (i.e. strategic planning) especially the funding aspect of this phase (Groot,
2001; Rhind, 2000). The first generation of water infrastructure was mainly financed in an
ad hoc manner with no structured funding models for their implementation (DWAF, 2004,
2007). If the water sector community intends to improve on the implementation mechanism
of the second generation of water infrastructure the following issues should urgently be
raised:
• Are there current funding models in place for water infrastructure implementation?
• Can the current models (if they exist) finance the next generation of water
infrastructure?
• Does each level/component of a water infrastructure require a different funding model
for its implementation?
• Are funding models for water infrastructure implementation in developed world
applicable in emerging nations? and
• If they are applicable, what kind of modification will be required of these models?

46
3.4 Conclusion
Through this literature review chapter there has been the identification of possible
methodologies for the research problem. These have been identified through the appropriate
research project journals and reports. The perspective on funding of water infrastructure and
development, as part of the theoretical base, showed a positive correlation between the level
of infrastructure development and economic development and the six studies analysed
demonstrated this relationship and the type of funding model(s) used. These studies gave the
fundamental theory base for the research topic to be taken into consideration, the type of
analysis and the appropriate implementation solutions.
47
CHAPTER 4: RESEARCH METHODS
4.1 Introduction
The research design represents the master plan that specifies the methods and procedures for
collecting and analysing the required data/information. It was used to structure the research,
and to show how all the major parts of the research project – the samples or groups,
measures, treatment or programmes, and methods – work together to try to address the central
research question(s) (Cooper & Schindler, 2001; Coldwell & Herbst, 2004). The research
design was to ensure the following:
• a time-based research plan;
• the research based on the questions;
• the selection of sources and types of information;
• specifying the relationship among the study’s variables; and
• outline procedures for the research activities.
4.2 Population and sample
A representative sample (unit) was selected for measurement from a larger target population
in such a way that it, in combination with other representative units, given an accurate picture
of the problem statement being studied (Taylor, 2002; Coldwell & Herbst, 2004; Tustin et al.,
2005). The method of choosing a representative sample was to take ‘random’ samples from
the parent population.
The sample size for the study population of the research project was finite. Based on the
sampling frame, the sample size (in this case, with a finite population) included the
following:
• Interviews with representatives of financial institutions (commercial and development
banks), i.e. World Bank (WB), Development Bank of Southern Africa (DBSA),
African Development Bank (AfDB)
• Interviews with representatives of investment corporations, i.e. Industrial
Development Corporation (IDC)
• Interviews with representatives of selected government departments (national and
provincial), i.e. Department of Water Affairs (DWA), National Treasury (NT),
Department of Cooperative Governance and Traditional Affairs (DCOGTA),

48
Department of Trade and Industry (DTI), Department of Public Works (DPW),
Depart of Public Enterprises (DPE), and Department of Energy (DoE)
• Water institutions (entities) and/or agencies, i.e. Trans-Caledon Water Authority
(TCTA), Water Boards (Rand Water, Umgeni Water, Sedibeng Water, etc.).
• Surveys with a representative sample of municipalities - The 2010 water services
tariff survey information was from: 236 of 237 local authorities (municipal retail
tariffs); 99.5% participation; 12 of 15 bulk water services providers / water boards
(bulk water tariffs); 80% participation; 139 of 139 raw water schemes (raw water
tariffs); 100% participation. Waste water tariffs were not measured as it was clear
from the tariff types that a fair comparison of municipal wastewater tariffs was very
difficult.
4.3 Data collection methods
Some basic quantitative and qualitative methods for the research topic for the analyses and
models included: 1) surveys (questionnaires); 2) interviews; 3) documentation review
(reports); 4) observations; 5) focus groups; and 6) case studies (cf. Cranston, 2004; Coldwell
& Herbst, 2004). They have unique designs, contribution and value towards the research
topic. They addressed the overall purpose, research objectives, and importance and benefits
of the research (cf. Cranston, 2004; Coldwell & Herbst, 2004).
Thus, the research involved two types of data collection methods, i.e. primary and secondary
data (Tustin et al. 2005):
i) Primary data - to address the research objective and if the value of secondary
research is assessed as being inadequate for the research objectives (cf. Appendix 3).
Research methods undertaken during the course of the study included interviews, surveys
(questionnaires and checklists), and conducting a serious of workshops. Specifically,
representatives were interviewed from local governments, state agencies, government finance
experts, and individuals knowledgeable on issues pertaining to government bonding.
National Treasury, Department of Water Affairs, local governments and state agencies were
surveyed for relevant data on passage of funding models for water infrastructure. In addition,
workshops and discussions were held focusing on funding options for water infrastructure
with participants drawn from local government and other interested stakeholders, i.e. public
and private agencies and entities.

49
ii) Secondary data - play a vital role in the research process because secondary data, by
definition, are existing data, they have the benefit of being readily available. In addition,
secondary data are generally far less time consuming than primary data. Secondary data was
already available since it was collected for another purpose (other than the current research
project). Finally, a list of options for funding water infrastructure has been developed to
facilitate discussion by the DWA and other policy makers during their current and future
deliberations of this important issue.
4.3.1 Primary data collection
An increasingly useful method of quantitative data collection in management research is to
carry out a survey of a sample of a population in order to observe the relationship between a
given set of variables (Taylor, 2002; Coldwell & Herbst, 2004). Surveys are most commonly
carried out using questionnaires, which may be filled in by the questioner or the respondent.
The design of the questionnaire included the size and scale of the problem to be tackled by
the survey (known as scoping) and what information will be required. Broad areas of
questioning were identified (cf. Appendix 3).
The sample size (in this case, with a finite population) included the following:
• Twenty-five individual interviews, i.e. national departments, funding agencies,
regulatory agencies, and local government representatives. To establish the new
paradigm of funding models the questions of the questionnaire were used as guide to
obtain the research data (cf. Appendix 3). They were used to explore new issues that
were nt previously considered in existing funding models and/or to adapt existing
funding models.
• Five (5) workshops and discussion focus groups, i.e. national and provincial
workshops – consisted of an average of 46 people.
• Respondent Groups and national organizations, e.g. DWA, NT, DPE, DTI, DCOGTA,
DoE, etc.
• Funding Agencies, i.e. Development Bank of Southern Africa (DBSA), African
Development Bank (AfDB), Industrial Development Corporation (IDC), European
Investment Bank, and World Bank.
• Regulatory Agencies, i.e. TCTA, Water Boards, Komati Basin Water Authority
(KOBWA), and Catchment Management Agencies (CMA).

50
• Local Governments, i.e. South African Local Government Association (SALGA),
municipalities (local, district and metropolitan municipalities).
• Technical Assistance Providers, i.e. European Union, World Bank, USAID
The questionnaire was forwarded to participants and/or stakeholders, including all local
municipalities, via e-mail and fax and was followed up with individual interviews. The
questionnaire requested from the municipalities and water boards the water tariffs per tariff
type (Residential, Commercial, Industrial bulk raw water, Industrial-potable water and
other/associated uses) in pre-defined blocks. For the 2010 financial year the survey captured
tariff blocks in the format (number of blocks and actual volume ranges per block) as each
municipality is applying it. The DWA is using web-pages and other electronic means to
maintain the information sharing relationship with stakeholders. The tariffs were captured
into an Excel spreadsheet and subsequently transferred to DWA’s National Information
System for effective sharing and evaluation of the information. This is now further being
advanced through the establishment of a Governance System whereby DWA and
municipalities will share core sector information via internet-based information sharing tools
(cf. Figure 4.1).
Info through Internet
Info through WSDP
Info via telephone
Local Government
(237 municipalities)
National TreasuryNational Government
(DWA
Collection of water charges/tariff information
Setting of Municipal tariffs
(June)
Budget andExpenditure
(September)
Audited water charges/tariffsand financial information (November)
Figure 4.1: Financial (funding) information management process water charges/tariffs.

51
It is important for water service providers (WSP, i.e. water boards) and water service
authorities (municipalities) to know the amount of raw water resource charges in its areas so
that these can be incorporated in the setting of their municipal tariffs. The following process
was followed to generate average costs for the various local authorities throughout the
country:
• Obtained the latest / applicable DWA raw water charges
• The supply areas for each scheme
• Possible link of communities to raw water charges.
• Combine raw water charges within a LM to derive applicable charges for each
The survey collated bulk water supply tariffs from all water boards and from two selected
bulk water service providers which are not water boards. The biggest challenge was to
ascertain which local authorities were being served by the water boards and the other bulk
water service providers.
4.3.2 Secondary data collection
Reviewed prior reports, reports relative to infrastructure needs and funding; and researched
infrastructure funding activities in other countries have been studied. The compiled data has
illustrating current expenditures and revenue patterns of DWA (NT, 2011a), DCOGTA (NT,
2011b) state agencies and utilities, Metropolitan Municipalities, municipalities (district and
local) (NT, 2011c), and private sector for water infrastructure. Revenue streams, local debt,
expenditure restrictions, and other information relative to funding water infrastructure were
reviewed. Summaries of this compiled data and review of revenue sources are presented in
the study findings.
The DWA together with the Water Research Commission (WRC) undertook various studies
that are relevant to this research project. The research project considered the various studies
undertaken by the DWA and WRC. A representative sample of some of the relevant studies
is listed below.
4.3.3 Data types
Four levels of data types in quantitative data analysis were considered and used where
appropriate (cf. Taylor, 2002; Coldwell & Herbst, 2004; Tustin et al., 2005): i) Nominal

52
(categorical) data (scales); ii).Ordinal (ranked) data; iii) Interval and ratio (scaling) data; and
iv) Ratio (scaling) data.
Table 4.1: Representative sample of secondary studies and/or reports used in the research.
TOPIC AUTHOR WRC REPORT
NO.
Economic regulation of water services in
SA
Palmer Development
Group
1383/1/04
Supply pricing of urban water in SA R Eberhard 678/1/99
Development of models for economic
evaluation of the integrated management
of the quantity and quality of irrigation
water within river catchments
B Grove 1043/1/04
Retail Water and Sanitation Guidelines DWA
Guidelines for bulk potable water tariffs DWA
Development of an integrated regulatory
framework for the water sector
Khanyisile Consulting
Services CC
Assessment of the ultimate potential and
future marginal cost of water resources
in South Africa
MS Basson DWA Rep. no. P
RSA
000/00/12610
Research impact assessment of the water
administration system
D Winter TT 447/09
Cost and tariff model for rural water
supply schemes
D Still 886/1/03
Cost benefit analysis in SA for water
resource development
Conningarth
Economists
TT177/02
Estimation of residential price elasticity
of demand for water by means of a
contingent valuation approach
GA Veck 790/1/00
Supply pricing of urban water in SA R Eberhard 678/2/99
Corporatisation of municipal services
providers
Palmer Development
group
TT 199/02
Proposed tariffs for the use of DWAF M Vawda

53
TOPIC AUTHOR WRC REPORT
NO.
water resources for small scale
hydropower generation with a capacity
of not greater than 20 MW
Cost recovery for water schemes to
developing urban communities
D Hazelton 521/1/98
Identifying examples of successful cost
recovery approaches in low income,
urban and peri-urban areas
L Marah 1131/1/03
Incorporating economic considerations
into quantification, allocation and
management of the environmental water
reserve
M Mander 978/1/02
Development of a hydrological
economic agricultural model based on
case studies in the upper Mvoti
Catchment
G Creemers 890/1/02
Researching, developing & testing of
payment strategies for the lower income
groups at four selected communities in
order to manage charges for water use
DS van Vuuren 202/1/03
Payment strategies & price elasticity of
demand for water for different income
groups in three selected urban areas
DS van Vuuren 1296/1/04
The development of an activity based
costing model to quantify the real costs
of delivering water services in rural
areas
W Matthews 1614/1/09
Supply pricing of urban water in South
Africa
R Eberhard 678/1/99
Effective cost recovery in a changing
institutional and policy environment:
L Marah 1384/1/04

54
TOPIC AUTHOR WRC REPORT
NO.
Municipal demarcation, the “free basic
water” policy and financially sustainable
service delivery
Investigating the mechanism and
processes used in setting water services
tariffs
P Hosking K5/1871/3
An investigation into the water
infrastructure development financial
allocation pathways in municipalities
B Hollingworth K5-1844
Water supply services model manual Palmer development
group
KV109/98
Guidelines for economic regulation of
water services in SA
Palmer development
group
TT229/04
The review of industrial effluent tariff
structures in SA
Des Kerdachi 854/1/02
Guidelines for setting water tariffs with a
focus on industrial, commercial & other
non-residential consumers
Palmer Development
group
992/1/00
4.3.4 Data validation
To ensure that the data contained in the storage and retrieval system can be used for decision
making, each data quality needs were defined, i.e. the required accuracy and precision
(Chapman, 1992; Taylor, 2002; Coldwell & Herbst, 2004; Tustin et al., 2005). It must be
noted that all phases of the data collection process, i.e. planning, collection, analysis and data
storage, contribute to the quality of the data.
Of particular importance was the care and checking of the original coding entry of data
(Chapman, 1992; Taylor, 2002; Coldwell & Herbst, 2004; Tustin et al., 2005). Other careful
design of data codes and entry systems minimised input errors. Experience also showed that
major mistakes can be made in transferring data to databases, even when using standardized
data forms. It was absolutely essential that there was a high level of confidence in the
validity of the data to be analyzed and interpreted. Without such confidence, further data

55
manipulation is fruitless. If invalid data are subsequently combined with valid data, the
integrity of the latter is also impaired.
4.4 Reliability and validity issues
4.4.1 Reliability
Reliability refers to whether you as a researcher has measured or recorded something
accurately and whether if another person repeats the same exercise would he/she obtain the
same result (Lewis, 2001). Therefore the evidence t collected was sufficient, authentic and
valid to ensure reliability of my problem statement.
Furthermore, to test the particular hypotheses to see whether or not it sustains the test, it was
subjected to exactly the same test to which it was subjected before (Coldwell & Herbst,
2004). Thus, consistency was the hallmark of my reliability and several ways of measuring
were delineated. For reliability, the test-retest reliability technique was used.
4.4.2 Validity including threats to validity/improving validity
This refers to whether the evidence can demonstrate it worth or relevance (validity) for the
selected research problem. Validity or valid evidence was central to the way in which
research was conducted. Two fundamental kinds of validity in relation to research designs
(cf. Denscombe, 2003; Coldwell & Herbst, 2004) were of importance:
• Internal validity – findings followed in a direct and unproblematic manner/way from
its methods and therefore it ‘sustains’ its findings or conclusions.
• External validity – findings or conclusions can be generalised beyond the confines of
the design and the study setting.
Both types of validity, internal and external, were important and desirable attributes of the
research design. There was little point in having results that are coherent, and which were
sustained completely by the research procedure one has utilised, if they were merely self-
referring. Similarly, there was no point in conducting research that paid great attention to
external validity if the design was flawed and lead to spurious results.

56
Thus, in the context of gathering valid evidence (validity) and to address any uncertainty, the
approach(es) or method(s) for my research project were:
• To use more than on method when investigating the research topic (cf. data
collection)
• Recognise the value of using multi-methods for the corroboration of findings and for
enhancing the validity of data
• Recognise that the notion of a single financial and/or technical notion is controversial,
and therefore adopt a cautious approach and/or position which avoids any
controversies
• Appreciate that different methods might point in a similar direction but unlikely to
meet at some precise, unequivocal point of reality
• Avoid the presumption that use of certain methodological and systematic models can
prove that data or analyses are absolutely correct.
• Statistical methods and analysis
4.5 Data analysis
The types of data collected for the research topic were many and varied. Data analysis and
presentation, together with interpretation of the results and report writing, normally form the
last step in the research project process. It is this phase that shows how successful the
activities have been in attaining the objectives of the problem statement. It is also the step
that provides the information needed for decision making, such as choosing the most
appropriate solution to the problem statement, assessing the state of the topic or refining
process itself.
Statistical methods and analysis and funding (financial and economic) models were used to
test the data sets (cf. Gilbert, 1987; Chapman, 1992, Hounslow, 1995). Descriptive statistics
were used to summarise data sets into simpler and more understandable forms, such as the
mean, median and standard deviation (SD). When these and other questions are re-stated in
the form of hypotheses then inductive (inferential) statistics were performed. Funding
(financial and economic models) will be described for the capital investment priorities for
water resources infrastructure development in South Africa.

57
4.5.1 Descriptive and Inferential statistics
4.5.1.1 Descriptive statistics
These are the most commonly used, and form the basis for more advanced (mathematical)
statistical techniques. The statistics used included number, i.e. groups, percentages, and
frequencies, measures of central tendency, i.e. mean, and measures of variation, i.e. range,
standard error and/or standard deviation (Coldwell & Herbst, 2004; Tustin et. al., 2005).
4.5.1.2 Inferential Statistical Analysis
Inferential statistics go beyond describing of data, i.e. they were used to answer such
questions as whether two or more groups differ on a given attribute, or whether a relationship
exists between variable x and y (Taylor, 2002; Coldwell & Herbst, 2004; Tustin et. al., 2005).
Their purpose was to enable inferences to be made about the population from which
particular samples were drawn (Taylor, 2002; Coldwell & Herbst, 2004). However, since
data were based on samples, they are subjected to sampling error. Inferential statistics were
used to determine the level of uncertainty with which the findings should be treated. The
techniques used were ANOVA and F-tests. For the significance tests the parametric two-
tailed F-test.
The statistical analysis for the research topic included the completeness of the survey and
helps to identify any information gaps or data inaccuracies. For statistical analysis and
national reporting, the various block structures were normalized into the most-common and
standard structure. The study also applied modelling techniques to gain a deeper
understanding of the social and financial impact of the tariffs, including, i.e. the mathematical
average adds the tariffs of all municipalities within each block and then divides the sum by
the total number of municipalities (returns); the population-weighted average considers the
number of people affected within each municipality and by each tariff block; and the volume-
weighted average considers people and their service levels, thus representing the average
value of 1kl of water used in each of the blocks.
4.6 Conclusion
The population and sample, data collection and data analysis formed the spine or nucleus for
the adequate funding model formulation described in the theory and how it can be applied.

58
Thus, the substantial primary data, through surveys (questionnaires), and secondary data,
documents and reports, collection were used to develop the model(s) described in the results
in Chapter 5. It suggests that from the theory information, data collection method and data
analysis showed that the data/information collected on water infrastructure investment and
funding, viz. development projects and operation and maintenance, were adequate and
sufficient.
59
CHAPTER 5: RESEARCH RESULTS
5.1 Introduction
The results for the problem statement are discussed based on the research findings obtained
through the various data collection methods. These are based on the following research
objectives:
• To describe the key sources of funding of water infrastructure
• To identify the funding (finance management and economic analyses) models for
financing water infrastructure development projects
• To identify comparative funding models in other emerging or developmental
economies, i.e. failures and successes, benchmarking, comparative analysis and best
management practices, from other countries.
• To ensure using research analysis to make recommendations
The hypotheses to be tested for the funding models for the financing of water infrastructure in
South Africa are:
• Current funding for the financing of water infrastructure is adequate and appropriate
and therefore no need for substantial changes or alterations
• Government and its entities do have adequate financial resources for the financing of
water infrastructure
The results and main findings from the primary (questionnaires, surveys, etc.) and the
secondary data collection are presented in the following sections. This will demonstrate
whether the objectives and hypotheses set were addressed in the research project.
5.2 Principles for the funding models
The framework for water sector infrastructure funding models was designed to meet the
challenges presented by the current and growing imbalances which exist between the supply
of and demand for water in South Africa (cf. Figure 5.1). To this end, the project was guided
by the principles of achieving the key themes.

60
1 Institutional
Capacity
2. Water Resources
Infrastructure
3. Water Services
Infrastructure
4. Operations &
Maintenance
2. Management,
Capacity & Research
3. Funding
National Water Infrastructure Framework
(Policy) Key Performance AreasEnablers
Per
form
ance
Cri
teri
a
Key
Per
form
ance
Indic
ators
1. Assessment,
Information &Plans
Figure 5.1: National water infrastructure framework policy with key performance indicators
for water infrastructure in South Africa.
From the research results of the data collection, 10 principle drivers have been identified for
the funding (financing) of water infrastructure development:
• Financing and investment framework/model - Alternative funding models for public
water infrastructure, i.e. Water resources (dams, pipelines, canals, Information on
gauging stations, etc.), water services (reticulation, water treatment works, waste
water treatment works, etc.), including the application of Public Private Partnerships
(PPPs) should be pursued where possible in order to encourage innovation and reduce
taxpayer exposure.
• Sustainable asset management - Sustainable water infrastructure needs to consider the
life time cost of funding water infrastructure and the contribution to the capital and
operation expenditure cost of that infrastructure by the user.
• Viability and acceptability of real costs - Strategic issues for financing and
management tools and value chain accounting for water resources and services –
primary, secondary and tertiary principles (social and economic).
• Economics of water – economic criteria for water infrastructure; unpacking of New
Growth Plan (NGP) and Industrial Policy Action Plan 2 (IPAP2) - meet the
challenges in growth of demand.

61
• Hierarchical impact - Improved accountability for water security, availability and
quality; and better management of supply and demand of water.
• Impact by development - Strategic positioning and importance of water; nett value of
water (social and economic value).
• Financial management water - Barriers to investment in water infrastructure are
removed by adopting a streamlined approach to legislation and the consultation
process and how to manage and sustain a secure business (operational side).
• Trading of water entitlements (rights) - Greater weight should be placed on the
jurisprudence set down by the Water Tribunal under the National Water Act when
determining both public and private changes and resource consent applications in
order to address poor quality outcomes.
• Return on investment - funding methodology to ensure maximum return on
investment for new infrastructure development.
• Value of reliability, quality and sustainability, and financial and ecological
sustainability of water resources and services and water infrastructure development.
• Governance structure – Consolidation and modernisation of water infrastructure
consultation would provide a greater degree of certainty to the funders and developers
that build and own water infrastructure.
In addition, the following principles were taken into consideration in the funding models
design or formulation from the research results:
i. Improve economic inclusion and ability to provide affordable services and to cross-
subsidise;
ii. Integrated risk management;
iii. Ability to leverage finance for commercial projects;
iv. It should lead to economies of scale;
v. Whatever model is chosen should not compete with local government but should
complement local government constitutional mandate-improve service delivery;
vi. There must be ability to attract and retain necessary skills to operate and maintain
infrastructure;
The reforms should enable the DWA to take charge of the entire water value chain
whilst recognizing legislative mandates of others; and
vii. Differentiated approach

62
5.3 Identifying the Funding Models for Water Infrastructure
The research results identified the specific funding models in existence and others that are
needed for the development of future water infrastructure projects in South Africa. This
could take the form of one or a combination of the following funding models:-
1. Funding by the National Revenue Fund (on-budget)
2. Funding through grants (MIG, RBIG, Conditional Grants, etc.) from the National
Revenue Fund (on-budget)
3. Funding through the development of a tariff model (via balance sheet)
4. Funding through the raising of funds on the financial markets (off-budget)
5. Funding through Private-Public-Partnerships (Hybrid model – on-and off-budget)
6. Funding through the private sector markets – e.g. private sector investment in the
form of Build Own Operate Transfer (BOOT) scheme (cf. Appendix 4 for different
generic range of non-traditional service delivery initiatives)
7. Demand (market) risk funding model for water infrastructure
8. Innovative financing models
9. Establishment of special banks or financial institutions - to underwrite low interest
loans for the investment in water infrastructure
10. Issuing of medium and long-term tax-free bonds
11. Creation of water infrastructure as a service entity, bureau or consortium (using of
shares on the stock exchange or through private subscriptions)
12. Accessing of capital markets (revolving loans and other similar debt and equity
structures)
13. Application of incentives (matching ratios to stimulate investment).
14. Alternative funding models in respect of government guarantee, a new paradigm shift.
In some cases depending on the implementation environment the models proposed above
might fall short of raising the complete capital investment required for a particular water
infrastructure development project therefore considering a combination of them would be
more advisable.

63
5.3.1 Funding by the National Revenue Fund (on-budget) – Water Resources
Infrastructure
The Department of Water Affairs is primarily responsible for infrastructure development.
Spending grew from R4.8 billion in 2007/08 to R8.2 billion in 2010/11, at a mean annual rate
of 16.3% (SD±3.5%), and over the MTEF period (2011/12 – 2013/14), spending will increase
from R8.2 billion to R10.9 billion, at a mean annual rate of 8.8% (SD±7.7%). However,
much of the financing (through augmentation from the Main Account), construction,
implementation and commissioning of the bulk raw water infrastructure is done by the Water
Trading Entity (cf. Figure 5.2). However, the regional bulk infrastructure is mainly
developed by water service authorities and water boards. The Department of Water Affairs
oversees and manages a total of 151 water and waste water infrastructure projects at various
levels of government throughout South Africa. The total estimated cost of these projects is
R70.9 billion. The projects are at different stages of completion and include those projects
where new infrastructure is being built, or existing infrastructure is being refurbished,
rehabilitated, upgraded or maintained. Infrastructure spending includes direct expenditure on
national water resources infrastructure projects by the department through its public entities
and indirect expenditure on regional bulk water and waste water infrastructure projects
through transfers to water services authorities and water boards. Between 2007/08 and
2009/10, approximately R5.1 billion was spent on water and waste water infrastructure
projects and in 2010/11 approximately R2.7 billion. Over the MTEF period, expenditure is
expected to increase to R13.6 billion.
The National Water Resources Infrastructure programme consists of two components:
• Infrastructure Development and Rehabilitation provides for the design, construction
and commissioning of new water resource infrastructure as well as the rehabilitation
of existing infrastructure to ensure the safety and functionality of departmental dams
and related infrastructure. It has a budget of R2.4 million in 2011/12 and R7.2 billion
over the medium term, the bulk of which will be used for infrastructure development
and related projects. In 2010/11, R1.9 billion was transferred to the water trading
entity (WTE) to continue developments of and refurbishments to existing
infrastructure such as dams, pipelines, reservoirs and canals.
• Operations of Water Resources provides for the augmentation of the Water Trading
Entity to ensure the effective management of water resources and the sustainable
operation and management of bulk raw water infrastructure. Over the MTEF R890

64
million will be spent, and an additional expenditure of R962.7 million would be
allocated to the dam safety rehabilitation project. No other form of funding is
available for water resources infrastructure operations and maintenance due to the fact
that these water infrastructure assets are under the ownership of the national
government.
The National Water Resources Infrastructure programme’s sole responsibility is to provide
transfer payments to the Water Trading Entity. The entity manages the development and
rehabilitation of infrastructure as well as the operation of infrastructure on behalf of the
Department. Infrastructure, Development and Rehabilitation expenditure increased from
R1.2 million in 2007/08 to R3.04 billion in 2013/14, at a mean annual rate of 14.1%
(SD±9.7%. The significant growth in the programme is as a result of additional allocations
for water resources development projects. These allocations are disbursed as transfers to the
Water Trading Entity (WTE). Over the medium term the Department will continue to
transfer R7.227 billion for the construction of water augmentation and other projects. Over
the MTEF period alone, expenditure in this programme is expected to grow marginally at a
mean annual rate of 9.5% (SD±6.7%), from R2.2 billion in 2010/11 to R3 billion in 2013/14.
National Treasury
(National Revenue Fund)
National departments
(DWA, DCOGTA),
Municipalities
StakeholderParticipation
(e.g. DoE, DPE, DCOGTA,
water users, etc.)
Infrastructure
Grants
Water InfrastructureWater supplyservices
Public fundingService level
agreements
Water users
Water Sector pricing
(charges, tariffs, levies,
etc.)
Public Private Partnerships
Public Entities and Agencies
(Water Boards, TCTA, KOBWA,
WRC)
Social Cohesion
Public health (Raw and drinking
water quality)
Figure 5.2: Main funding flows for water infrastructure in South Africa.

65
5.3.2 Funding through grants (MIG, RBIG, Equitable Share; Conditional Grants)
from the National Revenue Fund (on-budget) - Water Services Infrastructure
5.3.2.1 Municipal Infrastructure Grant (MIG)
The Municipal Infrastructure Grant transfer to municipalities has grown significantly from
R 5.938 billion in 2006/07 to R 12.529 billion in financial year (2010/11) and is further
projected to grow to R 18.322 billion by 2012/13 – this represents a significant growth of
more than triple the budget of 6 years ago. Spending has continued to consistently improve
in the last few years.
While there are various backlog figures used, all sources show the extent to which many
households lack basic services. Water services and sanitation (waste water) are the biggest
concern in terms of backlogs in three provinces, i.e. Eastern Cape, KwaZulu-Natal and
Limpopo (Table 5.1). Thus, for these backlogs to be addressed or eradicated alternative or a
combination of funding models are needed.
Table 5.1: Current Levels of Access to Basic Services
Municipal Backlogs
per Province
Backlog (% with service below adequate)
Electricity Piped
Water Sanitation
Refuse
Removal
Western Cape 6.0% 1.1% 6.6% 8.9%
Free State 13.4% 2.5% 30.6% 23.9%
Gauteng 16.5% 2.1% 12.2% 13.8%
North West 17.7% 10.1% 18.4% 45.2%
Mpumalanga 18.3% 8.7% 46.1% 58.5%
Limpopo 19.0% 16.4% 69.2% 81.3%
KwaZulu Natal 28.5% 20.6% 36.1% 48.1%
Northern Cape 12.7% 5.2% 45.5% 27.9%
Eastern Cape 34.5% 29.6% 51.1% 60.0%
South Africa 20% 11.4% 32.4% 38.4%

66
5.3.2.1.1 Municipal infrastructure delivery and management failure
The results from the primary data collected, from the DWA, DCOGTA, provinces and
municipalities all indicated a concern over poor planning and adherence to a municipal
financial framework model as required (cf. Figure 5.3). Ideally, the financial planning should
include high level planning for all infrastructure, drawing from the detailed sector
infrastructure plans (tying these together cohesively), and providing a sense of what is
possible within financial and institutional constraints. Currently this is lacking.
The Municipal Infrastructure Investment Framework (MIIF) which aimed at assessing the
required levels of capital and operating expenditure to meet 2014 service targets against the
available finance to cover this expenditure indicate a serious shortfall in capital (cf. Figure
5.4). The estimated requirement for 2010 alone is some R 91 billion compared to the current
budget (including ESKOM and Water Boards) of R 47 billion (cf. Figure 5.5). This shortfall
partly relates to insufficient transfers, but the raising of revenue through rates and tariffs is an
equally big concern. In assessing the options for closing this funding gap, the MIIF indicates
the following:
MUNICIPAL FINANCIAL FRAMEWORK
Operating grants
(Primarily equitable share)
OPERATING
CAPITAL Own sources(user charges;
rates; levies etc.)
Own sources
(capital funds,
loans etc.)
Capital
grants(MTG)
Higher service
level-economic
Basic service
social
Figure 5.3: Municipal financial framework for water infrastructure at local government.

67
• Increased borrowing and funding from developer charges in A and B1 municipalities.
B1 municipalities will still be finance constrained and will need to improve their
credit worthiness to be able to access loan financing.
• In the case of B2 and B3 municipalities, the situation is highly variable and much
depends on how strong their local economies are. Some will be able to borrow but not
what is required in total. These will require higher levels of grant funding to deliver
infrastructure effectively to meet growth and backlog eradication targets while at the
same time provide for proper rehabilitation.
• In the case of B4 municipalities, their capital constraints are most severe and they
only have approximately 40% of what is needed. This situation may only be rescued
through much higher levels of capital grants or an acceptance of dramatically reduced
service levels.
Figure 5.4: Capital expenditure per infrastructure class at municipal level.
-
20 000
40 000
60 000
80 000
100 000
120 000
140 000
2010 2011 2012 2013 2014 2015 2016 2017 2018 2019
R mi
llion
s
Capital expenditure: excluding land and top structure for housing
Water Supply Sanitation
Electricity Solid Waste
Roads Public services
Public transport Public places
Economic infra and buildings Admin buildings and systems
Budget

68
Figure 5.5: Required Capital Expenditure versus Available Funding.
The Figures 5.6 and 5.7 show the trend in terms of the viability (surplus or deficit) of
municipalities overall and by each service.
The interpretation of the operating account results in total (for all municipalities in aggregate)
are not strictly speaking correct as the situation is so variable across the categories of
municipalities due to their vastly different income-raising capacity and infrastructure
backlogs (cf. Figures 5.6 and 5.7). On average, if municipalities operate fully functional
metering, billing and revenue collection systems (which is a rather significant assumption);
they may be able to meet their operating requirements. But for economically weaker
municipalities, the trend is rapidly downwards as they roll out services to mostly poor people.
This downward trend can only be resolved by substantially higher funding or transfers for
these poorer municipalities.
-
20 000
40 000
60 000
80 000
100 000
120 000
140 000
2010 2011 2012 2013 2014 2015 2016 2017 2018 2019
R m
illio
nsSources of finance (excluding land and top structure for
housing)
Housing subsidies MIG Other grants and subsidies
Development charges Service provider funding Internal funds
Borrowing requirement

69
Figure 5.6: Estimated operating balances overall and per municipal services
-15 000
-10 000
-5 000
-
5 000
10 000
15 000
2010 2011 2012 2013 2014 2015 2016 2017 2018 2019R m
illio
n
Surplus/shortfall on services
-
50 000
100 000
150 000
200 000
250 000
300 000
350 000
2010 2011 2012 2013 2014 2015 2016 2017 2018 2019
R m
illio
n
Operating expenditure
Other (excluding GAPD) GAPD Public services
Roads Solid Waste Electricity
Sanitation Water supply
Operating revenue
-
50,000
100,000
150,000
200,000
250,000
300,000
350,000
2010 2011 2012 2013 2014 2015 2016 2017 2018 2019
R m
illio
n
User charges Rates, levies and other internal
Equitable share Other operating grants and subsidies

70
Figure 5.7: Funding Surplus/Shortfall overall and per municipal service.
5.3.2.1.2 Required Expenditure by Infrastructure type
Using the Municipal Infrastructure Investment Framework (MIIF) models it was possible to
quantify funding requirements for the different services for the above municipal categories
(high, medium and low capacity). This provides a sense of the differentiated funding
requirements for each category.
5.3.2.1.2.1 Capital requirements
The total capital required to meet current backlogs and projected future demand as well as
undertake required rehabilitation for all municipal services in all municipalities to be R970
billion over 10 years (including provision for escalation). These figures include the capital
investment required by external service providers (Water Boards). The requirement in Year 1
to meet this 10 year target would be R91 billion. Of this R91 billion, R66 billion is required
for the ‘Big 5’ municipal services (water, sanitation, roads, electricity and solid waste). The
distribution of this investment by municipal category for Year 1 is shown below (cf. Table
5.2; Figures 5.6 and 5.7).
The data (using Year 1 for the purposes of this analysis) shows that:
• Low capacity municipalities require substantial capital for water infrastructure
rehabilitation than for new infrastructure in total (this is mainly the backlog).
• At the other end of the spectrum, high capacity municipalities require a focus on new
infrastructure (mainly economic infrastructure, e.g. urban transport systems and
public places and water services) as well as rehabilitation (mainly roads and water
supply systems).
Annual surplus/shortfall per service
-20,000
-15,000
-10,000
-5,000
-
5,000
10,000
2010 2011 2012 2013 2014 2015 2016 2017 2018 2019
R m
illio
ns
Water Supply Sanitation Electricity
Solid Waste Rates and general

71
Table 5.2: Capital Requirements (Rand billions) of high, medium, low capacity
municipalities
Infrastructure
by sector
Municipal category by capacity
Low capacity Medium
Capacity High capacity Total
New Rehab New Rehab New Rehab New Rehab
Water 1,051 903 1,409 1,348 4,897 3,793 7,358 6,044
Sanitation 981 624 1,164 843 3,620 2,181 5,765 3,648
Electricity 1,720 749 1,343 968 2,887 2,234 5,951 3,950
Solid waste 70 - 284 0 1,013 40 1,367 40
Roads 837 13,131 1,834 7,937 2,882 5,670 5,553 26,737
All other 1,575 264 2,167 497 10,419 2,086 14,161 2,848
Total 6,235 15,670 8,202 11,593 25,719 16,004 40,156 43,268
5.3.2.1.2.2 Operating requirements
Operating expenditure is calculated in the MIIF as the amount required to adequately manage
each municipal service (cf. Table 5.3). The total required operating expenditure for all
services in all municipalities was calculated to be R2 726 billion over 10 years and R177
billion for Year 1. Of this R177 billion for Year 1, R108 billion is for operating the ‘Big 5’
municipal services, with water infrastructure requirements of R16 Billion. Municipal budgets
target a total income of more than R24 billion of which R19.5 billion is collected for water
supply and R4.6 billion from sanitation services. Water services generated a net surplus of
about R4.1 billion which will be used to cross-subsidise other services or, if approved, could
be used for recapitalisation of water services assets. About 55% of the operating expenditure
(R12 billion) is used in the six metros and of the remainder, ca. R7 billions, is used by local
municipalities and about R2 billion by district municipalities.
The data (using Year 1 for the purposes of this analysis) shows that (cf. Table 5.3):
• High capacity municipalities require a significantly higher annual operating amount
than any other category.
• The operating requirements for low and medium capacity municipalities are similar in
focus and magnitude.

72
Table 5.3: Operating Requirements (Rand billions) of high, medium, low capacity
municipalities.
Infrastructure
by sector
Municipal category by capacity
Low Capacity Medium Capacity High Capacity Total
Water 2,239 3,426 10,915 16,580
Sanitation 865 1,653 4,831 7,350
Electricity 7,066 15,032 44,426 66,524
Solid waste 329 1,469 3,855 5,653
Roads 4,115 3,330 4,980 12,424
All other 4,715 13,181 50,107 68,002
Total 19,329 38,091 119,114 176,534
Current Infrastructure Budgets
Notwithstanding these estimated financing requirements, the current MTEF budgets are
shown in Table 5.4 against the required funding levels.
The MIG MTEF allocations provide for: R12.529 billion in 2010/11; R15.069 billion in
2011/12 and R18.323 billion in 2012/13. The equitable share transfers projected over the
MTEF period are: R30.168 billion in 2010/11; R33.940 billion in 2011/12 and R37.234
billion in 2012/13.
5.3.2.2 Regional Bulk Infrastructure Grant (RBIG)
The focus of the Water Services Regional Bulk Infrastructure fund is on regional and local
bulk water supply and sanitation services. This includes “enabling infrastructure” required to
connect water resources over vast distances with bulk and reticulation systems. An overview
of all bulk infrastructure requirements in the country is ongoing and it is estimated that the
total funding required is R112 billion.

73
Table 5.4: Funding Requirements against Current Budget Allocations per category (in
Rand billions)
Municipal Infrastructure Grant
Allocations
Municipal category by capacity
Low
Capacity
Medium
Capacity
High
Capacity Total
Capital Requirements (Year 1) against MIG Allocations (2010/11)
Total MIG 4,286 4,175 4,068 12,529
MIIF round 7 total estimated capital
budgets 8,504 9,457 26,639 44,600
Total Capital Requirements 21,905 19,795 41,723 83,424
% MIG contribution to Capital
Requirements 20% 21% 10% 15%
% Estimated capital budgets vs Capital
Requirements 39% 48% 64% 53%
Operating Requirements (Year 1) against Equitable Share Transfers (2010/11)
Equitable Share 8,630 10,136 11,402 31,168
MIIF estimated operating revenue 21,515 38,375 123,411 183,301
Total Operating Requirements 19,329 38,091 119,114 176,534
% ES contribution to Capital Requirements 45% 27% 10% 18%
% Estimated operating revenue vs operating
requirements 111% 99% 97% 104%
Regional Bulk Infrastructure Programme develops regional bulk infrastructure for water
supply and water treatment works and supplements regional bulk sanitation collector systems
as well as regional wastewater treatment works. Regional bulk infrastructure is required to
connect the water resource, on a macro or sub-regional scale (over vast distances), with
internal bulk and reticulation systems or any bulk supply infrastructure. The activities consist
of connecting water from a water source to a municipal reticulation system.
Accelerated Community Infrastructure Programme implements an intervention to expedite
service delivery through community infrastructure programme to achieve the target for
universal access to water supply. For the 2010/11 financial year, a budget of R259 million
was allocated. From the inception of the programme (2009/10 financial year), the funding is

74
utilised for the construction of new water services infrastructure projects (amongst which are
wastewater treatment refurbishment, community water supply infrastructure).
The Regional Implementation and Support Programme finances regional infrastructure
through transfers from the Department to provinces and municipalities. Expenditure in the
programme grew at a mean annual rate of 16.5% (SD±2.9%), from R2.5 billion in 2007/08
to R4.3 billion in 2010/11. Over the medium term period (2011/12 to 2013/2014), the
programme’s budget increases at a mean annual rate of 11.4% (SD±9.1%) from R4.4 billion
to R6.1 billion. This strong growth is mainly due to additional transfers to local government
for the construction of water supply and distribution infrastructure. Between 2007/08 and
2010/11, transfers to municipalities increased from R733.2 million to R1.04 billion, at a mean
annual rate of 9.8% (SD±18.1%), and over the medium term period, the transfers will
decrease from R1.04 to R422 million, at a mean annual rate of -34.5% (SD±79.3%).
5.3.2.3 Equitable Share and Conditional Grants
Each province’s and municipality’s share of government’s equitable share of revenue is
raised nationally in respect of a particular the financial year. An envisaged division between
provinces and municipalities of revenue anticipated are also raised nationally in respect of the
next financial years, and which is subject to the provisions of the annual Division of Revenue
Acts for those financial years. Each province and municipality equitable share is transferred
to the primary bank account of the province and municipality, in accordance with a payment
schedule determined by the National Treasury.
Conditional grants means conditional allocations to provinces, local government or
municipalities from the national government’s share of revenue raised nationally, which are
provided for and whose purpose is specified in the annual Division of Revenue Act (DORA;
NT, 2011c). Conditional allocations specifying the following:
• allocations to municipalities to supplement the funding of functions funded from
municipal budgets;
• specifying specific-purpose allocations to municipalities;
• specifying allocations-in-kind to municipalities for designated special programmes;
• specifying incentives to municipalities to meet targets with regard to priority
government programmes; and

75
• specifying funds that are currently not allocated to specific municipalities, that may be
released to local government or municipalities to fund disaster response, i.e. damage
to water infrastructure from floods, etc.
This had been implemented through the Water Services Operating Subsidy (WSOS) grant
which has two components: Direct Transfers to local government and an Indirect Grant
which provides for the refurbishment of water and waste water schemes which are not
transferred to municipalities but are still with the DWA. In 2009/10, the WSOS grant had a
total budget of R1.1 billion of which R871.2 million was for the direct grant and R209.5
million for the Indirect Grant. In 2010/11 the budget decreased to R845 million of which
R670.1million was for the Direct Grant and R175 million for the Indirect Grant.
5.3.2.4 Infrastructure Operations and Maintenance Grants
This is needed in South Africa at national, regional (provincial) and local government level
for reducing impacts to water resources and directly affecting water use sectors. It can be
preventative measure for the further deterioration of water infrastructure. This grant could be
a welcoming addition in the need for augmenting funding for water infrastructure operations
and maintenance since there is currently no financial/funding reserves available for this
function. This can be introduced in a phased approach similar to the current funding for the
dam safety rehabilitation (DSRP) and regional bulk infrastructure grant (RBIG) programmes
both currently being implemented and managed under the auspices of the DWA.
5.3.3 Funding through the development of a tariff model (via balance sheet) -
Public Entities and other Agencies
5.3.3.1 Pricing Strategy for Water Use Charges
The current pricing strategy was gazetted in Government Gazette No. 29696 on 16 March
2007 (DWAF, 2007). The Pricing Strategy is seen as a process that evolves over time and is
aimed at achieving the efficient and cost effective allocation of water (cf. Table 5.5; Figures
5.8 - 5.12). It was also meant to ensure the long term sustainability of water related
infrastructure and the natural environment. The current pricing strategy makes provision for
the cushioning of the effect of the periodic technical revaluation of the national water
resources infrastructure (NWRI) assets and offers tariff capping and exemptions which
mainly benefits the irrigation sector.

76
Current legislation (National Water Act, 1998 and Water Services Act, 1997) provides for a
3-tier pricing of water supply services, including (cf. Table 5.5; Figures 5.8, 5.9 and 5.11):
• Tier-1: raw water use from the water source or supplied from a government
waterworks
• Tier-2: water supplied in bulk by public entities and agencies, i.e. water boards,
TCTA, KOBWA
• Tier-3: water distributed to households (by water services authorities)
The Pricing Strategy contains the objectives, methodology and implementation strategy for
setting water use charges as follows:
• Funding water resource management: Activities such as planning and implementing
catchment strategies, monitoring and assessing water resource availability and use,
water allocation, water quantity management, including flood and drought
management, water distribution, control over abstraction, storage and stream flow
reduction activities, water resource protection, resource quality management and
water pollution control, water conservation and demand management and institutional
development and enabling the public to participate in water resource management and
decision-making.
• Funding water resource development and use of waterworks: The costs of
investigation, planning, design, construction, operation and maintenance of
government waterworks, as well as the pre-financing of development, a return on
investment (assets) and the costs of water distribution.
• Achieving the equitable and efficient allocation of water: Economic incentives to
encourage more efficient use of water, water conservation and a shift from lower to
higher value uses.
Resource management and resource development charges are financial charges, which are
directly related to the costs of managing water resources and supplying water from schemes
and systems. Charges have be phased in progressively over time, and the target of achieving
full cost recovery will therefore be achieved at different times for different water use sectors.
Similar provision is made for sanitation services, including (cf. Table 5.5; Figure 5.8):

77
• Wastewater collection charge (including the treatment costs)
• Bulk wastewater tariff (treatment costs)
• Waste Discharge Charge Tariff (polluter-pays principle) - aimed at internalising costs
associated with waste and to encourage the reduction in waste load, thereby
minimising the detrimental impacts on water resources.
According to the Water Pricing Strategy, any economic use of water is charged at the full
cost of supplying water to the users over a 20-year term. It requires the payment of a capital
unit charge (CUC) to repay the off-budget loan funding. This CUC is normally payable on a
take or pay basis from the water infrastructure development projects when commissioned on
the full licensed volume of each off-taker. The users agreed to pay on their license volume
and not actual demand for water, to increase the bankability of the revenue stream. A
systems tariff will apply where all commercial users will pay the same tariff. If the project’s
full funding is provided by National Treasury without refinancing the National Treasury for
the commercial potion, the economic cost of water for the scheme to be paid back to
government could be interest free and will then reduce substantially.
Appropriate pricing or tariffs for water has become an important issue for South Africa and
have substantial impacts on demand and supply. Different water tariffs are employed in
South Africa to ensure enough funds are collected to maintain and expand the supply
infrastructure (cf. Figures 5.9 and 5.12).

78
Water cost and pricing chain (Source: DWAF 2003)
Raw water from rivers,
Dams, boreholes andsprings
Raw Water
Tariff
Bulk water treatmentand distribution
Bulk Water Tariff
Reticulation of water toconsumers
Retail water
Consumers
Human excreta and
Wastewater collection
Bulk Wastewater
Tariff
Treatment and return ofWater to the river
Water ResourceManagement Charges
Waste Discharge
Charges
Water resourcemanagement
Sanitation Charges
2
3
6
7
5
1
4
Figure 5.8: The water cost and pricing for water supply and water infrastructure in South
Africa.
WATER INFRASTRUCTURE PROVISION
WATER INFRASTRUCTURE PROVISION
Environmental
externalities
Economic externalities
(e.g. pollution)
Opportunity costs
(costs savings paid by other users)
Capital charges
Operations & Maintenance
Full cost
recovery
Full cost = sustainable values
Full supplycost
Figure 5.9: Funding and cost recovery for water infrastructure in South Africa.

79
Water Infrastructure
Private sector
funding
Service levelagreements
Water supply
services
Revenue collection(Social responsibility,
charges, tariffs, levies, etc.)
Debt Repayment/Redemption
Public Entities and Agencies(Water Boards, TCTA, KOBWA,
WRC)
Social Cohesion
Public health (Raw and drinking
water quality)
Stakeholder
Participation(e.g. DoE, DPE, DCOGTA,
water users, etc.)
Water users
(Mining, agric., etc.)
National Treasury
(National Revenue Fund)
National departments
(DWA, DCOGTA),
Municipalities
Figure 5.10: Funding of water infrastructure through the balance sheet (tariff model and
private sector markets, if needed) in South Africa.
Public Agencies
(e.g. Trans-Caledon Tunnel
Auntority)
Department of Water Affairs
Public Entities
(e.g.Water Boards)
Municipalities
End users
Purified water delivered
Tariff
Tariff
Raw water tariff
Payment of raw water tariffDelivers Lesotho Highlands water
Figure 5.11: Different tariff structures for water using different water infrastructure

80
Table 5.5: User Fees for Water Infrastructure Facilities
Type of Infrastructure Possible User Fees
Water supply
Metered water use (stepped block tariff
system)
Full costing for connections
Seasonal pricing
Raw water usage charges (tariffs)
Depreciation costs (tariff)
Water resources management charge
Return of Investment (ROI)
Operations and Maintenance (Capital costs)
charge
Waste Discharge Charge System:
Wastewater treatment
Industrial wastewater treatment
Industrial and commercial effluent charge
Recreation Access to water resources infrastructure and
utilization of facilities
Seasonal pricing
Special district property taxes
Source: Raw Water Pricing Strategy of South Africa (DWAF, 1998; DWAF, 2007)
5.3.3.2 Marginal Cost of Water
Marginal cost is the change in total cost that arises when the quantity produced changes by a
unit (cf. Table 5.6; Appendix 5). That is, it is the cost of producing an additional unit of a
good. If the item being produced is divisible, the size of the marginal cost will change with
an additional volume produced. The reason for this is that there will always be fixed cost
which will remain the same with a variance in quantity, until such time when additional
demand will required expansion of the production capacity.
In general terms, marginal cost at each level of production includes any additional costs
required to produce the next unit. If making additional water available requires the building
of a new dam, the marginal cost of this extra water will includes the cost of the new dam.

81
Table 5.6: Using a hypothetical example one could work out the marginal cost.
Quantity of
water
supplied
(A)
Fixed cost
(dams,
pipelines)
(B)
Variable cost
(energy,
chemicals, etc.)
(C)
Total cost
B + C = D
(D)
Marginal
cost
3D–2D = 3E
(E)
Unit
cost
D / A
(F)
1 1 000 000 R10 000 000 R150 000 R10150 000 R10.15
2 2 000 000 R10 000 000 R300 000 R10300 000 R150 000 R5.15
3 3 000 000 R10 000 000 R450 000 R10450 000 R150 000 R3.48
4 4 000 000 R15 000 000 R600 000 R15600 000 R5150000 R3.90
In the example above (Table 5.6), providing the first 1 million units of water will cost R10
150 000 (R10 m for infrastructure + R150 000 for operations and maintenance), the unit cost
of water will be R10.15.
As supply moves to 2 million units, fixed cost will remain the same (dam/pipeline), however,
variable cost (energy/chemicals) will increase in proportion to the increased volume supplied.
This will result in a marginal cost of R150 000 (due to the additional unit supplied), however
the unit price will drop from R10.15 to R5.15 because the fixed cost remains the same (cf.
Table 5.6).
As volumes move to 3 million units the marginal cost (the difference between line 2 and 3 in
column E) is still R150 000 but unit cost reduces further from R5.15 to R3.48 also due to an
unchanged fixed cost and an increase in volumes (cf. Table 5.6).
As volumes increase to 4 million units it is assumed that the dam and pipelines needs to be
expanded, therefore a further R5 million is spent on upgrading the infrastructure, this
increases fixed cost to R15 million, and variable cost will increase to R600 000. This will
have the impact of increasing marginal cost by R5 150 000 (4(E)) (Table 5.6). Unit cost will
also increase from R3.48 to R3.90.
In order to understand the marginal cost of water, the following details for each water
infrastructure scheme:
1. Total fixed cost per scheme (ROI + Depreciation charges) or finance charges
2. Total variable cost per scheme (operations and maintenance charges)

82
3. Volumes sold from each scheme
4. Projected future demand
5. Cost of infrastructure development and expansion
5.3.3.2.1 Raw Water (Use) Tariffs
The raw water use tariffs/charges in terms of the raw water pricing strategy (RWPS) that
influence the marginal cost of water covered:
(i) Water resources management (WRM) cost to plan, manage, protect, allocate and
control water use from and water quality of water resources, which functions will
in future be undertaken by CMAs per WMA. The mean annual tariff was
R1.78/m3 (SD±R0.94) for domestic and industrial for the survey, a not significant
(p>0.25; F0.05; 1, 36 = 0.626; N = 38) mean increase of 12.32% (SD±0.48%) from
2008/9 (year-on-year), and slightly above the CPI. The mean annual tariff was
R4.37 (SD±R0.95) per province, although not significant (p>0.25; F0.05; 1, 16 =
0.304; N = 18) increase from the previous year(s). The costs are very still low
since much of these charges are currently subsidized form the national revenue
fund (central fiscal).
(ii) Water resource infrastructure charges on Government Water Schemes (GWS).
Such costs can include recovery of capital costs, taking cognisance of any state
funded grant, social contribution and/or commercial loan funding. The capital
should include refurbishment and betterments over the lifetime of the
infrastructure. Added to this are the operating, maintenance and statutory costs. A
spatial comparison between schemes, provinces and municipalities are used to
assign the relevant charges/tariffs of schemes to the institutions. Due to DWA’s
revaluation of assets some schemes showed higher increases, which is expected to
continue for a number of years due to a capping on increases specified in the
DWA water pricing strategy. These capping and exemption provisions impact
negatively on DWA’s income generating ability, which in turn leaves insufficient
funds for the development, maintenance and refurbishment of water infrastructure.

83
Cost of the Business
Planning Design Procure Construct Operate Maintain Refurb.
0,2% 2% 17% 44%
Typical % of Total Cost over the Life of Water Supply Infrastructure
37% Financing Cost
Figure 5.12: Total cost of the business for the water supply infrastructure
(iii) Economic charges such as incentives to increase economic value and efficiency of
water use.
(iv) Waste Discharge Charge System (WDCS) to affect the “polluter pays” principle
for mitigation of environmental costs, sustainable development, and protection of
the resource. The main objectives of the raw water use charges are to ensure
social equity, ecological sustainability, financial viability and economic
efficiency.
5.3.3.2.2 Bulk Water Tariffs
Water boards act as intermediaries to distribute raw and potable water across vast distances to
multiple users (i.e. regional water supply schemes). Not all municipalities are dependent on
regional bulk water supply infrastructure and hence can operate independent of both DWA
and water boards as long as they do so within the norms and standards of the Water Services
Act, National Water Act and related regulations and strategies.
The mean annual tariff was R3.05 (SD±R2.35) per water board. The increases varied
significantly with the mean increase of 14.33% (SD±20.57%) being above the CPI of 9.5%

84
for the period of surveyed. Most tariff increases were between 2% and 57%, however, above
the CPI, although not significantly differently (p<0.10); F0.05; 1, 34 = 2.239; N= 36) from the
previous year. The study identified the main customers of each WSP and intersected the
supply areas with the local municipality boundaries to create a first-order linkage of WSP
tariffs with municipalities. The bulk water supply figures are normally indicative since they
vary significantly from scheme to scheme. Specific tariffs are negotiated between WSPs and
WSAs.
5.3.3.2.3 Municipal Water Tariffs
The 2010 municipal tariffs reflect the outcome of a survey among all local municipalities
which obtained tariff information from 236 out of 237 local municipalities. All tariffs quoted
are VAT inclusive and the information includes the volume blocks used by municipalities
and sell to them by water boards. Also captured were the raw water and bulk water tariffs
which influence the determination of the municipal retail tariffs.
Municipalities expressed a concern regarding the cost of the raw water as well as life-cycle
cost compared to their equitable share contributions. Municipalities indicated unaffordability
of the water cost in the wake of water supply projects implementation and off-take
agreements. It would therefore be required that National Treasury assists Municipalities
financially not only by providing the funding for the water infrastructure, but also to fund the
shortfall in equitable share over time.
5.3.3.2.3.1 Residential Domestic Water Tariffs
The national mean domestic water tariff, from the survey, for 2010 (VAT inclusive) was
R5.98 (SD±R1.30) for the 6 kilolitre to 20 kilolitre (kl) block, R7.33 (SD±R1.66) for 20 to 60
kilolitre and R8.78 (SD±R2.17) for usage >60 kilolitre (P<0.05; F0.05; 2, 24 = 4.17; N = 27) (cf.
Figures 5.13 and 5.14). In comparison, the provincial mean tariffs for the 2009/10 increased
by 13.6% (SD±7.7%) for the 6-20 kl block, 13.1% (SD±9.6%) for the 20-60 kl and 16.9%
(SD±10.4%) for the >60 kl block. These national increases were above the corresponding
Consumers Price Index (CPI) of 9.5% year-on-year to March 2010/11.
The highest domestic water tariffs were in Gauteng, KwaZulu-Natal and the Western Cape.
The higher tariffs in Gauteng and Western Cape were generally associated with the high cost

85
of water supply over long/vast distances (via inter-basin transfer schemes). The Western
Cape, Gauteng and KwaZulu-Natal have had steep rise in their block tariffs, indicating a
demand management approach. The low(er) tariffs are associated with areas that have high
levels of poverty and low levels of affordability, i.e. Eastern Cape, Limpopo, Mpumalanga,
North-West and Northern Cape Provinces.
About 57% of municipalities increased tariff within the CPI range, while about 23% of
municipalities increased tariffs below the CPI and a further 20% increased tariffs at levels
above the CPI range. Comparing the different tariff books, percentages increases were higher
for the high-volume blocks, which indicate increased demand management and utilisation of
income from high volume users to cross-subsidise the lower volume users. A comparison of
urban and rural municipalities is about 10% below the equivalent tariffs in urban areas.
The mean commercial tariffs were R7.07 (SD±R0.48) for 6-20 kilolitre, R7.88 (SD±R0.32)
for 20-60 kilolitre and R8.70 (SD±R0.30) for volumes >60 kilolitre/month (cf. Table 5.8).
The respective increases in these tariff blocks were, 12%, 16% and 17%, which is in line with
the increases of the domestic water use tariffs and about 20-70% higher than the CPI for the
same reporting period. The commercial and industrial tariffs are higher than the domestic
tariffs in the lower blocks and in line on the higher use blocks thus indicating cross-
subsidisation to the domestic water use sector. This is to be expected as many of the new
domestic water services are for the low income and indigent customers.
The tariffs for 2010 indicate that rural municipalities charging more than urban
municipalities. This was attributable to the water shortages in rural areas, but can also
indicate the need for cross-subsidization in the rural poorer municipalities. It must be noted
that the user profiles differ from municipality to municipality and that it can be expected that
affordability of users will reflect in the specific tariff structure of a municipality. In general,
rural municipalities are less affluent and tariffs are expected to be cheaper for the lower
blocks, while reducing the margin in the upper blocks.
The study further applied modelling techniques to gain a deeper understanding of the social
and financial impact of the tariffs. The results are shown in Table 5.7 which indicates:
• The mathematical average adds the tariffs of all municipalities within each block and
then divides the sum by the total number of municipalities (returns). This represents
the average tariff between municipality institutions, regardless of their size.

86
• The population-weighted average considers the number of people affected within each
Local Municipality (LM) and by each tariff block. This reflects the typical rates paid
by a household for each block considering the fact that fewer people use the higher
blocks due to limited affordability.
• The volume-weighted average considers people and their service levels, thus
representing the average value of 1kl of water used in each of the blocks.
The population-weighted and volume-weighted average tariffs were higher in the upper
blocks as the number of people using such an extent of water (high levels of services) was
relatively few compared to the majority of people using water in the lower two blocks. The
weighted averages would be better figures to use at national reporting.
Table 5.7: Applied modelling for the 2010 water tariffs per block.
Unit of Analysis Tariff 0-6kl
(incl. VAT)
Tariff (6-20kl)
(incl. VAT)
Tariff (20-60kl)
(Incl. VAT)
Tariff >60kl
(Incl. VAT)
Mathematical
average (Mean)
R2.49 R5.81 R7.22 R8.78
Population-weighted
average (Mean)
R2.23 R7.26 R11.10 R13.40
Volume-weighted
average (mean)
R2.21 R7.33 R10.13 R13.71
5.3.3.2.3.2 Commercial Water Tariffs
Larger municipalities have separate tariffs for commercial and industrial users (cf. Figure
5.13). Both Figure 5.13 and Table 5.8 summarize the average tariffs for commercial use of
2010.

87
Figure 5.13: The average provincial tariffs for commercial and industrial users.
Table 5.8: Average commercial tariffs for 2010
Urban or Rural
Dominance
Tariff 0-6kl
(incl. VAT)
Tariff (6-20kl)
(incl. VAT)
Tariff (20-60kl)
(Incl. VAT)
Tariff >60kl
(Incl. VAT)
Rural
Urban
R6.08
R6.87
R6.59
R7.54
R7.56
8.20
R8.49
R8.91
Mean R6.52 R7.11 R7.92 R8.72
The following can be concluded:
• The increases from 2010 were as follows:
� 17% in the 0 to 6 kl block
� 14% in the 6 to 20 kl block
� 17% in the 20 to 60 kl block
� 19% in the >60 kl tariff block
• The percentage increases were substantially higher, possibly correcting some of the
below-inflation increases. This may also be due to increased financial pressures in
municipalities and the use of higher commercial tariffs to subsidize residential tariffs
in the lower affordability areas.
• The higher increase in the upper blocks indicated the introduction of stronger demand
management measures for this user group.
R 0.00
R 2.00
R 4.00
R 6.00
R 8.00
R 10.00
R 12.00
EC FS GT KZN LP MP NC NW WC National Avg
Tariff 0-6kl Tariff 6-20kl Tariff 20-60kl Tariff >60kl

88
• The commercial and industrial tariffs were higher than the domestic tariffs in the
lower blocks and in line on the higher use blocks thus indicating cross-subsidization
to the domestic water use sector. This was to be expected as many of the new
domestic water services were for the low income and indigent customers.
• Free basic water was generally not applied to commercial use thus making the first
block much higher for the commercial users.
• Gauteng, KwaZulu-Natal and Western Cape had the highest tariffs, while Limpopo,
Mpumalanga, North Cape and North West were on the lower end.
• Eastern Cape had the highest annual increases of 37% in the lower blocks up to 57%
in the higher blocks, reflecting on the drought in the region and the demand
management intervention.
• Limpopo, Free State and Gauteng were second highest with increases of 17% to 34%
from lower to higher blocks. The other provinces had increases within the CPI.
5.3.3.2.3.3 Industrial Water Tariffs
In total, 110 of the 237 municipalities (46%) have indicated that they have industrial water
tariffs (Table 5.8).
The following can be concluded:
• The highest tariffs were in Gauteng, followed by WC, KZN and NC. Lowest tariffs
were in EC, FS and LP.
• Increases in industrial bulk potable tariffs were similar to the increases in residential
tariffs and slightly less than commercial increases. The increases from 2008/2009 to
2009/2010 were:
� 14% in the 0 to 6 kl block
� 13% in the 6 to 20 kl block
� 13% in the 20 to 60 kl block
� 15% in the >60 kl tariff block
• Less than 50% of municipalities offered a bulk potable water tariff (108 of 237 LMs).
The number had, however, increased significantly from the previous year (77 to 108
LMs) which indicated the rising need to cater for bulk industrial uses separately.
• It was also noted that the differences in blocks was not as significant as with
residential tariffs and that no FBW was offered to these users.

89
• Most Local Municipalities (LM) in the Free State had a fixed tariff across all blocks
with only 3 of 15 LMs applied differentiation.
• Bulk untreated water was provided by LMs at tariffs of about R4.19 per kl, varying
little across the different blocks.
5.3.3.2.3.4 Comparison of Municipal Water Tariffs
Figure 5.14 compares the various tariff structures on an equal basis (i.e. all are consolidated
to equal block sizes of 0-6kl, 6-20kl, 20-60kl and >60kl). The comparison indicates that:
• Residential domestic water tariffs had a steeper block structure. This was primarily to
offer affordable basic services (often under cost) and to cross-subsidize from higher-
end users to lower-end users.
• The big discrepancy in the first block was mainly due to the effect of free basic water
on the average residential domestic tariffs, while commercial and industrial users did
not apply free basic water. Industrial potable water tariffs were the highest and also
showed the least differentiation between blocks. The flat structure implied less
demand management and reflected the importance of water for economic growth and
development.
• The detailed tariff lists furthermore showed that residential tariff structures had more
blocks than any other tariff (up to 12). Commercial was second, while most industrial
tariffs had less than three blocks.
• Indications were that commercial and bulk potable industrial users were cross-
subsidizing the residential users in the lower blocks.
5.3.3.3 National Water Tariff
This national tariff or water sector specific tariff should be introduced in South Africa for
funding the following:
• New capital water infrastructure for water security and for increase water demand and
supply, i.e. specific funding for capital expenditure only.
• Operations and maintenance of water infrastructure to the extension of its remaining
useful life (RUL), i.e. a separate funding mechanism for operations and maintenance
(cf. Figure 5.15)

90
Figure 5.14: The average municipal water supply tariffs for domestic users are shown per
province.
The above should be obtained and done at premium cost to ensure affordability and for cross-
subsidization in the water sector, especially at local government level (municipalities) and
amongst major water users in the country. Furthermore, it would ensure affordability,
ensuring an income stream and minimize marginal cost. These mechanisms should be
introduced since return of asset (ROA) investment is not enough and the DWA has not been
able to create a reserve in the water trading entity (WTE) for capital expenditure on new
water infrastructure and for operations and maintenance of existing water infrastructure.
5.3 Remaining Useful LifeRUL profile with capital renewal values
Figure 5.15: Remaining useful life (RUL) of water infrastructure in South Africa.
R 0.00
R 2.00
R 4.00
R 6.00
R 8.00
R 10.00
R 12.00
Do
me
stic
wa
te ta
riff
s in
20
08
/20
09
6 - 20 kl (incl. VAT)
20 - 60 kl (incl. VAT)
> 60 kl (incl. VAT)

91
5.3.3.3 Water Trading Entity
5.3.3.3.1 Water infrastructure management
The Water Trading Entity (WTE) has two components, i.e. water resource management and
infrastructure management. The focus here is only on the water resources infrastructure
component which deals with the operation and maintenance of existing infrastructure as well
as development of new infrastructure.
Currently, the national water infrastructure is valued at R147 billion. The Water Trading
Entity recognises that the benefits of investing in infrastructure are derived from the dual
purpose of infrastructure being a final good providing services directly to consumers (e.g.
water) as well as an intermediate input that raises the productivity of other sectors (e.g.
energy, mining, industry, commercial, etc.). In order to realise these benefits, it is imperative
that the infrastructure provider is operationally efficient, that services are appropriately priced
and that they are accessible to users.
The Water Trading Entity has unfortunately also not escaped from the general deterioration
of its infrastructure during the past three decades. In part this was due to a shift in policy in
favour of social development imperatives resulting in inadequate investment in maintenance
of infrastructure. Operation efficiency, competitive pricing and accessibility continue to
hamper water infrastructure delivery.
For the maintenance and supply availability of bulk water infrastructure, the following were
identified:
• New augmentation schemes implemented – It comprises the development of new bulk
water infrastructure using internal resources mostly for meeting needs of social users.
When needs of commercial users are to be met and the full cost of the supply of water
can be recovered, off-budget funding is employed. In such cases an implementing
agent, to date mainly the TCTA, has been appointed;
• Utilising internal capacity and skill to implement new regional bulk water
infrastructure systems and water services on behalf of the Department;
• Operating and maintaining existing water resource infrastructure valued at a
replacement value of R147 billion to supply 7 billion m3 of bulk raw water annually
to users, either with in-house resources or on an agency basis. It includes the supply
of bulk raw water and the collection of Revenue;
92
• Existing water resource infrastructure rehabilitated and refurbished; and
• Promotion of recreational use of water surfaces and surrounds by the development
and implementation of Resource Management Plans (RMP).
A key focus over the medium term is to eradicate the backlog on maintaining rehabilitating
existing national water resources infrastructure. Refurbishment and rehabilitation projects are
undertaken to ensure the integrity of key large water infrastructure for the delivering of water
to users. In accordance with the budget reprioritising imperatives, most of this expenditure is
being allocated to schemes where the construction has already commenced.
5.3.3.3.2 Revenue management and benchmarking
Total revenue for the year 2009/10 and 2010/11 remained the same at R2.1 billion (cf. Table
5.9). This is due to construction revenue that showed a 74% decrease, due to reduction of
project executed on behalf of third parties by construction unit. Total revenue increased from
R2.6 billion in 2010/11 to R3.9 billion in 2013/14, at an average annual rate of 9.2%.
However, the revenue is comparatively far lower, on pro rata, for the asset value of that for
other state own entities (SOE) (cf. Table 5.9). The water resource management contribute an
estimated revenue of R230 million and water resource infrastructure R3.2 billion for 2011/12
financial year. The increase over the medium term is due to increases in water resource
management and water resource infrastructure charges, which are projected to increase from
R2.6 billion in 2010/11 to R3.4 billion in 2013/14.
The entity is currently not generating enough revenue due to the price caps set by the water
pricing strategy, and has incurred a deficit of R1.2 billion in 2009/10 as a result of this. The
entity is therefore not able to generate enough revenue to fund the refurbishment,
improvement of infrastructure assets and new development of infrastructure assets. Non-
payment of accounts also impacts negatively on the entity’s financial position. The total real
expenditure (excluding reversal of depreciation on revalued assets and bad debts) decreased
from R3.8 billion in 2009/10 to R3.6 billion in 2010/11, at an average annual rate of 5.4%.
The annual increases are due to inflation related adjustments. After the inclusions of reversal
of depreciation on revalued assets and bad debts, 2009/10 expenditure decreased from R3.2
billion to R2.9 billion as a result the annual average increases increased from 13% to 21%.
The Water Trading Entity is currently billing for Trans-Caledon Tunnel Authority (TCTA)
estimated revenue of R2.8 billion for 2011/12 financial year. This amount should be paid to

93
TCTA whether the Water Trading Entity has collected from its customers or not. The
payment to TCTA is meant for repayment of loans.
Table 5.9: Benchmarking of the WTE with other infrastructure public entities in South
Africa.
Comparison of
State Owned
Entity 2007 2010
TRANSNET TELKOM ESKOM
RAND
WATER SANRAL WTE
R'000
Asset value 77 254 59 146 128 579 6 257 337 9 826 333 66 260 107
Revenue 28 214 52 157 40 068 4 118 601 2 539 000 1 266 583
5.3.3.4 Water Boards
Over the MTEF period (2011 to 2014), water boards will reduce total interest bearing debt to
minimise the cost of finance and interest. The financial plan will ensure that Water Boards
contributes to an affordable tariff, maintains optimal debt levels, improve return on assets by
investing appropriately in order to enhance its shareholder value.
Revenue collected by water boards comes mainly from the sales of bulk water to water
services authorities in their areas. Revenue from the consolidated sale of bulk water
increased from R7.2 billion in 2007/08 to R873 billion in 2009/10, at an average annual rate
of 910%. Revenue is expected to reach R12.4 billion in 2012/13, at an average annual rate of
10.8%. This increase over the MTEF period is mainly due to the new approved tariffs in
terms of the water pricing strategy. Expenditure is expected to increase over the medium
term at an average annual rate of 12%, from R8.2 billion in 2010/11 to R11.5 billion in
2013/14 due to the combined effect of adjustments for inflation and the construction,
upgrading and rehabilitation of water infrastructure. The water boards made a consolidated
net surplus profit of R903 million which represents a decline of 29% from the previous year
profit/surplus.

94
These cost increases comes against the background of a negligible growth in volumes sold
and only a 4.4% increase in sales value. This suggests that overall water boards are
transferring the benefits of their cash reserves to water users. However this practice needs to
be reviewed against the background of anticipated Capital Expenditure (CAPEX) spending in
the coming years. However, costs are being contained by redeeming a portion of the long-
term loans, thus effectively reducing interest cost. It is anticipated that over the medium term
these cost will be contained within budget. The refurbishment of infrastructure will result in
efficient utilisation of resources which will also have a positive impact on cost containment.
5.3.4 Funding through the raising of funds on the financial markets (off-budget) -
Special Purpose Vehicle
Currently the DWA uses two special purpose vehicles for raising funds from the financial
markets, off-budget, for the financing of water infrastructure, i.e. the Trans-Caledon Tunnel
Authority (TCTA) and Komati Basin Water Authority (KOBWA).
5.3.4.1 Trans- Caledon Tunnel Authority (TCTA)
The TCTA is a multidisciplinary organisation specialising in project financing,
implementation and a specialised liability management entity. Its mandate is to raise off-
budget finance for the development of bulk raw water infrastructure which delivers water for
industries and consumers in a cost-effective manner (cf. Figure 5.16). It also provides
financial and treasury management services together with tariff setting and debt management
services.
The mandates granted to TCTA include managing, financing and implementing of bankable
mega-water resources infrastructure projects (cf. Figure 5.16). TCTA’s debt management
strategies start with asset-liability framework that seeks to repay debt within a specific
timeframe and that takes into account the base assumptions, viz. risk factors (controllable and
inherent including mitigation measures of known risks), micro- and macro-economic factors
(CPI, yield curve, liquidity, etc.) and project specific factors (credit risk, constructions risk,
operational risk, etc.) (cf. Figure 5.16). The over-riding principle is always to apply revenues
or water sales proceeds to fund ongoing operational requirements, reduce debt (current and
future) and thus minimise future finance costs. Each project maintains adequate cash for

95
immediate maturities (usually up to 3 months) to increase efficiency both in terms of the cost
of funding and the cost of cash management.
Finance cost forms the biggest part of TCTA overall cost. TCTA manages these costs by
focusing on maximising the tenure of the loans, interest rates cycle, investment philosophy
guided by TCTA investment policy, maximising draw-downs and maintaining appropriate
capital structure without increasing the costs.
The TCTA derives its revenue from the sale of bulk water and the provision of advisory
services to the water sector. The marginal increase masks some important developments in
the work of the authority. Over the MTEF period, revenue is expected to grow at an average
annual rate of 6%. Revenue will increase from R3.6 billion in 2009/10 to R3.7 billion in
2013/14 due to the income earned in water resources infrastructure which has become
operational from July 2009, as well as the impact from tariff increases.
22
Mandate from the Minister of Water Affairs
Due diligenceFinancing,
costing, timeline
Design optimisation
Type of funding
Construction
(incl. social component)
Obtain project risk rating, and competitive financing (local and international)
Procurement
Job creationPovertyAlleviationLED
Figure 5.16: Operations model of TCTA for the implementation of water infrastructure
projects.

96
Interest, dividends, rent and financing charges accounted for 80% of all expenditure incurred
by the authority in 2010/11. Expenditure increased from R2.7 billion in 2007/08 to
R3.7 billion in 2010/2011, at an average annual rate of 18%. Expenditure is expected to
increase to R3.4 billion to R4.8 billion over the medium term, at an average annual rate of
11.7%. This is due to an increase in operational expenditure over the medium term as the
number of projects the authority is mandated to implement increases from 3 to 7 with a total
water resources infrastructure capital cost of R20 billion.
5.3.4.2 Komati Basin Water Authority
The Komati Basin Water Authority was established in terms of a treaty between South Africa
and Swaziland. The aim of the authority is to manage the water resources of the Komati
River basin sustainably. The authority is responsible for financing, developing, operating and
maintaining the water resources infrastructure in the basin. (cf. Figure 5.16).
Total capital development costs for the water infrastructure (two dams) that this authority
manages, including capitalised interest on debt capital, are R3 billion. With the construction
of both dams complete, the authority’s focus is on operations, including finance and loan
administration, and maintenance of this vital bulk water supply infrastructure.
5.3.5 Funding through Private-Public-Partnerships
Although the government has taken the important and necessary steps, it should be
recognized that in the past, that some public-private initiatives have been used for the
implementation of water infrastructure development projects (cf. Figures 5.2, 5.10 and 5.17).
Recently an institutional framework has been developed to guide this type of development
and this both accounts for and contributes in part to the mixed experiences. The
implementation of this framework is essential in allowing the inclusion of the private sector
for the implementation of water infrastructure development projects. More importantly, this
would also help convince the public that private involvement or other forms of non-
traditional funding or delivery are appropriate (cf. Appendix 4). This is especially important
when the public is not aware of the real cost of the infrastructure – a perception that needs to
change. There have been attempts to involve the private sector in the creation of public
infrastructure but not with the commitment, the consistency, or the legislative protection that
would encourage and protect private sector investment and encourage long-term partnerships.

97
The consequences of government failing to work with private interests include increasing
foreign investment in our few privatization initiatives due to lack of local experience and/or
resources; potential capital flight and loss of local investment to offshore projects.
Promoter Finance Model
National Treasury(National Revenue fund)
National Treasury
(National Revenue fund)
Shareholders
Bank(s)
Grants
Equity/Cash flow
Debt
PromoterPrimary
ProjectRisk
Taker
Project
Bank(s)Project
RiskTaker
Project Finance Model
Grants
Debt
Equity/
Cash flow
Promoter
PrimaryProject
RiskTaker
Project
Figure 5.17: Promoter finance and finance models for Public-Private Partnerships for water
infrastructure development in South Africa.
5.3.6 Funding through private sector markets
The DWA position on water privatisation is nuanced. Whilst there is strong support for the
injection of private capital into new water infrastructure, customers are wary of full-scale
water privatisation, whilst recognising that a well structured privatisation model could be part
of the water infrastructure development and operations and maintenance solutions (cf. Figures
5.10 and 5.17). Understandably, customers fear that water charges would become ‘another
tax’ with no improvement in the quantity and quality of the water infrastructure. If water
infrastructure and water charges were to be introduced customers would want to see clear
incentives and commitments for extra capacity. They would then be in a position to try and
assess whether or not there would be a net gain in their own organizational cost-benefit ratio.
The off-setting of tax reductions on water users would also be required. This could be funded
by implementation of an Economic Recovery Plan, reducing current public spending and
thereby permitting offsetting reductions in direct and/or indirect taxation elsewhere.

98
5.3.6. 1 Private sector investment tools
The following were identified from the data as financial management tools for the funding
models for water infrastructure development projects:
• Private Sector investment in the form of Build Own Operate Transfer (BOOT)
scheme (cf. Fraser et al., 2000).
• Establishment of special banks or financial institutions to underwrite low interest
loans for the investment in water infrastructure (cf. Urban Logic, 2000).
• Issuing of medium and long-term tax-free bonds for specific or dedicated water
infrastructure funding can also be generated through the issuing of bonds, however, is
very dependent on market conditions and thus, research in present and future market
conditions should be undertaken before applying this option.
• Creation of water infrastructure as a service entity, bureau or consortium - shares in
this new organization can then be issued on the stock exchange or through private
subscriptions (cf. Urban Logic, 2000);
• Accessing of capital markets for specific and dedicated financial assistance such as
revolving loans and other similar debt structures (cf. Urban Logic, 2000);
• Application of incentives such as matching ratios to stimulate investment. Under this
type of arrangement the central government would match (according to the specified
ratio) the amount of funds invested into the water infrastructure by other groups. This
type of venture would encourage governments to seek out investment for their water
infrastructure so that they can access government funds (where appropriate) (cf.
Nebert, 2001).
5.3.6. 2 Pension funds and infrastructure investment
While major investments of over R110 billion are necessary to close the infrastructure deficit
gap, significant institutional funds appear to be available for the right type of projects if the
investment process is understood and standardized. South Africa’s largest public sector
pension funds, should announce a major shift in its investment policy away from equities and
towards infrastructure as an asset class necessary for its long-term pension requirements.
South Africa’s pension funds represent a vast and growing pool of finance that should be
looking for long term investment opportunities presented by infrastructure projects, i.e. water

99
infrastructure. These investments are long duration assets that are expected to produce stable
returns in excess of those obtained in the fixed income markets.
5.3.6. 3 Dedicated financial institution for infrastructure
There is an urgent need of a national infrastructure bank to help finance transformative
projects of national importance (sensu Tyson, 2011). Realizing the highest possible return on
infrastructure investments depends on funding the projects with the biggest impact and
financing them in the most advantageous way (sensu Tyson, 2011). Properly designed and
governed, a national infrastructure bank would overcome weaknesses in the current selection
of projects by removing funding decisions from politically volatile appropriations process
(sensu Tyson, 2011). A common complaint today is that projects are often funded on the
basis of politics rather than efficiency. Investments could instead be selected after
independent and transparent cost-benefit analysis by objective experts.
5.3.7 Demand (market) risk funding model for water infrastructure
The provision of finance is an essential ingredient into the overall strategy for national water
infrastructure. If it was not to be forthcoming there would be a number of risks and actions
which could not be taken. The finance available should be used to augment in the most
economic manner rehabilitation and refurbishment which have the highest economic benefit
first and then used for future investment. If the total capacity to obtain finance is not there,
there is a risk that the infrastructure will continue to deteriorate from its existing poor level
with consequences of failure to supply as well as quality issues which may well be akin to
those of ESKOM.
There is a risk that if tariffs are not tapered fairly rapidly to a reasonable economic level with
explicit subsidies and social pricing as inherent ingredients then the operations and
maintenance will continue to decline and stagnate with serious consequences not only to the
health but to the population and livelihoods whether they be agricultural, industrial or other.
The first challenge is therefore to explore the availability of finance from the traditional
sources namely the National Treasury (NT) and through off balance sheet funding through
the TCTA. The second challenge, which depends on the decision about the National Water
Resources Infrastructure Agency, is to see whether a further line of finance run directly by

100
the Department could be established. The third challenge is then to explore other off balance
sheet sources of finance both from other agencies such as The World Bank and private sector
finance with in some cases finance guaranteed by end users. The fourth challenge is to
obtain political support from all levels the sources of funding for tariff changes improvements
to the regulatory framework and the recognition that enhanced tariffs applied equitably are
essential.
These types of water infrastructure projects are where the private sector bears market
(demand) risk and revenues are typically derived directly from the users of the infrastructure
rather than government (cf. Figure 5.18). Examples of economic infrastructure projects
include water infrastructure projects in South Africa (cf. Figure 5.18). This approach to
sourcing revenue differs markedly from so-called social infrastructure projects (water
services supply to communities), where the government retains demand risk and provides
revenue directly through a performance based payment mechanism (National Revenue Fund).
The private sector is paid a service payment (or availability payment) by the government
subject to the private sector providing the contracted facilities and services in line with the
contract standards.
6
Stakeholder
Agreements:
•Off-take agreements•Construction agreements
•Implementation
agreement
Debt Management
(Revenue collection by
DWA)
Project
Management(transferred to
partners, e.g. contractors)
Figure 5.18: Risk model for the water infrastructure development projects in South Africa.

101
5.3.8 Innovative financing models
The data obtained exemplified that innovative financing must be embraced by the
government as the preferred alternative to deliver certain large public infrastructure projects
(Figures 5.19 and 5.20). Government must provide leadership on innovative financing as the
private sector cannot credibly promote these ideas due to their perceived vested interests
(Figures 5.19 and 5.20). Everywhere innovative financing has been successfully applied; it
was spearheaded by the government, with the private sector participating only after the “rules
of engagement” were clarified.
Three innovative financing models allow the public and private sectors to forge efficient
partnerships and enable a robust pipeline of economic infrastructure to be built around the
country without delay (Figures 5.19 and 5.20). Importantly, these models allow the public
sector to provide capital that can also earn a potential return and are recycled (Figures 5.19
and 5.20).
FINANCIAL (FUNDING) MANAGEMENT PLANNING PROCESSOVERVIEW
Datagathering
& review
Consultations &
Institutional
Arrangements
Simulation,Testing &
Implementation
Funding
Identification &
Assessment
Risk
PrioritisationScoping Plans
Analysis & Planning
Plan
developmentConsultation
Water Infrastructure
Funding (financial)
Management PlansPlan approvals,
distribution
Constant
Re-
Evaluation
&
updating
Figure 5.19: Water infrastructure funding flow process.
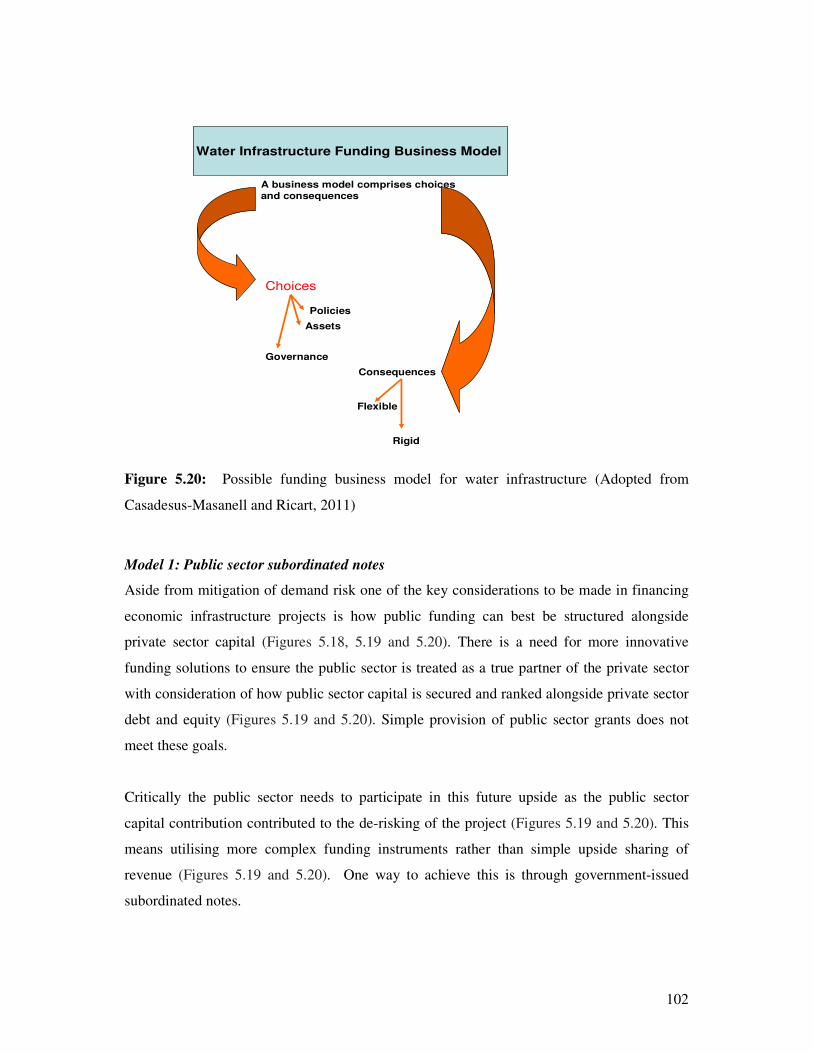
102
Water Infrastructure Funding Business Model
A business model comprises choices
and consequences
Choices
Governance
Assets
Policies
Consequences
Rigid
Flexible
Figure 5.20: Possible funding business model for water infrastructure (Adopted from
Casadesus-Masanell and Ricart, 2011)
Model 1: Public sector subordinated notes
Aside from mitigation of demand risk one of the key considerations to be made in financing
economic infrastructure projects is how public funding can best be structured alongside
private sector capital (Figures 5.18, 5.19 and 5.20). There is a need for more innovative
funding solutions to ensure the public sector is treated as a true partner of the private sector
with consideration of how public sector capital is secured and ranked alongside private sector
debt and equity (Figures 5.19 and 5.20). Simple provision of public sector grants does not
meet these goals.
Critically the public sector needs to participate in this future upside as the public sector
capital contribution contributed to the de-risking of the project (Figures 5.19 and 5.20). This
means utilising more complex funding instruments rather than simple upside sharing of
revenue (Figures 5.19 and 5.20). One way to achieve this is through government-issued
subordinated notes.

103
Model 2: Public Sector Development Entity (State Own Entities/Enterprises)
For those situations where it is almost impossible to secure any private sector funding for
infrastructure projects on reasonable terms, an alternative option would be for governments to
step in and take responsibility for the project during the development stage (Figures 5.19 and
5.20). The intention would then be to refinance the project with private sector capital after it
is built and revenue streams have been proven.
Projects could be financed with public sector debt and equity and be structured along
commercial lines aiming to replicate the private sector (Figures 5.19 and 5.20). Consequently,
water infrastructure projects would be provided with an arm’s length concession. Water use
charges would be set to provide a viable finance plan (cf. Table 5.5; Figures 5.9, 5.19 and
5.20). Subject to the construction works being satisfactorily completed and the actual water
use reaching a stable level, steps could then be taken to sell water infrastructure project.
Model 3: Public Sector –supported Super Fund Vehicle
The third model aims to tap into superannuation funds. Super funds are conservative
investors and have been burnt in the past by investments in green-field infrastructure assets,
where it must be taken on construction and patronage risk (Figures 5.18, 5.19 and 5.20). This
makes super funds more inclined to invest in brown-field assets – that is, developed assets
that have been built and achieve stable revenues (Figures 5.19 and 5.20). Due to their long-
term investment horizon and conservative risk profile super funds are the logical long term
investors in economic water infrastructure assets.
Under this model the public sector might co-invest equity alongside super funds and provide
revenue guarantees over the asset for a specific period of time (Figures 5.19 and 5.20). The
guarantee would fall away once certain revenue thresholds have been met, which could be
three to four years after the new infrastructure has been opened. Here, the public sector is
simply providing a bridge for private sector finance (Figures 5.19 and 5.20).
5.4 Alternative funding models
In attempting to unlock the challenges in terms of the funding of water infrastructure, a few
alternatives were proposed form the research results which could be considered in order to
make the water infrastructure development projects bankable and ensure implementation (cf.
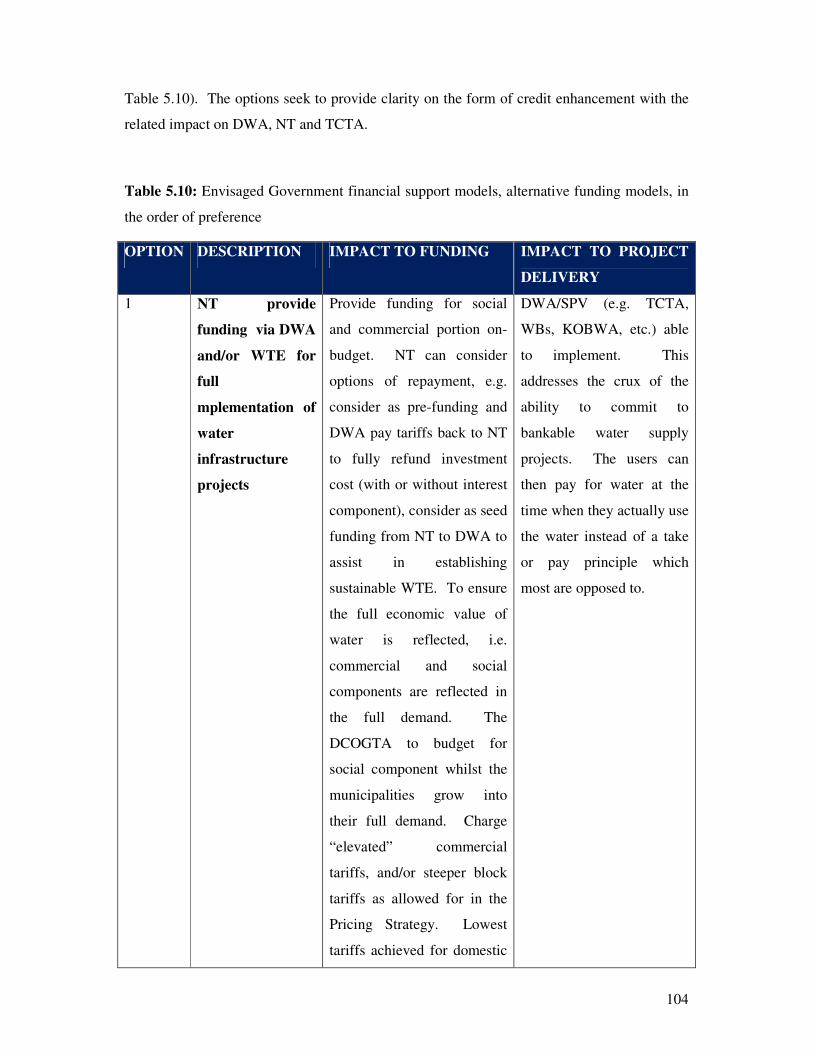
104
Table 5.10). The options seek to provide clarity on the form of credit enhancement with the
related impact on DWA, NT and TCTA.
Table 5.10: Envisaged Government financial support models, alternative funding models, in
the order of preference
OPTION DESCRIPTION IMPACT TO FUNDING IMPACT TO PROJECT
DELIVERY
1 NT provide
funding via DWA
and/or WTE for
full
mplementation of
water
infrastructure
projects
Provide funding for social
and commercial portion on-
budget. NT can consider
options of repayment, e.g.
consider as pre-funding and
DWA pay tariffs back to NT
to fully refund investment
cost (with or without interest
component), consider as seed
funding from NT to DWA to
assist in establishing
sustainable WTE. To ensure
the full economic value of
water is reflected, i.e.
commercial and social
components are reflected in
the full demand. The
DCOGTA to budget for
social component whilst the
municipalities grow into
their full demand. Charge
“elevated” commercial
tariffs, and/or steeper block
tariffs as allowed for in the
Pricing Strategy. Lowest
tariffs achieved for domestic
DWA/SPV (e.g. TCTA,
WBs, KOBWA, etc.) able
to implement. This
addresses the crux of the
ability to commit to
bankable water supply
projects. The users can
then pay for water at the
time when they actually use
the water instead of a take
or pay principle which
most are opposed to.

105
water users, where needed.
2 NT provide pre-
funding via DWA
and/or DCOGTA
and once the
Project is
bankable, SPV
(e.g. TCTA) could
refinance it off-
budget and repay
NT.
NT provide pre-funding of
the commercial portion. NT
being refunded if required in
future once the project is
bankable through committed
off-take water agreements.
NT enabling the project to be
implemented whilst being
fully refunded at a future
point in time. Full costs will
be recovered over time from
the commercial users to
Government and is therefore
not seed funding but
covering funding for a
bridging period.
Commitment to social
funding by fiscus through
MTEF (DWA and/or
COGTA).
DWA/SPV able to
implement. SPV (e.g.
TCTA) able to raise off-
budget funding in future
with committed revenue
stream at that stage. This
addresses the crux of the
water users’ ability to
commit to bankable water
supply projects. The users
can then pay for water at
the time when they actually
use the water instead of a
take or pay principle which
they are opposed to
Cost effective funding
3 NT provide
explicit
Government
guarantee for the
full project cost
A committed guarantee for
the full project (social &
commercial). NT makes
good the revenue stream
shortfall in the bridging
period to repay the loans.
This is different in that the
exposure of NT is only
limited to the portion of the
project income not recovered
shortfall. NT can be assisted
in the event of unavailable
Enabling the SPV to raise
funding on an off-budget
basis. This will address the
crux of the water users’
ability to commit to
bankable off take water
infrastructure projects and
agreements. The users can
then pay for water at the
time when they actually use
the water instead of a take
or pay principle. No
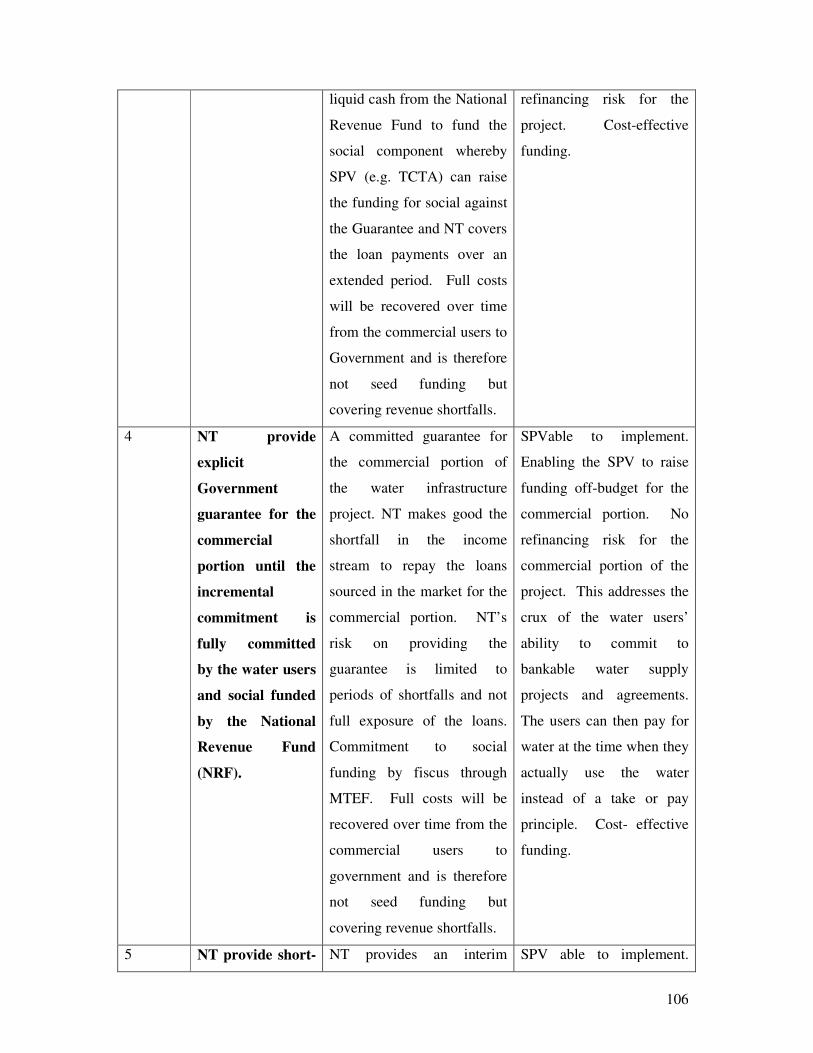
106
liquid cash from the National
Revenue Fund to fund the
social component whereby
SPV (e.g. TCTA) can raise
the funding for social against
the Guarantee and NT covers
the loan payments over an
extended period. Full costs
will be recovered over time
from the commercial users to
Government and is therefore
not seed funding but
covering revenue shortfalls.
refinancing risk for the
project. Cost-effective
funding.
4 NT provide
explicit
Government
guarantee for the
commercial
portion until the
incremental
commitment is
fully committed
by the water users
and social funded
by the National
Revenue Fund
(NRF).
A committed guarantee for
the commercial portion of
the water infrastructure
project. NT makes good the
shortfall in the income
stream to repay the loans
sourced in the market for the
commercial portion. NT’s
risk on providing the
guarantee is limited to
periods of shortfalls and not
full exposure of the loans.
Commitment to social
funding by fiscus through
MTEF. Full costs will be
recovered over time from the
commercial users to
government and is therefore
not seed funding but
covering revenue shortfalls.
SPVable to implement.
Enabling the SPV to raise
funding off-budget for the
commercial portion. No
refinancing risk for the
commercial portion of the
project. This addresses the
crux of the water users’
ability to commit to
bankable water supply
projects and agreements.
The users can then pay for
water at the time when they
actually use the water
instead of a take or pay
principle. Cost- effective
funding.
5 NT provide short- NT provides an interim SPV able to implement.

107
term interest
cover guarantee
for commercial
portion until
projects reaches
bankability and
social funded by
the fiscus. TCTA
to refinance once
bankable
guarantee to pay the interest
shortfall until the project
reaches bankability without
Government support. NT’s
risk on providing the
guarantee is limited to
periods of shortfalls in
interest payment and not full
exposure of the loans.
Commitment to social
funding by the NRF through
MTEF.
Enabling SPV to raise
funding off-budget for the
commercial portion with
extended repayment terms
of 20-years after
bankability instead of 20-
years after implementation.
This addresses the crux of
the water users’ ability to
commit to bankable water
supply projects and
agreements The users can
then pay for water at the
time when they actually use
the water instead of a take
or pay principle.
6. 10-year explicit
Government
guarantee and
underwriting the
risk of refinancing
in year 10
10 year committed explicit
guarantee. Underwriting
commitment for the balance
of the project life. Reduced
commitment by government
for refinancing in year-10
which will be without an
explicit government
guarantee and based on the
committed revenue stream at
that stage. NT makes good
the income stream from the
water users if insufficient
funds are received in the 10
year period for SPV to meet
the financial obligations to
the funders. Full costs will
be recovered over time from
SPV able to implement.
Enabling SPV to raise
funding off-budget for the
commercial portion.
Refinancing risk for project
underwritten by NT as
financiers will not accept
non-guaranteed refinancing
risk. SPV should be able to
refinance in year 10 as
construction risk is
eliminated and revenue
streams would have been
established. This addresses
the crux of the water users’
ability to commit to
bankable water supply
projects and agreements.

108
the commercial users to
government and is therefore
not seed funding but
covering revenue shortfalls.
Commitment to social
funding by NRF through
MTEF.
The users can then pay for
water at the time when they
actually use the water
instead of a take or pay
principle.
7 Preference shares
issued by
Development
Finance
Institution(s), i.e.
IDC, DBSA,
AfDB, WB, etc. to
take care of cash
flow mismatches.
Provide some level of
comfort and support to the
issuer in terms of PFMA due
to the strategic nature of the
water infrastructure project
from the development
impact. No requirement to
make good any shortfall
because the dividends and
capital repayments will be
matched to available cash
flows at any given point
otherwise they will be
accrued. Provide funds for
the social component of the
project. Financial
institutions have expressed
interest in this project as
such it will spare SA Govt
financial resources.
However, funders have
indicated that they will be
required unequivocal support
of SA Government.
Preferably this could be a
debt instrument or quasi debt
instrument offered by the
SPV able to implement.
Increased ability to raise
funding off-budget. No
stringent requirement for
take or pay principle. No
refinancing risk for the
commercial portion of the
project.
SA Government financial
resources will be spared for
other competing high
priority projects. SPV able
to implement the full
project on off-budget. No
stringent requirement for
take or pay principle
upfront. This will be one
of the tests of the potential
benefits.

109
Development Finance
Institutions with clear
redemption strategies
Since this could be tied
funding wherein private
companies would require to
implement the project, this
could happen in a joint
venture arrangement in
accordance with South
African terms and
conditions.
The funding models in respect of the government guarantee suggest a paradigm shift in the
manner in which a traditional guarantee model is structured in that the NT’s financial
exposure will be limited to the shortfall in the income stream from the users as a result of
timing mismatches. Furthermore, this research project has fully exhausted exploring all the
commercial structuring models for water infrastructure projects and has come to conclude
that a level of government support is required.
5.5 Comparative analysis: Solving the water infrastructure problem
From the desk top comparative analysis, South Africa is not alone in this dilemma, other
emerging and developing countries (economies) face a similar significant infrastructure
funding deficit. Some of these countries have addressed this problem earlier and have found
acceptable methods of integrating private funds and initiatives to help pay for some of their
public infrastructure requirements. This has sometimes been a trial and error endeavour as not
all were successful. South Africa can learn from this experience and from countries that have
a track record of involving the private sector in some manner in the delivery or financing of
their public infrastructure requirements. These include:
• In Australia, the first design/build/finance/operate (DBFO) occurred in the early
1990s. In some cases these failed and the public sector had to re-assume responsibility
for the schemes. Victoria, New South Wales and Queensland have now developed
partnering policies and ambitious plans for future investment. A Nation PPP Forum
was set up in 2004 to facilitate greater consistency and cooperation across

110
jurisdictions in the provision of infrastructure through public private partnerships
(PPPs). Information at the National PPP Forum indicates that across the country,
there are currently 29 projects being contracted, 17 projects in the market, and another
potential 17 projects in the pipeline, of which 5 projects are expected to be released to
the market within the next 12 months.
• Brazil enacted a Public-Private Partnership (PPP) law to attract private investment for
important infrastructure projects. The Bill establishes general rules and requirements
for public-private partnership bidding processes and contracts within the jurisdiction
of the government and public sector entities. It also creates an executive managing
group with the objectives of setting procedures for PPP acts or contracts; definition of
activities, investments or services; and authorization for starting public tenders. The
government is eager to attract investment in utilities using this PPP model, especially
in highways and energy projects.
• In Mexico, public/private partnerships are being used as a solution to a $20 billion
project schedule. Individual states are encouraged to come up with pilot projects as
well.
5.6 Conclusion
Concluding from the results above, a solution to the funding of water infrastructure problem
could be a combination of the models listed above. Some of the funding models are already
in existence but they are fragmented and in need of serious review and reconfiguration. If
there is the intention to proceed on the tenet that water infrastructure is an essential part of the
nation’s capital infrastructure providing a basis for economic, social and environmental
development, then there should be in place funding models for water infrastructure just as
how funding models exist for other capital infrastructure development, e.g. electricity,
energy, transportation (roads), and telecommunications. Combining the models would
depend on government structure, financial markets and the political climate, to name but a
few. If the water infrastructure is classified as an essential part of a nation’s capital
infrastructure producing goods for public benefits, then the above models should be
favourable alternatives for obtaining capital financing. These models can be consolidated to
create a water infrastructure funding model pool (Figures 5.2, 5.8 and 5.19). From this pool
suitable model(s) can be selected for water infrastructure financing based on the
implementation environment (Figures 5.2, 5.8 and 5.19).

111
Based on the funding business models, the new era of advanced and smart management
identified the following financing and funding imperatives (cf. Figure 5.2):
• Own funding
• Loan funding
• Co-funding
• Grant funding (MIG; RBIG; Conditional Grants; Equitable Share; Maintenance
Grant)
• Water User funding
It is also significant to note that the tariffs charged for raw water are skewed and mainly
based on historic cost. There appears to be no coordinated view of water resource tariffs and
the wider water sector costs and although consumers pay stepped tariffs the raw and bulk
water pricing does not recognize the full replacement cost at present or indeed the stepped
tariffs that consumers pay. The significance is important because tariffs are capped at the
present time and it may well be a situation where a change in the framework of tariffs is
needed and under the proposed revision of the pricing strategy this may be enabled.
Furthermore if an independent regulator was to be appointed this process would be
facilitated. It is also significant that new technologies in water scarce areas for waste water
treatment, desalination, acid mining and inter basin transfers will have an impact both on the
supply of water and on the tariff process. For these reasons the finance thematic area is
important as an enabling strategy, and the acceleration of the augmentation process alongside
water conservation and demand management.
Within this framework there are certain claims on water which are not subject to pricing,
basic human needs and others, but the key components are considered under water use
sectors. The water use sectors to which unit sectoral water resource management charges
must be calculated are:
• Municipal (water services authorities)
• Industry, mining and energy
• Agriculture (Irrigation of agricultural crops)
• Stream flow reduction (commercial forestry at this stage other sectors may be added)

112
Anticipated internal and external factors (liabilities and risks) that could otherwise negatively
impact on water supply and service delivery through the provision of water infrastructure
includes:
• The impact on the consumers or major water users in South Africa;
• Repayment schedules
• Comparative funding models in other emerging or developmental economies, i.e.
failures and successes, benchmarking, comparative analysis and best management
practices, from other countries.
• Identify local infrastructure funding options;
• Facilitate consensus building among the various stakeholders regarding those funding
options;
• Make the information available to the Legislature for ongoing and future
deliberations; and
• Assist in developing legislation to implement the agreed upon funding policies, if
appropriate.
• To address the major challenges facing the construction industry
• To offer solutions to governments and other stakeholders with one collective voice
(management and labour)
• To build on research already done on addressing the Infrastructure Funding Deficit
• Infrastructure & Innovative Financing
• Growth Planning / Land Use Planning
• Regulatory Reform
Thus, from the results it can be further concluded that the South African government
recognizes that it simply does not have the resources required to finance and build large water
infrastructure as quickly and readily as everyone would like. As such, alternative delivery
models are required. After considering various financing and procurement options, the
government determined that Alternative Financing and Procurement (AFP) will allow South
Africa to finance and implement many large infrastructure projects better and sooner, without
tying up public funds that can be used for other purposes. This means the construction work
could be financed and carried out by the private sector, which will assume the financial risks
of ensuring that the project is finished on-time and on-budget. The completed facility would
be publicly owned, publicly controlled and publicly accountable. AFP models can be
selected for given projects on the basis of an assessment against the principles articulated in

113
the NWRS framework for planning, financing and procuring public infrastructure. The
government has also made it clear that it is committed to keeping core public services such as
water and sewage treatment facilities will remain under public ownership and control.

114
CHAPTER 6: DISCUSSION
6.1 Models of water infrastructure provision
Emerging infrastructure backlog and deficient capability warrants immediate attention if
South Africa is to build upon, and secure, its already impressive record of sustained economic
growth and productivity gains. The first task is to overcome the highly visible and well-
documented backlog in existing infrastructure. The second task is to establish new, forward-
looking and resilient institutional frameworks to facilitate timely infrastructure investment by
integrating the full range of strategic planning, management and technical expertise in South
Africa’s public and private sectors.
The economic benefits associated with investment in infrastructure capital are extensive.
There are also very significant economic costs if infrastructure assets are allowed to
deteriorate. Statistics South Africa argues that, for the South African business sector in
general, a R1.00 investment in public sector capital stock generates an annual saving of 17
cents in produce cost savings (six-year payback).
The classic South African, and other comparable countries e.g. Australian, Brazil, Mexico,
etc., public provision model of government planned, installed and financed infrastructure
with pricing at marginal cost or on a loss–making basis – with returns recovered through the
taxation system (National Revenue Fund) – continues to characterise much of South Africa’s
publicly provided infrastructure. In terms of general infrastructure provision, significant
changes began in the 1990s with corporatization and agentisation of water infrastructure.
Nowadays, infrastructure is split between fully public (most water, most ports), fully private
(airports, some energy, gas pipelines, some ports, telecommunications, some water) and
mixed ownership (e.g. road PPPs, energy, electricity). The trend towards private provision of
infrastructure has been reinforced by the emergence of significant capital availability in South
Africa for infrastructure investment resulting from financial deregulation and South Africa’s
superannuation policies in the post-1994 era. Private direct investment in new infrastructure
has significant potential while governments continue to avoid or delay investment in new
capacity. Water offers similar potential, especially if network access and pricing outcomes
are resolved. Supply of significant new infrastructure via PPP frameworks seems most
likely. Further innovation in infrastructure investment, including closing the circle between
public and private-sector capital, is required. Complex issues of pricing, access, public
policy and regulation, risk–sharing, tendering processes, taxation and governance have arisen

115
as key challenges that will influence whether private provision of infrastructure can grow as a
viable new model in South Africa. Sustainability has introduced a further new dimension
into the calculus of infrastructure provision. A framework that takes account of
environmental and social aspects, as well as economic aspects, is now widely accepted as
necessary. Long and costly bureaucratic processes are a frequent complaint of private-sector
participants involved with infrastructure provision and financing. Public administration in
South Africa working alone seems no longer up to the job. South Africa now has an
impressive and world-class range of managerial, financial and engineering skills in the
private sector. These should be deployed more fully, together with public-sector expertise,
into the national task of infrastructure provision.
It is recognized that there is an infrastructure deficit, which must be resolved to enhance our
quality of life and improve economic competitiveness. Over the last few years, South Africa
has made impressive moves in the right direction with its new investment strategies and
initiatives to encourage investment in public infrastructure, in particular water. It had
released a five year water infrastructure investment plan which set priority and targeted more
than R30 billion for water infrastructure investments by 2014. Innovative participation of the
private sector to help fund the infrastructure deficit is appropriate, but not in all situations.
There are significant funds available to finance public infrastructure through the creative use
of public sector pension funds. If these funds are not put to use in South Africa, they will
continue to be invested to help finance other needs and initiatives than public water
infrastructure. Innovative financing opportunities will, however, require a commitment by
the government. Consistency and standardization in developing projects should be promoted.
A regular and consistent flow of AFP projects should be appropriately communicated to
potential investors. Workforce availability could be an issue with respect to getting all the
work done given the demographic projections and a reduction in availability of skilled trades.
The public must recognize that public infrastructure is not “free” and that in certain instances
user fees are appropriate.
6.2 Characteristics and criteria of a funding business model
Casadesus-Masanell and Ricart (2011) have identified three characteristics of a good
(funding) business model which can tell whether it will be effective depends on three criteria
(cf. Figure 5.17 and 5.18):

116
1. Is it aligned with organizational, company or institutional goals? The choices made
while designing a funding business model should deliver consequences that enable an
organization to achieve its goals.
2. Is it self-reinforcing? The choices that executives make while creating a funding
business model should complement one another; there must be internal consistency.
When there’s a lack of reinforcement, it’s possible to refine the funding business
model by abandoning some choices and making new ones.
3. Is it robust? A good model should be able to sustain its effectiveness over time.
Although the period of effectiveness may be shorter nowadays, robustness is still a
critical parameter.
6.2.1 Funding of the First Generation of Water Infrastructure
The majority of today’s existing water infrastructure evolved from central government. Thus,
a significant proportion of their funding is derived from the budgets of national government
(National Revenue Fund). Therefore, the first generation of water infrastructure had similar
funding structures. That is, they were mostly a combination of Government Funding (derived
from taxation and external funds), special project funds and to a lesser extent Private/Public
Sector Funding (derived from fees charged to customers) (sensu Rhind, 2000). Funding of
the early water infrastructure was done in a piece meal manner as they evolved with not much
consideration for future funding. However, if next generations of water infrastructure are to
be successful then there must be in place properly structured funding mechanism for their
implementation and maintenance. The next generation of water infrastructure will also be
affected by the universal changes adopted by governments through today’s society. That is,
governments are implementing measures to reduce their financial responsibility towards
infrastructure development.
With this in mind and the changing nature (maturity) of the next generation of water
infrastructure, it can be concluded that water infrastructure programme managers will have to
develop alternative funding models and or persuasive arguments for the maintenance of
government financing for water infrastructure implementation.
6.2.2 Funding Models for National Level Water Infrastructure
Water infrastructure at the National level is very important to a nation’s development and
requires a strong political will and contributions from all sectors of the society for its

117
successful implementation (cf. Figures 5.2, 5.19 and 5.20). Another key success factor to
water infrastructure implementation at this level is well-designed funding models (cf. Figures
5.1, 5.2, 5.19 and 5.20). There are a number of methodologies that can be used to design
funding models for water infrastructure implementation at the national level. These
methodologies will differ based on the different issues associated with the implementation
environment (Giff & Coleman, 2002). The view that water infrastructure is a provider of
public good with positive externalities and thus, selected this issue as the key designing factor
(Giff, 2001; Giff & Coleman 2001; Martinez & Frank, 2001). This selection is justified, since
at the national level the main function of water infrastructure is to satisfy national needs
(Rhind, 2001). There are two main economic theories (problems) associated with public
goods that are significant to the designing of the funding models. They are:
• The production of public goods normally results in market failures and
• The creation of natural monopolies (Economides, 1993, 1996; Yevdokimov, 2000;
Giff & Coleman, 2001; Martinez & Frank, 2001).
The above problems are significant in the design of the models since they require government
intervention to successfully correct those (Economides, 1993). Therefore, government
policies will play a key role in the designing of the models. With water infrastructure viewed
as a Classic Infrastructure/ Natural Monopoly producing public goods it’s the duty of the
government to intervene and correct the economic problems associated with this type of
infrastructure. There are four main remedies available to the government to reduce or
eliminate the negative effects of market failure and natural monopolies on the society. They
are:
• Economic Regulation;
• Monetary incentives or deterrents;
• Seeking compensation in the courts; and
• Government provision of the goods and services (Fraser et al., 2000)
Government’s role in water infrastructure development at the national level is further
emphasizing by private sector demands on them to improve access, viz. services and
information or data. This implies that government has a very significant role to play in the
economic development of water infrastructure and thus, their function must be considered in
the design of the models. In designing the models the remedies of economic regulation and
the provision of the goods and services by government play a significant role. However,

118
consideration should be given to the fact that governments are cutting back on infrastructure
expenditure although there should be increased in public infrastructure funding. The models
must be designed on the premise that if water infrastructure is considered to be classic
infrastructure/a natural monopoly then it should be possible to treat the financing of water
infrastructure to that of any other infrastructure which is of national importance in terms of
economic and social benefits. Thus, it should be possible to develop water infrastructure
funding model using analogies and lessons learnt from the financing of other infrastructures,
i.e. highway networks, railroads, and telecommunication networks to name a few.
6.2.3 Funding Models for Local Level water infrastructure
A funding at this level is only a component of the national water infrastructure (Figures 5.2,
5.19 and 5.20). Therefore, the funding structure should be less complex since the amount of
funds required for implementation is less. Local level water infrastructure should involve
more private sector participation since, as mention before the lower one goes on the water
infrastructure ladder the expected business activities to be generated should be greater
(Figures 5.8 – 5.10). Funding Models that may be applicable to this level of water
infrastructure implementation (cf. Figures 5.2, 5.19 and 5.20) can be:
1. Private Sector investment both monetary and non-monetary
2. Local Government capital funding
3. Local Government –Private sector partnerships (e.g. water utilities)
4. Local Government – Public sector/community organizations partnership
5. Accessing special projects funding or aligning with central government
financed special initiatives
6. The issuing of tax incentives for water infrastructure investments which would
form components of the local water infrastructure
7. Central -Provincial-local Government partnerships
8. Project Financing
A number of the components of a local level water infrastructure can be derived from
projects carried on by the private sector and or special government projects. Additional
funding for these projects can also be obtained through the above models with more emphasis
been placed on private sector contribution.
119
6.2.4 Funding Models for Regional Level Water Infrastructure
The financing of a regional water infrastructure are mainly the responsibility of the central
government (DWA and National Treasury) within the specific region (SADC, AU) (Figure
5.2). Therefore, funding models for water infrastructure implementation at this level may
take on the following formats:
1. Membership fees paid to the regional organization by the central governments of
member nations (participating members e.g. Lesotho, Swaziland), e.g. LHDA and
TCTA payments by central governments for the LHWP, KOBWA with payments by
central governments for the Driekoppies and Maguga dams. The level of contribution
can be based on GNP and/or Southern African Customs Union (SACU).
2. Contribution from International Development Agencies (e.g. USAID; European
Union, etc.)
3. Low interest loans from International Funding Agencies (e.g. World Bank, EIB,
DBSA, IDB, etc.) based on a business model for the water infrastructure
4. Access funds designated to regional development for public benefits and or align with
other regional bodies that are participating in work for public benefits (e.g. SADC,
AU, etc.).
6.3 Funding through water tariffs
Water boards are separate legal entities that have their own boards of governance, own assets
and are required to be self funding. They are key strategic organisations that primarily
provide bulk potable water services to water service authorities (municipalities), other water
service institutions and major customers within a designated service area. Water boards vary
considerably in size, activities, customer mix, revenue base and capacity, one of them has
been around for more than 100 years, viz. Rand Water, while others are still considered to be
emerging.
Most of the older and more established water boards are cantered in areas where there are
significant urban development nodes (e.g. Rand Water, Umgeni Water, Magalies Water, etc.),
while other water boards operate in more demographically diversified areas where there is an
urban and rural mix in the customer base. Water boards while providing bulk treated water to
municipalities, in some instances also provide retail water and sanitation services on behalf of
municipalities.

120
6.4 Funding through Public-Private Partnerships (PPP)
Clearly, other governments have managed to establish mechanisms and controls that allow
the involvement of the private sector in the provision of some public infrastructure. Control
and public benefit is secured through legislation and a strict method of measuring the benefits
of the non-traditional approach against more traditional ways of funding public infrastructure.
This is not to say that the recommendation that public/private partnerships or non-traditional
funding should become the main delivery vehicle for public infrastructure. But there must be
a role for non-traditional approaches which can assist in financing public infrastructure.
Meaningful involvement by the private sector is, however, not automatic; from the
experience of other countries, the following are noted as important prerequisites for such
financing:
• Political commitment: Political commitment enshrined at the policy level is important
for the private sector, because unless there is a stable investment environment and
continuing business opportunities, firms will be reluctant to develop the necessary
resources required to bid for contacts.
• Enabling legislation: Non-traditionally funded projects often need to be supported by
enabling legislation that is firmly embedded in the legal structure.
• The existence of a concession law that can be readily applied; the removal of tax
anomalies; and refining of public expenditure capital controls to accommodate non-
traditional financing.
• Evaluation Framework: A review/evaluation framework, within which all significant
public infrastructure projects are assessed, should be used to determine if non-
traditional delivery mechanisms are appropriate.
• Expertise: Both the public and private sectors must have the necessary expertise to
deal with process. The public sector procurer, for example, needs to be able to
negotiate individual project contracts and to access the appropriate financial, legal and
technical expertise.
• Project prioritization: The government needs to identify those sectors and projects that
should take priority and are amenable to a non-traditional process. A review of the
commercial deliverability of the scheme, prior to the commencement of the
procurement process, can be a source of comfort to the private sector. It helps to
reduce the incidence of unsuccessful competitions and avoid the associated bidding
costs that would otherwise be incurred.

121
• Shared Risk: An essential tenet of the public/private partnering process is that there
should be a transfer of risk to the private sector partner. The risk should, however, be
carefully defined and limited to risk over which they have control.
• Deal flow and standardization: A regular and predictable flow of deals, based on
recognized risk allocation templates, nurtures the development of a successful and
strong program. Guidance on contract structure also helps to keep costs down.
6.5 Funding through private sector markets
The establishment of an infrastructure bank could provide the most appropriate form of
financing for each project, drawing on a flexible set of tools such as direct loans, loan
guarantees, grants, and interest subsidies for possible “Build South Africa Bonds” (sensu lato
Lamb, 1984; Tyson, 2011). It could be given the authority to form partnerships with private
investors, which could increase funding for infrastructure investments and foster efficiency in
project selection, operation, and maintenance. That could enable the bank to tap into the
significant pools of long-term private capital in pension funds and dedicated infrastructure
equity funds looking for such invest opportunities. The concept of infrastructure banks with
a pool of funds for low-interest loans has been endorsed in certain countries (Lamb, 1984).
The Southern Africa the Development Bank of Southern Africa (DBSA) was established as a
“bank for regional development” to fund local infrastructure improvements using the strength
of its balance sheet providing financial instruments such as low interest loans, revolving
loans, issuing of infrastructure bonds, etc. Other measures considered by Lamb (1984)
involve privatization and would include sale-lease backs and service contracts. Still other
approaches include liquidation or recapitalization of non-public-purpose or marginally
public-purpose facilities to private ownership, and various cost-reduction strategies.
6.6 Demand (market) risk management
Following the Global Financial Crisis bankers have become more risk averse to investing in
infrastructure and have looked for more support from government. This has been particularly
evident in the context of willingness to accept demand risk, where the private sector sponsor
is not necessarily well placed to assess and manage the risk. Demand for infrastructure and
willingness to pay user charges can be difficult to assess as it involves consideration of many
factors beyond the scope of the project, such as capacity of users to pay, price regulation, the
overall infrastructure supply chain and alternative ways of meeting demand. This has been

122
demonstrated with recent experience with water infrastructure projects in South Africa, where
private finance has solely relied upon the adequacy of revenue to service debt and provide a
return to equity.
Against this background private investors have been loath to finance infrastructure assets that
have demand risk attached. Some say the answer is for the public sector to simply step in and
underwrite demand and use so-called availability payment structures as used on recent water
infrastructure projects. But historically, one of the main drivers for economic infrastructure
was to transfer the funding burden from the public sector to the private sector and access
additional funding that is truly off the Government balance sheet. Indeed the privately
financed water infrastructure projects in South Africa would never have proceeded under an
availability based model with all the debt on the State’s balance sheet.
Moreover, even when projects are structured on an availability payment basis, there may still
be a need to assess demand risk. The availability payment mechanism may be structured to
provide a capital recovery element to provide greater certainty of ability to service debt but
leave equity partially exposed. This could also be achieved either through a KPI regime,
whereby availability payments are abated if patronage is low, or straight financial incentives
linked to patronage. This raises the question what can the private sector reasonably be
expected to do to increase patronage. But the objective is more to align private sector and
public sector interests rather than allow the private sector perversely to benefit from lower
maintenance costs, consequent upon an under utilised facility. Finally, infrastructure can have
greater appeal to equity when investors have the scope to generate upside returns through
higher utilisation as the economy grows. Conversely, pure availability payment based
infrastructure, provides limited upside as investment is narrowly focused on maintaining
assets and delivering services to meet a specific contract’s obligations.
The impact of a more risk-averse approach by bankers will undoubtedly constrain the amount
of private sector capital that could be contributed for the funding of water infrastructure. This
applies if the funding model was to be undertaken with the projected water revenue stream
providing the source of repayment. Bankers will focus more on downside demand scenarios
and question the robustness of water supply and demand forecasts. More rigorous analysis
will be required of factors such as customer willingness to pay water use charges, demand
elasticity, justification of the value attributed to water provision, and alternative water
(provision) delivery modes. More conservative financing parameters such as debt sizing

123
ratios, gearing, and debt tails can be adopted. The inevitable end result will be that
Government will need to supplement private sector capital and explore with the private sector
how public funding can be best structured alongside private sector capital. This has already
been implemented on other completed water infrastructure deals, where the government
contributed funding for part of the capital works. This does potentially transform the risk
profile for Government and additional safeguards are required to avoid the public sector co-
investing in poorly structured private projects or taking on unreasonable termination
liabilities.
6.7 Innovative and alternative funding/financing models
Innovative approaches to financing can only be considered where definite value for money
can be demonstrated. It is also important to understand that value for money cannot be at the
expense of existing public sector staff. To ensure that these objectives are met and
consistently applied, innovative financing models can only be considered under the following
conditions:
• The private sector has to have experience and there has to be a demonstrated value for
money (there is a formal documented process which must be used to demonstrate
value for money);
• It must be possible to clearly define and measure expected service outputs can be third
party performance audits;
• It must be demonstrated that involving the private sector as part of an innovative
financing scheme is the best procurement model given other possible options;
• It must be possible to life cycle cost the service over on extended period of time; and
• Projects must be of sufficient size and scale of transaction costs (both for the
government and private sector participants) are not disproportionately large.
Although there is a bias to use innovative public sector financing schemes where there is a
long-term operating and/or maintenance component, construction projects with long-term
take-out financing that do not involve a parallel arrangement for operation and maintenance
are also considered. A national approach can be deployed in South Africa, in order to:
• Promote consistent approaches to developing projects across South Africa – including
standardized risk allocation models, tendering processes, interactive bidding processes
and so on.

124
• Develop better coordination, information sharing and support. Greater consistency in
the implementation of PPPs by South African Governments would reduce bidding
costs, whereas increased national co-operation will streamline the bidding process and
better co-ordinate the pipeline of projects going to the market. Governments will also
benefit from a more competitive market, with improved value for money in project
delivery.
6.8 Financial and economic analyses, requirements instruments
6.8.1 Financial analyses and requirements
Based on the scheduling of projects as presented in Appendices 1 and 2, together with the
cost estimates and construction times used in the unit reference value (URV) calculations,
projections were made of the capital investments as well as of the operation and maintenance
costs required (cf. Appendix 5). A summary of these, for all the regions in the country, is
presented in for the period until 2020 (Tables 5.2 – 5.5; Figures 5.2-5.5; Appendices 1 and 2).
All the costs are in constant June 2009 money values, representing the relevant annual
expenditures (Tables 5.2 – 5.5; Figures 5.2-5.5; Appendices 1 and 2). Particularly evident is
the high initial investments required with respect to water infrastructure. In addition, the
successful implementation of water conservation/water demand management (WC/WDM) is
a necessary prerequisite to achieving the lower demand curves on which the scheduling of all
the augmentation options is been based (refer to Appendices 1 and 2). Also evident is the
high capital costs for the construction of new schemes, compared to lesser expenditures
(operations and maintenance) during later years. This is reflective of the backlog that has
developed with respect to the implementation of new water infrastructure schemes, and
where further delays are likely to put the water supply situation to several key economic and
growth areas in the country severely at risk. The strong growth in operation and maintenance
costs in future (all in current money values) will be largely attributable to the large energy
requirements for future pumping of water and desalination of seawater, where needed and
appropriate.
6.8.2 Economic analyses and requirements
The economic value of water refers to the assessment of the economic benefits that are
typically achieved through the use of water in different sectors of the economy. It is therefore
not based on the cost of water in any way. From an economic perspective, however, it is

125
important that the value of water to be derived from the application thereof for purposes of
economic production be in excess of the cost of water supply for that particular use. Should
this not be the case, it would imply that other sectors of the economy would indirectly be
subsidising the relevant use. The criteria as above, however, does not apply to the primary
uses of water such as basic human needs and for environmental purposes, which are not
measured in economic terms but where other norms apply.
Economic effects are conveniently expressed in terms of production and employment. A
well-known production indicator is the Gross Domestic Product (GDP). Reference can also
be made to Gross Value Add (GVA). Employment is expressed in jobs (person years) per
unit of water. Issues such as social impacts as well as construction costs and transfer costs are
excluded from the above.
Charges for achieving the equitable and equitable and efficient allocation of water (Economic
charge) must be used. The administratively determined charge can be used in water stressed
catchments to provide an incentive for existing users to increase economic efficiency. The
administratively determined charge will be based on the opportunity cost of water as
determined by prevailing trading transactions but will be capped to the level of the return on
assets charge for the relevant scheme or system (DWA 2007).
The administratively set economic charge will not be introduced before compulsory licensing
is implemented, and then only after consulting the relevant stakeholders and water
management institutions. This annual charge will be an add-on to any charges levied for
water resource management, depreciation and use of waterworks (DWA, 2007).
Where amounts of water are still available for allocation after compulsory licenses have been
issued, and there is competition for using this water, the public auction procedure can be
followed. The price established in this manner will be based on market clearance principles
by allowing applicants to take up the entire available supply through bidding or tendering
process, in accordance with the National Water Act. Another market-orientated mechanism,
which is already in place, is the transfer of water use entitlements via trading transactions in
terms of the NWA between water use sectors. This may obviate the need of setting economic
charges administratively in water-stressed catchments (DWA 2007).

126
The Department, and all the stakeholders, concurred with the economic view that social
welfare is maximized when all costs are reflected in prices, a concept sometimes referred to
as “full cost pricing” or the “polluter pays principle”. Only when production and consumption
decisions take into account all costs to society can an appropriate balance between supply and
demand be achieved on the basis of pricing. When prices are artificially low, consumption
tends to be excessive.
While it is unlikely that the Department will be able to fully cost all externalities into water
charges, it is important to use pricing to encourage consumers to appreciate the true value of
water and effect changes in their patterns of consumption. The Department has a raw water
pricing strategy, introduced in April 2007, which levies four charges: water resource
management; operations and maintenance; depreciation; and Return of Investment (ROI).
Water prices can be used to encourage customers to use less water and to achieve efficiency
gains that enable water infrastructure and system managers to postpone the need for new
water infrastructure capital outlays. The general types of conservation pricing options must
include: 1) the repeal of discounts to industry as an establishment incentive; 2) repeal of
water use charges capping; 3) increased block tariffs; 4) seasonal rates, with higher tariffs
during dry seasons and droughts; and 5) excess use charges.
Resource poor farmers are excluded from the ROI charge in relation to irrigation, which
poses a threat to DWA’s ability to recover the cost of supplying water and operations and
maintenance. There is a definite sense that water is too cheaply priced for this irrigated
agriculture sector despite average increases in excess of 20% per annum since the new
pricing strategy was introduced. The sector could be provided with financial incentives to
upgrade their irrigation systems to support water conservation. These incentives could be
financed by introducing a 1% ROI charge to water used for irrigation, (while all other user
sectors pay a ROI of 4%). A further incentive will obviously be the resultant water savings,
which could be sold to the state or be traded in areas where water is in surplus. In areas of
water scarcity, trade between users must be regulated to ensure the best possible socio-
economic use of water.
The application of pricing as a tool to manage demand in a municipal (domestic) and
industrial (commercial) context needs to factor in both affordability and revenue stability. In
terms of affordability, municipal level pricing should take into account the characteristics of

127
particular customer classes and their ability to pay higher rates. “Lifeline” rates structures can
mitigate undue hardships for low-income customers and should cover the basic volumes of
water needed for sanitation. With respect to revenue stability, the total loss from water
reticulation systems for the country was approximately 1 150 million m3/a, which is
equivalent to 28.8% of the approximately 2 000 million m3/a of total municipal system water
input at that time. Revenue instability is the most frequently cited obstacle to the adoption of
water conservation projects. This is because conservation results in less water being sold; one
way of mitigating this loss of revenue is to shift some charges from a volumes base to a fixed
charge. In essence, domestic and commercial users must be encouraged to invest in water
infrastructure maintenance projects that will minimise water losses, any resultant loss in
water income could be mitigated by reducing volumetric charges and increasing fixed
charges.
6.9 Comparative analysis
As noted, many countries have well-established policies and procedures, not only to select
projects where innovative financing procedures could apply, but also to ensure that the “deal”
meets established project guidelines and is, in fact, a good deal. It is important to note,
however, that does not, necessarily, imply a sale of the asset or loss of public control. In
many countries the focus is on creating an environment where private funds and other private
sector strengths can be employed, without loss of public control over pricing and quality of
service. Using alternate financing methods to supplement direct investment by the public
sector is also not applicable to all types of projects for a variety of reasons. Nevertheless, in
the UK 10% to 13.5% of the annual investment in public infrastructure is now funded in a
non-traditional manner involving private sector financing. There is an extensive range of
generic models for infrastructure financing. Some of these lend themselves to private sector
involvement (a more specific listing of models where the private sector could participate in
financing and operating is in Appendix 4). From a review of this list, it is clear that not all
models apply to all situations and, in fact, they often achieve different policy objectives. The
UK experience is perhaps most interesting for South Africa.
Poor governance and inadequate investment are resulting in billions of people not having
access to water and sanitation services (OECD, 2009). The Organisation for Economic Co-
operation and Development (OECD) produced a report in 2009 on pricing and financing
water (OECD, 2009). It can be concluded, amongst others:

128
• The water and sanitation sector is seriously under-financed in many countries. In
some developing and transition (emerging) economies, this has led to the deterioration
and the eventual collapse of infrastructure.
• Effective financial planning for the water sector requires finding the right mix of
revenues from the so-called “3Ts”: tariffs, taxes and transfers (including official
development assistance (ODA) grants).
• Full cost recovery from tariffs which may theoretically be the ideal solution, in
practice remains a distant objective in many countries. However, even very poor
countries can reach important cost-recovery targets at the sub-sector level: such as
cost recovery for operation and maintenance (O&M) and investments in urban water
supply, or cost recovery for O&M expenditures in rural water supply. Increasing
revenue from tariffs requires a comprehensive approach, which includes reforming
tariff levels and structures and increasing bill collection rates, but also increasing
levels of service and putting in place social protection measures.
• Where full cost recovery from tariffs cannot be achieved, public budgets and, for
poorer developing countries, ODA will need to play an important role in financing
sector costs. The water sector should therefore aim to achieve cost recovery from a
combination of financial sources, including user charges, public budgets and ODA,
rather than from tariffs alone – a concept that has been termed “sustainable cost
recovery”.
• Tariffs have to meet diverging financial, economic, environmental and social
objectives, some of which may be conflicting. A major challenge therefore is
designing tariffs in a way that strikes an appropriate balance among competing
objectives. This is ultimately a political task and needs to be addressed through a
transparent, democratic, participatory process.
From the World Bank findings there were arguments against full cost recovery through water
pricing which in the developing countries are not achievable (World Bank, 1994, 2010).
Several countries are exploring unique pricing-related issues, worthy of mention, Israel, is
considering charging different prices for irrigation water of different quality (saline water,
waste water, fresh water), adjusting prices to reflect water supply reliability, and
implementing a resource depletion charge. Several countries are considering adjusting
charges to reflect regional differences in water supply costs. A few countries have addressed
the need to charge the end-user for safer drinking water by including treatment costs in the

129
water tariff. Water pricing has twofold aims of expanding water supply and encouraging
more responsible use of the water resource.
Thus, the following can be considered from emerging and/or developing countries
(economies) from the Private Funding Initiatives:
• As funds do not flow to the private partner until the project is ready, schedules are
typically fully adhered to and budget exceedances are very unusual unless project
scope or specifications change. The benefits are not achieved from construction alone
(particularly in a design build situation). The real benefits are obtained if the private
sector is involved in the project for the long term and is “forced” to consider life-cycle
costs.
• It is generally recognized that the government’s cost of capital is usually lower than
the private sector. However, when these projects have been evaluated on a risk
adjusted basis (incorporating schedule and cost over-runs), the private sector approach
is often less costly.
6.9 Conclusion
From the above discussions, a number of conclusions can be drawn from the funding models
results:
• That over and above the capacity issues raised above, there is also a significant
mismatch between the estimated capital required to develop or rehabilitate the water
infrastructure necessary for the provision of basic services and the current available
capital budgets
• For the immediate future, operating budgets (assuming effective revenue collection)
will be sufficient to service the operating requirements. However, within 5 years or
so, economically weaker municipalities (mainly categorised as low capacity
municipalities here) will not be able to accommodate the operating requirements from
rolling out services to mostly poor citizens from their economic base.
• That government must extends the period to eradicate the capital and rehabilitation
backlog
• That government must adjusts the minimum standards in a manner that reduces
capital and operating costs
• That increased funding must be made available to meet the capital and operating
requirements.

130
CHAPTER 7: CONCLUSIONS AND RECOMMENDATIONS
7.1 Conclusions
7.1.1 Investment and maintenance backlogs
The institutional problems are serious enough on their own; however, they have emerged in
the same period that the government has sought to extend access to water and sanitation to
people and communities who have long been neglected and are often far away from existing
infrastructure. Though this initiative was and remains justified on moral grounds, it has
resulted in a massive backlog in investment and maintenance throughout the country. Given
this, and the illegal use of water (notably in the upper Vaal River system), some 30 per cent
of our usable water is being wasted. On current trends, then, the country is headed for a crisis
of water security and quality that will hamper our socio-economic development, both directly
and indirectly. One example of this arises in relation to South Africa’s socio-economic
development. It is usually easier and cheaper to supply water to urban centres than to low-
density communities in remote rural areas. This means that, despite its political popularity,
any ambition to extend services to all South Africans would raise input costs, increase
wastage, and reduce efficiency. Obviously, not all schemes beyond urban areas are
unaffordable or undesirable. However, the increasing scarcity of water means that its
availability and quality has to be factored into decisions about public and private investment
and resource allocation, including those about the balance between urbanisation and rural
development. Water scarcity should also be taken into account in other areas. Government
support for the expansion of some industries and the development of some geographical areas
may need to be critically reviewed. Taking a very long view, water availability and price may
well lead to a shift in the country’s settlement pattern, with coastal areas being favoured
because of the advent of economic desalination.
Over and above the condition of the infrastructure, the management as well as operations and
maintenance thereof has been identified as a critical issue. Infrastructure refurbishment is
provided through the WTE. An enterprise wide asset management approach is needed in
terms of the requirements of the asset register for water resources infrastructure. Detailed
inspections are conducted to establish the condition and remaining life of assets. This will
further help the Department in prioritising refurbishment and rehabilitation plans.
In terms of water services, the most serious challenge to city infrastructure systems is
inadequate funding. Cities need access to infrastructure funding that is substantial enough to

131
address their needs. According to the DCOGTA and SALGA, 79% of cities indicate that
grants are among the top three most critical funding sources for street improvement and new
construction. Additionally, limited state grants and loans are among the top three biggest
challenges to financing the cities’ sewer/waste water systems. Avoiding situations such as
further infrastructure decay, moratoriums on new construction, difficulties in attracting new
businesses and unaffordable utility services are some of the reasons why substantial funding
is needed.
While spending and the magnitude of fiscal transfers dedicated for basic services
infrastructure delivery has been consistently improving, there still remain considerable
service backlogs, particularly in rural areas. Recent studies of infrastructure projects just
completed still indicate issues in terms of the quality of construction; and the condition of
existing infrastructure is still not being maintained at the level required to provide a
consistent, adequate level of basic services to the more disadvantaged groups of the
population. These issues are illustrated in greater detail in the next two sections. This
indicates that the effective use and management of funding towards infrastructure needs is
still an issue.
7.1.2 Recent government initiatives
The South African government has recognized that new delivery models are required to close
the gap. Over the last few years, South Africa has made impressive moves in the right
direction with its new growth path (NGP), new investment strategies and initiatives to
encourage investment in public infrastructure, including the National Water Resources
Strategy (NWRS), Water for Growth and Development (WfGD) and Strategic Framework for
Water Services (SFWS) for planning, financing and procuring public infrastructure; 1) the
long-term growth and infrastructure renewal planning across the provinces; 2) project
priority; 3) the expertise by DWA to manage the implementation of AFP projects; as well as
4) the commitment in infrastructure expenditures in the MTEF budget.
In 2000, the South African government established the framework for planning, financing
and procuring public infrastructure. The framework manages the process of planning,
procuring, building and maintaining public infrastructure, to ensure it get the best value for
public investments and proper life-cycle maintenance for public assets. This framework also
help the government and the broader public sector assess proposals for new infrastructure,
132
select the best way to finance projects, ensure construction is completed on-time and on-
budget, and maintain public assets properly.
In 2004, the South African government released a five year strategic infrastructure
investment plan (NWRS) that will co-ordinate contributions from all levels of government,
the private sector and public agencies to generate more than R30 billion for investment in
public water infrastructure by 2014. DWA directs infrastructure investments to the most
important priorities for socio-economic development and creates new connections between
planning, funding and investment priorities. It sets priorities for critical infrastructure
investments and shows how the government will work with partners to find new sources of
investment.
With overwhelming demand for regional bulk infrastructure assets to be accelerated around
the country implementation of any of these models will go a long way toward leveraging
private sector investment in economic infrastructure assets and allowing the government to
both recycle its capital and share in future recovery of financial markets, while at the same
time addressing demand risk.
We need to retain the users-pays principle by charging users for use of infrastructure. This
provides the benefit of enabling “non-Government” funding to be raised. But also leads to
proper market based pricing signals being employed, which drives more efficient utilization
of infrastructure. There is more rigorous due diligence on projects, as well as a more
detailed, shared understanding between the public and private sectors of the key drivers of
demand and this will help in encouraging the development of infrastructure assets on a true
public private partnership basis.
In the future we will see more conservative finance plans and we must expect that, project
agreements will be negotiated to mitigate demand risk and incorporate mechanisms to
expressly protect private sector investment. Moreover, if demand due diligence identifies
specific possible events that can be influenced by the public sector that affect demand, then
provisions to expressly protect private sector investment against such events will need to be
explored. In addition, the commercial framework should incentivize the public sector to
partner with the private sector in mitigating the impact of those risks.

133
But, as the above models show, there are ways to incentivise the private sector to partner with
the public sector, and at the same time mitigate the impact of demand risks and allow both
parties to share in upside. Such new thinking is needed to get the next wave of infrastructure
assets off the ground.
7.1.3 Finding the money (Funding Models)
If the public sector is unable to fund the required infrastructure spending and the private
sector is unwilling to take on the entire burden itself, new and imaginative means of
generating private investment will need to be developed. Certain projects are likely to be
easier to fund privately than others. The infrastructure funding gap was compounded by the
impact of the financial crisis, but this should not be seen as an insurmountable barrier. Whilst
the Government will need to act very carefully in order not to distort savings and investment
markets, the scale of the infrastructure challenge in the South Africa demands innovative
solutions and new forms of funding models to maximise private sector investment. Even in
the absence of the financial and fiscal crisis a game changing upward shift in infrastructure
investment is a difficult proposition. Any increase in indirect taxation (such as green taxes or
carbon taxes) must be offset by direct or indirect tax reductions elsewhere. As a country we
must not slip into the idea that ‘new green taxes’ are a free lunch. They need to be seen as
part of a gradual shift from direct to indirect taxation whilst not increasing the overall tax
burden – indeed, reducing it in the wake of spending restraint elsewhere in the public sector.
7.1.4 How will the government implement the new investment strategies?
It can be concluded that the management of national water infrastructure and in particular
bulk infrastructure can be improved in conjunction with the water security and availability
scenario in South Africa. However, the Department has initiated various actions to
strengthen its position on infrastructure development: i.e.:
• Upgrading Water Services Development Plans (WSDP) requirements, addressing
local knowledge, ability and commitment
• Various water demand usage and planning studies have been undertaken to not only
confirm the facts but also to identify intervention areas and opportunities
• Improved governance which includes improved regulation, discipline, institutional
arrangements, performance agreements, intervention and planning
• Improved sector culture, professionalism and practices. This is aimed at especially the
professional sector, providers, operators and advisors.
134
• Funding and financing for improving infrastructure development and systems
• Contributing to a comprehensive monitoring systems for integrated infrastructure
development
• A national infrastructure situation and functional assessment
• An asset management strategy with associated actions; and
• Sustainable infrastructure and asset management as part of the feasibility studies
required for water infrastructure
7.2 Recommendations
The review of the DWA’s challenges, achievements, lessons and recommendations in terms
of operation led to the following important recommendations/findings. It was clear that
government would benefit from establishing a specialised technical and financial support
mechanism. However, such a structure:
• Must be mandated, recognised by and promoted by government
• Will benefit from (structured) partnerships with key stakeholders
• Must have good systems and reliable service data
• Must have appropriate skills (including technical operational skills) mobilised in
specialised technical units.
• Securing loans and/or financial assistance; and
• Dealing with the challenge of capacity constraints, both in terms of human skills
capacity and financial capacity.
Although water user fees of various types partially fund some of South Africa’s public
infrastructure, the link between cost and use is not well-established in the public’s mind.
Reinforcing this relationship could lead to conservation measures and would also make it
much easier to create stable funding vehicles that do not depend solely on general tax
revenues. In order to encourage funding vehicles that use private funds to invest in South
Africa, the recent initiatives should be continued. The government should also create a stable
investment environment through political commitment (but not interference), consistency, a
regular and predictable flow of deals, and suitable framing legislation. This ensures life cycle
costing and the establishment of true user costs. A reasonable transfer of risk to the public
sector should be a minimum government requirement of any partnership with the private
sector. Third party performance audits are also required for successful partnering. User fees
135
should be considered and a strong public communications program developed to support the
process. The standardization of risk allocation models, tendering processes, bidding
processes, contract and evaluation would significantly reduce bidding costs. The well-
established link between investment in public infrastructure and economic competitiveness
means that South Africa must act now if it is to avoid a widening infrastructure gap.
The current Raw Water Pricing Strategy (RWPS) is not fit for the purpose it needs to be
compared with the National Government mandate and strategies. It is not raising adequate
funds or influencing behaviour in a way that supports water demand management and
conservation. The Raw Water Pricing Strategy review process must address the setting of
charges and allocating recovered funds for water infrastructure development and management
(operations and maintenance). This issue must be resolved in terms of improved systems and
procedures under the proposed institutional arrangements. The proposed institutional
arrangements for national water infrastructure management in South Africa must, also as a
matter of urgency, facilitate a new customer business orientation and related skills
development programme within DWA. This must be linked to the drive for employment
equity, particularly at the management and professional staffing levels. As part of its
investigations into institutional options for the management of national water resources
infrastructure, it is recommended that DWA must consider the following options:
• DWAF is to be responsible for managing water resources infrastructure (within a
Branch structure), while TCTA funds and implements specific commercially viable
projects.
• A National Water Infrastructure Agency (NWRIA) is to be established to finance,
develop and operate national water resources infrastructure.
• Policies with regard to overt subsidies (e.g. free basic water and hidden subsidies eg.
irrigation) need to be re-evaluated. Investment should be made in sources of
additional water – e.g. groundwater
• Further sources of finance should be sought notably The World Bank and the private
sector where involvement in infrastructure development and the provision of finance
may apply
• The institutional arrangements reflecting the availability of finance e.g. TCTA,
NWRIA (or WRIB), Water Boards need consideration

136
Thus, to ensure financing of water infrastructure through funding from investments, cost
recovery, operations and maintenance, etc., a catalogue of the national water sector in S.A. is
needed through (cf. Figures 5.2 and 5.19):
1. National Sector Policy setting and co-ordination
2. Environmental and Economic regulation and performance monitoring
3. water resources development and management
4. bulk water supply- cost of the water value chain
5. distribution of water
6. household sanitation
7. waste water collection, transport and treatment
8. funding of water sector is uneven
9. bulk water supply is not adequately funded
Long-term financial planning should be conducted to provide for the large capital
investments in water resource developments together with the relevant operating and
maintenance costs that will be needed during the coming decades. The implementation of
projects needs to be expedited and decision-making streamlined to prevent further backlogs
from developing. Continued monitoring and assessment of developments and of water
requirements must be done. Further studies need to be conducted into the value of water in
different sectors and uses, to inform the possible re-allocation of resources. Social, political
and strategic aspects should be considered together with the economic value of water, to
ensure that all are properly accounted for.
Opportunity still exists to capture some very significant funding sources available from the
public sector pension funds in an innovative way to offset a portion of South Africa’s public
water infrastructure deficit. These pension funds have fiduciary responsibilities to their plan
members. However, recommendations are therefore:
1. Initiatives should be investigated. Over the last number of years, the South African
government has made some impressive moves in the right direction towards
innovative financing.
2. The climate of uncertainty surrounding the relationship between the government, the
public sector unions and potential infrastructure delivery partners should be avoided.
Correct or not, the perception by certain politicians, and the civil service in general is
that the ability of the private sector to deliver public services is highly over-rated.
137
3. Uncertainty arising from the current environmental assessment (EA) process should
also be resolved. Current process for infrastructure investment by government
involves lengthy EA process.
4. Innovative financing must be strongly supported by policy or legislation. This is a
prerequisite and, for example, the use of innovative forms of funding is supported by
legislation in some countries (e.g. Japan, Ireland, France, Chile) or by a strong policy
position (UK and Australia).
5. A stable and consistent policy environment must be created. A consistent approach
and policy is essential in creating a stable environment for private investors. Signals
from governments that they are ready to commit the sort of stable, long term public-
private partnerships, are essential in attracting pension funds to invest in infrastructure
projects.
6. The level of standardization must be increased. Consistency and standardization is
the critical success factor in delivering the AFP projects. The standardization of risk
allocation models, tendering processes, bidding processes, contract and evaluation
would significantly reduce bidding costs.
7. A regular and predictable flow of deals should be available and communicated to
private investors. A pipeline of projects going to market can give forewarning to the
market of future projects and indicating the sectors in which new business
opportunities are likely to arise, e.g. forward planning of water infrastructure projects
(cf. Appendices 1 and 2).
8. User fees or charges should be considered, further expand and/or improve. Innovative
financing is well adapted to the application of user fees. As these fees would be
applied to financing costs, ongoing operations and maintenance, contractual
arrangements which limit cost increases are much easier to achieve. This is not the
case if there is a sale of the water assets as privatization. The Sustainable Water and
Sewage Systems legislation recognizes that user fees should reflect the true cost of
providing the service and points to a window where new and innovative approaches to
funding public infrastructure should be considered (DWAF, 1997; DWAF, 1998).
9. Innovative financing must not be seen as a way of shedding public sector jobs.
Although an innovative financing scheme implies a long-term contractual
relationship, its principal intent should not be seen as the elimination of public sector
jobs.

138
To benchmark and align the funding models for the financing of water infrastructure
development projects in South Africa with international best practices and guidelines (i.e.
World Bank, African Development Bank, Southern African Development Bank, Asian
Development Bank, European Development Bank, European Directives, etc.) have to be
taken into consideration in designing strategic responses and their interventions. The
following are the recommendations provided:
• Increase assistance available through existing or new infrastructure grant and loan
programmes
• Provide greater fiscal flexibility with existing resources
Whilst the required investment appears daunting, it could be achieved. If we want to build a
truly world class water infrastructure, there is a way forward. Thus, the recommendation that
the necessary funding can be found with the following measures:
Infrastructure 1 – Change existing fiscal plans that ring-fence other Government departments
such as water affairs, in order that the only area of public spending to be ring fenced is
infrastructure investment, because of its positive impact on the supply-side of the economy
and long-term GDP growth. Current plans see public capital investment increasing over the
2011-12 to 2013-14 period.
Infrastructure 2 – Commit to a new Strategic Investment Fund (set at 1.5% of GDP per
annum) earmarked for the most important strategic water infrastructure projects – funded by
restraint in non-capital expenditure elsewhere in the public sector. The fund would not be
limited to iconic projects. The Strategic Investment Fund could be used to pursue many of
the small infrastructure investments, because in total they would add up to an impact of
strategic significance. However, it would be more likely that local and city region authorities
would be the channel to improve smaller scale investments.
Infrastructure 3 – Critical to success will be the ability to leverage in private investment on
the back of public sector and accelerated planning approval through the Planning
Commission. In addition to leverage, the key to maximising investment, with or without any
public contribution, will be the policy environment.
Infrastructure 4 – Ring fence the future proceeds from bank privatisation and earmark this
revenue for infrastructure investment. Potential revenue here could be R6bn plus. Other
potential funding sources which might be considered include privatisation of the water
infrastructure network.
Infrastructure 5 – Do not be compelled into identifying every possible funding source at the
outset.

139
Finally, the government must establish and develop an independent economic water regulator
which will ensure efficient pricing in the water value chain and to ensure that inefficiencies in
the water supply sector are not passed on to the water sector users.

140
REFERENCES
American Association of State Highway and Transportation Officials. 1995. Innovative
transport financing. Washington, DC.
Basson, M.S. 2010. Assessment of the ultimate potential and future marginal cost of water
resources in South Africa. DWA Rep. no. P RSA 000/00/12610. Pretoria
Brineco-Garmendia, C., Smits, K. and Foster, V. 2008. “Financing infrastructure in Sub-
Sahara Africa: Patterns, issues, and options.” In: AICD Background Paper 15, Africa
Infrastructure Sector Diagnostic. Washington, DC: World Bank.
Brookfield, S.D. 1987. Developing critical thinkers. Buckingham: Open University.
Casadesus-Masanell, R. and Ricart, J.E. 2011. ‘How design a wining business model’,
Harvard Business Review, 89 (1/2): 100 – 107.
Camp, R.C. 1995. Business process benchmarking: finding and implementing best
practices. Wisconsin: ASQC Quality Press
Chapman, D. 1992. Water quality assessments. London: Chapman and Hall.
Coldwell, D. and Herbst, F. 2004. Business research. Cape Town: Juta and Co Ltd.
Conningarth Economists. 2002. Cost benefit analysis in SA for water resource development.
WRC Report No. TT177/02. Pretoria: Water Research Commission.
Cooper, D.R. and Schindler, P.S. 1993. Business research methods. 6th ed. New York:
McGraw-Hill.
Cranston, S. 2005. ‘Old Mutual: Closing the gap’, Financial Mail. 28 January. 1 - 4.
Creemers, G. 2002. Development of a hydrological economic agricultural model based on
case studies in the upper Mvoti Catchment. WRC Report No. 890/1/02. Pretoria:
Water Research Commission.
141
Denscombe, M. 2003. 2nd ed. The Good research guide for small-scale social research
projects. United Kingdom: The Open University Press.
Department of Water Affairs. 2010. Strategic Plan 2010/11-2012/13. Pretoria.
Department of Water Affairs. 2009. Strategic Plan of the Department of Water Affairs.
Pretoria.
Department of Water Affairs and Forestry. 2008a. Water for Growth and Development,
Version 8 [online]. Available from:
http://www.dwaf.gov.za/Documents/Notices/WFGD_Framework_v8.pdf
[Accessed: 31 January 2011]
Department of Water Affairs and Forestry. 2008b. Strategic Plan 2008/09 -2011/12.
Pretoria.
Department of Water Affairs and Forestry, 2007. Raw Water Pricing Strategy of South
Africa. Pretoria: Government Printer.
Department of Water Affairs and Forestry. 2004. National Water Resources Strategy of
South Africa. Pretoria: Government Printer.
Department of Water Affairs and Forestry. 2003. Water Services Strategic Framework.
Pretoria: Government Printer.
Department of Water Affairs. 2002. Retail Water and Sanitation Guidelines. Pretoria.
Department of Water Affairs. 2001. Guidelines for bulk potable water tariffs. Pretoria.
Department of Water Affairs and Forestry. 1999. Water Conservation and Water Demand
Management National Strategy Framework (Draft) [online]. Available from:
http://www.info.gov.za/view/DownloadFileAction?id=70484
[Accessed 31 January 2011]

142
Department of Water Affairs and Forestry, 1998. National Water Act (Act 36 of 1998).
Government Gazette 398 (no. 19182) of 26 August 1998. Cape Town: Government
Printer.
Department of Water Affairs and Forestry, 1997. White paper on a national water policy for
South Africa [online]. Available From:
http://www.dwaf.gov.za/Documents/Policies/nwpwp.pdf
[Accessed 01 February 2011]
Department of Water Affairs and Forestry. 1997. Water Services Act. Pretoria: Government
Printer.
Des Kerdachi. 2002. The review of industrial effluent tariff structures in SA. WRC Report
No. 854/1/02. Pretoria: Water Research Commission.
Development Bank of Southern Africa. 2009. Water Security in South Africa. Development
Planning Division Working Paper Series No.12. Midrand.
Eberhard, R. 1999. Supply pricing of urban water in South Africa. WRC Report No.
678/1/99. Pretoria: Water Research Commission.
Economides, N. 1993. “A monopolist’s Incentive to Invite Competitors to Enter in
Telecommunication Services.” In: G. Pogorel. ed. Global Telecommunication
Services and technological Changes. Amsterdam: Elsevier.
Economides, N. 1996. “The Economics of Network”. International Journal of Industrial
Organization, Vol. 14, No. 2.
Elsbach, K.D. 2003. ‘How to pitch a brilliant idea’, Harvard Business Review, 81(9): 117-
123.
Fenton-O’Creevy, M., Lewis, J. & Martin, V. 2001. Templates: investigating performance
and change. Milton Keynes: The Open University Press.

143
Fraser, N., Bernhardt, I., Jewkes, E. and Tajima, M. 2000. Engineering Economics in
Canada. Scarborough, Ontario: Prentice Hall.
Giff, G. 2000. A Conceptual Model for the Financing of Wireless Spatial Data
Infrastructure: A Jamaican Case Study.” Ph.D. Thesis Proposal. Unpublished,
University New Brunswick.
Giff, G. and Coleman, D. 2001. “Financing Spatial Data Infrastructure Development:
Towards Alternative Funding Models.” Proceedings of International Symposium on
SDI, Melbourne Australia.
Giff, G. and Coleman, D. 2002. “Spatial Data Infrastructure Funding Models: A necessity
for the success of SDIs in Emerging Countries.” Proceedings of XXII FIG
International Congress, Washington DC, USA
Gilbert, R.O. 1987. Statistical methods for environmental pollution monitoring. New York:
Van Nostrand Reinhold Company Inc.
Goodman, A.S. and Hastak, M. 2006. Infrastructure planning handbook: planning,
engineering, and economics. New York: McGraw-Hill.
Groot, R. 2001. “Economic Issues in the Evolution of National Geospatial Data
Infrastructure.” 7th United Nations Regional Cartographic Conference for the
Americas, NY, USA
Grove, B. 2004. Development of models for economic evaluation of the integrated
management of the quantity and quality of irrigation water within river catchments.
WRC Report No. 1043/1/04. Pretoria: water Research Commission
Hagler Baily Services, Inc. 1999. Guidelines on using existing economic analysis tools for
evaluating transportation investments. NCHRP Report. Washington, D.C.:
Transportation Research Board, National Research Council.

144
Hanrahan, M. 1998. Enhancing critical analysis in research through reflective writing
[online]. Coldstream: Australian Association for Research in Education Office
Services. Available from: <http://www.aare.edu.au/html>
[Accessed 26 April 2010]
Hazelton, D. 1998. Cost recovery for water schemes to developing urban communities.
WRC Report No. 521/1/98. Pretoria: Water Research Commission.
Hickling Corporation. 1991. Methodologies for evaluating the effects of transportation
policies on the economy. Supplement to NCHRP Report 342. Washington, D.C.:
Transportation Board.
Holloway, A., Hinton, C.M., Mayle, D.T. & Francis, G.A. 1997. ‘Why benchmark?:
Understanding the process of best practice benchmarking’. In: Holloway, A. ed.
Business Process Re-engineering; proceedings of the British Academy of
Management Conference, London, June 2-4, 1997. The Open University Business
School. 271-291.
Hazelton, D. 1998. Cost recovery for water schemes to developing urban communities.
WRC Report No. 521/1/98. Pretoria: Water Research Commission.
Hollingworth, B. 1994. An investigation into the water infrastructure development financial
allocation pathways in municipalities. WRC Report No. K5-1844. Pretoria: Water
Research Commission.
Hosking, P. 2003. Investigating the mechanism and processes used in setting water services
tariffs. WRC Report No. K5/1871/3. Pretoria: Water Research Commission.
Hounslow, A.W. 1995. Water quality data. Boca Raton: Lewis Publishers.
Hussey, J. and Hussey, R. 1997. Business research; a practical guide to undergraduate and
postgraduate students. London: MacMillan.
IIPF (The Institute of International Project Finance). 2001. Project financing in developing
countries [online]. Available from: http://members.aol.com/projectfin/emerging.html.

145
[Accessed 05 February 2011]
Khanyisile Consulting Services CC. 2010. Development of an integrated regulatory
framework for the water sector. Pretoria: Water Research Commission.
Kuiper, E. 1971. Water resources project economics. London: Butterworth and Co
(Publishers) Ltd.
Lang, T. 2006. ‘Documenting research in scientific articles: guidelines for authors’,
CHEST, 130(4): 1263-1268.
Lamb, R.A. 1984. “Creative financing of the infrastructure.” In: Infrastructure
Maintenance and Repair of Public Works. Annals, NY Academy of Science, Vol.
431.
Lang, H.J. and Merino, D.N. 1993. The selection process for capital projects. New York:
John Wiley and Sons.
Lewis, D. 1991. Primer on transportation, productivity and economic development.
Hickling Corporation, NCHRP Report 342. Washington, D.C.: Transportation
Research Board.
Lewis, J. 2001. Literature review in Toolkit 1: investigating performance and change.
Milton-Keynes: Open University.
Mander, M. 2002. Incorporating economic considerations into quantification, allocation
and management of the environmental water reserve. WRC Report No. 978/1/02.
Pretoria: Water Research Commission.
Marah, L. 2004. Effective cost recovery in a changing institutional and policy environment:
Municipal demarcation, the “free basic water” policy and financially sustainable
service delivery. WRC Report No. 1384/1/04. Pretoria: Water Research
Commission.

146
Marah, L. 2003. Identifying examples of successful cost recovery approaches in low income,
urban and peri-urban areas. WRC Report No. 1131/1/03. Pretoria: Water Research
Commission.
Martin, V. 2001. Documenting your work in Toolkit 1: investigating performance and
change. Milton-Keynes: Open University.
Martinez-Asenjo, B. and Frank, U. 2001). “The transformation of NMAs from Government
Departments to Independent Organizations: An Economic Overview”. Proceedings of
the AGILE conference GI in the New Economy, Brno, Czech Republic.
Matthews, W. 2009. The development of an activity based costing model to quantify the real
costs of delivering water services in rural areas. WRC Report No. 1614/1/09.
Pretoria: Water Research Commission.
Mayle, D.T. Hands, C.N. & Hinton, A. 2001. ‘What really goes on in the name of
benchmarking?’, Open University Business School, 17(1): 33-41
Matta, N.F. and Ashkenas, R.N. 2003. ‘Why good projects fail anyway’, Harvard Business
Review, 81(9): 109-114.
Meyer, M. 1985. The little, brown guide to writing research papers. 2nd ed. Glenview:
Scott, Foresman and Company,
South African National Treasury, 1999. Public Finance Management Act. Pretoria:
Government Printer.
South African National Treasury, 2000. South African National Treasury PPP unit [online].
Available from: http://www.treasury.gov.za/organisation/ppp/default.htm.
[Accessed 20 January 2011]
South African National Treasury. 2011a. The Estimates of National Expenditure 201: Vote 3
Cooperative Governance and Traditional Affairs. Pretoria: FormeSet Printers Cape
(Pty) Ltd.
147
South African National Treasury. 2011b. The Estimates of National Expenditure 201: Vote
38 Water Affairs. Pretoria: FormeSet Printers Cape (Pty) Ltd.
South African National Treasury. 2011c. The Division of Revenue Bill. Pretoria:
Government Printer.
Nebert, Douglas (2001). Developing spatial data infrastructures: The SDI Cookbook
[online]. Available from: http://www.gsdi.org/pubs/cookbook/cookbook0515.pdf.
[Accessed 20 February 2011]
Organisation for Economic Cooperation and Development. 2009. OECD Annual Report
2009. Available from: http://www.oecd.com.
[Accessed 28 February 2011]
Oosthuizen, P., Köster, M. and De La Rey, P. 1998. Goodbye MBA: a paradigm shift
towards project management. Johannesburg: International Thomson Publishing
(Southern Africa) (Pty) Ltd.
Open University. 2001. Becoming a practitioner-researcher: study guide for MBA B736.
Milton-Keynes: Open University.
Palmer Development Group. 2004. Economic regulation of water services in SA. WRC
Report No. 138/1/04. Pretoria.
Palmer Development Group. 2004. Guidelines for economic regulation of water services in
SA. WRC Report No. TT229/04. Pretoria: Water Research Commission.
Palmer Development group. 2002. Corporatisation of municipal services providers. WRC
Report No. TT 199/02. Pretoria: Water Research Commission.
Palmer Development Group. 2000. Guidelines for setting water tariffs with a focus on
industrial, commercial & other non-residential consumers. WRC Report No.
992/1/00. Pretoria: Water Research Commission.

148
Palmer Development Group. 1998. Water supply services model manual. WRC Report No.
KV109/98. Pretoria: Water Research Commission.
Park, W.R. and Jackson, D.E. 1984. Cost engineering analysis. 2nd ed. New York: John
Wiley and Sons.
Rajabifard, A. 2002. Diffusion of Regional Spatial Data Infrastructure: with particular
reference to Asia and the pacific. Ph.D. thesis, University of Melbourne.
Rhind, D. 2000. “Funding an NGDI.” In: Groot, R and McLaughlin, J. ed. Geospatial Data
Infrastructure Concepts, Cases and Good Practice. Oxford University Press, New
York, NY. Pp39-55
Rhind, David (2001) “Global, regional and national geographic information policies and
practice in a g-business world. ” Proceedings of the AGILE conference GI in theNew
Economy, Brno, Czech Republic.
Sagar, A. 2006. “Infrastructure and project financing Asia-Pacific scenario.” In: Global
Infrastructure Report of Project Finance International Magazine. Manila: Asian
Development Bank.
South Africa Institution of Civil Engineering. 2011. SACIE infrastructure report card for
South Africa 2011 [online]. Available from: <http://www.saice.org.za /html>
[Accessed 26 March 2011]
Scanlon BR, I Jolly, M Sophocleous and Lu Zhang. 2007. Global impacts of conversions
from natural to agricultural ecosystems on water resources: Quantity versus quality.
Water Resources Research, VOL. 43, 18 PP. Available from:
http://www.agu.org/pubs/crossref/2007/2006WR005486.shtml
[Accessed 10 March 2011)
Still, D. 2003. Cost and tariff model for rural water supply schemes. WRC Report No.
886/1/03. Pretoria: Water Research Commission.
149
Summers, R and Heston, A. 1991 ‘The Penn World Table (Mark 5): an expanded set of
international comparisons, 1950-1988’, Quarterly Journal of Economics, 105(5): 108-
125.
Taylor, P. 2002. ‘Analysing quantitative data’. In: Charlesworth, J., Lewis, J., Martin, V. &
Taylor. P. eds. Toolkit 2: Investigating Performance and Change. Hampshire: The
Open University Press. 20 – 46.
TerreBlanche, M., Durrheim, T. and Painter, D. 2006. Research in practice. Cape Town:
University of Cape Town Press.
Tustin, D.R., Ligthelm, A.A., Martins, J.H. & van Wyk, H. de J. 2005. Marketing research
in Practice. Pretoria: University of South Africa Press.
Tyson, L.D. 2011. ‘A better stimulus plan for the U.S. economy’, Harvard Business Review,
89 (1/2): 53.
United States of America Army Corps of Engineers. 1995. Evaluation of environmental
investments procedures manual – Interim: Cost effectiveness and incremental cost
analysis. IWR Report 95-R-1. Alexandria, VA and Vicksburg, MS: United States
Army Corps of Engineers.
United States of America Inter-Agency Committee on Water Resources. 1950. Proposed
practices for economic analysis of river basin projects. Washington, D.C.: U.S.
Government Printing Office.
United States of America Inter-Agency Committee on Water Resources. 1958. Proposed
practices for economic analysis of river basin projects. Washington, D.C.: U.S.
Government Printing Office.
Urban Logic. 2000. Financing the NSDI: National Spatial Data infrastructure [online]
Available from: http://www.fgdc.gov/whatsnew/whatsnew.html#financing.
[Accessed 10 March 2011]

150
van Vuuren D.S. 2004. Payment strategies & price elasticity of demand for water for
different income groups in three selected urban areas. WRC Report No. 1296/1/04.
Pretoria: Water Research Commission.
van Vuuren, D.S. 2003. Researching, developing & testing of payment strategies for the
lower income groups at four selected communities in order to manage charges for
water use. WRC Report No. 202/1/03. Pretoria: Water Research Commission.
Vawda, M., King, N. and Muller, M. 2011. ‘Pricing of water for cost recovery, economic
efficiency and social equity’. In: Schreiner, B and Hassan, R. ed. Transforming
water management in South Africa: Designing and implementing a new policy
framework. Dordrecht: Springer.
Vawda, M. 2008. Proposed tariffs for the use of DWAF water resources for small scale
hydropower generation with a capacity of not greater than 20 MW. Pretoria.
Veck, G.A. 2000. Estimation of residential price elasticity of demand for water by means of
a contingent valuation approach. WRC Report No. 790/1/00. Pretoria: Water
Research Commission.
Winter, D. Research impact assessment of the water administration system. WRC Report
No. TT 447/09. Pretoria: Water Research Commission.
World Bank. 2010. Africa’s infrastructure: A time for transformation. Washington, DC
World Bank.
World Bank. 1994. World Bank Development Report: Infrastructure for development. New
York, NY: Oxford University Press.
Yevdokimov. Y. 2000. The economics of information networks. Department of Economics,
University New Brunswick.

151
APPENDICES
Appendix 1: Possible future large-scale water resource developments, primarily for domestic, urban, industrial or mining purposes
WMA Name of dam site / scheme 4 River Province Use Possible
completion
date
Estimated
yield or
increase in
yield 5
(mill m3/a)
Comments
4 Raising of Flag Boshielo Dam Olifants Mpumalanga Mining, urban, industrial in Olifants and Limpopo WMAs
2005 16 Complete
4 Dam at De Hoop Steelpoort Mpumalanga Mining, domestic (urban and rural)
2010 90 6 Under Construction – due for completion 2012
4 Dam at Rooipoort Olifants Limpopo Mining, domestic (urban and rural)
2010 45 6 Delayed because of delayed development of mines in area
5 Dam at Mountain View Kaap Mpumalanga Domestic, irrigation 2012 64 Reconnaissance Study completed
5 Dam at Boekenhoutrand Komati Mpumalanga Power generation, irrigation 2012 50 Dropped - Required yield provided by VREASAP project
7 Dam at Springgrove and aqueduct
Mooi KwaZulu-Natal Transfer to Umgeni system. Urban, industrial.
2010 88 Due for completion 2014.
8 Klip River Dam Klip River Free State / Mpumalanga
Urban, industrial, power generation on the Eastern
Highveld
2009 50 Dropped - Required yield provided by VREASAP project
11 Dam at ISithundu Mvoti KwaZulu-Natal Multi-purpose 2011 47 Raising of Hazelmere Dam will provide for this demand
19 Berg River Project Berg Western Cape Urban, industrial 2008 81 Completed in 2008.
19 Voëlvlei Dam Augmentation Berg Western Cape Urban, industrial 2015 30 Investigation to be completed in 2011
19 Table Mountain Group Aquifer
Berg and Breede
Western Cape Urban, industrial 2016 70 Investigation to be completed in 2011
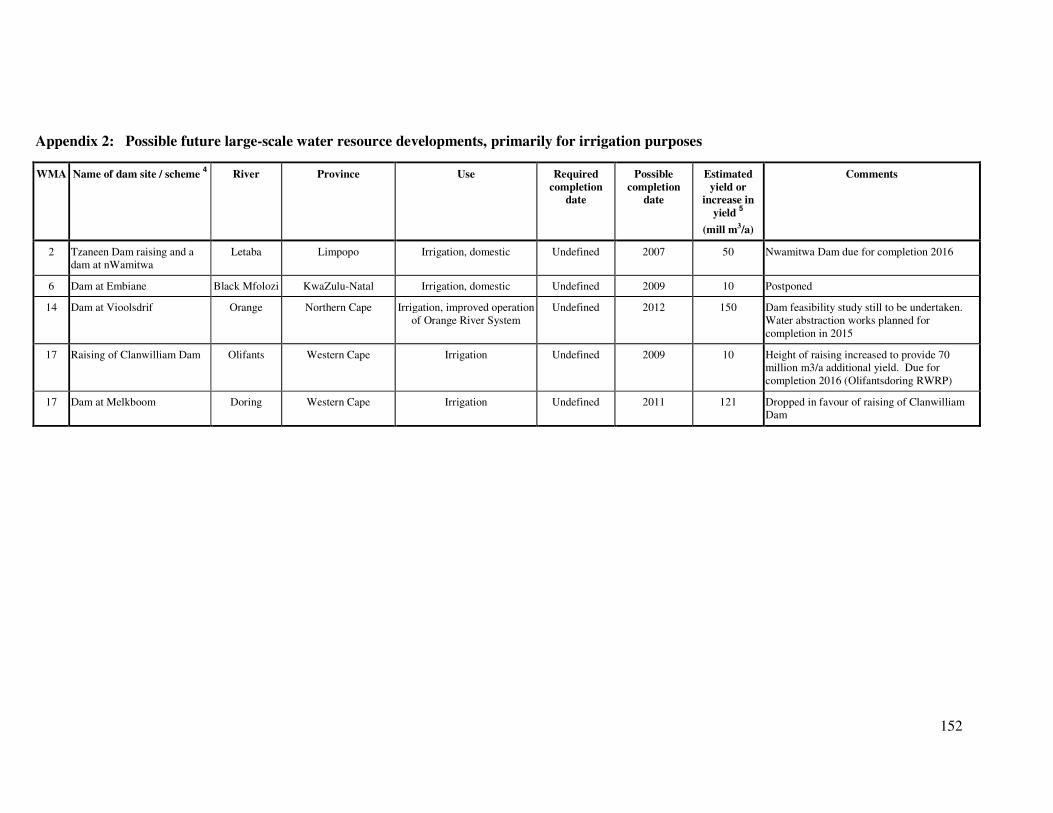
152
Appendix 2: Possible future large-scale water resource developments, primarily for irrigation purposes
WMA Name of dam site / scheme 4 River Province Use Required
completion
date
Possible
completion
date
Estimated
yield or
increase in
yield 5
(mill m3/a)
Comments
2 Tzaneen Dam raising and a dam at nWamitwa
Letaba Limpopo Irrigation, domestic Undefined 2007 50 Nwamitwa Dam due for completion 2016
6 Dam at Embiane Black Mfolozi KwaZulu-Natal Irrigation, domestic Undefined 2009 10 Postponed
14 Dam at Vioolsdrif Orange Northern Cape Irrigation, improved operation of Orange River System
Undefined 2012 150 Dam feasibility study still to be undertaken. Water abstraction works planned for completion in 2015
17 Raising of Clanwilliam Dam Olifants Western Cape Irrigation Undefined 2009 10 Height of raising increased to provide 70 million m3/a additional yield. Due for completion 2016 (Olifantsdoring RWRP)
17 Dam at Melkboom Doring Western Cape Irrigation Undefined 2011 121 Dropped in favour of raising of Clanwilliam Dam

153
APPENDIX 3: Questionnaire for the collection data for the development of funding
model for water infrastructure
1. General
1. Does South Africa need alternative finance and economic analyses and models for the
implementation of mega water resources infrastructure development projects?
Yes; No
Reasons:
___________________________________________________________________________
___________________________________________________________________________
___________________________________________________________________________
___________________________________________
2. What kind or types of funding models for development of water resources
infrastructure projects does South Africa need?
Type of funding model: ________________________________________________
Reasons:
___________________________________________________________________________
___________________________________________________________________________
___________________________________________________
3. Would South Africa benefit socially and economically from such a new approach in
financing of infrastructure projects?
Social benefits:
_____________________________________________________________________
_________________________________________________________________
Economic benefits:
___________________________________________________________________________
___________________________________________________________
4. What are the advantages and/or disadvantages for the country in adopting such a new
approach?
Advantages: Yes/No
Reasons:

154
___________________________________________________________________________
___________________________________________________________
5. Why are the old methods of funding not relevant any more, and where are the
shortcomings?
Shortcomings of old methods: Yes/No
Types of shortcomings:
_____________________________________________________________________
___________________________________________________________________________
_________________________________________________________
6. How have other countries overcome this obstacle and how/what was done to stabilize
the situation to move forward?
Comparisons and benchmarking:
_____________________________________________________________________
___________________________________________________________________________
___________________________________________________________________________
_____________________________________________________
7. What credible funding institutions can be approached?
Types of credible funding:
___________________________________________________________________________
___________________________________________________________
8. What are risks and liabilities associated with the new approach?
Risks:
___________________________________________________________________________
___________________________________________________________
Liabilities:
___________________________________________________________________________
___________________________________________________________
9. What will be the impact for the pricing of a basic commodity such as water and what
will be the social consequences?

155
___________________________________________________________________________
___________________________________________________________________________
___________________________________________________
2. National funding
2.1 Funding Process
1) Please briefly describe your organization’s involvement in planning and/or funding water
and sewer projects.
2) Briefly describe the steps in a typical funding process. What impediments have you
observed in this process?
3) How are the country’s needs typically communicated to funding agencies, so they can
decide which water infrastructure to fund?
4) What major factors do you think typically play a role consider when deciding which
funding sources (including different public funding programs and private sources) to use?
5) What reasons might your organization or your own recommendation on multiple funding
sources? How typical is it to make such a recommendation?
6) What methods of coordination (informal discussion, written agreements, joint funding,
regional planning, etc.) are needed among stakeholders in the funding process?
2.2 Planning and co-ordination at National -level for funding
7) Please describe any specific times when more coordination would have benefited those
involved?
8) What value do you think a well-prepared CIP and/or Water Supply Plan provide for the
funding process?
9) Why do you think the current amount of financial planning for funding of water
infrastructure among stakeholders is sufficient/insufficient to sustainably fund W/S
infrastructure in South Africa?

156
10) What specific financial planning activities do you think is needed during the funding
process?
11) Do you have any suggestions for ways that funding agencies (individually or in
coordination with other agencies) can promote better financial planning at the local or
national level for water infrastructure funding?
2.3 Organizational Structure & Extent of Services
12) Are there any organizations that you think should work closely with the DWA and its
institutions to help it carry out its mandate or mission in terms of funding of water
infrastructure?
13) Do you have any opinions about how the DWA should carry out its tasks in terms of
funding of water infrastructure? For example, should the DWA have any committees and/or
subcommittees, should it have its own staff, or should it rely on existing services from its
institutions?
14) DWA is involved in prioritizing projects for funding, what criteria for prioritization
would you like to see used?
15) A list of eleven nationwide funding and coordination services are provided that could be
used at some point in the future. Tell if you Strongly Agree (SA), Agree (A), are Neutral (N),
Disagree (D), or Strongly Disagree (SD) with the provision of each of these services.
SA, A, N, D, SD
a. ____Compiling a single national database of community W/S needs
b. ____Compiling a national summary of funder eligibility requirements
c. ____Long-term planning (i.e. national level)
d. ____Actively promote regionalization of utilities
e. ____Planning assistance for local sphere of government
f. ____Maintain updated and accessible central information indicating which communities
have secured funding, which ones are currently applying to specific funders, and how much
funding each agency has available for the current funding cycle
g. ____Hold informational conferences, workshops or indabas on the funding of water
infrastruture
157
h. ____ Develop a single application for funding from multiple funders
i. ____Sell debt
j. ____Work with existing funders to “leverage” their funds (i.e. Bonds backed by existing
appropriations)
k. ____Make recommendations to funders about which water infrastructure projects should
receive funding and when they should receive it
16) Of the activities named, are there one or two that you think would provide a substantial
benefit or cost to water infrastructure? Please elaborate.
17) Of the activities named, are there one or two that you think would be especially difficult
to implement, and why?
18) Are there any other services that you think should be provided on a national coordinated
basis?
2.4 How Much Coordination?
The final section of this interview will ask you some additional questions about potential
national coordination with regard to W/S infrastructure projects. States throughout the
country have very different coordination models. Consider the following two scenarios for
statewide coordination:
I.) Formal Directive Role (similar to Arkansas model)
The DWA or a similar organization has the power to pool all applications and
disburse grant and/or loan money according to a triage system based on criteria
such as needs, project feasibility, regional benefits, etc.?
II.) Informal Coordination Role (similar to Ohio model)
The DWA facilitates informal discussion and coordination between and among the
funders, applicants, and other stakeholders.
19) Which scenario do you think would best accomplish the country’s objective to
“maximize the use of current funding resources?” Please describe your reasons
why or discuss a middle ground that would be preferable.
20) Do you think a state-level body should play a role in the coordination of non-traditional
infrastructure funding, such as land preservation to preserve water
158
quality?
21) Do you think statewide coordination could help maximize the use of current funding
resources distributed across the State? Why or why not?
22) Do you think statewide coordination could help distribute money more fairly to
communities (rural and urban) across the State? Why or why not?
23) Do you have any additional comments with regard to coordinated funding for water
infrastructure in South Africa?

159
Appendix 4: Models and Definitions of Generic Range of Non-traditional Delivery
1. Operations and Maintenance
• Operations and maintenance by contract
• Public sector continues to own the asset
2. Design-Build
• Construction by contract
• Contract can include construction financing, land, etc.
3. Turnkey Operations
• Public sector finances the project
• Private sector design-build-operate
• Performance-based objectives drive the contract
• Public sector maintains ownership for the duration of the contract
4. Wrap-around Addition
• Private sector builds and finances an addition
• Private sector operates total asset for a period of time, or until an adequate
return on investment is achieved
• Public sector maintains ownership
5. Lease-Purchase
• Private sector designs, builds, owns and finances the facility
• Leases the facility back to the public sector
• Public sector operates the facility
• Public gains ownership at the end of the lease period
6. Temporary Privatization
• Ownership of an existing facility is transferred to the private partner who
improves/expands the facility
• Facility is owned and operated by the private partner for a defined period of
time, or until there is a reasonable return

160
• Ownership reverts to the public at the end of the period
• Lease-Develop Operate or Buy-Develop-Operate
• Private sector purchases or leases the asset
• Private sector expands or modernizes the asset
• Private sector operates the asset under contract (which pays back acquisition
cost)
• Ownership reverts to the public sector after a defined period of time
7. Build-Transfer-Operate
• Public sector contracts with the private sector for them to build and finance the
facility
• On completion, ownership is transferred to the public sector (at no cost)
• The facility is leased back to the private sector
• The private sector operates the asset for a defined period of time at a fee to
also recover its lease obligations and other costs
8. Build-Own-Operate-Transfer
• The private sector obtains an exclusive franchise (or concession) for the
service
• The private sector builds and finances the assets required to fulfill the
franchise obligations
• The private sector operates the asset for a fee (or user fees)
• The asset is transferred to the public sector at the end of the franchise period
9. Build-Own-Operate
• The private sector gains ownership of an existing asset or builds new
• The private sector operates in perpetuity
10. Swiss Challenge
• Government department or agency requests bidder qualifications for a project
and based on these submissions, selects an interim partner with which to
develop preliminary business plan, program of requirements, preliminary
engineering designs, etc.

161
• Document summarizing these initial efforts is open to competitive bidding for
defined period (with appropriate bid bonds to maintain discipline of process).
• Government then has option to choose another bidder and pay initial partner
for efforts to date, or proceed with original partner.

162
Appendix 5: Standardised assumptions for the calculations of unit reference values
(URV) or marginal cost for water infrastructure projects (after Basson, 2010)
Various assumptions have to be made to ensure the uniformity of assessments and
compatibility of results and findings, with respect to the different water infrastructure
development and augmentation options and also for operations and maintenance. Many of the
assumptions were necessitated by the different levels of detail to which water infrastructure
options have been investigated as well as the non-uniformity of some of the approaches used.
Greater standardisation needs to be introduced in future. Distinction is made between general
assumptions that apply to all the options, and assumptions that are specific to particular
options. A summary of the more important general assumptions is given below.
Main general assumptions:
• All the unit reference values (URVs) are representative of raw water. Where potable
water would result from a process, such as the desalination of seawater, the normal
raw water to potable water treatment cost was subtracted to reflect the raw water
equivalent.
• All energy costs were priced at a representative marginal cost for electricity. It was
assumed that all new generation until 2019 would be from coal-fired power stations at
60 cents per kWh. From 2020 onwards half of the new generating capacity would be
from nuclear power at R1.20 per kWh, with a resultant average marginal rate of 90
cents per kWh.
• Provisions of between 2% and 15% were made for distribution costs, dependent on
the location of the power station(s) relative to the point of supply.
• All costs (capital, energy, operation and maintenance) must be for x-year money
values. VAT is excluded as it is not relevant from a national economic perspective.
• URVs are calculated for raw water to be delivered in bulk at representative locations.
No clean water distribution costs are to be included.
• The URVs with respect to WC/WDM for all areas/systems are to be assumed to be
the same, for which the comprehensive information must be made available.
Other assumptions pertaining to the URV calculations include:
• construction of developments during x to y-year, to be finished in y-year;
• water delivery (sales) to commence in z-year;

163
all water volumes delivered based on growth in water requirements from z-year
onwards (i.e. no deficit or surpluses up to y-year considered - see Appendix 1 and 2
for more information), and taking scheme capacity into account;
• discount rate of 8% over 30 years of water delivery, with no residual value; and where
specific parameters were not given with respect to maintenance costs, standard
parameters were assumed;
• All new water resource developments must fully comply to the release of ecological
water requirements (EWR);
• The implementation of water releases for the EWR from existing dams is assumed to
be phased in over a 5-year period, starting when new water resource developments on
the same system are commissioned; and
Although unlimited quantities of seawater can theoretically be abstracted, assumptions were
made with respect to practical sizes of schemes for the respective areas.
Top Related