


Languages
Pages
Legal


From the Trenches –
Using Learning Analytics
(& other things)
A Story
by
Roz Havenga
1

SAAIR -Yesterday, Today and Tomorrow
(Past, Present and Future)
• Chapter 1: The Past – Microscopic Focus
– Prior to July 2010.
• Chapter 2: The Present – Periscopic View
– July 2010 to September 2014
• Chapter 3: The Future – Satellite Scan
– 1 October 2014 …
2

Bunkers or Trenches?
3

CHAPTER 1 - THE PAST
– Prior to JULY 2010
– Microscopic Focus
4
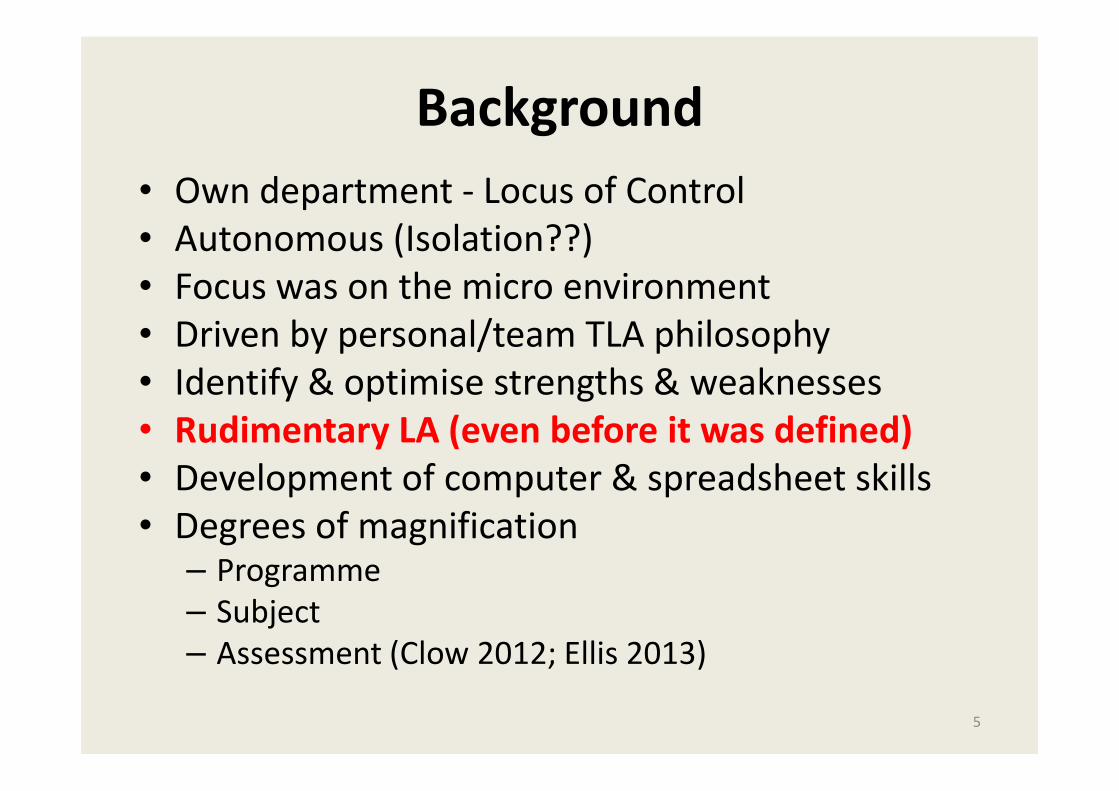
Background
• Own department - Locus of Control
• Autonomous (Isolation??)
• Focus was on the micro environment
• Driven by personal/team TLA philosophy
• Identify & optimise strengths & weaknesses
• Rudimentary LA (even before it was defined)
• Development of computer & spreadsheet skills
• Degrees of magnification – Programme
– Subject
– Assessment (Clow 2012; Ellis 2013)
5

Programme Level Monitoring
6
# Student no Surname First Name Subject 1 Subject 2 Subject 3 Subject 4
30% 30% 20% 20%
0 Control 100 100 100 100
1 72 75 75 74 74
2 69 65 47 64 62
3 64 61 70 78 67
4 81 85 94 73 83
5 63 58 70 85 67
6 69 69 76 77 72
7 52 40 51 46 47
8 60 56 79 53 61
9 65 58 71 66 64
10 61 58 60 65 60
++
High 81 85 94 85
Low 33 20 23 28
Average 60 61 72 59 63
# Registered 29 28 32 34
# Distinctions 1 2 4 3
Pass Rate 83% 79% 94% 74%
# Fail 5 6 2 9
Attendance 83 86 80 79 82

Subject Level Monitoring
7
Student#
Student
Name
Calling
name
Group
# C/work
Final
Test
Mrk Ass 1
Ass 2.1-
WrBP
Ass 2.2
BMC
Ass2.3
Oral
10% 30% 20% 10% 10% 20% Attend 100%
100 100 100 100 100 100 100
1 1 82 63 51 72 60 64 90% 63
2 5 13 92 39 54 60 58 100% 60
3 5 56 50 39 54 60 58 100% 51 Borderline
4 5 62 55 39 54 60 58 90% 54
5 6 35 58 38 35 60 52 80% 49 Borderline
6 1 65 42 51 72 60 64 100% 55
7 5 63 83 39 54 60 58 100% 62
8 6 62 62 47 40 60 52 60% 55
9 6 54 63 47 40 60 52 80% 54
10 3 52 41 48 84 60 77 70% 57
11 4 61 74 63 100 80 73 100% 73 Query distinction?
12 6 49 59 47 40 60 52 70% 52
13 4 80 100 63 100 80 73 60% 83 Distinction
14 7 35 31 0 19 50 49 70% 29 Fail
55 62 44 58 62 60 85 57
WEIGHTING
CONTROL
Average

Assessment Level Monitoring
8
5
Student#
Student
Name
Calling
name Pg1 Pg2 Total Pg3 Pg4.1 Total Pg4.2 Pg5 Total Pg6 Pg6 Pg6 Pg7 Pg8 Total Total %
CONTROL 15 15 30 15 10 25 10 25 35 30 Wrong 30 15 5 20 140 100
1 10.5 14 24.5 15 9 24 8 24 32 22 7 20 14 8 22 122.5 88%
2 11 15 26 13 9.5 22.5 3.5 20 23.5 19 11 13 12 1 13 98 70%
3 5 15 20 14 8 22 4 11 15 26 4 27 6 0 6 90 64%
4 12.5 13 25.5 13 1.5 14.5 3 14.5 17.5 20 10 15 3 0 3 75.5 54%
5 7.5 12 19.5 16 2.5 18.5 2 9.5 11.5 20 10 15 11 0 11 75.5 54%
6 8.5 4.5 13 6.5 1.5 8 4 29 33 22 8 19 5 0 5 78 56%
7 5.5 20 25.5 9.5 8 17.5 6 7.5 13.5 19 11 13 8 0 8 77.5 55%
8 2.5 9 11.5 13 9 22 1.5 17 18.5 16 10 11 7 0 7 70 50%
9 7 12 19 1.5 0 1.5 2.5 0 2.5 27 3 29 3 1 4 56 40%
10 6 9 15 13.5 1.5 15 0 9.5 9.5 18 12 11 4 1 5 55.5 40%
Average 8 12 20 12 5 17 3 14 18 21 9 17 7 1 8 80 57%
% 51% 82% 67% 77% 51% 66% 35% 57% 50% 70% 58% 49% 22% 42% 57%
Extra QT/FMarketing FinanceGeneral

Assessor Rating
- Calibration, Staff and Student Development
9
Group#
Pres
Assessor
1
Pres
Assessor
2
Pres
Assessor
3
Pres
Assessor
4
Present
ation
CONTROL 100
1 3 76 70 78 77 75
2 4 73 68 73 75 72
3 1 64 60 68 61 63
4 2 64 55 68 61 62
5 5 53 52 66 51 56
6 6 50 49 59 50 52
7 7 47 45 52 51 49
Average 61 57 66 61 61

Our Principles
• Integrated spreadsheets
• Year-on-year comparisons.
• Cohort control – admittance, reregistration, grad
• Discussion between staff - teamwork.
• Data captured as close to event as possible.
• Real-Time information and action.
10

Challenges
• Accuracy dependent on the skill of the user – Error rate higher.
• Spreadsheet skills relatively uncommon.
• Frustration with an “off the grid” spreadsheet system and the
lack of integration.
• Visual representation of data on graphs is labour intensive.
• Data re-entry from spreadsheet to ITS – inefficient task
duplication.
• Adoption of learning analytics is based in educational theory -
teaching and learning paradigms would also have to be shared.
• Collection, analysis & action relating to the data is time
consuming
• Recording & reporting suffered – lost of highly beneficial
findings. 11

Benefits• For Students:
– Early warning of at-risk or top performance
– Feeling valued - one-on-one interviews
– Could project performance required (What-if analysis)
– Given “career guidance” with evidence
– Lay counselling and Student Counselling referrals (sub-unit of
programme!)
• For us:
– reallocation of resources such as:
• best lecturer for the task,
• assessment refinement,
• assessor rating skills verification and development.
– Curriculum management – syllabi, time allocations, timing
– Tracking an individual student from entrance test to graduation.
– Optimised registration packages – timetable management 12

Transition 1 - Mid 2010
13

CHAPTER 2 - THE PRESENT
– JULY 2010 to SEPTEMBER 2014
– Periscopic View
14

Significant Events / Observations • Change in the profile of the QPO
• New Institutional Quality Policy -> new Annual Quality Monitoring Requirement
• Performance data neither used significantly nor fully understood by programme managers.
• No locus of Control – Adopted “Encouragement”
• Ambits with diverse approaches – shared good practice
• Focus on the market environment
• Driven by Management & Administrative Principles
• Implementation of Performance Indicators (now Academic Analytics)
15

LA AA BI AA LA
16
Business Intelligence
Academic Analytics
Learning Analytics

Principles
• Needed a framework and a plan
• Driver - Strategy vs Operations
• Each programme as a “Small Business”
• Effective and efficient
• Need for standardised systems and structure
– Not rigid
– Not compulsory
– Optimised use of critical resources (time & skill)
17

Step 1 - “Find and File”.
• Systematic approach to departmental organisation.
• Locate Performance indicators within appropriate area of departmental management – Master plans - Strategy, Quality, Programme Management,
– Management functions - Marketing, Staffing, Finance, and Infrastructure
– Academic areas - Teaching, Research
• Alignment of the Annual Performance Report and the departmental filing system guidelines
• Major housekeeping exercise in each department –usually only appreciated after the event
• A picture emerges!
18
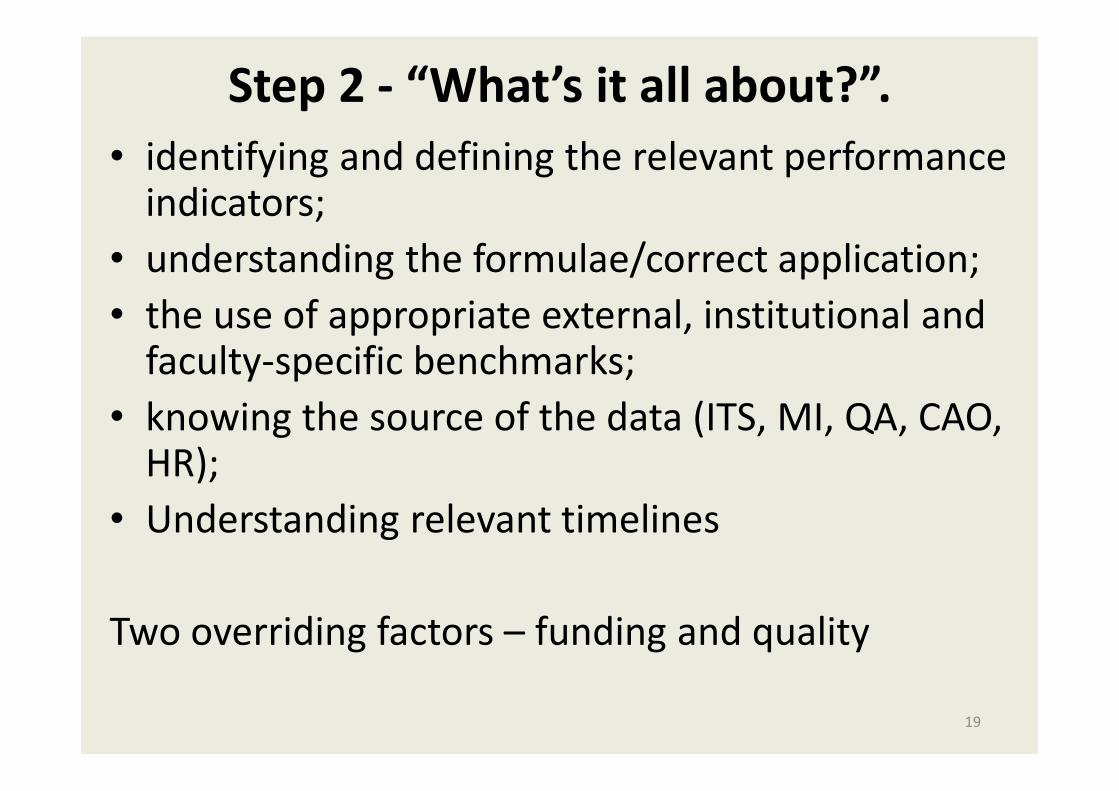
Step 2 - “What’s it all about?”.
• identifying and defining the relevant performance indicators;
• understanding the formulae/correct application;
• the use of appropriate external, institutional and faculty-specific benchmarks;
• knowing the source of the data (ITS, MI, QA, CAO, HR);
• Understanding relevant timelines
Two overriding factors – funding and quality
19

Performance Data (1)
The Big 5
• Enrolment Plan - First time and Other registrations – actual
versus planned.
• Headcount - Gender / Race
• Throughput and Dropout Rates
• Graduation Rates
• Programme and Faculty Success rates
– Individual subject pass rates
– most challenging indicator to monitor at lecturer level.
– DHET benchmark = 80% success rate
– Implementation of Learning Analytics!
20
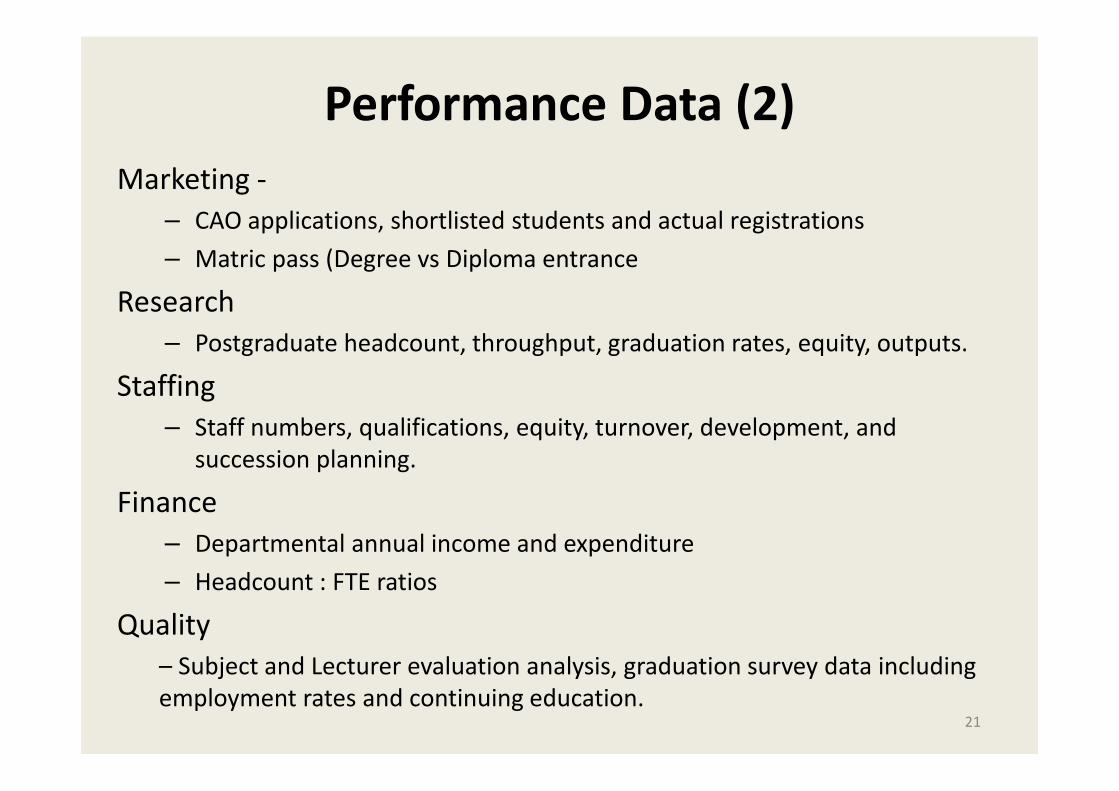
Performance Data (2)
Marketing -
– CAO applications, shortlisted students and actual registrations
– Matric pass (Degree vs Diploma entrance
Research
– Postgraduate headcount, throughput, graduation rates, equity, outputs.
Staffing
– Staff numbers, qualifications, equity, turnover, development, and
succession planning.
Finance
– Departmental annual income and expenditure
– Headcount : FTE ratios
Quality
– Subject and Lecturer evaluation analysis, graduation survey data including
employment rates and continuing education.21

Step 3 - “How do we…?” (1)
• Analyse AA results and identify possible contributing factors
that will require further analysis – becoming drivers for LA.
• Success dependent on:
– the depth of understanding gained in step two
– sound technology & analytical skills
– academic & managerial experience (Trenches and Bunkers)
– interest and aptitude.
• Faculty wide discussion - committees, forums and workshops
common understanding and innovative ideas on student
attendance, assessment, teaching and learning practice.
• Communication in formal & regular departmental committees
– staff meetings
– staff-student meetings and
– advisory board meetings 22

Step 3 - “How do we…?” Observations
• Programmes are distributed randomly across all three of the above stages.
• Time Management – Urgent vs Important!
• Timelines
• Understanding difference between ITS & MI.
• Averaging of data masks critical information.
–eg pass rates in a department with two undergraduate programmes.
• Mutual trust and respect.
23

Step 4 - “We can do it!”
Final (interim??) goal
• Full use of defined benchmarks, drawn at appropriate times, and feeding in to management of subject, programme, department and faculty, is the norm.
• All staff able to use performance indicators (LA & AA) to strategically drive improvement in their ambits.
• Bottom-up approach leading to institutional improvement, happier and more productive staff and students.
No department is fully at this stage yet – due mainly to the lack of time/tools to implement all three previous stages.
24

Observations• Long way to go
• Two major challenges – Finance & Expertise
• Currently in a Report Intensive Era
• Evidence based vs Record of Practice
• Cannot manage what we cannot measure
• Cannot improve if we don’t know where we are (need base-line)
• Need to understand what & why before we can determine how & who.
• Work with what we’ve got!25
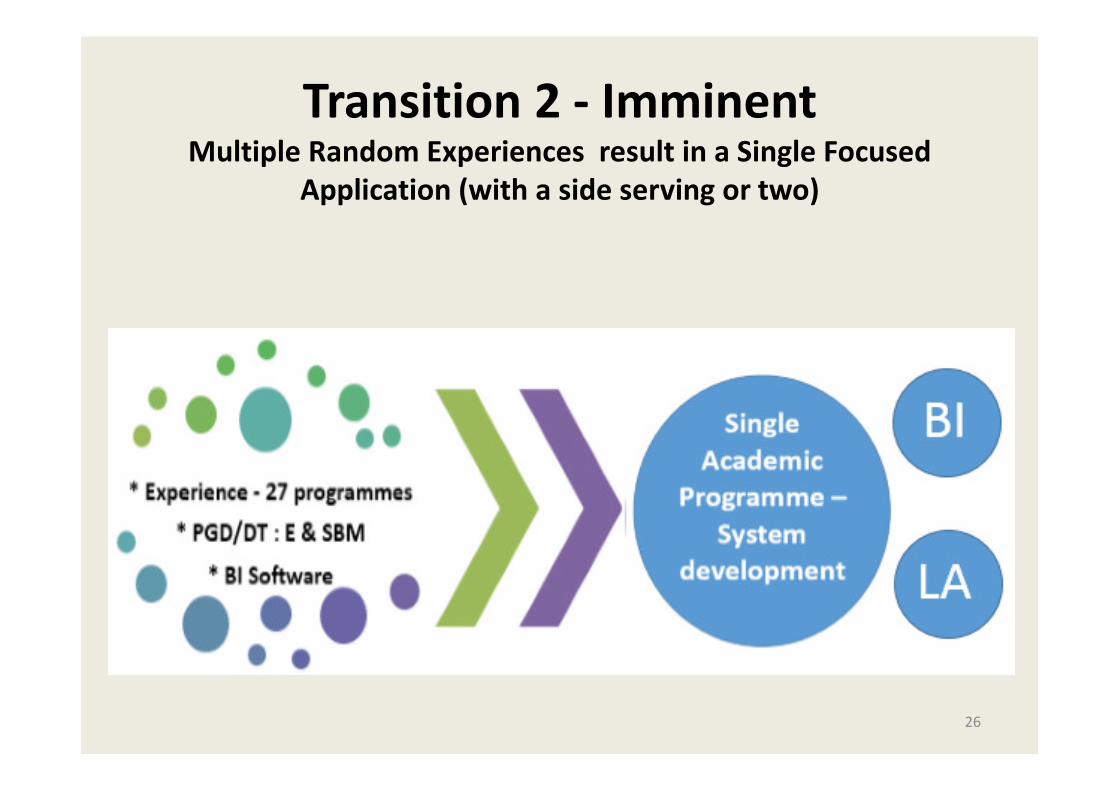
Transition 2 - ImminentMultiple Random Experiences result in a Single Focused
Application (with a side serving or two)
26
CHAPTER 3 THE FUTURE
– SATELLITE SCAN
– OCTOBER 2014 ->…??
27
Crystal Ball Gazing (1)
• Personally (Zoomed satellite)
– Implementation of experience in a single programme
– “Does the theory work in practice?” – a case study to
see if it can be done.
– Adoption of a structured approach to mining data on
learning and programme factors
– Interim mining of Learning Data using spreadsheets,
ITS, Turnitin, BlackBoard.
+ Some side orders – BI & LA
Maybe by SAAIR 2015 I can report on “Can the practice
work in theory” 28
Crystal Ball Gazing (2)
• At institution level (Mid level satellite)
– moving towards incorporation of Learning Analytics into current practice.
– Features in new strategic plan,
– discussions have begun about software tools, and budget & other resources required.
– SAHELA inspired
• The Dream
– An institutionally driven, electronic, multiply integrated dashboard with visually displayed information
– Improved Uptake, Speed and Accuracy . 29
Crystal Ball Gazing (3)
• National & international level (High level satellite)
– Linked Data opportunities
– Learn from early adopters experiences
– Understand and interact with the role players (LAK, LASI,
SAHELA etc)
– Knowledge of various tools and features
30
Final Observations
• Acquisition of any tools is dependent on institutional budget and strategic priorities - out of the parameters of a programme or faculty initiative.
• The best tool will be of little value if the underlying principles are not understood, and if findings are not implemented.
• Need to consider ethics and POPI.
• “Just do it” (Nike & Table 1)31

We have the key – will use it
32

Happy 21st Birthday SAAIR!
33
Top Related