


Languages
Pages
Legal

Gary Hodgkinson Director – Central Asia District Rio Tinto Mining & Exploration Inc. MINEX Astana – 19 March 2015
From Opportunity to Execution – The next steps in Kazakhstan
©2015, Rio Tinto, All Rights Reserved

Cautionary statement This presentation has been prepared by Rio Tinto plc and Rio Tinto Limited (“Rio Tinto”) and consisting of the slides for a presentation concerning Rio Tinto. By reviewing/attending this presentation you agree to be bound by the following conditions. Forward-looking statements This document contains certain forward-looking statements with respect to the financial condition, results of operations and business of the Rio Tinto Group. These statements are forward-looking statements within the meaning of Section 27A of the US Securities Act of 1933, and Section 21E of the US Securities Exchange Act of 1934. The words “intend”, “aim”, “project”, “anticipate”, “estimate”, “plan”, “believes”, “expects”, “may”, “should”, “will”, “target”, “set to” or similar expressions, commonly identify such forward-looking statements.
Examples of forward-looking statements include those regarding estimated ore reserves, anticipated production or construction dates, costs, outputs and productive lives of assets or similar factors. Forward-looking statements involve known and unknown risks, uncertainties, assumptions and other factors set forth in this presentation that are beyond the Rio Tinto Group’s control.
For example, future ore reserves will be based in part on market prices that may vary significantly from current levels. These may materially affect the timing and feasibility of particular developments. Other factors include the ability to produce and transport products profitably, demand for our products, changes to the assumptions regarding the recoverable value of our tangible and intangible assets, the effect of foreign currency exchange rates on market prices and operating costs, and activities by governmental authorities, such as changes in taxation or regulation, and political uncertainty.
In light of these risks, uncertainties and assumptions, actual results could be materially different from projected future results expressed or implied by these forward-looking statements which speak only as to the date of this presentation. Except as required by applicable regulations or by law, the Rio Tinto Group does not undertake any obligation to publicly update or revise any forward-looking statements, whether as a result of new information or future events. The Group cannot guarantee that its forward-looking statements will not differ materially from actual results.
2 ©2015, Rio Tinto, All Rights Reserved
Content
Rio Tinto Context
Present Global Context
Rio Tinto Exploration
Focus on Central Asia
Our Projects
3 ©2015, Rio Tinto, All Rights Reserved
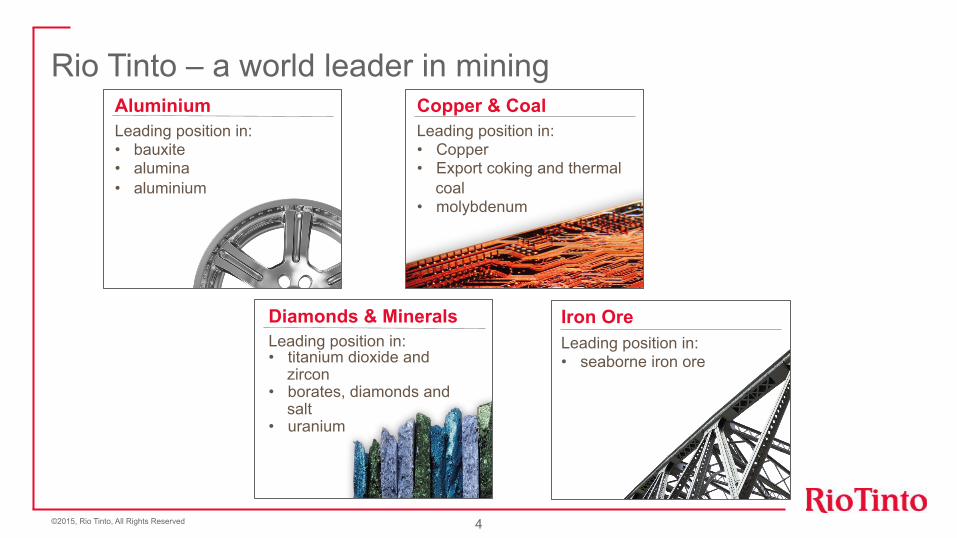
Rio Tinto – a world leader in mining
4 ©2015, Rio Tinto, All Rights Reserved
Aluminium Leading position in: • bauxite • alumina • aluminium
Copper & Coal Leading position in: • Copper • Export coking and thermal
coal • molybdenum
Diamonds & Minerals Leading position in: • titanium dioxide and
zircon • borates, diamonds and
salt • uranium
Iron Ore Leading position in: • seaborne iron ore
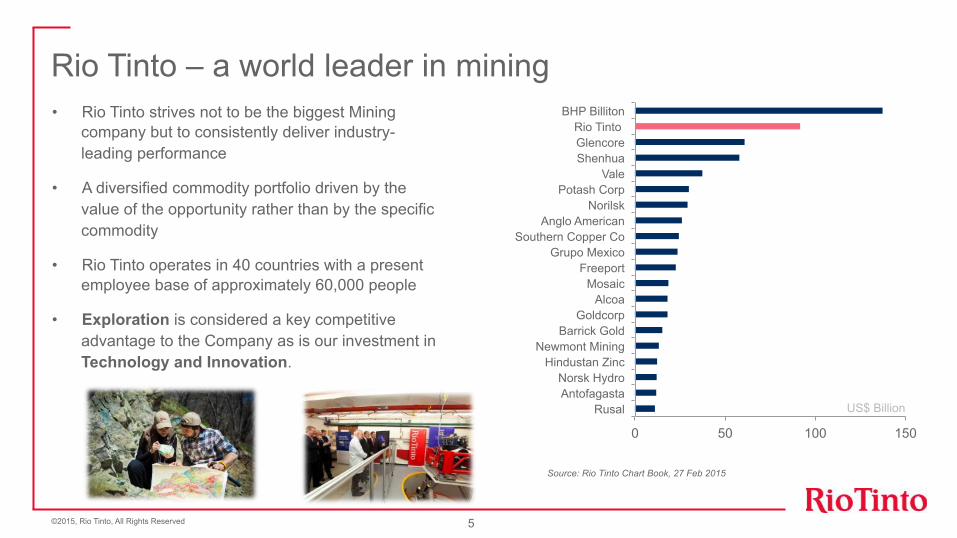
• Rio Tinto strives not to be the biggest Mining company but to consistently deliver industry-leading performance
• A diversified commodity portfolio driven by the value of the opportunity rather than by the specific commodity
• Rio Tinto operates in 40 countries with a present employee base of approximately 60,000 people
• Exploration is considered a key competitive advantage to the Company as is our investment in Technology and Innovation.
5
Rio Tinto – a world leader in mining
Source: Rio Tinto Chart Book, 27 Feb 2015
©2015, Rio Tinto, All Rights Reserved
0 50 100 150
Rusal Antofagasta Norsk Hydro
Hindustan Zinc Newmont Mining
Barrick Gold Goldcorp
Alcoa Mosaic
Freeport Grupo Mexico
Southern Copper Co Anglo American
Norilsk Potash Corp
Vale Shenhua Glencore Rio Tinto
BHP Billiton
US$ Billion
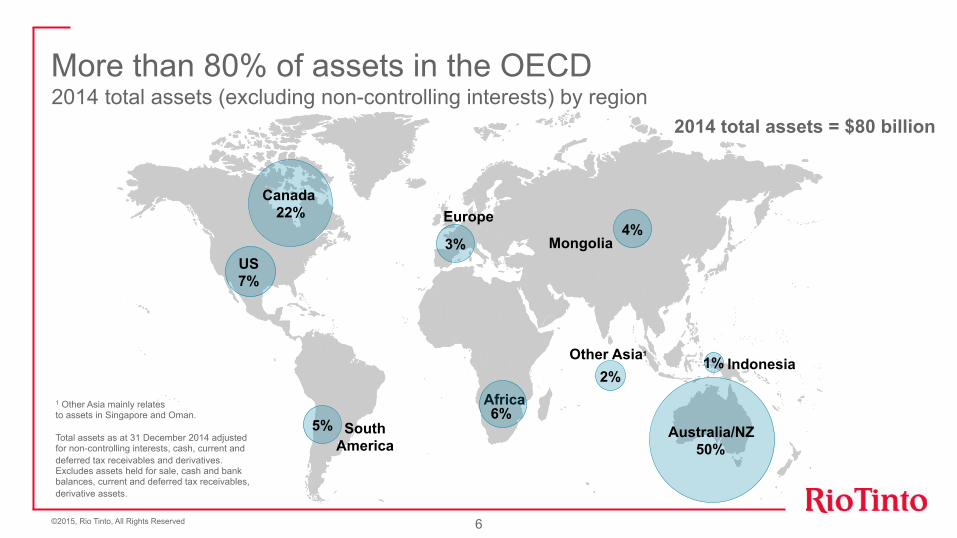
More than 80% of assets in the OECD
6 ©2015, Rio Tinto, All Rights Reserved
2014 total assets (excluding non-controlling interests) by region 2014 total assets = $80 billion
1 Other Asia mainly relates to assets in Singapore and Oman. Total assets as at 31 December 2014 adjusted for non-controlling interests, cash, current and deferred tax receivables and derivatives. Excludes assets held for sale, cash and bank balances, current and deferred tax receivables, derivative assets.
US 7%
Australia/NZ 50%
1% Indonesia
3%
5%
Canada 22%
4% Mongolia
2% Other Asia1
Africa
South America
6%
Europe
0
5000
10000
15000
20000
1900 1920 1940 1960 1980 2000
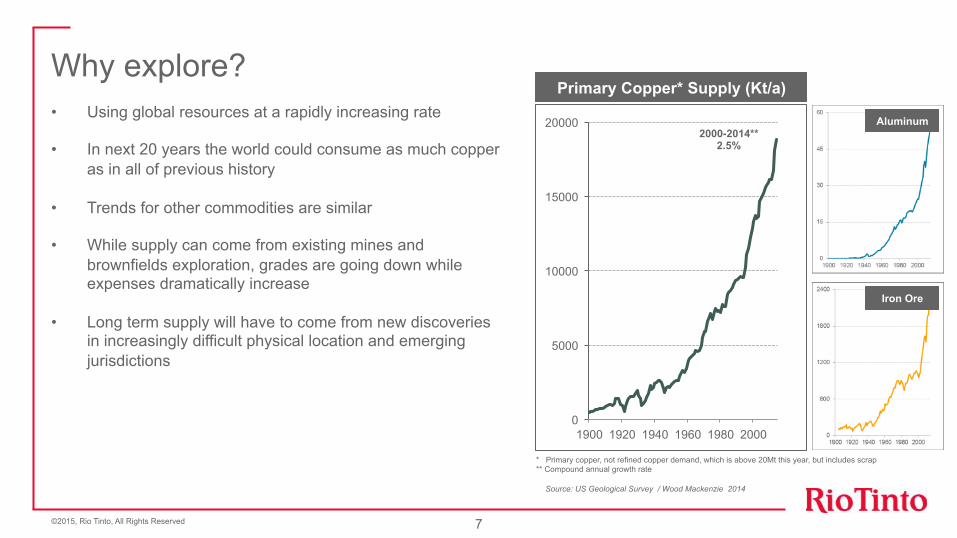
Why explore?
7 ©2015, Rio Tinto, All Rights Reserved
Primary Copper* Supply (Kt/a)
Source: US Geological Survey / Wood Mackenzie 2014
2000-2014** 2.5%
* Primary copper, not refined copper demand, which is above 20Mt this year, but includes scrap ** Compound annual growth rate
Aluminum
Iron Ore
• Using global resources at a rapidly increasing rate
• In next 20 years the world could consume as much copper as in all of previous history
• Trends for other commodities are similar
• While supply can come from existing mines and brownfields exploration, grades are going down while expenses dramatically increase
• Long term supply will have to come from new discoveries in increasingly difficult physical location and emerging jurisdictions
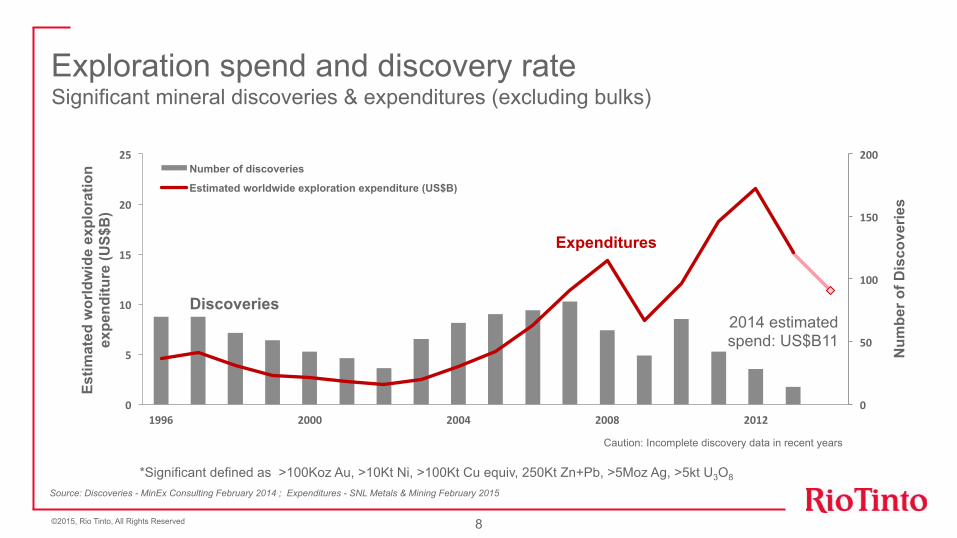
Exploration spend and discovery rate Significant mineral discoveries & expenditures (excluding bulks)
8
Source: Discoveries - MinEx Consulting February 2014 ; Expenditures - SNL Metals & Mining February 2015
*Significant defined as >100Koz Au, >10Kt Ni, >100Kt Cu equiv, 250Kt Zn+Pb, >5Moz Ag, >5kt U3O8
0
50
100
150
200
0
5
10
15
20
25
1996 2000 2004 2008 2012
Number of discoveries
Estimated worldwide exploration expenditure (US$B)
Estim
ated
wor
ldw
ide
expl
orat
ion
expe
nditu
re (U
S$B
)
Discoveries
Expenditures
Num
ber o
f Dis
cove
ries
Caution: Incomplete discovery data in recent years
©2015, Rio Tinto, All Rights Reserved
2014 estimated spend: US$B11
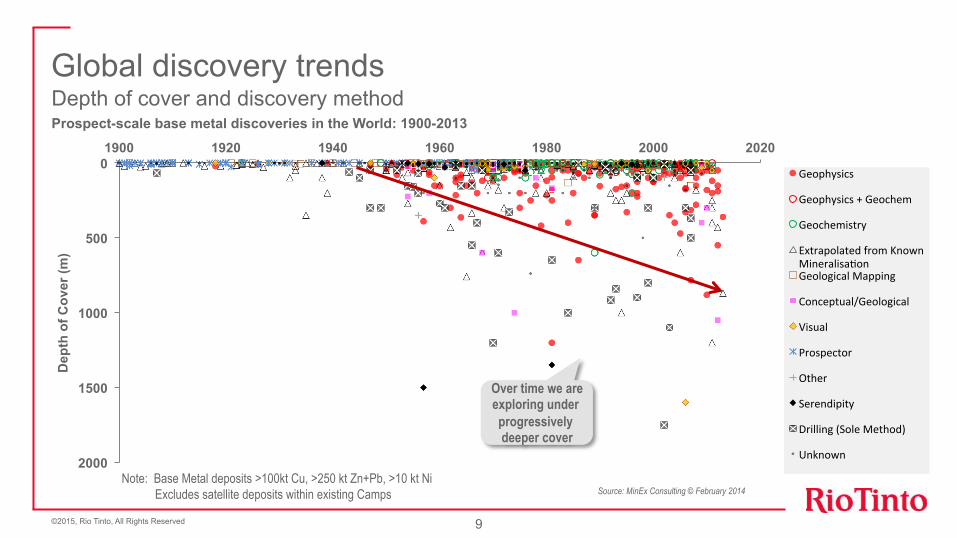
Global discovery trends Depth of cover and discovery method Prospect-scale base metal discoveries in the World: 1900-2013
9 ©2015, Rio Tinto, All Rights Reserved
0
500
1000
1500
2000
1900 1920 1940 1960 1980 2000 2020
Geophysics
Geophysics + Geochem
Geochemistry
Extrapolated from Known Mineralisa9on Geological Mapping
Conceptual/Geological
Visual
Prospector
Other
Serendipity
Drilling (Sole Method)
Unknown
Note: Base Metal deposits >100kt Cu, >250 kt Zn+Pb, >10 kt Ni Excludes satellite deposits within existing Camps Source: MinEx Consulting © February 2014
Over time we are exploring under progressively deeper cover
Dep
th o
f Cov
er (m
)

Aluminium
Copper & Coal
Diamonds & Minerals
Iron Ore
Greenfield projects
Brownfield projects
Rio Tinto Exploration 2015 operational footprint Exploring for 8 different commodities across 18 countries
10 ©2015, Rio Tinto, All Rights Reserved
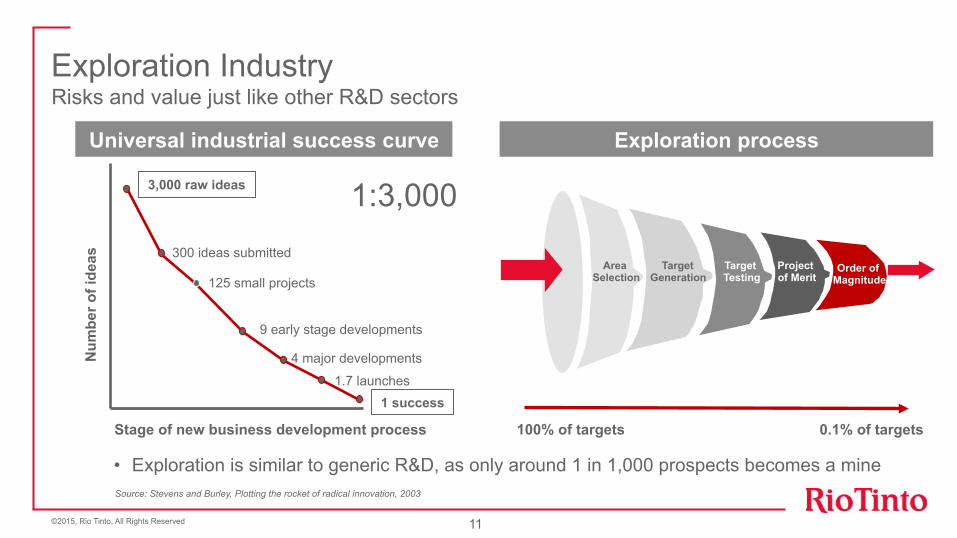
Exploration Industry
11 ©2015, Rio Tinto, All Rights Reserved
Risks and value just like other R&D sectors
Source: Stevens and Burley, Plotting the rocket of radical innovation, 2003
3,000 raw ideas
300 ideas submitted
125 small projects
9 early stage developments
4 major developments
1.7 launches 1 success
Num
ber o
f ide
as
Stage of new business development process 100% of targets 0.1% of targets
Target Generation
Target Testing
Project of Merit
Order of Magnitude
Area Selection
Universal industrial success curve Exploration process
• Exploration is similar to generic R&D, as only around 1 in 1,000 prospects becomes a mine
1:3,000

12 ©2015, Rio Tinto, All Rights Reserved
Exploration Accountability
Target Generation
Target Testing
Project of Merit
Order of Magnitude
Area Selection
Discovery Pre Feasibility Feasibility
Product Group Accountability
100% of targets <0.1% of targets • Exploration on an industry-wide basis is a
high-risk activity
• Success - the creation of value -demands ongoing rigorous testing and prioritisation of opportunities
• Getting the process right requires technical expertise, high-quality management and rigorous prioritisation
Mine & Process
Discovery
Production
0yrs
~10yrs
~25yrs
Value creation is via rigorous opportunity prioritisation
Global Prioritisation
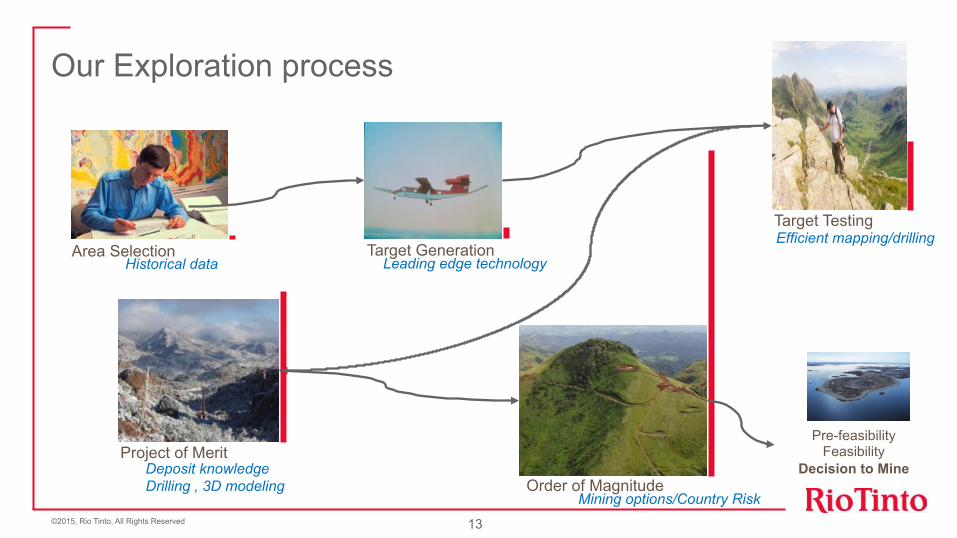
Our Exploration process
Area Selection Historical data
Target Generation Leading edge technology
Target Testing Efficient mapping/drilling
Project of Merit Deposit knowledge Drilling , 3D modeling Order of Magnitude
Mining options/Country Risk
Pre-feasibility Feasibility
Decision to Mine
13 ©2015, Rio Tinto, All Rights Reserved
0 600 km 200 400
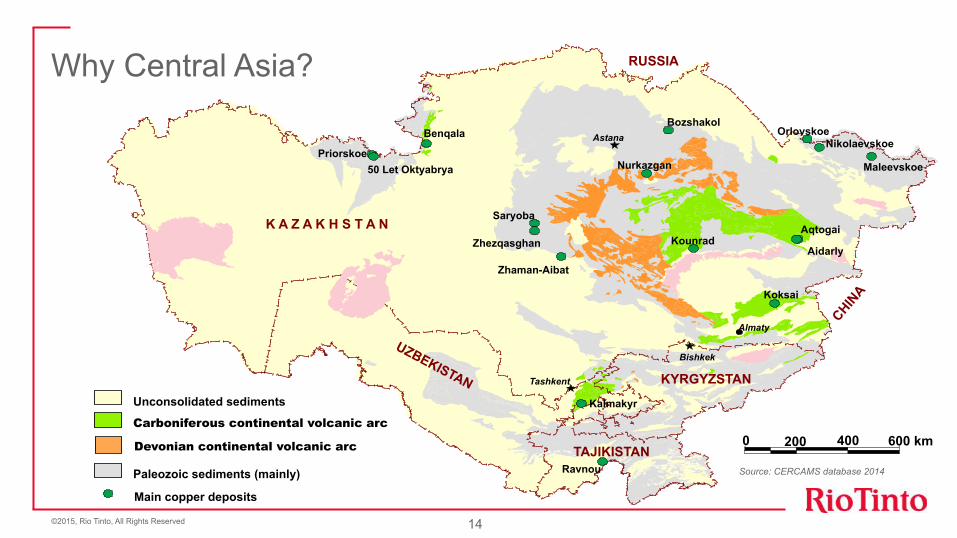
Paleozoic sediments (mainly)
Unconsolidated sediments
Carboniferous continental volcanic arc Devonian continental volcanic arc
Tashkent
Almaty
Astana
Bishkek
Bozshakol
Aqtogai
Koksai
Aidarly Zhezqasghan
Saryoba
Benqala
Zhaman-Aibat
Kalmakyr
Main copper deposits
K A Z A K H S T A N
KYRGYZSTAN
TAJIKISTAN
Kounrad
Nurkazgan
RUSSIA
50 Let Oktyabrya Priorskoe
Orlovskoe Nikolaevskoe
Maleevskoe
Ravnou
Why Central Asia?
14
Source: CERCAMS database 2014
©2015, Rio Tinto, All Rights Reserved

0 600 km 200 400 Paleozoic sediments (mainly)
Unconsolidated sediments
Carboniferous continental volcanic arc Devonian continental volcanic arc
Tashkent
Almaty
Astana
Bishkek
Copper Deposits (Large, Medium, Small) and Occurences
K A Z A K H S T A N
KYRGYZSTAN
TAJIKISTAN
RUSSIA Why Central Asia?
15
Source: CERCAMS database 2014
©2015, Rio Tinto, All Rights Reserved
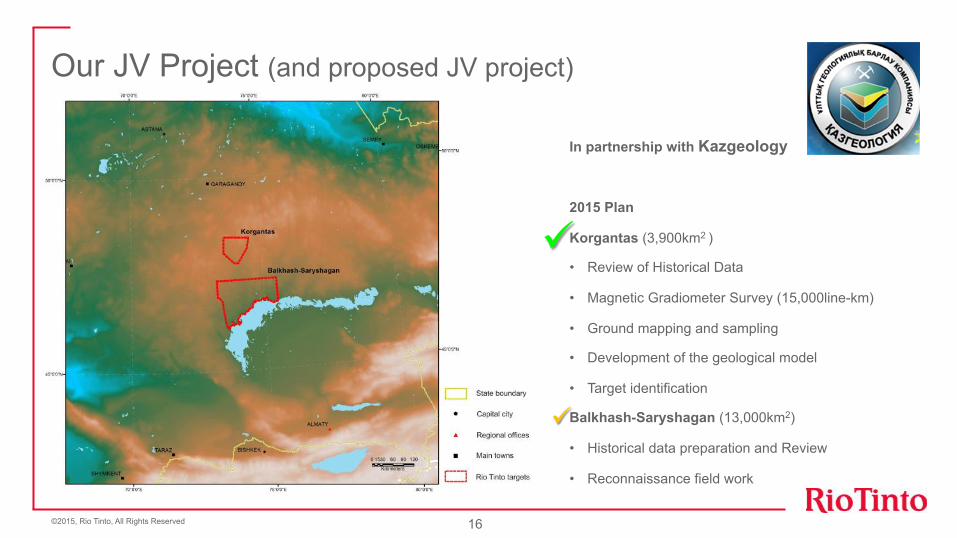
Our JV Project (and proposed JV project)
In partnership with Kazgeology
2015 Plan
Korgantas (3,900km2 )
• Review of Historical Data
• Magnetic Gradiometer Survey (15,000line-km)
• Ground mapping and sampling
• Development of the geological model
• Target identification
Balkhash-Saryshagan (13,000km2)
• Historical data preparation and Review
• Reconnaissance field work
16
ü
ü
©2015, Rio Tinto, All Rights Reserved

• Design of project is results based and therefore will be modified over the 6 year work programme (challenge under present legislation).
• Maximise the value of historical data by digitising all useful information and integrating datasets.
• Apply leading edge technologies to the projects to ensure best quality data acquisition, integration and interpretation.
• As areas are large the objective is to do quality “regional” geological mapping (integrating all datasets) in order to rapidly focus on smaller areas of interest.
• Rigorous prioritisation of areas of interest (on a global basis).
• Move quality areas of interest to target testing stage (additional mapping, detailed geophysics). ~1-2 years.
• Drill test targets. ~1-3 years.
• If positive results are achieved the target will have additional drilling to move to Project of Merit. ~3-5 years.
We will apply a staged approach to Exploration
©2015, Rio Tinto, All Rights Reserved
Our Commitment to Capacity Building
CAPACITY BUILDING TECHNOLOGY TRANSFER
• Training for general exploration team in various disciplines including: • Project management • Copper porphyry geology • Geophysical survey • Geological modeling
• Key Kazgeology staff embedded into exploration project
• Transfer of value-add technologies, processes & techniques including: • GIS and Geochemical database design • Integrated data management • Spectral processing and interpretation
• Planned and executed in alignment with the Balkhash- Saryshagan
exploration project over a 6 year period
©2015, Rio Tinto, All Rights Reserved
Conclusions • Rio Tinto has been actively engaged in developing opportunities in Central Asia since 2010.
• We have achieved a significant milestone by securing a joint venture project with our partners Kazgeology in February 2015 and hope to shortly secure the second project.
• Rio Tinto will work closely with Kazgeology and MID to ensure value added capacity building for Kazakhstan.
• Rio Tinto remains committed to Central Asia as a region with good potential for the discovery of Tier 1 mineral resources but understands the present risks and perceptions of the region.
19 ©2015, Rio Tinto, All Rights Reserved
Top Related