


Languages
Pages
Legal


FRONT RANGE AIR POLLUTION AND PHOTOCHEMISTRY ÉXPERIMENT
http://www2.acd.ucar.edu/frappe http://discover-aq.larc.nasa.gov/
National Center for Atmospheric Research (NCAR-ACD, MMM),
NASA Airborne Science Program
Colorado Department of Public Health and Environment (CDPHE),
Colorado State University (CSU), University of Colorado Boulder (CU),
CU Institute for Arctic and Alpine Research
Environmental Protection Agency (EPA) Region 8,
National Oceanic and Atmospheric Administration (NOAA ESRL),
National Park Service (NPS), Regional Air Quality Council (RAQC),
Storm Peak Laboratory (DRI), UC Berkeley, U of Wisconsin,
U of Maryland, U of Cincinnati, Georgia Tech, UC Riverside, Aerodyne Inc.

Air Quality – a solved problem?

Not really…
Average number of days (%) during May-Sep 1995-2000 and 2005-2010
when the 8-hour ozone NAAQS of 75 ppbV was exceeded.
(EPA Monitoring Network)
“Emission controls in the U.S. have lead to significant reductions in air pollution, but many regions in the country still experience levels
of pollutants above national health standards ”
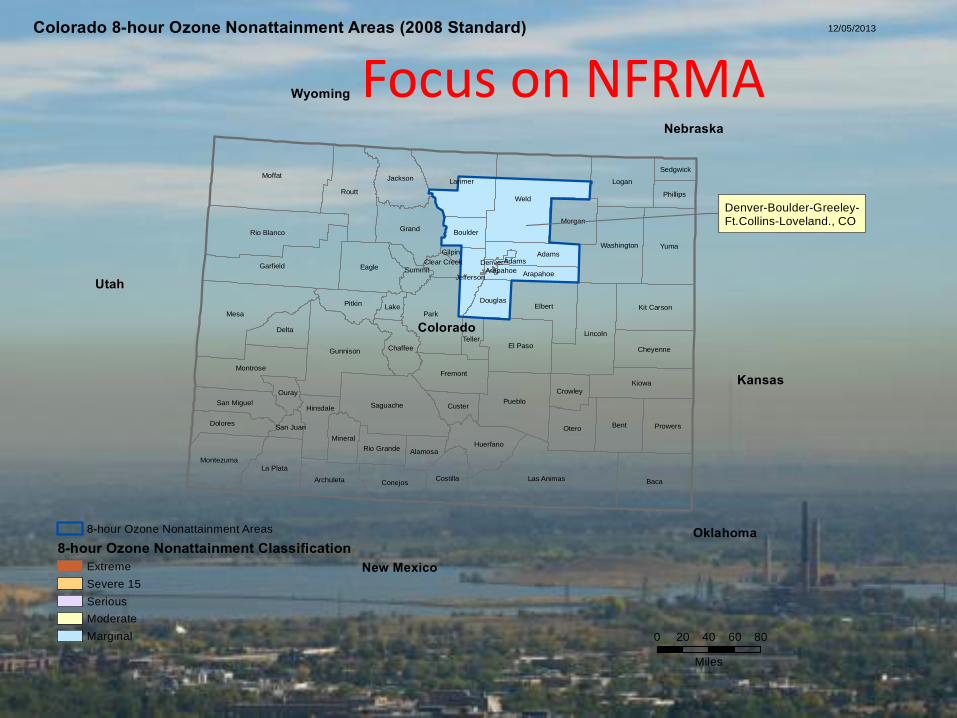
Focus on NFRMA
Colorado
Utah
Wyoming
New Mexico
Kansas
Nebraska
Oklahoma
Weld
Moffat
Mesa
Baca
Park
Routt
Yuma
Las Animas
Garfield
Lincoln
Larimer
Pueblo
Gunnison
Bent
Elbert
Saguache
Grand
Logan
Rio Blanco
Eagle
Kiowa
El Paso
Montrose
Otero
Delta
Washington
Kit Carson
La Plata
Prowers
Jackson
Fremont
Pitkin
Cheyenne
Montezuma
Adams
Huerfano
Morgan
CostillaConejosArchuleta
Dolores
Chaffee
Hinsdale
Mineral
San MiguelCuster
Teller
Douglas
Crowley
Boulder
Phillips
Ouray
Arapahoe
Alamosa
Lake
Rio Grande
Sedgwick
JeffersonSummit
San Juan
Clear Creek
Gilpin
DenverArapahoe
Adams
0 20 40 60 80
Miles
Colorado 8-hour Ozone Nonattainment Areas (2008 Standard)
Denver-Boulder-Greeley-
Ft.Collins-Loveland., CO
8-hour Ozone Nonattainment Areas
8-hour Ozone Nonattainment Classification
Extreme
Severe 15
Serious
Moderate
Marginal
12/05/2013

VOC + NOx + Ozone

• We have done all the “easy” things – Catalytic converters, emission equipment on vehicles – Combustion efficiency, vapor recovery systems – Emission reductions for EGUs – Industry emission reductions
• Have mostly addressed VOC, starting to address NOx
– NOx (or VOC) reductions can reduce or increase O3 depending on the “chemical regime.”
• Need for “smarter”, better informed solutions – Houston AQS 2000, 2006
• Need for more comprehensive measurements – Air quality models mostly informed and “validated” by sparse ground-based
observations of very few “criteria pollutants” – Pollutants move around horizontally and vertically – Spatially separated emissions come into play during different
meteorological situations; recirculation effects – Climate change impacts
Air Quality Improvements ?

Air Quality Improvements ?
Surface Ozone (ppb) 2 July 2012 Afternoon

- NO2, CO, CO2, CH2O, others-
We can now measure some pollutants from space
But: • Satellites provide total column measurements • Height-resolved information is underdetermined • Retrievals only available for cloud-free conditions • Satellite overpasses once a day (at most) and at the same time every day

Deriving Information on Surface Conditions from Column
and VERtically Resolved Observations Relevant to Air Quality
(NASA Earth Venture mission)
How can satellites be used to inform about AQ? 1. Relate column observations to surface concentrations for aerosols and key trace gases
2. Characterize differences in diurnal variation of surface and column observations
3. Examine horizontal scales of variability affecting satellites and AQ modeling
DISCOVER-AQ
Deployments and key collaborators Maryland, July 2011 (EPA, MDE, UMd, UMBC, Howard U.) California, January 2013 (EPA, CARB, UC-Davis & Irvine) Texas, September 2013 (EPA, TCEQ, U. of Houston) Colorado, Summer 2014 (EPA, NSF, NOAA, CDPHE) 9
NASA P-3B
NASA UC-12
NATIVE, EPA AQS, and
associated Ground sites

DISCOVER-AQ
• Trace Gases and Aerosols
• Column, surface, and vertical profiling
• Diurnal Evolution
• ~15 flights over 4 weeks
10
NASA King Air Column Measurements
Integrated from surface – 8 km
NASA P-3B Vertical Profiling
Altitude Range: 500ft AGL – 5 km
Surface In situ
Remote sensing
Ozonesondes
Aerosol lidar
~ 4-6 ground sites
Key Measurements: NOx, Ozone, CO, CO2, CH4,
Alkanes, Alkenes, Alkynes,
CH2O, Aldehydes, Aromatics,
Oxygenates, halogenated VOC,
OH and HO2 radicals.
Aerosols: Type, Size, Chem.
Composition, hygroscopicity

FRAPPÉ 2014
NASA DISCOVER-AQ
• Two Aircraft, • P3 (in-situ chemistry and
particles) and • KingAir (LIDAR, remote
sensing). ~15 flights at 8-hrs (P3), ~25 flights at 3 hrs (KA)
• Extensive ground based
operations

Local Emissions and mountain- valley circulation
Large scale inflow (CA, UT, Asia)
Regional Emissions
Regional Emissions
Regional scale outflow
C-130 flight tracks
FRAPPÉ • NCAR – C130
• ~12-14 flights 6 hours each
• Comprehensive AQ observations
• ground sites
• BAO Tower, Golden STM)
• Mobile labs (2xNOAA, 1xAerodyne).

Understanding AQ requires understanding the WHOLE ATMOSPHERE
and its variability – chemically, dynamically, physically.
Vertical structure and mixing of emissions into the boundary layer
and its evolution during the day is critical information – surface
measurements are rarely sufficient to gain full picture.
Complicated flow structure due to mountain induced circulation
make aircraft measurements critical.
Measurements and results from FRAPPÉ and DISCOVER-AQ will add
significant value to air quality model performance and thus provide
input to policy/decision making.

FRAPPÉ still has some funding needs:
• Education and Outreach program (before, during & after deployment) • Data analysis support for University partners (2015/6) • Please let us know if interested in supporting this effort
THANK YOU


extras

Ozone / photooxidant formation: a highly non-linear system
VOC + NOx + hv Ozone

FRAPPÉ 2014
From Johnson and Toth, (1981)

FRAPPÉ 2014

20
A map of the average daily max 8-hour O3 associated with air parcels arriving from source regions in and near the Front Range (based on HYSPLIT back trajectories for FTCW, RMNP, RFLAT, and HLD monitoring sites, Summer 2006).
This shows what concentrations are caused at these monitors by air originating in a given area. Urban sources and oil and gas activities are in the key source region.
Courtesy P. Reddy, CDPHE, Air Pollution Control Division

FRAPPÉ 2014

FRAPPÉ 2014

FRAPPÉ 2014

FRAPPÉ 2014

FRAPPÉ will • Quantify emissions of trace gases from
– Oil and gas extraction and related activities – Transportation – Power generation – Agricultural activities – Vegetation
• Quantify the interaction and the overall impact of these emissions on local and regional air quality – Air mass composition (organics, oxidants, NOx) – Climate impact – Ozone and oxidant formation – Formation and evolution of particulates – Mountain induced recirculation – accumulation of pollutants
• Quantify import of larger scale emissions and impact on local air quality – UT and WY oil and gas extraction and power generation – California – Asian emissions – Potential wildfires
• Develop strategies to reduce oxidant formation and improve air quality

FRAPPÉ Measurements/Modeling
• Aircraft: Ozone, NO, NO2, HNO3, HNO4, PANs, Alkyl Nitrates, CO, SO2, CO2, Methane, Ethane, Alkanes, Alkenes, Alkynes, Oxygenates, CH2O, Aldehydes, CH3CN, HCN, NH3, OH, HO2 and RO2 radicals, Halogenated tracers, Particles: size distr., type, chemical composition, physical parameters, met. and aircraft state parameters.
• Surface Sites: Photochemical tracers (depends on site), mobile vans with photochemical and emission tracers, vertical profiles (Erie Tower), column integrated measurements of aerosol parameters, vertically resolved measurements of ozone, particles (LIDAR).
• Mobile Labs: Two mobile laboratories (by NOAA and Aerodyne) - and maybe a third mobile lab – will be deployed in the region
• Air Quality Modeling: CMAQ and WRF-Chem at 3km or higher spatial resolution, CAM-Chem (large scale background)

C-130 Payload
Seat
Th
e H
Ox
PCIMS ---------
HARP
PAN
-------- GaTech
Seat
Seat
Seat
Seat
Seat
Seat
ADS-1
Seat Seat
Seat
Draft C-130 LAYOUT FOR FRAPPÉ 02/03/14
Seat
PCIMS
CAMS
HOx
NH3
All 6 slots in available
All 6 slots in available
PAN GATech
AMS (PTRMS_
?
NOx CO/CO2
SMPS CN
PTRMS
--------
PILS?
TDLIF
NO, NO2, CO, CO2,
FastO3 2xGV
HARP camera
SWB IRB
PiLS?
SMPS TUPS/
Pumps CN
RSTB
ADS-2
AMS CAPS
-------- H2O
CAMS ---------
NH3
pumps
TD-LIF
Seat
AWAS
---------- TOGA
TOGA AWAS
H2O
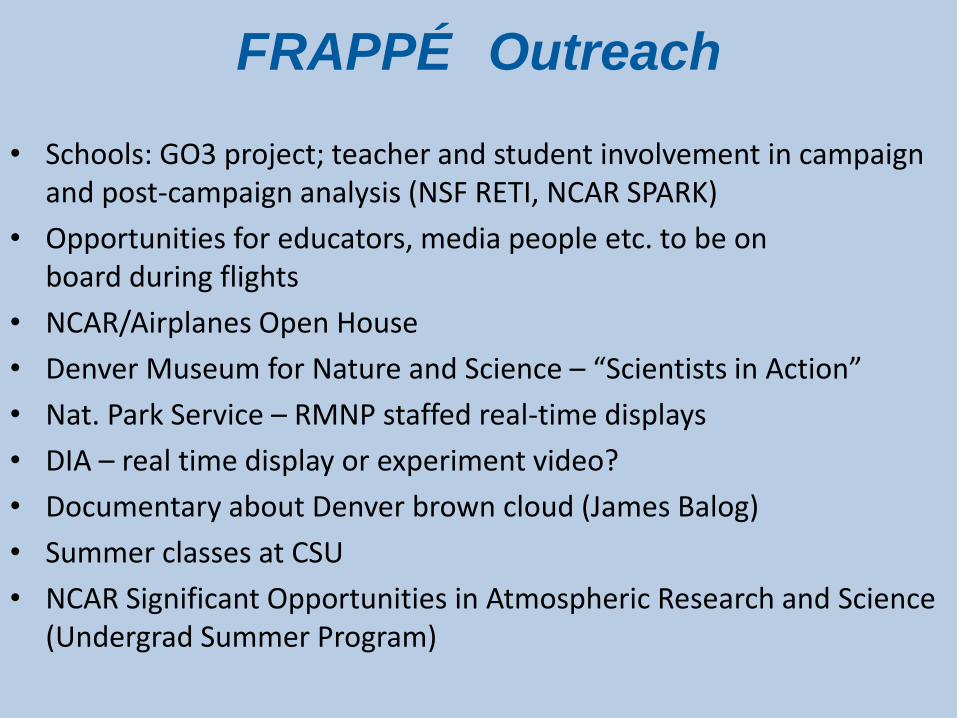
FRAPPÉ Outreach
• Schools: GO3 project; teacher and student involvement in campaign and post-campaign analysis (NSF RETI, NCAR SPARK)
• Opportunities for educators, media people etc. to be on board during flights
• NCAR/Airplanes Open House
• Denver Museum for Nature and Science – “Scientists in Action”
• Nat. Park Service – RMNP staffed real-time displays
• DIA – real time display or experiment video?
• Documentary about Denver brown cloud (James Balog)
• Summer classes at CSU
• NCAR Significant Opportunities in Atmospheric Research and Science (Undergrad Summer Program)

FRONT-PORCH 2014 (NCAR RAL/MMM)
• June to mid-Aug 2014
• Thunderstorm Initiation study
• Radars (fixed and mobile) and integrated sounding systems (ISS)
• High resolution Met-Forecasting (WRF)
Top Related