


Languages
Pages
Legal


1
Forest conservation for communities and carbon: the
economics of community forest management in the
Bale Mountains Eco-Region, Ethiopia
Charlene Watson
May 2013
Thesis submitted in fulfilment of the degree of Doctor of Philosophy
London School of Economics and Political Science

2
Declaration of work
This thesis is the result of my own work except where specifically indicated in the
text and acknowledgements.
The copyright of this thesis rests with the author. Quotation from it is permitted,
provided that full acknowledgement is made. This thesis may not be reproduced
without my prior written consent.
Photos are the authors own, as are the figures generated. I warrant that this
authorisation does not, to the best of my belief, infringe the rights of any third
party.
May 2013

3
Abstract
Forest conservation based on payments anchored to opportunity costs (OCs) is
receiving increasing attention, including for international financial transfers for
reduced emissions from deforestation and degradation (REDD+). REDD+ emerged
as a payment for environmental service (PES) approach in which conditional
payments are made for demonstrable greenhouse gas emission reductions against
a business-as-usual baseline. Quantitative assessments of the OCs incurred by
forest users of these reductions are lacking. Existing studies are coarse, obscure the
heterogeneity of OCs and do not consider how OCs may change over time.
An integrated assessment of OCs and carbon benefits under a proposed
community forest management (CFM) intervention linked to REDD+ is undertaken
in Ethiopia. The OCs of land for the intervention are estimated through household
survey and market valuation. Scenarios explore how OCs are likely to change over
the intervention given qualitative conservation goals and available land-use
change information. The feasibility of OCs payment as a tool for REDD+ is
assessed by combining cost with emission reductions estimates generated from
direct tree measurements. Households’ environmental attitudes, perceptions and
intention to cooperate with the intervention, estimated by a voluntary contribution
to improve forest management, are then investigated.
Mean OCs of forest conservation are US$334/ha, but highly heterogeneous.
Plausible futures of agricultural improvement, forest product commercialisation,
and degradation of land uses suggest total OCs could approach US$441 million
over a 20-year project. Applying carbon stock estimates of 231tC/ha±52 in moist
and 132tC/ha±73 in dry forest, REDD+ revenues may not meet annual cumulative
OCs, although more nuanced conservation planning could reduce OCs. Despite

4
OCs all households intend to cooperate in the intervention, with mean contribution
of US$11±4/year/household. The expected incomes of households under the Bale
REDD+ Project intervention however, were high and expectation management is
necessary. Recommendations are made for REDD+ intervention design in Ethiopia.
5
Acknowledgements
Many people have been instrumental in the completion of this PhD and my thanks
are extended to them all even if they are not mentioned by name here. I especially
thank my supervisors Dr. Susana Mourato and Professor E.J. Milner-Gulland who
have provided valuable feedback on this research. This study was also made
possible by a scholarship from the Economic and Social Research Council (PTA-
031-2006-00338), Frankfurt Zoological Society, BERSMP and the British Embassy in
Ethiopia. Thanks to the examiners for improving the quality of this thesis.
I thank those in Ethiopia who made fieldwork such a pleasure. Karen Laurenson
introduced me to the Bale Mountains but also gave me perspective. Alastair
Nelson and Deborah Randall provided a warm welcome. Anne-Marie Stewart and
Chris Gordon gave great company, and G&Ts, at the end of dusty bus rides. Dereje
Tadesse, detailed local knowledge and thoughtful debate. Freya, Graham and
Ness, Anouska and Thadaigh, and Flavie provided fires, food and conversation.
The staff at BERSMP, particularly; Tsegaye, Ben, Luluu and Bereket, I thank for
support and information. The Ethiopian authorities for allowing me to spend 18
months wandering the Ethiopian countryside talking to locals and measuring
trees. Also my enumerators Kemal and Abubeker, and those who took the time out
of their lives to answer my household survey that I hope this research benefits.
I thank my colleagues at LSE for friendship, support and intellectual guidance and
the Grantham Research Institute for hosting me. To my wider friends, thank you
for fostering my enthusiasm and for your patience. CV has been a voice of calm,
reason, warmth and advice that I would not want to be without. Lastly and
importantly, I’d like to thank my family for their constant and unwavering support
and love.

6
List of acronyms
BAU Business-as-usual BERSMP Bale Eco-Region Sustainable Management Programme BME Bale Mountains Eco-Region BMNP Bale Mountains National Park CBOs Community based organisations CCBA Climate, Community and Biodiversity Alliance CDM Clean Development Mechanism CFM Community forest management dbh diameter at breast height ETB Ethiopian Birr EPRDF Ethiopian People’s Revolutionary Democratic Front ERPA Emissions Reductions Purchase Agreement FCFP Forest Carbon Partnership Facility GHG Greenhouse gases GIS Geographical Information System GTZ German Technical Corporation ha hectares hifp high-impact forest products HH household HWPs harvested wood products IPCC Intergovernmental Panel for Climate Change lifp low impact forest products LULUCF Land use, land-use change and forestry masl metres above sea level MRV Monitoring, reporting and verification NGO Non-governmental organisation NTFP Non-timber forest products OCs Opportunity costs OFWE Oromia Forest and Wildlife Enterprise OLS Ordinary least squares OTC Over-the-counter PES Payments for environmental services REDD+ Reduced emissions from deforestation and degradation, forest
conservation, sustainable management of forests and the enhancement of forest carbon stocks
R-PP Readiness Preparation Proposal tCO2e tonnes of carbon dioxide equivalents UNFCCC United Nations Framework Convention on Climate Change VCM Voluntary carbon market VCS Voluntary Carbon Standard WBISPP Woody Biomass Inventory and Strategic Planning Project WTP Willingness-to-pay
7
Table of contents
Abstract ..............................................................................................................................................3 Acknowledgements .........................................................................................................................5 List of acronyms ...............................................................................................................................6 Table of contents ..............................................................................................................................7 List of tables ....................................................................................................................................10 List of figures ..................................................................................................................................12 Chapter 1: Introduction .................................................................................................................13
1.1. Background ..........................................................................................................................13 1.2. Research questions .............................................................................................................20 1.3. Thesis structure ...................................................................................................................21
Chapter 2: Literature Review .......................................................................................................24
2.1. Introduction .........................................................................................................................24 2.2. The carbon benefits of forest conservation: REDD+ revenues ..................................30 2.3. The opportunity costs of forest conservation ................................................................34
2.3.1. Forest income and the opportunity cost of forest conservation .......................................34 2.3.2. PES in practice ................................................................................................................38
2.4. REDD+ via CFM ..................................................................................................................41 2.4.1. Community forest management ......................................................................................41 2.4.2. Implementing REDD+ via CFM ....................................................................................43 2.4.3. Cooperation on a common pool resource .........................................................................46
2.5. Conclusion ...........................................................................................................................48 Chapter 3: Case study site .............................................................................................................50
3.1. Introduction ..........................................................................................................50 3.2. Forest Management in Ethiopia ........................................................................51
3.2.1. Ethiopia in context........................................................................................................51 3.2.2. Forest management: past to present ................................................................................52 3.2.3. Community forest management in Ethiopia ...................................................................55 3.2.4. Forestry Carbon in Ethiopia ............................................................................................59
3.3. The Bale Mountains Eco-Region .......................................................................62 3.3.1. The south eastern Ethiopian highlands ...........................................................................62 3.3.2. Ecological context ............................................................................................................63 3.3.3. Forest use in the Bale Mountains....................................................................................65
3.4. The ‘Bale REDD+ Project’: REDD+ via Community Forest Management in the Bale Mountains ...................................................................................................................67
3.4.1. Project outline .................................................................................................................67 3.4.2. Bale REDD+ Project implementers .................................................................................71 3.4.3. Project legal and institutional framework .......................................................................72
3.5. Survey locations ..................................................................................................................73 3.6. Conclusion ...........................................................................................................................76
8
Chapter 4: Conceptual framework and methods .....................................................................79 4.1. Introduction .........................................................................................................................79 4.2. Conceptual framework ......................................................................................................79
4.2.1. REDD+ as a PES ............................................................................................................79 4.2.2. The opportunity costs of REDD+ ....................................................................................82 4.2.3. REDD+ via CFM ............................................................................................................84
4.3. Overview of methods .........................................................................................................86 4.3.1. Forest carbon accounting ................................................................................................86 4.3.2. The opportunity costs of REDD+ ....................................................................................92 4.3.3. Environmental attitudes, perceptions and intention to cooperate in CFM ..................112
4.4. Data collection and analysis ...........................................................................................116 4.4.1. Fieldwork permissions ...................................................................................................116 4.4.2. Fieldwork teams.............................................................................................................116 4.4.3. Forest carbon plots ........................................................................................................117 4.4.4. Household survey data ..................................................................................................119 4.4.5. Market price survey ......................................................................................................121 4.4.6. Econometric analysis .....................................................................................................122
Chapter 5: Uncertain emission reductions from forest conservation .................................125
5.1. Introduction .......................................................................................................................125 5.1.1. Problem statement .........................................................................................................125 5.1.2. Aims and objectives .......................................................................................................131
5.2. Methods ..............................................................................................................................131 5.2.1. Assessing carbon stocks and estimating emission reductions .......................................131 5.2.2. Estimating revenues and REDD+ rent .........................................................................144
5.3. Results .................................................................................................................................150 5.3.1. Carbon stock and emission reductions potential ...........................................................150 5.3.2. Revenues and profit .......................................................................................................156
5.4. Discussion ..........................................................................................................................159 Chapter 6: Household heterogeneity in forest income and the opportunity cost of forest conservation ..................................................................................................................................163
6.1. Introduction .......................................................................................................................163 6.1.1. Problem statement .........................................................................................................163 6.1.2. Aims and objectives .......................................................................................................168
6.2. Methods ..............................................................................................................................168 6.2.1. Household income from forests and agriculture in the Bale Mountains ......................168 6.2.2. Econometric analysis .....................................................................................................170 6.2.3. The opportunity costs of forest conservation .................................................................173
6.3. Results .................................................................................................................................176 6.3.1. Descriptive statistics .....................................................................................................176 6.3.2. Household forest income ...............................................................................................177 6.3.3. Household agricultural income .....................................................................................181 6.3.4. Relative reliance on agriculture and forest income .......................................................183 6.3.5. Econometric analysis of household income from land uses ...........................................184
9
6.3.6. The OCs of forest conservation .....................................................................................189 6.4. Discussion ..........................................................................................................................193
Chapter 7: Scenarios of household opportunity costs of forest conservation over time 201
7.1. Introduction .......................................................................................................................201 7.1.1. Problem statement .........................................................................................................201 7.1.2. Aims and objectives .......................................................................................................205
7.2. Methods ..............................................................................................................................206 7.2.1. The opportunity costs of forest conservation over time .................................................206 7.2.2. Scenario calibration .......................................................................................................209 7.2.3. Income from REDD+ ....................................................................................................215
7.3. Results .................................................................................................................................217 7.3.1. Estimates of the opportunity cost of forest conservation over time ...............................217 7.3.2. Carbon profit as a forest product ...................................................................................222
7.4. Discussion ..........................................................................................................................225 Chapter 8: Household intention to cooperate in forest conservation ................................232
8.1. Introduction .......................................................................................................................232 8.1.1. Problem statement .........................................................................................................232 8.1.2. Aims and objectives .......................................................................................................237
8.2. Methods ..............................................................................................................................238 8.2.1. The REDD+ via CFM, Bale REDD+ Project................................................................238 8.2.2. Households’ environmental and forest management attitudes .....................................240 8.2.3. Households’ intention to cooperate with the Bale REDD+ Project ...............................243 8.2.4. Econometric analysis .....................................................................................................245 8.3. Results ............................................................................................................................247 8.3.1. Exploring attitudes to forest conservation ....................................................................247 8.3.2. Perceived welfare and income expectations under CFM ...............................................253 8.3.3. Households’ intention to cooperate in CFM .................................................................255 8.3.3.1. Descriptive statistics ..............................................................................................255 8.3.3.2. Econometric analysis .............................................................................................257 8.4. Discussion ......................................................................................................................260
Chapter 9: Discussion and conclusions ...................................................................................268
9.1. Context ................................................................................................................................268 9.2. Contribution to knowledge ............................................................................................269 9.3. Policy recommendations .................................................................................................280 9.4. Limitations and recommendations for future research .............................................285 9.5. Conclusion .........................................................................................................................291
Literature cited ..............................................................................................................................293 Appendix 1: Household survey .................................................................................................326 Appendix 2: Market price survey ..............................................................................................336
10
List of tables
Table 1. Survey location general characteristics .........................................................................74
Table 3. An outline of futures methods .....................................................................................108
Table 4. Biomass regression equations applied to direct tree measurements in order to establish the above-ground tree biomass in forest plots. ........................................................140
Table 5. Inputs and sources of uncertainty in estimates of forest carbon stock as well as methods applied to reduce these uncertainties as far as possible. .........................................142
Table 6. Over the counter carbon price trends and markets. ..................................................147
Table 7. Inputs and sources of uncertainty in profit assessment and methods by which uncertainty is dealt with in this study. ......................................................................................149
Table 8. Bale Eco-Region forest carbon stock by forest type. ..................................................152
Table 9. Comparison of primary data and documented biome-averaged forest carbon stocks. ..............................................................................................................................................153
Table 10. Variables used to calculate the number of plots required for statistical rigour in the Bale Mountains Eco-Region ..................................................................................................154
Table 11. Ex-post assessment of the number of forest plots required and those completed. .........................................................................................................................................................155
Table 12. Comparison of annual and cumulative emission reduction estimates illustrating the discrepancy between simple and complex forest carbon stock accounting. ..................156
Table 13. Net present value of profits under different forest carbon stock methods. .........157
Table 14. Correlation matrix of independent variables. ..........................................................171
Table 15. Explanatory variables for household income. ..........................................................172
Table 16. Mean household characteristics of survey respondents. ........................................177
Table 17. Mean household income from forest products and agriculture. ...........................182
Table 18. Determinants of household income per household. ...............................................185
Table 19. Lagrange Multiplier test for miss-specification of the Logit and Tobit model. Significance is noted as; * p < 0.10, ** p < 0.05, *** p < 0.01 .......................................................187
Table 20. OCs of forest conservation per hectare assuming conversion due to high-impact forest product harvest and due to agricultural conversion, with and without low-impact forest product harvest, by location. ............................................................................................189
Table 21. Conservation scenario storylines. ..............................................................................211
Table 22. Deforestation rate and area of avoided deforestation according to documented conservation project goals............................................................................................................216
Table 23. Annual, cumulative and total opportunity costs of forest conservation under three scenarios. ..............................................................................................................................221
11
Table 24. REDD+ revenue for a hectare of avoided deforestation (US$/ha). ........................223
Table 25. Attitudinal statements towards environmental values and livelihoods. .............242
Table 26. Explanatory variables of intention to cooperate in the proposed Bale REDD+ Project intervention. ......................................................................................................................246
Table 27. Correlation matrix of independent variables. ..........................................................247
Table 28. Survey respondents’ reported desired use of carbon revenues by community and private goods. ................................................................................................................................255
Table 29. (a) Mean household income expectation under proposed CFM regime and (b) willingness to pay into the cooperative CFM group by location. ..........................................256
Table 30. Determinants of household voluntary contribution into the cooperative CFM group. ..............................................................................................................................................258
12
List of figures
Figure 1. Schematic of thesis structure .........................................................................................23
Figure 2. Map of Ethiopia and the Bale Mountains Eco-Region. .............................................63
Figure 3. Forests of the Bale Mountains Eco-Region. .................................................................65
Figure 4. Four major forest and habitat types of the Bale Mountains Eco-Region ................78
Figure 5. Data collection in the Bale Mountains Eco-Region. .................................................119
Figure 6. Example forest plot selection for degraded dry forest of Argafa. .........................137
Figure 7. Average forest carbon stocks by forest type. ............................................................151
Figure 8. Power curve showing the total number of forest plots required to accept the outcome with particular level of confidence. ............................................................................155
Figure 9. Estimated projected cumulative profits over the Bale Mountains Eco-Region REDD+ project lifespan showing primary and secondary IPCC data under variable carbon price and discount rates (DR). .....................................................................................................158
Figure 10. Forest product collection by survey location. .........................................................178
Figure 11. Forest products sold on markets. .............................................................................179
Figure 12. Mean household forest income. ................................................................................180
Figure 13. Mean household forest income from low-impact and high-impact forest products. .........................................................................................................................................181
Figure 14. Proportion of gross agricultural income for sale and home consumption. ........183
Figure 15. Proportion of household income from forest and agriculture. ............................184
Figure 16. The distribution of household income from low-impact forest production by survey location. .............................................................................................................................191
Figure 17. The distribution of household opportunity costs of agricultural production by survey location. .............................................................................................................................193
Figure 18. Annual opportunity costs over time under three future scenarios. ....................220
Figure 19. Cumulative opportunity costs and REDD+ revenues over time. ........................224
Figure 20. Responses to attitudinal statements of environmental values and livelihoods.249
Figure 21. Histogram of household’s willingness-to-pay into the into the cooperative CFM group. ..............................................................................................................................................257

13
Chapter 1: Introduction
1.1. Background
Climate regulation is a non-material, non-extractive, environmental service that
historically was non-marketed. Now recognised as a global public good, GHG
emission reductions are now traded. Both regulated and unregulated carbon
markets have grown substantially over the last five years and in 2010, carbon
markets were worth US$142 billion (World Bank, 2011). Forests play an important
role in climate change mitigation and deforestation is responsible for 17% of global
greenhouse gas emissions annually (Stern, 2007, VCS, 2007). Reduced emissions
from deforestation and degradation, forest conservation, sustainable management
of forests and the enhancement of forest carbon stocks; henceforth referred to as
REDD+, presents a substantial climate change mitigation opportunity (McCarl and
Schneider, 2001, Sohngen and Mendelsohn, 2003, IPCC, 2006). International
financial transfers for REDD+ are growing; forest carbon markets traded an
estimated US$178 million in 2010 (Diaz et al., 2011). REDD+ is also operates
outside of carbon market mechanisms, and substantial public money is going to
support REDD+ activities (Watson and Nakhooda, 2012).
Where it operates at a local-level, REDD+ might be considered a payment for
environmental service (PES) scheme whereby the environmental service of carbon
dioxide emission reductions are sold, through a voluntary transaction, and
payment is conditional upon the provision of that service (Wunder, 2005). Others
ways to finance REDD+ exist, but a well-functioning PES can help deliver the
environmental integrity, or effectiveness, of a REDD+ mechanism that relies on
real, permanent and verifiable emission reductions (UNDP, 2009). Accounting for
14
emission reductions from forest activities, however, involves substantial
uncertainty (Brown and Lugo, 1992, Monni et al., 2007, Grainger, 2008, Larocque et
al., 2008). This is particularly true for forest carbon stocks where uncertainty arises
from complexity in forest ecosystems, sampling errors and from the choice of
model parameters, and is compounded by uncertain carbon market variables such
as carbon price, project preparation costs and transaction costs.
Despite the uncertainty it entails, the application of documented biome-average
forest carbon stocks has become commonplace for emission reductions accounting
(Brown and Gaston, 1995, Gibbs et al., 2007). Biome averages are simple and quick
to apply without resource and logistical constraints, but biome averaged data
rarely captures the full heterogeneity of the forest landscape (Houghton and et al.,
2001, Bradford et al., 2010). Few studies have considered the discrepancy between
the application of such simple default data and more complex forest carbon
accounting methods. The discrepancy can be large, but there is no consensus on its
direction (Smith, 2003, Brown et al., 2007). For REDD+ to be effective, policy-
makers need to better understand the uncertainties of emission reductions
accounting. Over-estimation of emission reductions can lead to large sums of
finance being miss-directed for no climate benefit, while underestimation can
result in lost opportunities for climate change mitigation and for the local
realisation of economic incentives.
There is growing support for REDD+ to be delivered through community forest
management (CFM) (Klooster and Masera, 2000, Murdiyarso and Skutsch, 2006,
Agrawal and Angelsen, 2009, Hayes and Persha, 2010). In part this stems from
findings that CFM can lead to emissions reductions where forest use becomes
more sustainable (Chhatre and Agrawal, 2009, Skutsch and Ba, 2010). It has also
been shown that community monitoring, reporting and verification of emission

15
reductions can be less costly that equivalent costs of professionals or central forest
departments (Somanathan et al., 2009, Palmer Fry, 2011). Under CFM, a common
property regime is established where members of a well-defined group of people
establish collective regulations for resource use, membership, monitoring, and
sanctioning procedures (Arnold, 2001, Baland and Platteau, 2003). To deliver
emission reductions those participating in REDD+ must have sufficient incentives
to do so. It has been proposed that an estimate of the private opportunity costs
(OCs) of forest conservation – the foregone benefits of alternative land uses – could
be used to anchor the level of payment needed to achieve the desired level of forest
conservation for REDD+ (Pirard, 2008, Wertz-Kanounnikoff, 2008, Pagiola and
Bosquet, 2009, White and Minang, 2011). These OCs should be embodied within
the payment that stakeholder, who become the providers of ecosystem services,
are willing to accept (Ferraro, 2008).
Studies of the OCs of forest conservation are typically based on the OCs of
foregone agricultural production (e.g. Chomitz et al., 2005, Naidoo and
Adamowicz, 2006, Börner et al., 2009). However, under CFM wider restrictions on
resource use experienced by households may mean that the forgone revenues from
timber and non-timber forest products (NTFP) will also be relevant costs to
consider (Karky and Skutsch, 2010, Fisher et al., 2011). Studies of the OCs of
REDD+ have also largely been undertaken at broad-scales which do not translate
well to on-the-ground design of payment incentives (e.g. Grieg-Gran, 2006, Grieg-
Gran, 2008). In particular, these broad-scale studies of the OCs of REDD+ do not
sufficiently appreciate the heterogeneity in the OCs of forest users which result
from differences in the economic reliance of households on forests (Vedeld et al.,
2004).
16
REDD+ OC studies have also largely excluded forests under community
management or that are common pool resources. This is largely attributed to the
unclear rights to land, trees or carbon under such property rights regimes, or
because forest use is illegal (e.g. Grieg-Gran, 2006, Börner and Wunder, 2008).
Where the costs of REDD+ via CFM have been considered, the mechanism to
deliver emission reductions becomes more ‘PES-like’; where the incentives
provided for service provision lack conditionality on the delivery of the service
provision (Nepstad et al., 2007, Peskett et al., 2008, Skutsch et al., 2011, Goldman-
Benner et al., 2012). This contrasts the REDD+ literature that talks of direct, output
based payments that are strongly additional to the business-as-usual (BAU)
baseline and conditional on continued service provision (see Santilli et al., 2005,
Parker et al., 2008, Bond et al., 2009). More research into the form, magnitude and
heterogeneity of OCs of REDD+ via CFM is necessary where communities become
legal providers of the environmental service generated through REDD+ via CFM.
These OC estimates can inform the design of a REDD+ via CFM conservation
intervention to encourage enrolment in the local-level PES scheme, maintain
conditionality and additionality and reduce the displacement of emission
reductions due to inadequate incentives.
At the core of conservation interventions are also concerns for the persistence of a
resource system into the future. Of the few studies of the OCs of conservation,
however, most report OCs for a single year or assume OCs are constant over time
subject only to discounting (Chomitz et al., 2005, Naidoo and Adamowicz, 2006,
Börner et al., 2009). Where resource use is unsustainable this assumption of
constant OCs are unlikely to hold (Pearce and Markandya, 1987, Ferraro, 2002).
The OCs of REDD+ are a function of the drivers of land-use change and so will be
influenced by changing income from direct human activities such as agricultural
production. Conservation interventions also aim to alter economic incentives that
17
will impact on OCs, for example, through the commercialisation of forest products
(Brandon and Wells, 1992). The OCs of forest conservation over time are, however,
hard to predict. There is often a lack of information on trends in the productivity of
land uses and a lack of explicit goals and quantitative operational targets in
conservation (Margules and Pressey, 2000). Being able to overcome the OCs of
local forest stakeholders over time will be necessary for the longevity of the
conservation intervention and the permanence of emission reductions from
REDD+. Generating a better understanding of possible futures of OC is therefore
necessary for more appropriate intervention and incentive design.
While PES uses a payment incentive to alter land use behaviours, CFM relies more
on the overall impact on a household’s payoffs that result from a change in the
property rights regime, reputation, trust and reciprocity (Ostrom, 2000, Castillo
and Saysel, 2005, Agrawal, 2003). Behaviours rely on the underlying values that
individuals hold, themselves driven by motivation and belief systems (Kotchen
and Reiling, 2000). An understanding of the attitudes and perceptions of
participants of conservation interventions can go some way to explore these values
and beliefs. A number of studies show that knowledge and perception of the
resource base condition, of perceived environmental responsibilities, and of
perceived legitimacy of the intervention are important for conservation success
(Zanetell and Knuth, 2004, Davies and Hodge, 2006, Nkonya et al., 2008, Adams et
al., 2003). However, none have explored how an ex-ante study of attitudes and
perceptions can contribute to incentive design to encourage cooperation. The
ongoing cooperation of local stakeholders in REDD+ activities will be critical for
the longevity, or permanence of emission reductions (see Sedjo and Marland,
2003). On common property regimes, cooperation on a common pool resource can
beget more cooperation and self-restraint in forest use brings more significant
benefits when followed by sufficiently large number of users (Baland and Platteau,
18
1996, Castillo and Saysel, 2005). Greater cooperation, or conservation effort, under
CFM can therefore increase REDD+ revenues. An understanding of local
stakeholder’s attitudes towards forest management and the use of the resource
base will, therefore, allow better consideration of socio-cultural factors for
cooperation that go beyond payment incentives that PES theory highlights.
A country associated with drought and poverty, forests do not immediately come
to mind when images of Ethiopia are evoked. But the largely rural population is
highly dependent on the forest resource base: across the country forest income is
estimated to be around a third of total household income (Mamo et al., 2007,
Babulo et al., 2009, Tesfaye et al., 2011). Sustainable forest management has been
hindered by political instability and a focus on increasing food production and
security (Teketay et al., 2010). Poor governance, uncertain land tenure, and a
rapidly growing population means that Ethiopia is experiencing forest losses
amounting to 140,000 hectares each year (WBISPP, 2005). With high levels of
poverty characterising Ethiopia, forest conservation that also allows households to
meet their livelihood needs is urgent (WDI, 2011).
CFM is being scaled up across the country with a view to meet livelihood needs
and to conserve the remaining natural forest areas. In the Bale Mountains Eco-
Region (BME) deforestation rates are more than four times the country-wide
average (Dupuy, 2009, Teshome et al., 2011). The BME is not a WWF eco-region,
however, it is referred to in this thesis as an eco-region so as to be consistent with
the Bale REDD+ Project implementers at the case study site as well as the national
use of the term to refer to this area. The Bale REDD+ Project has been proposed
and initiated by the Government of Ethiopia (Oromia Regional Government,
Bureau of Agriculture and Rural Development, and the Food Security and Disaster
Prevention and Preparedness Commission) and NGOs FARM-Africa and SOS

19
Sahel Ethiopia: the Bale REDD+ Project implementers. The project area covers
900,000 ha including dry and moist tropical forest which is currently being lost at
4% annually. In order to reduce deforestation over a 20 year period, CFM will be
implemented alongside promotion of fuel-efficient stoves and biomass briquettes
and plans are underway to plant woodlots and manage fire outbreaks. Increasing
agricultural production and the value of NTFP will also occur as part of the
project. While CFM and REDD+ can both be undertaken as separate policy
interventions, in the BME these are considered together: the Bale REDD+ Project
undertakes REDD+ via CFM. Thus emission reductions do not have to be
additional to that achieved through CFM, but rather are those generated by CFM.
Some do not consider Ethiopia to be a ‘key country’ for REDD+. Efforts to establish
REDD+ projects and activities have focussed on countries where forest areas are
more substantial and the carbon contained within the forests is very high. This
includes Brazil, Indonesia and the Democratic Republic of the Congo where the
majority of international finance to support REDD+ development has been
channelled (Climate Funds Update, 2011). Establishing REDD+ in Ethiopia,
therefore, may not contribute significantly to reducing emissions from
deforestation assessed at an international scale. Ethiopia may not receive as
substantial financial transfers as other tropical forested nations under an
international REDD+ mechanism established by climate change negotiations.
REDD+ does, however, contribute to internalising the externality of climate
regulation. It could provide a source of finance that changes the economic
incentives to make forest conservation more economically viable and it necessitates
the discussion and review of property rights regimes in forested areas. It could also
provide much needed finance that can help promote forest conservation in a
country with limited public budgets for forest conservation. It is for these reasons,
in addition to the potential climate benefits, that a discussion about REDD+ in
20
Ethiopia is justified. With CFM being pursued in a number of national REDD+
strategies in East Africa, including Ethiopia, the BME REDD+ project could prove
exemplary for the how REDD+ via CFM might function on-the-ground (FCPF,
2011).
1.2. Research questions
In this thesis, I aim to increase the understanding of how REDD+ can be
implemented through CFM as a local-level PES scheme in a developing country.
This thesis addresses a number of identified gaps in the literature on the
uncertainty of forest carbon stock accounting, the OCs of REDD+ via CFM, the OCs
of forest conservation over time, and community-level PES. A proposed REDD+
via CFM forest conservation intervention in the Bale Mountains of Ethiopia
provides an ideal case study to explore how information on the OCs of land, the
uncertainty in OCs over time, and household’s attitudes and perceptions can
inform the on-the-ground design of a REDD+ via CFM intervention.
The specific research objectives of this thesis are:
• To estimate the forest carbon stock in the BME;
• To evaluate the discrepancy between simple and complex forest carbon
accounting methods and the implications for the environmental integrity of
a REDD+ mechanism;
• To estimate the OCs of a proposed shift from an open access forest
management regime to forest conservation via CFM;
• To explore changes in the OCs of forest conservation over time in light of
uncertainty in the conservation intervention objectives and paucity of data
on future productivity of land uses;

21
• To establish if potential REDD+ revenues can overcome the OCs of forest
conservation over time; and
• To investigate the attitudes and perceptions of forest management in the
BME and consider households’ intentions to cooperate in the proposed
intervention through a voluntary contribution to the community group.
1.3. Thesis structure
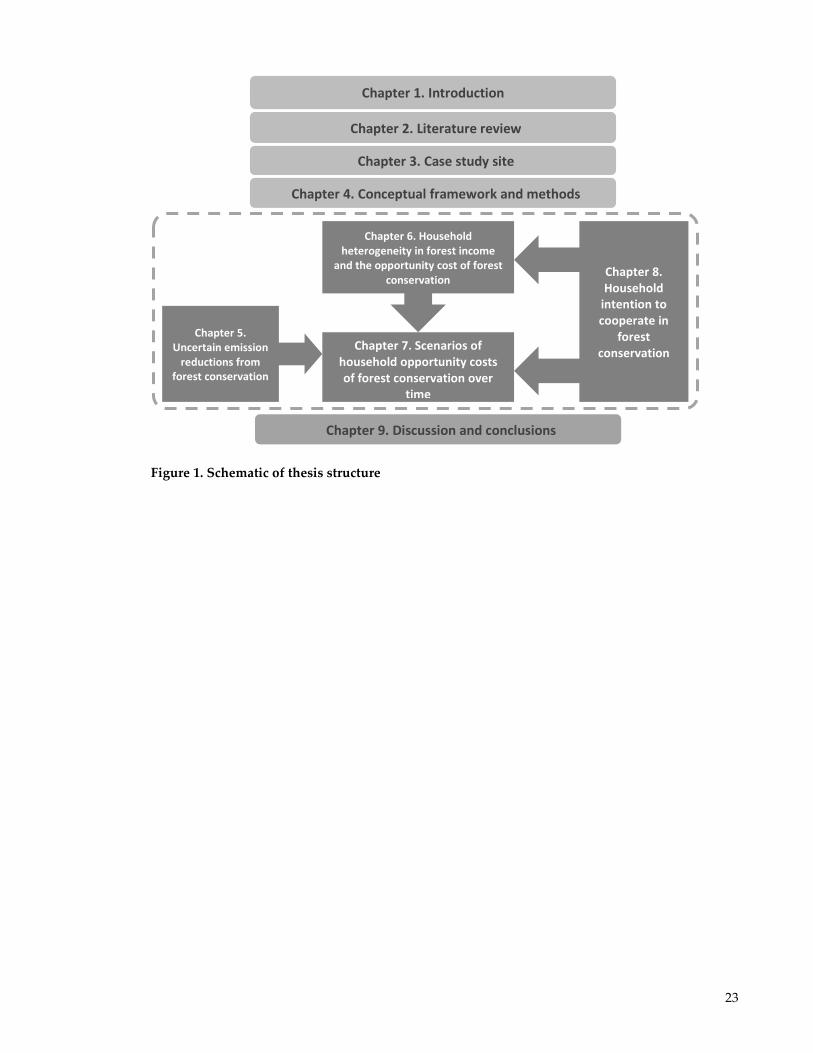
This thesis is structured as follows and is also represented in Figure 1:
Chapter 2 places this research in context of the existing literature on PES and
REDD+ via CFM. Identifying the gaps in the literature, it highlights the need and
timeliness of research into the implementation of REDD+ via CFM.
Chapter 3 introduces the case-study site in the BME in Ethiopia and reviews forest
policy and management both past and present. A detailed description of the
proposed forest conservation intervention at the case-study site is also given
including the likely rules of CFM.
Chapter 4 provides the conceptual framework and the methods employed in this
analysis of forest conservation for carbon and communities.
Chapter 5 estimates the carbon stock of forest at the case-study site and explores
the uncertainty of forest carbon stock estimates and the resulting environmental
integrity of emission reductions. It also estimates the potential REDD+ revenue
that a project in the BME could generate. Chapter 5 adds to knowledge though the
collection of primary data and estimation of forest carbon stocks in the BME. It
22
builds on limited literature on the implications of forest carbon accounting method
discrepancies for the environmental integrity of REDD+.
Chapter 6 investigates household income from the forest resource base and from
cultivated land to allow the estimation of the OCs of avoided deforestation under a
CFM regime. Chapter 6 adds to the limited literature on the OCs of forest
conservation, in particular the OCs of REDD+ via CFM, as well as to the limited
discussion of PES at the community-level.
Chapter 7 considers three futures through scenario modelling, exploring the OCs
of land over the life-span of the proposed conservation intervention. It also
assesses whether REDD+ revenues are sufficient to overcome the estimated OCs.
Chapter 7 contributes to knowledge by applying scenario modelling in
conservation planning. This Chapter also contributes to the limited literature on
the OCs of conservation over time.
Chapter 8 examines the attitudes and perceptions of the local communities
towards forest management. It also elicits their expectations of, and intention to
cooperate in the proposed REDD+ via CFM forest conservation intervention.
Chapter 8 adds to knowledge by eliciting environmental attitudes and perceptions
of a CFM intervention ex-ante, and illustrating how this information can be used
for intervention design.
Chapter 9 highlights the key findings of this thesis and how they may influence
policy formulation at the case-study site, as well as making recommendations for
future research.
23
Figure 1. Schematic of thesis structure
Chapter 8. Household
intention to cooperate in
forest conservation
Chapter 6. Household heterogeneity in forest income
and the opportunity cost of forest conservation
Chapter 5. Uncertain emission
reductions from forest conservation
Chapter 7. Scenarios of household opportunity costs of forest conservation over
time
Chapter 1. Introduction
Chapter 2. Literature review
Chapter 3. Case study site
Chapter 4. Conceptual framework and methods
Chapter 9. Discussion and conclusions

24
Chapter 2: Literature Review
2.1. Introduction Each year, 13 million hectares of forest are lost globally to expanding agriculture,
infrastructure and wood extraction (Geist and Lambin, 2001, FAO, 2006). A store of
carbon, this forest loss is responsible for around 12 to 20% global greenhouse gas
(GHG) emissions (FAO, 2006, Stern, 2007). A mechanism that reduces emissions
from deforestation and degradation, REDD+ presents a substantial climate change
mitigation opportunity (McCarl and Schneider, 2001, Sohngen and Mendelsohn,
2003, IPCC, 2006). REDD+ goes some way to address market and policy failures in
forest management that have historically undervalued or excluded from the
market, forest products and services. As initially conceived, financial transfers to
those who conserved and generated climate change mitigation potential through
forestry activities, therefore, go some way to internalise positive environmental
externalities such that non-marketed costs or benefits are reflected in the profits
received by forest stakeholders (Richards, 1999).
Not requiring technological innovation of the scale required in many other sectors
and with much of deforestation thought only marginally profitable (Boucher, 2008,
Minang et al., 2008), REDD+ has been promoted as a cost-effective climate change
mitigation option (Nabuurs et al., 2007, Bellassen and Gitz, 2008). The 2008 Eliasch
review found that the inclusion of emissions abatement through the forest sector
could greatly reduce the total estimated cost of halving global carbon emissions
from 1990 levels, as compared to the forest sectors exclusion. These cost reductions
were estimated as much as 50% in 2030 and 40% in 2050 (Eliasch, 2008).
25
REDD+ can be generated from more established ways to protect forests; protected
areas, sustainable logging, integrated conservation and development projects,
modifying plans for infrastructure such as road building, or through recognition of
rights (Rudel et al., 2005, Chomitz, 2007, Nepstad et al., 2007, Boucher, 2008).
REDD+ could also be funded in a number of different ways and not all of these
would require payment to reach local forest stakeholders. Strassburg et al. (2009)
illustrate that the costs of REDD+ in developing countries may be met by selling
emission reductions in national, regional or global carbon markets that can raise
substantial amounts of money; or from intermediate market-linked systems, not
purchased as offsets or linked or market prices; or through official development
assistance and other public funds. Such international public funds for REDD+ have
been more flexible, allowing countries to prepare the enabling environment for the
scaling up of REDD+ in addition to delivering actual emission reductions (Watson
and Nakhooda, 2012). Advantages of each source of finance differs (Boucher 2008).
With negotiations failing to make progress on aspects of climate finance as well as
REDD+ finance, in the immediate future there will be a combination of sources of
finance for REDD+. Similarly, most existing and planned REDD+ projects combine
a number of policies, actions and measures (PAMs) to deliver REDD+. The
proposed Bale REDD+ Project under scrutiny in this thesis, for example, combines
CFM with, woodlots, fuel-efficient stoves, and biomass briquettes to reduce
fuelwood needs, support for agricultural intensification to reduce needs for
expanding agricultural land, and support for the development of NTFP and a ‘Bale
Wild’ branding to increase the local value of products such as forest coffee and
honey (see Chapter 3).
While an international REDD+ mechanism is likely to operate through national-
level institutions in the future, the effectiveness at a country level will rely on
successful local-level forest conservation (Hayes and Persha, 2010). Although it is
26
acknowledge that some PAMs for REDD+ may not require finance to reach local
forest stakeholders, for example, through national forest tenure reform and
strengthening of enforcement against illegal logging practices, however, there has
been much attention paid to ensuring that benefit-sharing does reach such levels
(Costenbader, 2011, Peskett, 2011, Hoang et al., 2013). This thesis adopts an
approach where, at local-level, REDD+ might be regarded as a PES scheme where a
well-defined environmental service is bought by at least one buyer, from at least
one provider, through a voluntary transaction and conditional upon the provision
of that service (Wunder, 2005). Local-level REDD+ should, therefore, operate
where the willingness-to-pay for a service exceeds a provider’s opportunity costs
(OCs) of alternative, or foregone, land uses and practices that generate emission
reductions (Pirard, 2008, Wertz-Kanounnikoff, 2008, Pagiola and Bosquet, 2009,
White and Minang, 2011). The ability to incentivise such forest conservation
depends on REDD+ revenues to a project, themselves dependent on the emission
reductions that are generated from forest conservation activities (Santilli et al.,
2005, Parker et al., 2008, Bond et al., 2009).
Efforts have been made to ensure real, permanent and verifiable emission
reductions are generated from REDD+ (eg. Brown et al., 2007, UNDP, 2009). A
requirement of the payment is that emission reductions are additional; they would
not have occurred in the absence of the intervention (Asquith et al., 2002,
Rodríguez Zúñiga, 2003, Rojas and Aylward, 2003). The delivery of additional
emission reductions requires that only those who threaten forest cover should be
paid, despite any discontent this sparks for existing good forest stewards (Wunder,
2005). Cost-efficiency requires that those providing the environmental service
should only be paid their costs, thus payments would ideally be differentiated
between forest stakeholders. The longevity of emission reductions is also
important. Where REDD+ gains are not permanent, no overall emission reductions

27
will be made thus challenging the environmental integrity of a REDD+ mechanism
(Marland et al., 2001, Sedjo and Marland, 2003).
There have been a number of calls for REDD+ to be delivered via community forest
management (CFM) (Klooster and Masera, 2000, Murdiyarso and Skutsch, 2006,
Agrawal and Angelsen, 2009, Hayes and Persha, 2010). Of course, this is one of
many policies, actions and measures that can lead to REDD+. The establishment of
protected areas, reduced impact logging and agro-forestry, for example, can also
generate emission reductions (Watson, 2012). CFM inherently addresses the
livelihood needs of communities, however, as it is implemented where centralised,
state management is recognised as ineffective at sustainable forest management
and/or where benefits are not distributed equitably (Agrawal and Angelsen, 2009).
Necessarily understanding and addressing local livelihood needs such as biomass
energy, CFM as a way to implement REDD+ may therefore reduce the risks and
associated costs of dealing with the displacement of REDD+ outside of the project
area as opposed to the generation of a protected area, or greater law enforcement
as a main tool to reduce forest loss and decline. Where the agents of deforestation
shift their activities or meet demands for the same products from other locations,
such displacement is termed primary leakage (Aukland et al., 2002, Smith and
Scherr, 2003).
The costs of monitoring, reporting and verifying (MRV) emission reductions and
community enforcement of regulations required by REDD+ can also be lower
where provided by communities than equivalent labour and administration
provided by professionals and central forest departments (Somanathan et al., 2009,
Skutsch and Ba, 2010). REDD+ via CFM, therefore, could be competitive, or more
cost-effective, than alternative, mechanisms to deliver emission reductions
28
(Chhatre and Agrawal, 2009, Karky and Skutsch, 2010, Danielsen et al., 2011,
Palmer Fry, 2011).
REDD+ via CFM may also increase participation in PES, particularly for the poor
who are less likely to hold private titles to land to contract in individual-based PES
schemes (Miranda et al., 2003, Zbinden and Lee, 2005, Kosoy et al., 2007). Such a
community-level PES can also reduce barriers to participation such as high upfront
investments, such as for tree seedlings for private land, or transaction costs, such
as negotiating payments, that the poor may be less able to meet if they were acting
individually (Gong et al., 2010). Revenues for REDD+ via CFM could strengthen
the incentives to cooperate in forest conservation (Agrawal and Angelsen, 2009).
Addressing a market failure that drives deforestation, the recognition of the
international value of carbon storage in addition to the local values driving
improved community-level forest management, would help local forest
stakeholders international the previously non-market benefit of climate change
mitigation. Klooster and Masera (2000) suggest that carbon mitigation could also
leverage finance for the local investments needed to build local CFM capacity and
knowledge.
There has been little consideration, however, of how REDD+ via CFM will operate
on-the-ground. REDD+ necessitates a change in forest area, management regime
and access for those local to the conservation intervention. Rural communities
often depend heavily on natural resources for their livelihoods (Forsyth et al., 1998,
Bishop, 1999). The changes in livelihood strategies and opportunities that this
implies are unlikely to be identical between households local to conservation
interventions. Cost information can contribute towards a better understanding;
leading to more effective conservation interventions (Polasky et al., 2001, Polasky
et al., 2005, Naidoo et al., 2006, Naidoo and Iwamura, 2007, Carwardine et al.,
29
2008). Studies into the OCs of forest conservation, however, remain infrequent.
Experience of PES in developing countries indicates that environmental service
provision is often hard to attribute, payments are largely uniform and input-based
with indirect and in-kind incentives, especially where PES operates at a
community-level (Sommerville et al., 2009, Southgate et al., 2009, Skutsch et al.,
2011).
PES in practice, therefore, largely does not appreciate the on-the-ground
heterogeneity in the OCs of forest conservation. Furthermore, few studies have
considered how the OCs of conservation change over time. This is despite the fact
that conservation interventions are put in place largely due to concerns about the
ecological and social sustainability of a resource system now and into the future
(Pearce and Markandya, 1987, Ferraro, 2002). PES in practice appears less
conditional on service delivery, less additional to the baseline, and payments may
not fully overcome OCs and sufficiently incentivise ongoing service provision.
The PES literature has also afforded little attention to environmental services
generated under a common property regime, as would be the case for REDD+ via
CFM (Muradian et al., 2010). A considerable body of research has demonstrated
that individuals can collaborate to manage a common pool resource more
sustainably than in the absence of cooperation (Ostrom, 1990, Bromley, 1992,
Bardhan, 1993, Baland and Platteau, 1996). The mechanisms and incentives for
cooperation in common property regimes rely on positive incentives and penalties,
as well as social norms and codes of conduct (Ostrom, 1990, Ostrom, 2000, Castillo
and Saysel, 2005). Social and cultural norms include preferences for altruism,
reciprocity, inequity aversion, reputation, trust and conformity with the wider
community (Velez et al., 2009). These may influence the payoffs of a REDD+ via
CFM conservation intervention, defined as the balance of costs and the benefits,

30
both perceived and experienced, by the resource appropriators. PES, however,
largely ignores the logic of collective action under which individuals may be
willing to sacrifice private benefits or private consumption to raise public benefit
provision so long as it is reciprocated (Vatn, 2010, Vicary, 2011).
Skutsch et al. (2011) address the core difference in incentives between REDD+ and
CFM in detail. They consider output-based payments to communities not likely to
be appropriate under CFM and suggest more manageable input-based incentives
should be considered such as employing communities in MRV activities, or
through alternative income generating activities. The incentives become more
‘PES-like’ and so do not fulfil all the criteria of the classic PES definition (Landell-
Mills and Porras, 2002, Wunder, 2008). As is found in other studies that consider
REDD+ via CFM, there is a move away from the conditionality of the payment on
delivery of the emission reductions generated (Nepstad et al., 2007, Peskett et al.,
2008). Thus REDD+ via CFM to date appears removed from the performance, or
output-based REDD+ payments commonly discussed (see Santilli et al., 2005,
Parker et al., 2008, Bond et al., 2009).
2.2. The carbon benefits of forest conservation: REDD+ revenues
Finance delivered through a REDD+ mechanism has the potential to bring a
greater and more sustainable source of finance to conserve environmental services
than often exists now (Landell-Mills, 2002, Pagiola et al., 2005a). It has garnered
much attention as forest conservation in developing countries is often
underfunded, and this is particularly true in Africa. Independent of whether
REDD+ is financed through carbon markets or public funds (as discussed in
Section 4.2.1), recognising and realising the value of climate regulation could
31
attract more international and domestic finance over a longer period of time if
carbon remains preserved within tree biomass.
The shift to such market-based instruments for conservation follows a shift in
conservation towards meeting the basic needs, food and livelihood security of local
stakeholders. Itself based on a growing understanding of the relationship between
people and the environment-resource system (Arnold, 2001). Programmes for both
conservation and development have emerged that attempt to diversify livelihoods
to reduce pressure on forest resource systems, to commercialise and increase prices
of forest products to increase the economic value of standing forest, and that pay
stakeholders for the provision of an environmental service (Brandon and Wells,
1992). REDD+, however, goes further than integrated conservation and
development projects (ICDPs) by attempting to address market and policy failures
which undervalue or exclude from the market forest products and services, or that
make other land uses more profitable (see also Wunder, 2012). REDD+ goes some
way to internalise positive environmental externalities such that non-marketed
costs or benefits are reflected in the profits received by forest stakeholders
(Richards, 1999). For REDD+ to function as a local-level PES scheme, revenues
from the sale of emission reductions must overcome the costs of forest
conservation experienced by the local forest stakeholders.
In order to estimate the REDD+ revenues that can be generated by an intervention
that avoids deforestation, information on forest carbon stocks, area change and
market variables is necessary. Advances are being made in the technology and
accessibility of remote sensing imagery for the measurement of forest area and
forest area change and it is being increasingly used to infer forest biomass and so
forest carbon stocks (Achard et al., 2004, Mayaux et al., 2005, DeFries et al., 2007,
Ramankutty et al., 2007, Baccini et al., 2008, Goetz et al., 2009, Bucki et al., 2012).
32
Appropriate methods to establish the past and predicted rates of forest change in
order to calculate the emission reductions resulting from an intervention also
continue to be developed (Angelsen, 2008, Olander et al., 2008, Bond et al., 2009,
Griscom et al., 2009, Huettner et al., 2009, Estrada, 2011). Although forest carbon
stock estimation is being studied, relatively less attention has been paid to
reducing uncertainty in this field with regard to REDD+ interventions.
The scale of forest ecosystems and complexity of interactions between
environmental services within forest ecosystems means that there is more
uncertainty in carbon accounting than in any other climate change mitigation
sector (Peltoniemi et al., 2006, Larocque et al., 2008). Many developing countries
also suffer from a lack of data on key forest variables and parameters, and/or
resources or capacity to undertake forest carbon stock inventories (Brown et al.,
1989, Smith and Heath, 2001, Andersson et al., 2009, Romijn et al., 2012).
The high uncertainty in carbon accounting is partly to blame for the absence of
forestry in the European Emissions Trading Scheme (Fogel, 2005). It has also
resulted in limited eligibility, strict definitions, accounting rules and caps for land
use, land-use change and forestry (LULUCF) in national emissions accounting –
required by developed country signatories to the 1997 Kyoto Protocol of the
United Nations Framework Convention on Climate Change (Article 4 of the
UNFCCC, Article 3 of Kyoto Protocol). There is also very little guidance for
REDD+ implementation in the texts of the United Nations Convention on Climate
Change; only paragraphs 72 to 74 really comment on activities that countries might
need to consider when implementing REDD+.
The choice of method to estimate forest carbon stocks is often governed by
financial, time, data and capacity constraints. Recognising these trade-offs, the

33
Intergovernmental Panel for Climate Change (IPCC) present three approaches for
estimating carbon stocks and emissions (IPCC, 2006). Tier 1 is based on default
assumptions and default values for carbon stocks. Tier 2 employs more country-
specific carbon stock information and requires activity data disaggregated to
smaller scales. Tier 3 uses advanced estimation approaches that involve complex
models and highly disaggregated data (Böttcher et al., 2009).
The application of Tier 1 biome and regional forest carbon averages to estimate
emission reductions has become widespread where data on forest carbon stock is
not available locally (Brown and Gaston, 1995, Gibbs et al., 2007). These biome
averaged data are able to capture broad ecological variables influencing carbon
stocks, such as temperature and rainfall (Chave et al., 2004, GOFC-GOLD, 2008),
but they obscure substantial forest heterogeneity (Houghton and et al., 2001,
Bradford et al., 2010). Moving from Tier 1 to Tier 3 the costs and the accuracy of
emission estimates increases; discrepancies between these Tiers can be large.
Brown et al. (2007) found that Tier 1 accounting overestimated carbon density as
much as 33% in Mexican temperate forest and underestimated density as much as
44% in African rainforest. Smith (2003) found a three-fold difference in a single
hectare of Zambian wilderness.
Few studies have considered the impact of this uncertainty for the environmental
integrity of REDD+ which relies on real, permanent and verifiable emission
reductions (UNDP, 2009). Grassi et al. (2008) introduce uncertainty in accounting
for emission reductions from REDD+ and its implications. They explore how
concepts and methodological tools can help deal with these uncertainties and
promote the adoption of the conservativeness principle whereby the risk of
overestimation of emission reduction is minimised. They then link this back to
discussions of emission reduction accounting under the UNFCCC. Kerr et al. (2004)

34
translate errors in estimating carbon stocks into environmental integrity of credits
for avoided deforestation. In their estimation of carbon storage in Costa Rica, they
show that errors in emission reductions could be large, but also vary by forest
type. Pelletier et al. (2010) use more complex modelling over time, with five carbon
stock estimates for Panamanian forests in land conversion and transition models,
finding 144% difference in emission reductions resulted from highest to lowest.
It can be seen that the application of broad forest carbon assumptions over large
spatial scales has substantial implications. Over-estimation can lead to large sums
of finance being misdirected for no climate benefit, thus threatening the
environmental effectiveness of a REDD+ mechanism. Underestimation can result in
lost opportunities for climate change mitigation and for the local realisation of
economic incentives.
2.3. The opportunity costs of forest conservation
2.3.1. Forest income and the opportunity cost of forest conservation
In developing countries, rural communities and households can depend heavily on
natural resources for their livelihoods: the capabilities, assets and activities
required for a means of living (Forsyth et al., 1998, Bishop, 1999). Standing forests,
in particular, provide domestic material goods and energy, enable trade and
economic activity, and are a source of both food and medicines (Vedeld et al.,
2004). At a household level, research into the heterogeneity of forest reliance is
primarily undertaken with a sustainable livelihoods focus which refers to the
assets, the activities and the access to these that determine the living gained by a
household (see reviews of Godoy and Lubowski, 1992, Lampietti and Dixon, 1995,
Ellis, 2000, Vedeld et al., 2004). Market-based valuation of household production is
employed to value non-timber forest product (NTFP) use and to determine the
35
relative reliance of households on forests as a livelihood-generating resource (e.g.
Dercon, 1998, Shackleton and Campbell, 2001, Dovie et al., 2005).
The reliance of households on forests for their livelihoods is influenced by access to
and control over forest resources (Wollenberg et al., 2000, Angelsen and Wunder,
2003). Rural poverty and forests are also found to coincide, often with forest use
varying according to changes in the resource base, prices and alternative income
opportunities (Neumann and Hirsch, 2000, Angelsen and Wunder, 2003). Forest-
poverty links, however, are complicated. There are cause-effect issues: forest
reliance due to lack of resources and alternatives differs from opportunity-driven
forest reliance for valuable cash products (Adhikari, 2005). The forests are also
comprised of a multitude of goods that are utilised in different ways by different
groups; high value timber extraction, for example, is likely to serve a different
livelihood function than NTFPs. Therefore poverty does not necessarily lead to
deforestation, although it may in some cases. Studies into forest-poverty links are
on-going, for example by the Poverty Environment Network instigated by the
Centre for International Forestry Research (PEN-CIFOR, 2011). What is clear from
the literature is that households’ forest income and resulting reliance on forests is
highly heterogeneous even within a small geographical area (Godoy and
Lubowski, 1992, Byron and Arnold, 1999, Cavendish, 2000, Coomes et al., 2004,
Dovie et al., 2005). In a meta-study of 54 cases over 17 countries, Vedeld et al. (2004)
find mean household forest income to be US$678 per year, but with a range from
US$1.3 to US$3,460.
With differing incentives for deforestation, or degradation leading to deforestation,
there will also be divergence in the OCs of the land for forest conservation; the
foregone benefits of an alternative investment, activity or use of the resource.
Although the assessment of conservation costs is increasingly being recognised as

36
important strategically in conservation efforts (Polasky et al., 2005, Naidoo and
Adamowicz, 2006, Börner et al., 2009), the literature on the OCs of conservation
interventions is sparse. Existing conservation cost assessments have been
dominated by management costs (Balmford et al., 2003, Frazee et al., 2003, Moore
et al., 2004). They are also focused in developed countries (Ando et al., 1998,
Polasky et al., 2001, Carwardine et al., 2008) as there it can be assumed that under
perfect market conditions land prices will represent the discounted stream of
income from the highest-value use (Bishop, 1999).
In many developing countries land tenure is uncertain, however, and land markets
absent or data incomplete thus OCs cannot be established through land markets
(Balmford et al., 2000, Balmford et al., 2003, Naidoo and Adamowicz, 2006,
Waggoner, 2009). Although in Brazil, where land prices do exist, Chomitz et al.
(2005) applied the hedonic method to estimate the OCs of maintaining forest cover
in the Brazilian Atlantic Forest. They found forested land prices 70% below those
of cleared land, clearly demonstrating the economic incentives opposing
conservation.
Where hedonic methods cannot be applied, OCs can instead be calculated through
the comparison of the productivity of alternative land uses. Norton-Griffiths and
Southey (1995) estimated the OCs of biodiversity conservation in Kenya at US$203
million a year by comparing the potential net returns from agriculture and
livestock production within parks, reserves and forests with net returns from
tourism, forestry and other conservation activities. The net revenues of US$42
million from wildlife tourism and forestry were inadequate to overcome these OCs
of land use. Public willingness-to-pay and external finance are therefore critical for
Kenyan biodiversity conservation. Also in Kenya, Börner et al. (2009) estimated the
OCs of forest conservation through household surveys, at US$129-201/ha annually
37
(applying an exchange rate of US$0.804:€1 based on the 2005 year of data collection
and reported foregone revenues of €160-250/ha). They go on to demonstrate that
this OC information could be used to design appropriate extraction fees to restrict
resource extraction with minimal negative welfare impacts. Fisher et al. (2011)
include both OCs of agricultural production and charcoal production within 53
districts in Tanzania finding net present value of between US$663 and US$1456/ha
for agricultural production, and US$358 and US$502/ha for charcoal production.
The finer the scale at which OCs studies are undertaken the better able they are to
quantify heterogeneity. In addition to household demographics, heterogeneity in
OCs depends on environmental endowments such as climate regime and soil
fertility, which affect land uses (Merry et al., 2002, Smith and Scherr, 2003, Nepstad
et al., 2007). In Paraguay, for example, Naidoo and Adamowicz (2006) disassociate
land use types and find net economic benefits of US$257/ha associated with
smallholder agriculture but much higher values of cattle ranching and soybean
farming at US$375/ha and US$1347/ha, respectively.
Estimates of land productivity can be used to create maps illustrating where OCs
will be greatest. These maps could then be applied in conservation planning (e.g.
Chomitz et al., 2005, Naidoo and Ricketts, 2006, Carwardine et al., 2010). Small-
scale OCs studies also identify distributional issues for conservation policy. Where
variation in OCs is large, the integrity of an intervention could be eroded where it
conflicts with local subsistence demands, or if it is not politically or socially
acceptable due to exacerbation of existing inequalities in wealth, income or access
to resources (Shyamsundar and Kramer, 1996). Assessing OCs quantitatively and
using the results in intervention design can, therefore, bring greater acceptance,
longevity and impact for forest conservation (Chomitz et al., 2005, Adams et al.,
2010).
38
2.3.2. PES in practice
The full process of PES scheme design and benefit sharing is rarely documented
and Engel et al. (2008) note that best practice is largely confined to the grey
literature. However, the existing PES literature shows that while theory
appreciates heterogeneity in OCs, PES in practice largely does not. Payments are
typically uniform across local stakeholders rather than differentiated (Engel et al.,
2008, Southgate et al., 2009, Gross-Camp et al., 2012). Such uniform payments
across the providers of environmental services are more transparent, easy to
implement and give an impression of fairness for local stakeholders (Alix-Garcia et
al., 2005, Pagiola and Platais, 2007, Southgate et al., 2009). But while uniform
payments can generate surplus to the land owners with OCs lower than payment
levels, and so increase incentives for participation in PES, they also reduce the
efficiency of the intervention as payments are made that do not lead to changes in
land uses (Pascual et al., 2010). Alternative payment modes exist (see Engel et al.,
2008, Ferraro, 2008, Wünscher et al., 2008). For example, where information is
available on local stakeholders OCs, differentiated payments can be included in
contract design or through auctions or bidding systems for PES contracts (Gong et
al., 2010). The application of auctions and differentiated payment, however, is
often prohibited by the high transaction costs of such payment methods through
data and administrative needs.
Due to complex land use and environmental service linkages, PES are also
typically input-based; where land-use change is assumed to produce the
environmental service rather than actual service itself (Skutsch et al., 2011). Indirect
payments, as opposed to cash, have also been made including goods or services,
such as clinics, schools, public transport and infrastructure (Asquith et al., 2008,
39
Bennett, 2008). Such in-kind payments lead to fewer questions on the reinvestment
of payments; cash may well lead to short-term spending on intermediary needs,
for example, alcohol and luxury goods rather than on longer-term investments
(Wunder, 2005, Lee and Mahanty, 2009). Both input-based and in-kind payments,
however, reduce conditionality of the payment on the environmental service
provision. The upfront nature of some in-kind payments also introduces a risk of
whether they will sufficiently incentivise on-going service provision and they are
considered irreversible in many cases as they are hard to withdraw (Sommerville
et al., 2010). It may also introduce ethical issues such as in withholding
community-level in-kind benefits, for example clinics, for non-participants or if
contract provisions are not met. It also becomes harder for households to judge
whether benefits from in-kind payments sufficiently overcome their costs. Given
that providers benefit differently from the use of the common good, those with
high OCs are likely to perceive low net benefit (Gong et al., 2010, Pascual et al.,
2010, Sommerville et al., 2010).
In the Wunder (2005) definition of PES, providers should voluntarily enter into
environmental service contracts. Alternative definitions of PES have been
proposed, but overall they agree that the decision to accept a payment at the level
of the transaction of the stakeholder, should be voluntary (see e.g. Sommerville et
al., 2009). Economic logic would therefore predict that when offered a payment
below OCs the PES scheme would not be entered into (Engel et al., 2008).
However, there is evidence that in some PES schemes OCs have not been met
(Corbera et al., 2007b). This may be a result of local stakeholders lacking
information on the market value of services they supply or the experience to truly
evaluate the contracts they are offered (Peskett and Harkin, 2007, Kosoy et al.,
2008). Non-use values of standing forest are also not often factored into OC
estimates and may also play a role in decision making. Gardner et al. (2001) found
40
in Cameroon that despite the low income generation potential of forests locals
were highly motivated to manage the forest for conservation in light of non-
marketed forest values.
Furthermore, in order to opt out, stakeholders must also be free from external
pressure and coercion to enter a PES scheme which is not always the case (Grieg-
Gran et al., 2005, Pagiola et al., 2005a, Robertson and Wunder, 2005, Bennett, 2008).
The payment contract will also pay a role in overcoming OCs, defining details such
as the timing of payments, length of contracts, upfront investments required and
sellers’ private risk and time preferences (Ferraro, 2008). A function of the drivers
of land-use change, future OCs will be influenced by changing profits to direct
human activities such as agriculture and wood extraction, and affected by
infrastructure development. OCs will also be impacted by the underlying drivers
of deforestation, including; demographic, economic, technological, policy and
institutional, and cultural causes (Geist and Lambin, 2002).
Few studies quantify how OCs of conservation might change over time. Most
report OCs for a single year or assume that OCs are constant over time subject only
to discounting (Börner et al., 2009, Naidoo and Adamowicz, 2006, Chomitz et al.,
2005). An exception, Ferraro (2002) considered the OCs of the establishment of a
national park in Madagascar. Without establishment of the park, Ferraro predicted
that the flow of benefits would first increase as locals extracted resources. As these
resources became degraded, however, benefits would then decline. If in contrast,
the national park was established, Ferraro predicted that the benefits of
exploitation were zero but, in the zone surrounding the national park, benefit
flows would decrease more rapidly by virtue of a more limited area of access. While sensitivity analysis of the parameter assumptions substantially changed the
estimates of total OCs, this study was useful in highlighting the impacts of

41
unsustainable resource use on the total OCs of conservation. Pearce and
Markandya (1987) also make this point in their assessment of the social OCs of
natural resource management. They identified externalities resulting from reduced
tree cover which could, for example, result in soil erosion, reduction in soil fertility
and sedimentation, all of which all are likely to reduce agricultural yields and
hence OCs over time. They concluded that where the resource use is unsustainable
and where complete exhaustion of the resource base is possible, the calculation of
the OCs of conservation requires information on future patterns of exploitation as
well as the future development and supply of substitutes for these resources.
2.4. REDD+ via CFM
2.4.1. Community forest management
Many forests are common pool resources which are resource systems that are
sufficiently large as to make it costly, but not impossible, to exclude potential
beneficiaries from obtaining subtractable benefits from their use (Ostrom, 1990). In
the absence of well-defined property rights, an individual actor will appropriate
resource units from a common pool resource without consideration of the social
cost to others. Particularly in the tropics and developing countries, policy failures
such as unclear land tenure, poor governance and lack of law enforcement often
lead to de facto open access regimes on forested land (Davies and Richards, 1999,
Richards, 2008). The tragedy of the commons is predicted to result from this
extraction of non-excludable and rival goods by individuals and the negative
externalities of their use (Hardin, 1968).
Such an outcome, however, is not inevitable and a considerable body of research
has demonstrated that individuals can collaborate to manage a common pool
resource more sustainably (Ostrom, 1990, Bromley, 1992, Bardhan, 1993, Baland

42
and Platteau, 1996). Where users of a common pool resource are able to
collaborate, the forest resource becomes excludable. Under such a common
property regime, a well-defined group of people establish collective regulations for
resource use, membership, monitoring and sanctioning procedures (Arnold, 2001,
Baland and Platteau, 2003). This is the theoretical underpinning of CFM which
creates the mechanisms and incentives such that community institutions are able to
conserve forests at the same time as meeting livelihood needs (see Ostrom, 1990,
Bromley, 1992, Baland and Platteau, 1996, Arnold, 2001).
The success of CFM in practice is largely demonstrated through case-studies.
Literature, however, focusses on differing aspects of what might be considered a
successful CFM programme and case studies equally note instances where CFM
has led to uncertain livelihood and forest management outcomes. Case-studies
from Nepal, where community forestry has operated since the 1980s, indicate that
forest product collection rates have increased over the course of a CFM
interventions, although livestock ownership decreased; the poor receive lower
forest benefits than the rich and were less likely to participate in decision-making;
and benefit appropriation largely depended on wealth, education and household
status (Adhikari et al., 2004, Adhikari and Lovett, 2006, Adhikari et al., 2007,
Adhikari and Di Falco, 2009).
CFM is now widely adopted across East and Southern Africa (Wily, 2010). In East
Africa, experiences in Tanzania dominate where CFM took off in the 1990s. Case
studies show that CFM can deliver improved forest outcomes in Tanzania
(Blomley et al., 2008, Lund and Treue, 2008), but there has also been criticism of a
lack of integration of CFM into existing local institutions (Blomley and Ramadhani,
2006) and in the equity of benefit distribution (Meshack et al., 2006, Persha and
Blomley, 2009). Experience in Ethiopia is also mixed, while studies note positive

43
impact on forest condition (Gobeze et al., 2009), others point to low participation
due to low returns for locals that has led to conflict (Getahun et al., 2007). Wily
(2010) emphasises the strength of the CFM approach in Africa is the recognition
and empowerment of local communities as resource owner-managers, despite the
uncertain forest, livelihood and governance outcomes of CFM.
2.4.2. Implementing REDD+ via CFM
Property rights are a foremost issue in PES, where property rights can be defined
as the bundle of entitlements defining the owner’s rights, privileges and limitations
for the use of a resource (Tietenberg and Lewis, 2009). Eligibility for PES schemes
often depends on an individual’s right to change land use, ability to protect the
service from others, and right to transfer rights (Corbera et al., 2009). Where
property rights are weak it is more complex to determine who to pay, to enforce
contracts, elite capture is more likely and there is likely to be weak law
enforcement (Wunder, 2007, Engel and Palmer, 2008, Clements et al., 2010). The
literature on PES has, therefore, largely focussed on contracts between individuals
with clear legal control over environmental service provision.
REDD+ via CFM, however, would not operate through private land owners. The
devolution of rights and management responsibility provides forest communities
with greater long-run incentives to become good stewards of the forest resource
(Agrawal and Gibson, 1999, Petersen and Sandhövel, 2001). REDD+ OCs studies
have often deliberately excluded community forests. On common pool resource
where forest use and deforestation is forbidden by statutory law, it has been
suggested that the OCs of land may be an inappropriate measure for assessment of
the feasibility of REDD+ policy as either illegal behaviours would be rewarded or
emission reductions may not be additional (Börner and Wunder, 2008). It is for this

44
reason that Wünscher et al. (2008), in their calculation of OCs of forest
conservation, assume natural forest produces no household income. It has been
suggested, where forest use is illegal, that costs incurred by the government of
improving laws and law enforcement may therefore be considered more relevant
in planning interventions than the requirement to overcome the OCs of forest users
(Börner and Wunder, 2008, Busch et al., 2009, Gregersen et al., 2010).
A CFM intervention, however, recognises communities as forest management
agents. The communities, therefore, legally become environmental service
providers. The assertion that OCs will set the level of payment for land use
managers to avoid deforestation may, therefore, only hold as a result of a
conservation intervention implementation. Where environmental services are
generated under a common property regime, however, attributing service
provision to an individual is complex. All members of CFM groups have legitimate
claim to payment as forest use rights are given to the community. But, not all
households would deforest in the BAU baseline. Furthermore, more than one
household can contribute to forest conservation on a single hectare as forest use on
overlaps. Not only is it unclear which household incurred the costs of
environmental service provision, the lack of attribution can also introduce free-
riding and moral hazard in community-level PES; where the actions of one person
are unobservable and so cheating is a distinct possibility (Hanley et al., 2006). Elite
capture of community-level payments is another possibility, and well documented
in the community based natural resource management literature (e.g. Fritzen, 2007,
Platteau, 2004).
Transaction costs incurred by local forest stakeholders should also be considered
for REDD+ under CFM. Transaction costs may include; arranging, bargaining,
monitoring and enforcing agreements (North, 1990). For CFM in particular,

45
meetings to negotiate forest areas and byelaws, in addition to ongoing monitoring
and enforcement of schemes can be high for some individuals. Meshack et al.
(2006), found poorer households took on greater transaction costs relative to their
forest product benefits in Tanzania. In Nepal, richer households bore almost twice
as much absolute transaction costs as poorer households in terms of the number of
days contributed to CFM meetings, although costs were still a higher percentage of
resource appropriation in poorer households (Adhikari and Lovett, 2006). With
varying definition, each individual experiencing different costs, and hard to
separate from production decisions, transaction costs are hard to estimate,
however (Benham and Benham, 2000).
In the few instances where REDD+ via CFM has been considered, incentives
become more ‘PES-like’ (Wunder, 2008). Peskett et al. (2008) suggest that while
direct payments for REDD+ might be provided where rights are clearly
established, a mixture of these and indirect benefit distribution mechanisms are
preferable for REDD+ under rights regimes such as CFM. They suggest broader
development projects such as improving schools and social services might be
employed as incentives for REDD+. Skutsch et al. (2011) consider three types of
payment mode for REDD+ via CFM; output-based, input-based and OCs-based.
They conclude that output- or OCs-based payments to communities are not likely
to be appropriate under CFM due to high transaction costs of establishing and
distributing such differentiated payments. They suggest more manageable input-
based incentives should be considered such as employing communities in MRV
activities, or through alternative income-generating activities. These are predicted
to have greater predictability of benefits, a greater focus on co-benefits rather than
economic efficiency and less collusion and strategic manipulation.
46
Nepstad et al. (2007) in their assessment of costs of REDD+ in the Brazilian Amazon
propose a Public Forest Stewardship Fund for avoided deforestation on ‘social’
forest reserves comprising 26% of the forests, including; indigenous lands,
extractive reserves, and sustainable development reserves. They suggest direct
payments to households, although payments are uniform and set to half the
minimum salary (equating to US$1200 per year) and not linked to the delivery of
emission reductions. Suggestions for the delivery of incentives for REDD+ via
CFM, therefore, are more input-based, indirect or uniform all of which decrease
conditionality and, thus, the efficiency that PES was initially proposed to deliver
(Simpson and Sedjo, 1996, Ferraro and Simpson, 2002, Ferraro and Kiss, 2002).
2.4.3. Cooperation on a common pool resource
Historically CFM implementation has not offered communities payments, but the
change in the property rights regime, leading to increases empowerment and
improved governance mechanisms, is assumed to shift incentives sufficiently to
deliver desired resource management outcomes (Agrawal, 2003). Collective action
on a common pool resource has been shown to be influenced not only by incomes
from direct extraction, but also through the impact of reputation, trust and
reciprocity on households’ payoffs (Ostrom, 2000, Castillo and Saysel, 2005).
Collaboration on a common pool resource largely means that resource
appropriators extract less than private incentives would dictate, but are willing to
incur these costs for longer term sustainability on the understanding of reciprocity
and cooperation of others (Heckathorn, 1993, Seabright, 1993). Game theory and
experiments also indicate that as individual effort increases, the total group effort
increases and incentives for free-riding decline (Fischbacher et al., 2001, Castillo
and Saysel, 2005).
47
Research from a large body of case studies on common pool resources has
converged on a set of variables that enhance the likelihood of cooperation. These
can be divided into the attributes of the resource and the attributes of the
appropriators. In the first instance, collaboration is enabled by: the feasible
improvement in the resource as a result of collaboration; reliable and valid
indicators of condition; predictability of resource units; and, a sufficiently small
spatial extent that knowledge of boundaries and microenvironments are known by
the appropriators. In the second instance, collaboration of appropriators is enabled
by: dependency on the resource base for a major portion of their livelihood; a
common understanding of how use affects that of others; a discount rate that
allows future benefits to be achieved from the resource; similarly affected interests
of appropriators despite economic and political asset heterogeneity; trust and
reciprocity; autonomy to determine access and harvest rules from external
authorities; and, local leadership and organisational experience (see Baland and
Platteau, 1996, Agrawal, 2001). The enabling factors of cooperation all impact upon
the balance of costs and the benefits, or the payoffs, both perceived and
experienced by the resource appropriators (Matta and Alavalapati, 2006). The
payoff determine whether households will cooperate in collective resource
management (Ostrom, 1990, Varughese and Ostrom, 2001).
PES so far has failed to consider the logic of collective action (Kosoy et al., 2008,
Muradian et al., 2010). Kosoy et al. (2008) is a rare study of willingness to
participate in PES that accounts for rules, institutions, values and interactions
between actors and, it considers PES on a common-property regime. Analysing
Mexican communities receiving payments for biodiversity and carbon under the
government initiated Payments for Hydrological Environmental Services
Programme, they find that procedural rules and management impact on
participation, but also note that collective motivation can be distinctly different

48
from individual preferences. Estimates of the OCs of REDD+ commonly assume
households act as self-interested profit maximisers that act independently of their
impacts on others (e.g. Busch et al., 2009). They may, therefore, overestimate the
payment required to incentivise forest conservation.
Fisher et al. (2010) notes that PES in developing countries often operate under
conditions much like a common pool resource; with unclear property rights, poor
monitoring capacity and information asymmetry. The transfer of formal land
tenure to local land managers has been used as a PES incentive in South-East Asia
under the Rewarding the Upland Poor for Environmental Services (RUPES) project
(van Noordwijk et al., 2004). The importance of social capital and social
empowerment is also shown to be important in PES. Gong et al. (2010) show that
areas of low uptake of a Clean Development Mechanism (CDM) forest project in
China, are those in which social capital is also low due to its impact on the ability
to enforce contracts through social structures. It is clear that the lessons and
incentives for cooperation in common pool resource management are important
for PES design and implementation.
2.5. Conclusion
Despite the growing support for REDD+ via CFM, it is unclear how REDD+ as a
local-level PES could be implemented on-the-ground. PES in practice has so far
failed to appreciate the heterogeneity of OCs of land and there has been little
consideration of how OCs will change over time. There has also been limited
consideration of how PES will operate on a common property regime, in particular
how financial incentives of a PES scheme will be impacted by the non-financial
incentives so far provided under CFM. Ongoing discussions to ensure that finance
for emission reductions through REDD+ is direct, conditional, additional, and

49
permanent, contrast the proposals for REDD+ via CFM implementation, and
indeed PES in practice, which become more indirect and less conditional on
emission reduction delivery. If current levels of public and private interest in forest
conservation through REDD+, and REDD+ via CFM, are to be maintained and
expectations are to be met, this divergence in discourse and practice needs to be
addressed.
50
Chapter 3: Case study site
3.1. Introduction Sustainable forest management in Ethiopia has been hindered by political
instability and a country-wide focus on increasing food production and security. In
2005, the Woody Biomass Inventory and Strategic Planning Project (WBISPP)
reported that 13 million ha of forest remained in Ethiopia covering 12% of
Ethiopia’s land mass. Country-wide forest losses of 140,000 hectares each year are
driven by conversion to agriculture, and unsustainable forest management,
underpinned by poor governance, uncertain land tenure and a rapidly growing
population. High levels of poverty characterise the country, 78% of Ethiopia’s
population live on less than US$ 2 per day and GDP per capita was reported as
US$221 in 2010 (WDI, 2011). Forest conservation that can also meet livelihood and
development needs in Ethiopia is therefore necessary.
In the Bale Mountains Eco-Region (BME), deforestation rates are four times the
country-wide average. A forest conservation intervention, referred to in this thesis
as the Bale REDD+ Project, is underway to devolve management responsibilities to
communities while also generating emission reductions through avoided
deforestation. The Bale REDD+ Project that achieves REDD+ via CFM could be
exemplary for the proposed scaling up of CFM across the country, as well as for a
growing number of REDD+ projects in development in Ethiopia. This Chapter
introduces the history of forest policy in Ethiopia and the proposed forest
conservation intervention in the BME on which this thesis is based.

51
3.2. Forest Management in Ethiopia
3.2.1. Ethiopia in context
Ethiopia is divided into nine administrative regional states: Afar, Amhara,
Benishangul-Gumuz, Gambela, Harari, Oromia, Somali, the Southern Nations
Nationalities and Peoples Region, and Tigray. Ethiopia’s administrative regional
states are subdivided into zones of which there are a total of 68. The most recent
census reports Ethiopia’s population at 74 million across a land area of 1,221,900
km2. Ethiopia is Sub-Saharan Africa’s second most populous nation with 84% of
the population living in rural areas (International Monetary Fund, 2007).
In 2010, a new economic plan for Ethiopia was proposed that focusses on
infrastructure, industrialisation, large-scale commercial farming, boosting the role
of small private enterprises, and improving economic governance (EIU, 2010). This
presents possible risks of land grabs and big commercial farms may threaten the
retention of forested areas. Since 2000, a loss of 140,000 ha of forest annually, or
1.1% has been reported (WBISPP, 2005). Recent exploration of the main drivers of
deforestation and forest degradation in Ethiopia identify the small scale conversion
to agriculture, large scale conversion to agriculture, and unsustainable forest
management (R-PP, 2011).
Any forest conservation efforts in Ethiopia must be managed alongside
development plans. The country ranks low, at 174 of 187 countries on the Human
Development Index in 2011. With key links between human wellbeing and the
maintenance of ecosystem goods and services being made in Ethiopia’s recent
environmental policy, the renewed positive attitude to natural resource
conservation, and an emerging participatory approach to management, could
52
prove profoundly helpful for meeting both development and poverty reduction
goals.
3.2.2. Forest management: past to present
Ethiopia’s forests were historically under traditional management practices
throughout the 19th Century. The Gada system, for example, divided society into
age classes, the peak of which males entered the Gada council for a period of eight
years. These elders were responsible for day-to-day jurisdiction as well as
reiteration and introduction of the locally agreed rules and norms of resource use
(Wakijira et al., in press).
In the 20th Century, under Menelik resource management was centralised and in
the 1940s, Emperor Haile Selassie privatised land. This limited people’s access to
forests and eroded traditional forest management practices as elders’ functions
were to promote central policies rather than maintain and adapt local informal
institutions. To protect Ethiopia’s biological diversity, however, the Ethiopian
Wildlife Conservation Organisation was founded in 1964 to form a network of
protected areas.
Overthrowing Haile Selassie in 1975, the Derg socialist military regime, or
Provisional Military Administrative Council, came into power. Forest management
was further centralised but land ownership was nationalised (Mekonnen, 2000).
This made all forest use prohibited, further eroding local institutions for forest
management (Wakijira et al., in press). Village organisations were formed that
brought together the general assembly of household heads in the village and
formed an executive committee and judicial tribunal. Again, these were in place to
implement directives, decisions and orders that came from higher officials and

53
central government, rather than to continue local resource management
institutions. By this time the traditional management systems in Ethiopia had been
eroded.
The central government did form state owned Forest Priority Areas, National
Parks, Game Reserves, Sanctuaries and Controlled Hunting Areas. However, these
were poorly implemented. Forest Priority Areas established by the government
were largely nominal and forests were perceived to be for exploitation rather than
protection. Of 58 Forest Priority Areas only 48 were demarcated, 5 inventoried, 4
had management plans, and none were legally constituted (or gazetted) (Teketay
et al., 2010). Furthermore, only two of the nine National Parks and three wildlife
sanctuaries have ever been gazetted.
Encroachment into forest areas for informal and uncoordinated resource use has
been experienced across Ethiopia as a result (Macqueen, 2008). Rebel force
occupation of the forests and the protracted civil war and political instability in
Ethiopia also contributed to the degradation of many forest areas. Displaced
communities were known to settle in a number of Ethiopia’s neglected National
Parks.
The defeat of the Derg in 1991 by the Ethiopian People’s Revolutionary Democratic
Front (EPRDF) ended political suppression and initiated extensive economic
reform within Ethiopia. The economic reform was largely focused towards poverty
alleviation through efforts to increase the productivity and efficiency of agriculture
(Abrar et al., 2004). With countrywide issues of food security and land scarcity,
there was, and still remains, clear justification for policies encouraging agricultural
intensification in Ethiopia (Byerlee et al., 2007, Diao and Pratt, 2007). Agricultural

54
output contributes 50% of GDP and 90% of output arises from smallholder farming
on micro-holdings (Shiferaw and Holden, 1999, Shiferaw and Holden, 2000).
The success of agricultural intensification efforts so far, however, is questionable.
The ongoing public investment and provision of technology for agricultural
intensification has not led to higher or more sustainable cereal yields, reduced food
aid dependency, improved food security or lower prices for staple crops (Byerlee
et al., 2007, Spielman et al., 2010). Grain production in Ethiopia did grow by 74%
between 1989/90 and 2003/04, but cultivated area increased by 51% (Gebreselassie,
2006). These productivity gains, therefore, have been attributed to the expansion of
agricultural land rather than successful agricultural intensification (Byerlee et al.,
2007, Diao and Pratt, 2007).
The continued investment in agricultural intensification may have come at a cost to
natural forests, however. With no dedicated central government forest ministry,
the Ministry of Agriculture and Rural Development is responsible for the
formulation of forest resource relevant policies, laws and for the provision of
technical support to the Bureaus of Agriculture and Rural Development in each of
Ethiopia’s regional states. At the local-level, Agricultural and Development Agents
have focussed on their responsibilities for agricultural development activities and
given less attention to natural forest conservation. The substantial annual forest
losses and the unsustainable exploitation of Ethiopia’s forests threaten the
livelihood security of the rural population. The WBISPP indicated that 70% of
woredas consume wood products faster than they can be replaced (WBISPP, 2005).
Furthermore, Ethiopia’s population is growing rapidly at 2.6% (FDRE, 2008).
Federal government’s current attitude to forest conservation and natural resource
management has been more promising since sever forest fires of 2000 (Wakijira et
55
al., in press). Several environmental initiatives have been adopted. In 2005, a new
Wildlife Development Conservation and Utilisation Policy and Strategy was
accepted, uniting previously unrelated policies for wildlife, biodiversity and
environmental protection. It also highlights key links between human wellbeing
and the maintenance of ecosystem goods and services; it supports environmental
valuation approaches as well as PES.
In 2007, the government issued a proclamation for Forest Development,
Conservation and Utilisation (542/2007). This proclamation divides forest into state
and private ownership, but under both, makes provision to engage communities in
forest management (Moges et al., 2010). It is under the guidance of this federal
policy and proclamation, in combination with the Environment Policy of Ethiopia
and the Conservation Strategies of Ethiopia, that regional states then administer
Ethiopia’s forest resources.
3.2.3. Community forest management in Ethiopia
The deforestation and degradation of Ethiopia’s forests is exacerbated by total
government ownership of land: the common property of the state and the people,
land shall not be subject to sale or exchange (Amente and Tadesse, 2004). This has
prevented a mass rural-urban migration, where infrastructure is not sufficient to
support an influx of people. But the uncertainty of tenure has generated
disincentives for the rural population to maintain ecosystem quality or for farmers
to invest in productivity improvements. The state forest authorities also lack
resources to sustainably manage the forests (Amente and Tadesse, 2004). Thus
while forests are legally owned by the government, they are utilised by local
communities with a lack of law enforcement and many of Ethiopia’s forests have
characteristics of an open access regime on a common pool resource.

56
Although issues of property and use rights of land and forests remain, there is
strong support for CFM across Ethiopia. CFM involves the legal transfer of forest
use rights from the government to community-based organisations (CBOs) - the
small groups of households that sign forest use agreements – enabled by and
dependent upon a negotiated Forest Management Agreement outlining forest
management plans and the implementation of sustainable forest management
practices.
The policy and legal framework of CFM in Ethiopia is driven predominantly by
the 2007 proclamation for Forest Development, Conservation and Utilisation
(542/2007), the Environment Policy of Ethiopia and the Conservation Strategies of
Ethiopia also play a role. Of course, CFM is not the only forest conservation
measure that Ethiopia is pursuing. The protected area system is still in existence
and the Ministry of Agriculture and Rural Development is currently implementing
a national level Protected Area System Plan (PASP).
The CFM approach in Ethiopia has been employed for more than a decade in both
Oromia and the Southern Nations Nationalities and Peoples Region. Efforts have
been largely driven and supported by NGOs: FARM Africa with SOS Sahel, and
the German Technical Cooperation (GIZ). CFM is now supported at the national
level and a country-wide CFM programme is being scaled-up. This requires
substantial finance, some of which is being provided by the European
Development Fund (R-PP, 2011). In 2009, the Strengthening Sustainable
Livelihoods and Forest Management Programme was commenced in four regional
states of Ethiopia with a vision to see government authorities incorporating CFM
in annual plans, budgets and management structures (SSLFM, 2010).

57
CFM is supported in Ethiopia despite weak evidence on its long-term
effectiveness. In 2001, FARM-Africa worked to implement CFM in Bonga Priority
State Forest of the Kafa zone of the SNNPR. A moist tropical forest,
implementation of CFM appears to have positive impacts on the state of the forest
and living conditions within the project lifetime, but continuation of CFM appears
threatened by weak government support for the scheme after the NGO support
was terminated (Gobeze et al., 2009).
In Oromia, three CFM areas exist in the forests of Chilimo, Borena and Adaba-
Dodola. Chilimo, in the West Shewa zone of Oromia, is a highland montane forest
where FARM Africa initiated a pilot CFM project in 1996, although it was not until
2004 that the first forest user group was established. It is believed that CFM has
improved people-forest relationships with reduced deforestation, increased
regeneration and the empowerment of locals. However, in a largely qualitative
exploration of the intervention, Kassa et al. (2009) suggest that the technical,
managerial and administrative capacity of the CBOs need to be strengthened and
efforts to diversify livelihood options are still needed to reduce human pressures
on the forest. In Borena, CFM implementation has proved more challenging. A
lowland Juniper forest in the Borena and Guji zones of Oromia, where livelihoods
are more pastoral, forest based enterprises are producing low returns for farmers
and land conflicts have arisen (Getahun et al., 2007).
The Integrated Forest Management Project Adaba-Dodola, a project of both the
government of Ethiopia and GIZ, was implemented by the Oromia Rural Land and
Natural Resources Administration Authority in June 1995. Located within the
BME, plans to scale up CFM across the region will build on the lessons learnt in
Adaba-Dodola. The goal of the project was to establish Forest Dwellers
Associations, or Waldaa Jiraatotaa Bosonaa (WAJIB) in Oromo, where members
58
protect the forest and carry out management activities and restrict their expansion
of farm plots in return for rights to live in the forest and generate forest-based
benefits. Forest blocks constituted 300 to 500 ha and not more than 30 households,
based on a forest carrying capacity of 12 ha per household established from
previous CFM experience (Kubsa and Tadesse, 2002, SUN-Dodola, 2005). A
functioning WAJIB consists of a general assembly, an executive committee and
various other committees elected by members. Each WAJIB group has its own by-
laws (internal regulations), that govern use, protection, rights and responsibilities
of each household within the forest block. The forest administration is providing
mostly technical advice on the development and sustainable utilisation of forests.
Positive impacts of this CFM effort, to date, have been the improved forest
condition and management. Rural livelihoods and social welfare are also reported
to have improved, although not quantitatively (Kubsa and Tadesse, 2002, Tesfaye
et al., 2011).
In spite of a lack of evidence in Ethiopia and more broadly in Africa, CFM
approaches have been adopted across East and Southern Africa (Wily, 2000). In
Tanzania, for example, the 1998 Forest Policy made a commitment to bring more
forest and woodlands into village forest reserves. In 2010 it was reported that since
2005 more than 500 village forest reserves were declared by communities from
communal lands (Wily, 2010). Also in her 2010 review, Wily notes that such
management approaches are sufficiently widespread in Africa to be recognised as
a route to securing and sustaining forests. The review also indicates how the
concept has evolved to recognise that forest management is a matter of governance
and, increasingly targeted at the grassroots level, the empowerment of local
communities as owner-managers through devolution of responsibilities has been
important.
59
3.2.4. Forestry Carbon in Ethiopia
Efforts to establish REDD+ projects and activities have often focussed on countries
where forest areas are more substantial and the carbon contained within the forests
is very high. This includes Brazil, Indonesia and the Democratic Republic of the
Congo where the majority of international finance to support REDD+ development
has been channelled (Climate Funds Update 2012). Establishing REDD+ in
Ethiopia, therefore, may not contribute significantly to reducing emissions from
deforestation assessed at an international scale. Ethiopia may not receive as
substantial financial transfers as other tropical forested nations under an
international REDD+ mechanism established by climate change negotiations.
REDD+ does, however, contribute to internalising the externality of climate
regulation. It could provide a source of finance that changes the economic
incentives to make forest conservation more economically viable and it necessitates
the discussion and review of property rights regimes in forested areas.
Signatory to the United Nations Framework Convention on Climate Change
(UNFCCC), and the Kyoto Protocol, political and public awareness of climate
change issues is increasing rapidly in Ethiopia. This can be partly attributed to the
presence of Prime Minister Meles Zenawi at the United Nations Climate talks and
national media campaigns up until his death in 2012.
Ethiopia’s growing interest in REDD+ also stems from a number of organisations,
NGOs in particular, which have begun to explore the potential for such forest
carbon projects. The Humbo Community-Based Natural Regeneration Project,
developed by World Vision Ethiopia and Australia, was the first forest carbon
project in Ethiopia. An afforestation/reforestation project covering 2,728 ha in the
southwest of Ethiopia, the project aim was to restore indigenous forest species to

60
the land. In 2009, the Humbo project was registered under the CDM of the Kyoto
Protocol and the World Bank Bio Carbon Fund has purchased the emission
reductions generated by the project (FCPF, 2011). Following the success of this
project, four further CDM projects are under development (R-PP, 2011). The
development of avoided deforestation and degradation activities in Ethiopia has
also taken off, although no REDD+ projects are yet certified and generating
emission reductions for sale. NGOs instrumental in driving REDD+ in Ethiopia
include Farm Africa, SOS-Sahel, World Vision Australia, and Save the Children
US.
Ethiopia is also a member country of the World Bank’s Forest Carbon Partnership
Facility (FCPF). A multilateral REDD+ initiative, the FCPF builds capacity for
REDD+ and tests a programme of incentive based payments through grants to its
37 member countries (FCPF, 2011). In 2011, a revised Readiness Preparation
Proposal (R-PP) outlining a national REDD+ strategy for Ethiopia was formulated.
Financing to implement the R-PP was estimated at US$12,495,000 with a timeline
of completion in 2014. During the R-PP preparation a number of workshops and
consultations were carried out. In-country capacity is building for REDD+ and
activities of the RPP are already in progress. In November 2012, US$ 3,400,000 was
approved for the R-PP.
With REDD+ activities in their infancy, the legal and institutional setting in
Ethiopia is uncertain. The Environmental Protection Authority of Ethiopia is
currently chairing the REDD+ process in Ethiopia with a REDD+ steering
committee and REDD+ technical working group also established. The
Environmental Protection Authority will hand over to a federal agency dedicated
to forestry once it is created. Plans exist to develop regional steering committees
and technical at REDD+ sites. More on the legal and institutional setting of REDD+
61
in Ethiopia is expected as the R-PP grant progresses through its three phases, with
the preparatory phases spanning the next four years.
Ethiopia can stand to learn from other countries in the region and their experiences
with REDD+. The drivers of deforestation in Ethiopia are similar to those in other
East African countries such as Kenya, Tanzania and Uganda. In all of these
countries efforts are underway to build national REDD+ capacity and REDD+
projects. Tanzania in particular, with 40% forest cover, has commanded a lot of
attention and US$ 131 million has been approved for REDD+ activities through
dedicated public climate funds (Climate Funds Update, 2012).
In Ethiopia’s national REDD+ strategy, it is acknowledged that substantial work is
to be done. In particular, a national forest inventory with a view to determine
carbon stocks and a deforestation baseline is required. To date detailed
measurement on Ethiopia’s vegetation coverage, and changes in this cover over
time, are largely inadequate with conflicting information and no regular
inventories (Teketay et al., 2010).
With 100% publically owned forest, REDD+ in Ethiopia will require clarification of
forest use and carbon rights and substantial engagement and participation of the
84% of the population that resides in rural areas. Governance is also important for
investors and Ethiopia ranks low in the World Bank Governance Indicators. For
political stability and absence of violence Ethiopia has a score of -1.71 in 2010,
where country scores range between -2.5 to 2.5 and higher values correspond to
better governance. For government effectiveness Ethiopia ranks -0.35, for rule of
law -0.76, and for control of corruption -0.70 (WGI, 2010).

62
Without a national level forestry institution, designing and managing REDD+
financial structures and benefit sharing mechanisms may also prove challenging.
Although the R-PP does mention that a body that bypasses ‘normal administrative
budgetary functions’ will be established that can ensure dispersal of REDD+ funds to
the local-level (R-PP, 2011). Ethiopia’s R-PP also highlights the excessive
expectations that exist for REDD+ activities to address issues of deforestation and
forest degradation as well as reducing poverty in the country. Ethiopia’s R-PP,
however, is highly supportive of pursuing REDD+ through community forestry. It
is integral as a source of funding for community forestry as well as community
forestry as a way to reduce deforestation.
3.3. The Bale Mountains Eco-Region
3.3.1. The south eastern Ethiopian highlands
The BME forms part of the Bale-Arsi massif in the south eastern Ethiopian
Highlands (Figure 2). Although it is named an eco-region by local implementers,
the BME is not a WWF eco-region, which is defined as a large unit of land or water
containing a geographically distinct assemblage of species, natural communities
and environmental conditions. It is referred to in this thesis as an eco-region,
however, to be consistent with the Bale REDD+ Project implementers at the case
study site as well as the national use of the term to refer to this area.
The BME falls within the Oromia regional state, the most populous province in
Ethiopia with a population of 27,029,760 in 2007 (FDRE, 2008). 70% of Ethiopia’s
remaining forest is in Oromia (Macqueen, 2008). The Bale zone is found between
50˚22'-80˚08'N and 38˚41-40˚44'E. Zones are further divided into woredas, or
districts, that are managed by a local government of which there are around 550.
The BME within the Bale zone, covers 2,217,600 ha over fourteen woredas: Adaba,

63
Agarfa, Berbere, Dinsho, Dodola, Gasera, Goba, Gololcha, Goro, Harenna Bulluk,
Kokosa, Mena, Nensebo and Sinana. These woredas are composed of kebeles, or
villages, which are the smallest local government unit (Figure 3).
Figure 2. Map of Ethiopia and the Bale Mountains Eco-Region. Located in Oromia regional state, the Bale Mountains Eco-Region (BME) lies 400km south east of Addis Ababa, the capital of the Federal Democratic Republic of Ethiopia a land-locked nation in the horn of Africa bordered by Eritrea to the north, Somalia and Kenya to the south and Sudan to the west. Source: author generated
3.3.2. Ecological context
The annual temperature of the Bale zone is 17.5˚C ranging from 10˚C to 25˚C, with
annual rainfall of 875mm experienced in one long season between June and
October, and one short rainy season between March and May (Yimer et al., 2006).
This range obscures the substantial topographic variation which characterises the
vegetation in the BME (Figure 3). Distinctive endemic flora and fauna of the Bale
64
Mountains result from its isolation from the bulk of the Ethiopian highlands and
its topography and climatic history (Hillman, 1986, Yalden and Largen, 1992).
The afro-alpine plateau of the central area of the BME reaches more than 4000
metres above sea level (masl). Containing Erica, Giant lobelia (Lobelia rinchopatelum)
and Helichrysum, this is the largest remaining area of Afroalpine habitat on the
African continent (BMNP, 2007). South of the plateau the altitude falls rapidly with
moist tropical forest between 2600 masl and 1500 masl. The moist forest is
characterised by Hagenia abyssinica and wild coffee (Coffea arabica). Lions and
African wild dogs are also still found in this forest which is the second largest
stand of moist tropical forest in Ethiopia. North of the plateau habitats comprise of
dry forest, woodlands, grasslands and wetlands, largely between 2500 masl and
3500 masl. The dry forests contain high-value commercial species such as Juniperus
procera and Podocarpus falcatus as well as Prunus africanus, a threatened species. The
lower altitude land of the south east of the BME, below 1500 masl, is dominated by
acacia woodland (Teshome et al., 2011, UNIQUE, 2008).
The BME is part of one of 34 global biodiversity hotspots which contain more than
1,500 species of vascular plants as endemics and it has to have lost at least 70% of
its original habitat; it falls within the Eastern Afro-Montane biodiversity hotspot
(Myers et al., 2000, Conservation International, 2012). This ranges from Saudi
Arabia and Yemen to Zimbabwe, taking in a number of mountain ranges. The
habitats of the BME host a rare and endemic species including the Ethiopian wolf
(Canis simensis), Mountain Nyala (Tragelaphus buxtoni), and the Giant mole rat
(Tachyoryctes macrocephalus). This ecological importance was acknowledged by the
establishment of the Bale Mountains National Park (BMNP) in 1971, which lies at
the heart of the BME. The (proposed) BMNP is stated to be one of the most
important conservation areas in Ethiopia (FDRE, 2005). The 220,000 ha park was

65
actively managed until 1991 but resources within the park boundary, particularly
forests, are currently being used unsustainably.
Figure 3. Forests of the Bale Mountains Eco-Region. The woredas, or districts, of the Bale Mountains Eco-Region (BME) vary widely in their forest cover, with forest divided into broad categories of moist forest, woodland and dry forest. The (proposed) Bale Mountains National Park lies at the centre of the BME, and the three survey locations are distributed across the BME. Source: author generated
3.3.3. Forest use in the Bale Mountains
The dominant livelihood strategy in the BME, as in wider Ethiopia, is small-scale
farming using traditional technologies for low input, low output rain-fed mixed
farming (World Bank, 2007, Rosell, 2011). Households cultivate crops on distinct

66
land plots. Most commonly cultivated are cereal crops including Maize, Teff,
Wheat, Barley, and Sorghum. Households also engage in livestock rearing for meat
and milk products, manure, draught power, transport and skins. Livestock also
play a role in marriage, dispute settlement and ritual performances (BMDC, 2003).
Rural households gather many products from the forest and where valued can
make up a significant portions of their income.
Under a total environmental value framework, the forest produces a variety of
direct, indirect, option and non-use values (Pearce and Warford, 1993). Direct use
values that more tangibly contribute to household income include: NTFP such as
honey, coffee, medicinal plants and fuelwood; timber and construction products;
recreation; and livestock grazing lands. Tesfaye et al. (2011) estimated such forest
incomes contribute to 34% of per capita income in the BME. This aligns with other
research on forest income reliance such as Babulo et al. (2009) who find households
derive 27% of income from forests in northern Ethiopia, and Mamo et al. (2007)
who find 39% of incomes are derived from forest in central Ethiopia. A lack of
employment opportunities restricts the diversification of livelihoods in the BME,
thus crops, forest and livestock are the three main livelihood sources.
Indirect use values accruing to households include carbon sequestration and
watershed protection. The Bale Mountains have been described as a water tower
and the hydrological system supplies water to an estimated 12 million people in
the lowlands of south eastern Ethiopia, northern Kenya and Somalia (BMNP,
2007). Option values include pharmaceuticals and the genetic library of
biodiversity. Arabica coffee, for example, has its origin in Ethiopia where it occurs
naturally and so the diverse gene pools of wild coffee populations have potential
options for new coffee varieties (Schmitt et al., 2009). Non-use values include
cultural values placed on forests, values held for endemic species, and landscape
67
beauty. Burial sites, for example, exist in the forest and deforestation is regulated
in these small areas by local communities.
The forest use in the BME, however, is unsustainable as across wider Ethiopia.
There is rapid deforestation to procure land for crops and livestock grazing and to
meet livelihood needs through timber and firewood extraction (BERSMP, 2006,
BMNP, 2007). The lack of human and financial resources, political interest and
technical knowledge, combined with population growth and immigration to the
area also contribute to forest losses (BMNP, 2007). Between 2001 and 2009 the
average annual deforestation rate in the BME exceeded the countrywide rate of
forest loss. Average deforestation rates in the BME were 3.44%, ranging from 1 to
8% (Dupuy, 2009). There is evidence that this rate is accelerating, particularly in
the moist forest of the (s) BMNP where deforestation rates have increased from
1.64% in 1973-2000 to 15.0% between 2000 and 2006 (Teshome et al., 2011).
3.4. The ‘Bale REDD+ Project’: REDD+ via Community Forest Management in
the Bale Mountains
3.4.1. Project outline
To address the decline in forest area, the Oromia Forest and Wildlife Enterprise
(OFWE) are implementing CFM across all forests of the BME. The intention is to
generate REDD+ as a result of CFM implementation. While CFM and REDD+ can
both be undertaken as separate policy interventions, in the BME these are therefore
considered together: the Bale REDD+ Project undertakes REDD+ via CFM. Thus
emission reductions do not have to be additional to that achieved through CFM,
but rather are those generated by CFM.

68
Covering more than 900,000 ha, the proposed Bale REDD+ Project area consists of
the dry and moist tropical forest as well as the southern woodlands of the BME. In
2008, a report on carbon finance in the BME was undertaken by external forestry
consultants identifying good opportunities for REDD+. The Bale REDD+ Project
builds on this pre-feasibility study and aims to gradually reduce deforestation
below the BAU baseline of 4% per annum to 1% by project-year 20. In order to
achieve these emission reductions, CFM will create a common property regime in
the BME.
Under the Bale REDD+ Project, households in the BME will experience a change in
forest access from a de facto open access regime to a de jure common property
regime. To do so, a set of identifiable forest users who hold the resource and that
can exclude others and regulate use will be formed as a CBO group. It is proposed,
that forest blocks of 300 to 500 hectares are allocated to not more than 30 member
households. Entry into the CBO groups will be controlled. Eligibility for
membership relies only on the fact that you live in the Kebele, and entry is
voluntary. In order for user groups to be a legal entity under Ethiopian law there is
a nominal registration fee in the region of ETB5. These groups will be created
without assessment of the carrying capacity of the forest, but will rely on adaptive
management to revise the management plan every three years to ensure forest use
becomes more sustainable over time.
The rights and duties of households under CFM will be formalised in contracts
signed between CBOs and the forest agency. Rights of the CBO include settlement
and grazing, maintaining existing farm plots and using forest products for
consumption and sale. Thus while they will be given use rights – in contrast to the
status quo where forest use is not allowed – they will not be given land rights.
69
Aside from the secured use rights, the exact conditions and managerial
responsibilities of communities will be defined in a participatory manner with the
communities in question. These byelaws agreed by the communities are likely to
include restrictions on further settlement and agricultural expansion and for initial
forest cover to be maintained. Fuelwood use will also be determined in the
byelaws; for example, where CFM has progressed in the region the number of days
per week that dead wood can be collected for fuel is now limited. Periodic forest
cover assessments and settlement censuses will therefore be agreed by the CBO
and Forest Agency. The Forest Agency is expected to safeguard CBO groups
against free-riders and enforce sanctions in the case of non-compliance.
The specific roles of CBO members will also be determined under the byelaws, but
members will be required to work free of charge. This will mean that households
incur transaction costs of CFM. Transaction costs of CFM include through
meetings, such as for the arrangement and negotiation of forest areas and byelaws,
as well as monitoring and enforcement. This has and is occurring in the
community to manage other communal resources. For example, Oromo
pastoralists use mineral springs (horas) for their livestock (cattle, sheep and goats)
as they are perceived to enhance fat, fertility and resistance to diseases of livestock.
Horas are maintained by the communities that use them most frequently for free,
this includes establishing and maintaining fencing as well as cleaning of excess
mud (Chiodi and Pinard, 2011).
The core CBO committee will meet regularly and will be required to patrol the
forest in crucial times, such as harvesting season for forest coffee. Where byelaws
are broken, individuals must appear in front of the elders committee to be
sanctioned. Only repeat and serious offenders will be sent to Woreda level for
sanctioning. Pro-poor provision can also be designed by the CBO group

70
themselves. There is past experience of such provisions in the traditional forest
management systems in the Bale Region. For example, under the Gada system
contributions of forest coffee beans from the moist forests were collected and
redistributed to families unable to collect their own as a result of illness, physical
disability or old age (Wakijira et al., in press).
BERSMP are also undertaking efforts to sustainably increase agricultural
production, establish woodlots, promote fuel-efficient stoves and biomass
briquettes, improve forest fire management, and add value to forest products
(BERSMP, 2006). Measures that substitute for fuelwood demand are critical in
order to address the drivers of deforestation in the BME. Progress towards the
establishment of woodlots led by OFWE has been progressing slowly, however.
Such woodlots are unlikely to take less than 3 years to be established, and there is
uncertainty over community contributions, such as labour, will be required. There
has been more success with energy efficiency measures; with fuel-efficient stove
distribution widespread. BERSMP is also supporting home planting in backyards
and group woodlots to try to meet needs and buffer plantations are under
consideration.
The Bale REDD+ Project is still in early stages with regards to REDD+
development; a Project Design Document is underway. As a result, no further
decisions have been taken on the shares of carbon revenues to stakeholders,
including communities. To date, the costs of REDD+ project development and
capacity building for REDD+ have been absorbed by BERSMP. A trust fund
handling monetary aspects of the ERPA supervised by a board including NGO,
CBO and state institution members has been proposed (UNIQUE, 2008).
71
3.4.2. Bale REDD+ Project implementers
The roll-out and scaling up of CFM across the BME is supported by the Bale Eco-
Region Sustainable Management Programme (BERSMP). Initiated in 2007,
BERSMP is an operational partnership between the Government of Ethiopia
(Oromia Regional Government, Bureau of Agriculture and Rural Development,
and the Food Security and Disaster Prevention and Preparedness Commission)
and NGOs FARM-Africa and SOS Sahel Ethiopia. It is these organisations that are
referred to as the Bale REDD+ Project implementers in this thesis.
BERSMP has a distinct goal to mutually and sustainably enhance the unique
biodiversity and ecological processes of the BME and the social and economic
wellbeing of the communities dependent on the natural resources. Six programme
outputs to achieve this are: an Eco-Region plan, building government and
community capacity for sustainable natural resource management; functional and
sustainable natural resource management and conservation systems, incorporating
environment and community needs; diversification of community natural resource
based livelihoods; sustainable financing mechanisms that benefit government and
communities; and, improved legal, policy and regulatory frameworks (BERSMP,
2006).
OFWE, a semi-autonomous agency of the Oromia government, was created in 2007
under the decentralisation of forest management to the regions of Ethiopia. Its
function is to coordinate the eight forest enterprises of Oromia. The BME falls
under the jurisdiction of two forest enterprises; the Bale Forest Enterprise and the
Arsi Forest Enterprise. Although they remain government agencies, the forest
enterprises are run and organised like private sector businesses. Revenues and
72
profits, largely from plantations, are earmarked for reinvestment into local-level
development (Macqueen, 2008).
3.4.3. Project legal and institutional framework
The regional states of Ethiopia develop their own forest regulations under the
guidance of federal proclamations (see Section 3.2.2). Oromia, where the BME is
located, has become a leader for forest policy and conservation strategy (R-PP,
2011). Oromia’s Forestry Proclamation (72/2003) was the first to legally recognise
the ownership and participation of communities in forest management. It
therefore, goes beyond the federal Forest Development, Conservation and
Utilisation Proclamation (542/2007) which recognises both private and state
ownership of forests, by separating out community forestry as a distinct form of
ownership. The legal basis for REDD+ at the case study site, as in wider Ethiopia is
yet to be determined.
Under the CFM arrangements CBOs will be given forest use rights, but not land
rights which remain in the ownership of the state. OFWE will likely remain the
legal owner of the emission reductions generated from REDD+ and therefore will
act as the lead contractor in Emission Reductions Purchase Agreements (ERPAs).
OFWE would then sign contracts with CBOs under the proposed carbon finance
scheme, and the Forest Enterprises (Bale and Arsi) would act as executive entities
for implementation and monitoring of REDD+ implementation.
CFM necessitates interplay between formal institutions and traditional, customary
rules. The tradition Oromo cultural and political system, the Gada, is an age-set
democratic political institution. Oldest rules refer to the limited time periods when
grazing was allowed in the forest (determined annually according to rainfall

73
patterns). The forest coffee harvest period also had strict limits and sanctions
imposed for breaking these included social exclusion and deprivation from social
support (Wakijira et al., in press). Although traditional forest management has been
in decline (see Section 3.2.2), there is strong institutional memory in the Bale
Mountains and many remember the Gada’s management of the forest as it relates
to livestock grazing, beekeeping and forest coffee harvesting. It remains to be seen,
however, if such institutional memory will aid the implementation of CFM in the
BME.
3.5. Survey locations
Three survey locations were selected within the BME for household surveys and
forest carbon stock assessments. The survey locations fall in three woredas and are
henceforth referred to as: Agarfa, Goro and Delo Mena (Figure 3; Figure 4).
Travelling by truck, public bus, horse and foot, survey locations were chosen on
the basis of logistical feasibility, but also to represent the three major forest types
found in the BME: dry forest, moist forest and woodland.
Initial fieldwork plans had proposed multiple survey locations in each forest type.
Delays in research permissions and transport difficulties, however, restricted
surveys to only three locations and reduced the sample size. The presence of three
survey locations in three forest types means that the effects cannot be separated
from other location differences for example in demography or infrastructure.
Secondary data were also gathered at each location to provide contextual
information to aid the interpretation of the findings (Table 1). These were sourced
from village officials, key informants, focus groups as well as Bale REDD+ Project
implementers at the case study site.

74
The Agarfa woreda borders with the Arsi zone of Ethiopia. The woreda is bounded
by the Genale river and the Wabe Shabele river with numerous tributaries of these
river basins flowing through the region. Within the Agarfa woreda the dominant
forest type is dry forest with more than 35,000 ha. Altitude varies between 1000
and 3000 masl and mean annual temperatures are 17.5 degrees Celsius. Tree
species found in the dry forest include Juniperus procera and Podocarpus falcatus. The
Agricultural and Rural Development Office estimates 11.5% of Agarfa’s land is
covered by natural forest and less than 1% with manmade forest, or plantations.
Table 1. Survey location general characteristics
Characteristic Description Survey location
All BME #1 #2 #3
Woreda The name of the district in which the survey village is found
Agarfa Goro Delo Mena
-
Kebele The name of the surveyed village(s)
Dera Honsho/ Galema Hebano
Walta’i Mana
Irba -
Population The total population 7703 1529 4465 1,307,078 Households The number of households 1149 255 1170 217,846
HH surveyed The number of household surveys undertaken
87 50 98 235
Proportion of HH surveyed
The proportion of total village households surveyed
8% 20% 8% 0.1%
Forest type Forest category Dry forest Woodla
nd Moist forest
(all)
Forest area The area of forest 35,107 5,938 10,673 923,593
The Agricultural and Rural Development Office indicates that 86% of Agarfa’s
population is rural, with a high proportion of young and few old people resulting
in high population growth. The BERSMP estimate population density of 65 to 83
people per km2. The economic base is rain-fed agriculture including traditional and
small-scale cattle rearing. Close to 30% of the total land area of the woreda is

75
agricultural land, and a further 30% is grazing land. There is a dirt road that
connects Agarfa to the main all weather road that runs from Robe, the
administrative centre of the BME with Awassa, in turn linking to Addis Ababa, the
capital. Agarfa is approximately 30 km from Robe, the district centre. However, the
form of transport within Agarfa is mainly traditional use of pack animals and
humans, for fuelwood loads for example. The total population of the two survey
kebeles in Agarfa – Dera Honsho and Galema Hebano – is an estimated 7703,
consisting of 1149 households.
Goro woreda has mean annual temperatures of 27 degrees Celsius, but reaching up
to 35 degrees Celsius, with annual rainfall of 1900mm. Woodland covers 5,938
hectares and is dominated by acacia. BERSMP estimate that this covers 23% of the
total woreda area. Land use is largely cultivated and dominant livelihood is
agriculture, including livestock rearing; 39% of the woreda’s area is under
agricultural production and 3% is grazing land. An estimated 93% of the
population of Goro is rural. Population density is estimated by the Agricultural
and Rural Development Office at between 24 and 49 people per km2. Goro lies
about 60km from Robe, the administrative centre of the BME. As in other survey
sites, the predominant transport form is pack animal. The population of Walta’i
Mana is an estimated 1529 and 255 households.
Mean annual temperatures in the Delo Mena woreda are 29.5 degrees Celsius and
mean annual rainfall is 700mm. Moist forest covering 10,673ha characterises Delo
Mena with Hagenia abyssinica and Coffea arabica characterising the forest: the
name of the district comes from the combination of Oromo words Dalaa and Buna
which mean “a core place of coffee”. It is estimated by the Agriculture and Rural
Development Office that 65% of the woreda’s area is under forest cover.
76
The Agriculture and Rural Development office estimates Delo Mena’s population
density of between 11 and 19 people per km2. Most inhabitants are engaged in
agriculture, with 86% of the population rural. This is despite domination of forest
cover in the woreda; only 3% is under crop production and 21% is grazing land. As
the elevation declines in the woreda, the livestock populations increase with the
rising temperatures. Delo Mena is 125km from Robe, the district centre of the BME.
An all-weather road connects Delo Mena to Robe, however, it can be a very long
journey despite the short distance in the wet season. The Irba kebele in which
surveys were undertaken in Delo Mena has an estimated 4465 people across 1170
households.
Across all sites there is limited access to modern energy sources. In the urban parts
of BME fire-wood, charcoal, kerosene and electricity are major sources of energy,
while in rural areas fire-wood, dung, crop residue, charcoal and occasionally
kerosene are used. Each survey site has its own market days in which produce is
traded informally for cash. Sometimes goods are also taken to regional markets by
pack animal to be traded in the larger towns of Robe and Goba.
3.6. Conclusion A history of political instability and a drive towards agricultural intensification has
side-lined forest conservation in Ethiopia. With rising acknowledgement that forest
conservation is necessary to sustain the livelihoods of the population, Oromia
regional state is advancing CFM and REDD+. REDD+ revenues resulting from the
Bale REDD+ Project could help fund these activities and provide a pilot project for
Ethiopia. This research into the economics of REDD+ via CFM is timely at the case
study site; it adds to limited data on forest carbon stocks and socio-economic
household characteristics. Gathering primary data, this integrated, ex-ante study of
the proposed REDD+ via CFM intervention could also inform the intervention
77
design. The forests of the BME are typical of many forests in developing countries
that present a de facto open access regime on a common pool resource. With
REDD+ via CFM being supported more widely in East Africa and beyond, this
research also adds to the limited literature on PES, such as REDD+, on common
property regimes.

78
Figure 4. Four major forest and habitat types of the Bale Mountains Eco-Region (a) Afro-alpine habitat, (b) Dry forest, (c) Moist forest, and (d) Woodland Source: author’s photos

79
Chapter 4: Conceptual framework and methods
4.1. Introduction Drawing on both ecological sciences and social sciences, I undertake an integrated
study of the economics of CFM at a case-study site in Ethiopia. This Chapter
presents the conceptual framework of this research. An ecological approach is
followed to understand forest carbon stocks, emission reductions and REDD+
revenues at the case study site. A more social sciences approach is then adopted to
estimate household opportunity costs (OCs) of forest conservation. The approaches
are then combined to explore how REDD+ via CFM might be implemented as a
local-level PES scheme. The conceptual framework is followed by an overview of
research methods applied for forest carbon accounting, and for the estimation of
the OCs of REDD+ through household survey, market price valuation, and
scenario modelling. These quantitative methods are complemented by more
qualitative attitudinal data on the proposed forest conservation intervention which
gives context to the empirical findings. A description of the data collection and
analysis is also presented.
4.2. Conceptual framework 4.2.1. REDD+ as a PES A REDD+ mechanism recognises and rewards the positive externalities of climate
regulation provided by forest users. It involves an economic incentive that turns
standing forest into a valuable asset. It can, therefore, be regarded as a PES scheme
(Angelsen, 2008, Campbell, 2009, Fisher et al., 2011). Establishing a price and a
market, PES inherently requires the commoditisation of an environmental
‘product’. In the case of REDD+, this is the carbon stored in the biomass of trees
and forest vegetation. Forests absorb atmospheric carbon through growth and

80
release carbon dioxide (CO2) through decay, combustion and respiration. The
avoidance of deforestation slows the build-up of CO2, a major GHG, in the
atmosphere thus mitigating the impacts of climate change (Bonan, 2008). Forest
losses also result in emissions of other GHGs, particularly, methane and nitrous
oxide. Emission reductions are therefore, reported as tonnes of carbon dioxide
equivalents (tCO2e) which includes other major GHGs standardised according
their global warming potential. Following the Wunder (2005) definition of PES, the
well-defined product – a tonne of carbon emission reduction equivalents – is then
voluntarily ‘bought’ from a ‘provider’ who continually secures the supply of the
environmental service.
Based on the underlying logic that voluntary contracts can overcome the market
failures of environmental externalities, PES schemes are theoretically grounded in
the work of Coase (1960). Coase proposed that if property rights are defined and
transaction costs minimal, a socially efficient resource allocation can result from
bargaining between those willing-to-pay for an environmental externality and
those willing-to-accept compensation for its provision. Although these conditions
are unlikely to hold in real life, PES can operate where the willingness-to-pay
(WTP) for a service exceeds a provider’s OCs of alternative, or foregone, land uses
and practices, as well as their participation and transaction costs (Wünscher et al.,
2008). Considered by some to be the largest cost in studies of REDD+ (Karky and
Skutsch, 2010), in overcoming the OCs of forest conservation the payment should
be sufficient to make forest conservation more economically attractive than land
use alternatives (Pagiola and Platais, 2007, Engel et al., 2008).
It is acknowledged that PES can exist at many levels. Public schemes, for example
in Costa Rica, Mexico and China exist where the state is the buyer of
environmental services. Private schemes are often smaller-scale and more local to

81
the point of environmental service provision, with buyers often paying
stakeholders directly rather than through intermediaries (Wunder, 2005). The
differing scales inherently imply implementation and transaction costs of
payments for the variety of stakeholders depending on how it is structured. The
level at which REDD+ will operate in the future is not clear. At present, the REDD+
discourse is moving towards national-level REDD+ whereby international financial
transfers under a national REDD+ scheme will be based on national-level carbon
accounting systems with country governments, or intermediaries, then paying
subnational governments or local land owners for emission reductions.
Under some national-level proposals, REDD+ may not operate as a PES. REDD+
can be implemented through a number of policies, actions and measures and these
may include strengthening of law enforcement or reductions in logging, rather
than payments to communities local to forests (see also Section 2.1). Fisher et al.
(2011), for example, note that REDD+ in Tanzania could be implemented through
alleviating the demand for deforestation by raising agricultural yields on existing
cropland and increasing charcoal fuel-use efficiency rather than the OCs of rents
from agricultural and charcoal production. It is therefore recognised that even if
financial transfers where to be conditional and voluntary at the national level, it
may not be at the local-level, for example if national level tenure reforms and law
enforcement is put in place to reduce deforestation (see Angelsen, 2008, Olander,
2011 for reviews).
Sub-national, or project-level REDD+ experiences continue to generate most
lessons for future REDD+ implementation (Caplow et al., 2011). Alongside these
project experiences, a number of initiatives are currently building national REDD+
readiness for example the World Bank’s Forest Carbon Partnership Facility or the
UN-REDD Programme, but discussion on how national-level REDD+ would

82
operate in international climate change negotiations is ongoing (see the COP17
outcomes of the UNFCCC, 2011). I therefore consider REDD+ as a local-level PES
and assume that whether project or national-level REDD+ is pursued, or a
combination of both, incentives will still be required on-the-ground to change land
use behaviours.
4.2.2. The opportunity costs of REDD+
The foregone benefits of an alternative investment, activity or use of a resource,
private OCs of land are limited to those people directly affected by the
conservation intervention (Pirard, 2008). The OCs of forest conservation land will
be dependent on the underlying drivers of the forest loss. Broad-scale drivers of
deforestation are variable; extensive cattle ranching and large-scale soybean
production drives losses in South America and large-scale oil palm and wood
product plantations in Asia. In Africa, deforestation for small-scale staple crops
and fuelwood collection is the primary driver (FAO, 2009).
At a finer scale, the drivers of deforestation depend on returns from non-forest
land uses and are affected by accessibility to markets, climate regime, soil fertility,
as well as socio-economic variables such as commodity prices, GDP, population
growth and density (Geist and Lambin, 2001, Tomich et al., 2005, Chomitz, 2007).
A substantial body of literature on household income from forests show that forest
reliance is highly heterogeneous (Godoy and Lubowski, 1992, Byron and Arnold,
1999, Cavendish, 2000, Coomes et al., 2004, Dovie et al., 2005). The OCs of forest
conservation interventions that alter forest access and extent are, therefore,
unlikely to be identical between households.

83
The drivers of land-use change and thus OCs of land also change over time. The
future OCs incurred by local forest stakeholders will be affected by changes in
income from direct activities such as agriculture and forest product extraction. The
underlying drivers of deforestation will also play a role in influencing future OCs,
including changes in demographic, economic, technological, policy and
institutional, and cultural factors (Geist and Lambin, 2002). Where resource use is
currently unsustainable, OCs may well decline through degradation of the
resource base (Pearce and Markandya, 1987). OCs may also be altered through
direct actions of conservation interventions, for example, where attempts are made
to commercialise and increase the prices of forest products or to diversify
livelihoods (Brandon and Wells, 1992, Arnold, 2001). Conservation interventions,
however, often suffer from a lack of explicit goals and quantitative operational
targets (Margules and Pressey, 2000). This linguistic uncertainty arises from the
underspecificity, or generality of most conservation objectives (Regan et al., 2002).
With uncertainty about the future drivers of land-use change and uncertainty in
the impacts of conservation interventions on households, the OCs of forest
conservation are difficult to predict.
The utility of measuring the OCs of forest conservation for a household in the
context of REDD+ is threefold. In the first instance, the OCs of forest conservation
can be used to estimate the costs of a REDD+ intervention (Fisher et al., 2011). For
REDD+ as a local-level PES, information of the magnitude of the OCs of forest
conservation can provide information on the private incentives that must be
overcome to generate the desired level of forest conservation (Polasky et al., 2005).
This therefore helps to estimate payment levels if local communities must forgo
certain land uses, but also establishes the feasibility to the project; if OCs of forest
conservation are higher than the value of the emission reductions generated

84
through avoided deforestation or degradation then the project may not be
financially feasible for the investors to engage in.
Secondly, understanding and incorporating the heterogeneity of the OCs of
REDD+ between households into a conservation intervention design can also serve
to reduce the risks of negative social impacts. For example, by providing an
understanding of whether particular social groups are more likely to experience
higher OCs of changes in forest access than others. This is important given
growing obligations to ensure that REDD+ projects ‘do no harm’ to forest
communities (e.g. Griffiths, 2007, CCBA, 2008, Griffiths, 2009).
Finally, an understanding of how the OCs of forest conservation change through
time will also help meet these costs over time. This will better allow emission
reductions to persist into the future and increase the change of REDD+ delivering
permanent climate change mitigation benefits as the mechanism was intended. By
necessitating and understanding of the drivers of deforestation over time,
assessment of the OCs of forest conservation may also reduce the possibility of
leakage – the displacement of emission reductions – by ensuring that livelihood
needs are considered in policy making.
4.2.3. REDD+ via CFM
Although support for REDD+ via CFM is growing (Klooster and Masera, 2000,
Murdiyarso and Skutsch, 2006, Agrawal and Angelsen, 2009, Hayes and Persha,
2010), there has been little consideration of the divergence in incentive design
between PES and CFM (Skutsch et al., 2011). The literature on PES has focussed on
contracts with individual stakeholders and rarely considers PES on common pool

85
resource or under common property regimes, as is established through CFM
(Muradian et al., 2010).
Cooperation on a common pool resource largely means that resource
appropriators extract less than private incentives might dictate on an open access
resource. However, individuals are willing to incur these costs as well as those that
might be incurred for monitoring of extraction, for example, for the longer term
sustainability of the resource. This is largely on the understanding of reciprocity
and cooperation of others (Heckathorn, 1993, Seabright, 1993). Under CFM, social
and cultural norms will act as sanctions and as disincentives for resource
appropriators to free-ride, in addition to fines, loss of rights and/or incarceration
(Ostrom, 1990). These social and cultural norms have a strong influence on a
household’s payoffs of cooperation in CFM; their costs and benefits.
PES and OCs estimates of REDD+ omit this logic of collective action on which CFM
has historically operated. Estimates of the OCs of REDD+ also omit changes in non-
market environmental values generated through forest conservation such as
watershed protection, biodiversity protection and the conservation of landscape
beauty (Pearce and Warford, 1993, Davies and Richards, 1999). An understanding
of non-market values and influence of collective action logic on payoffs could
allow more appropriate incentive design.
More cooperation and self-restraint in forest use can bring more significant benefits
when followed a greater proportion of users cooperate (Baland and Platteau, 1996,
Castillo and Saysel, 2005). Although debate in the literature still remains if bigger
groups sizes, and so larger number of cooperating individuals, bring greater
benefits. An understanding the characteristics and determinants of households’
supply of cooperative effort for REDD+ via CFM ex-ante, could therefore also
86
encourage cooperation of households thus generating greater climate change
mitigation benefits overall.
It is increasingly recognised that an understanding of households’ environmental
attitudes and perceptions of the resource base condition, of perceived
environmental responsibilities, and of perceived legitimacy of the intervention are
important for conservation success (Zanetell and Knuth, 2004, Davies and Hodge,
2006, Nkonya et al., 2008). Environmental attitudes are underpinned by motivation
and belief systems that give rise to values and thus behaviours (Kotchen and
Reiling, 2000). In community-based conservation such as CFM, the engagement
and participation of the community is by definition central to the interventions
success. An understanding of stakeholders’ attitudes towards forest management
and the use of the resource base will, therefore, allow better consideration of socio-
cultural factors for cooperation that go beyond payment incentives that PES theory
highlights. For REDD+ via CFM undertaken together, therefore, rather than as
separate interventions, sustained cooperation of households in the intervention can
deliver more permanent emission reductions. An ex-ante understanding of the
perceptions and household’s intention to cooperate in a REDD+ via CFM forest
conservation intervention can aid in appropriate intervention design and necessary
longevity for real climate change mitigation benefits.
4.3. Overview of methods
4.3.1. Forest carbon accounting
The assessment of revenues from the proposed REDD+ via CFM intervention
requires knowledge of the amount of carbon stored in forests and the rate of forest
loss. This will allow an understanding of deforestation; the complete removal of
forest as a result of anthropogenic activities. Forest degradation, which reduces

87
biomass without necessarily losing forest cover, is not assessed here. The rate of
forest loss in the BME is being assessed by both Frankfurt Zoological Society and
BERSMP – both NGOs involved in natural resource management in the area –
through remote sensing, which uses space or air-based platforms to measure
spectral indices of forests to which field-based forest carbon measurements are
correlated (DeFries et al., 2006). Data on forest carbon stocks in Ethiopia, however,
is largely lacking. Ethiopia’s national average forest carbon stocks have been
reported at 37tC/ha and 47tC/ha (FAO, 2000, Brown, 1997). The national forest
inventory of Ethiopia, however, is criticised for conflicting data (Teketay et al.,
2010) and country wide estimates are likely to underestimate the forest carbon
stocks in the BME for which no estimates are known by the author.
Documented biome averaged carbon stocks are quick to apply and very low cost.
These biome averages capture broad ecological variables that determine carbon
stocks such as climatic zones which are based on temperature and rainfall regimes
(IPCC, 2003, IPCC, 2006). The simple application of biome averages of carbon
stock, however, obscures the substantial heterogeneity of forests. The biomass and
so carbon content and rate of accumulation, also varies with factors such as soil
type, topography, elevation, species composition, age and land use history (UNDP,
2009). Human activities in a given year such as logging intensity, distance to
settlements, transport networks, and forest edge, will also impact on carbon stocks
(Larocque et al., 2008).
More complex forest carbon stock accounting uses forest inventory to statistically
relate tree diameters, or biomass volumes, to carbon stock using documented
allometric relationships established through destructive tree measurements (e.g.
Brown, 1997, Chave et al., 2005). Tree diameters and volumes can be sourced from
field measurements or existing forest inventories which record forest stand
88
structure, age, growth rate, biomass accumulation, and wood density (see FAO,
2006). Criticism of Ethiopia’s national forest inventories, however, highlight the
conflicting data that has been produced and that no regular or consistent inventory
exists (Teketay et al., 2010). The above-ground biomass carbon pool at the case
study site was, therefore, estimated by gathering direct tree measurements from
108 forest plots of 20m by 20m (see Section 4.3.3 on data collection).
Direct tree measurements and sampling protocol followed best practice
methodologies and guidance (e.g. Brown, 1997, MacDicken, 1997, Pearson et al.,
2005). Carbon is present in above-ground biomass, below-ground biomass, dead
organic wood and litter, soil organic matter and harvested wood products.
Although resulting in an underestimate of carbon stocks, only the above-ground
tree biomass carbon pool was considered here as it contains the greatest fraction of
total living biomass in a forest and this pool is most immediately impacted by
deforestation and degradation (Brown, 1997, FAO, 2003).
Pan-tropical allometric equations were applied to estimate biomass from Brown
(1997). These allometric equations were applied as few exist for Sub-Saharan
African trees and woodland (Henry et al., 2011, Shackleton and Scholes, 2011).
However, it is acknowledge that site and species specific allometric equations
would allow better biomass estimation as they capture heterogeneity in forest
characteristics. Thus, while few datasets from Africa exist to validate the allometric
equations applied to the direct tree measurements at the case study site (Gibbs et
al., 2007), resources to undertake destructive sampling to verify allometric
equations were not available. Height measurements were also impractical and
wood density estimates did not exist for the study area (see also Chapter 5, Section
5.2.1 for a longer discussion on allometric equations). Tree biomass was converted

89
to carbon using the IPCC carbon fraction guidance of 0.47 (IPCC, 2006) and
converted to a per hectare value.
To explore the discrepancy between simple and complex forest carbon accounting,
Chapter 5 applies biome averaged and primary data to estimate the emission
reductions and REDD+ revenues that could be generated in the BME. Biome
averages are sourced from the Intergovernmental Panel on Climate Change
(IPCC). Emission reductions are evaluated as the difference between a business-as-
usual (BAU) deforestation baselines and an avoided deforestation project scenario.
Methods to establish this deforestation baseline are controversial and have been
discussed at length in the literature (see Olander et al., 2008, Huettner et al., 2009).
Approaches range from simple extrapolation of historical deforestation rates to
complex and dynamic models of future land use (see Parker et al., 2008).
Extrapolating from trends in forest cover change generated from GIS imagery
analysed by the BERSMP, a historical emissions approach was adopted to establish
the BAU deforestation scenario for the BME. A linear deforestation rate of 4% in all
forest types was used to estimate emission reductions and subsequent REDD+
revenues. More complex models that predict deforestation rates and incorporate,
for example, demographic, economic and technological variables which lead to
infrastructure, energy and food demands that drive land-use change can also be
used to establish BAU deforestation baselines (Huettner et al., 2009). These
complex models are more politically acceptable and better predict deforestation
rates (Böttcher et al., 2009), but the substantial data sets and technical capacity
meant that this approach was not possible at the case study site.
Emission reductions were adjusted to account for possible project leakage and non-
permanence. Leakage is the relocation of emission generating activities away from
90
a REDD+ project boundary. It is termed primary leakage where the project fails to
address the drivers of the original deforestation baseline; activities are shifted
elsewhere or there is outsourcing for the products used as the baseline scenario. It
is termed secondary leakage where third parties are incentivised to increase
emission reductions activities as a result of the project; market effects on product
supply and demand for example (Aukland et al., 2002). Both categories of leakage
need to be accounted for so that emission reductions are not overestimated. Project
permanence is the persistence of emission reductions over time (Sedjo and
Marland, 2003). Permanence can be threatened by financial or management failure;
economic risks, rising OC; political and social instability; and natural disturbances
(fires, pests, disease and extreme climatic events) (VCS, 2007).
The dominant project-based method to deal with leakage and non-permanence are
buffers of emission reductions, with other options suggested to be repayments of
revenues/fines, expiring emission reductions, ex-post payments, portfolio
approaches and insurance (Peskett and Harkin, 2007). A non-tradable reserve of
emission reductions, the buffer acts as insurance for any emission reductions
targets that are not achieved. With a history of forest fire, potential land disputes
and imminent infrastructure development at the case study site, a buffer of 65% of
emission reductions are set aside in Chapter 5.
To remaining emission reductions, market variables are applied to estimate
possible REDD+ revenues. REDD+ revenue will depend on the price of a tonne of
emission reductions and the costs of getting the emission reductions to market.
Although social costing of carbon would value emission reductions more highly at
US$23/tCO2e (Tol, 2008), the voluntary carbon market is currently the only trading
platform from which value can be realised from avoided deforestation. In 2007, the
average price for emission reductions on the voluntary market was US$6.1/tCO2e
91
(Hamilton et al., 2008). With greater flexibility and less stringent validation
processes, the voluntary market price is lower than that in compliance markets.
Prices for emission reductions through the CDM on the compliance market fetched
an average of US$13.6/tCO2e in 2007 (Capoor and Ambrosi, 2008). The VCM also
allows price variation according to the source and integrity of the offset. In 2007,
emission reductions on the VCM were sold for between US$1.8 to US$300 per
tCO2e (Hamilton et al., 2008). The highest prices went to projects with easily
verifiable attributes and those that were more publicly appealing. Lower prices
were realised by projects with low social or environmental co-benefits and high
economic and project delivery risks. Where social co-benefits refer to additional
positive impacts beyond climate regulation and may include improvement in long-
term livelihood security or employment opportunities, for example.
Environmental co-benefits may refer to REDD+ activities that operate in areas of
high biodiversity, or those that contribute to watershed and soil regulation for
example. In 2006-2007, emission reductions from avoided deforestation averaged
US$4.8/tCO2e (Hamilton et al., 2008). Two prices were used in Chapter 5,
US$3/tCO2e and US$6/tCO2e to illustrate the sensitivity of emission reductions to
market price.
Estimated REDD+ revenues were further adjusted for the implementation,
transaction and capacity building costs incurred when bringing emission
reductions to market. Implementation costs are either one-off or ongoing, but are
incurred through actions directly generating emission reductions. They include;
guards, intensification of agriculture, and re-routing of road projects. Transaction
costs are those experienced when identifying the programme, negotiating
transactions, and for MRV of emission reductions (Pagiola and Bosquet, 2009).
Capacity building costs include those for the development of research capacity,

92
technology transfer and legal support to establish REDD+ projects (see Hoare et al.,
2008).
The bulk of these additional costs are experienced upfront and have, to date, been
absorbed by stakeholders other than the ultimate forest users. Particularly where
forest users are rural communities they have been absorbed by NGOs such as; The
Nature Conservancy in Bolivia, and Conservation International and Wildlife
Conservation Society in Madagascar (Asquith et al., 2002, WCS, 2009). With
REDD+ an emerging policy instrument, very little has been documented about
costs. The few estimates that do exist, however, show that these costs can be
substantial (Cacho et al., 2005). Implementation costs were predicted by Nepstad et
al. (2007) to be US$0.58/tCO2e. Antinori and Sathaye (2007) found average
transaction costs of US$0.38/tCO2e from a sample of eleven project reports. Based
on their experiences in Madagascar, the Wildlife Conservation Society estimate the
costs of REDD+ project development at between US$220-450 million, excluding
implementation costs and brokerage of emission reductions (WCS, 2009). REDD+
revenues estimated in Chapter 5 were adjusted for costs of REDD+ project
implementation estimated using a feasibility assessment undertaken by forestry
consultants in the BME (UNIQUE, 2008).
4.3.2. The opportunity costs of REDD+
4.3.2.1. Estimates of the OC of REDD+
Estimates of the OCs of REDD+ can be broadly split into top-down and bottom-up
assessments. Top-down assessments are coarse, aggregating forests into large
blocks for example by country, continent or biome. They commonly make use of
commercial agricultural returns on a hectare of land and estimate the highest
potential OCs. These estimates differ in choice of the time frame considered, the
93
costs included, market feedbacks, drivers of deforestation, land conversion
benefits, elasticity of transformation, carbon density, and the benefits derived from
retention of forest (see Nabuurs et al., 2007). At large spatial scales they make
broad assumptions for agricultural returns, ignoring the substantial heterogeneity
of both ecological and socio-economic factors.
Such top-down OCs analyses are too coarse to feed into on-the-ground REDD+
project design. Instead they have utility as components of global partial
equilibrium models and global assessments of REDD+ supply (e.g. Grieg-Gran,
2006, Kindermann et al., 2008). Supply curves express OCs by quantity of emission
reductions rather than by area. The OCs estimates, typically in US$ per hectare, are
converted into US$ per tonne of emission reductions. The comparison of OCs
estimates is made complex by the type of OCs reported. Average OCs in
Indonesia, for example, ranged from US$-0.26 to US$5.22/tCO2 where forest was
razed for agricultural use and US$13.34/tCO2 where it was commercially logged
(Tomich et al., 2005). The ‘choke’ price to reduce all deforestation in the Brazilian
Amazon was found to US$1.49/tCO2e (Nepstad et al., 2007). Although coarse, top-
down model estimates broadly indicate where emission reductions will be most
cost-effective, and allow a comparison of abatement costs through forestry
compared to other mitigation sectors.
Bottom-up studies are more specific to a particular locale, but still make use of
agricultural returns, production models or land prices and, therefore, also consider
the OCs of land. Fisher et al. (2011), for example, include both OCs of agricultural
production and charcoal production within 53 districts in Tanzania finding net
present value of between US$663 and US$1456/ha for agricultural production, and
US$358 and US$502/ha for charcoal production. Bottom-up models are better able
to include local factors including soil type, climate, technological inputs, and
94
market access which enhance OC estimates (e.g. Merry et al., 2002, Bellassen and
Gitz, 2008). Where substantial data sets and technical capacity exists, more
complex production functions can be used to model agricultural returns. The
production function approach incorporates variables such as yields, inputs,
commodity prices and other spatial details. Alternatively, land values can be used
to infer OCs as the market price of land, under perfect markets, should reflect its
highest-value use (Bishop, 1999). This method, however, requires data to be
available on land title costs. In developing countries, this data is limited and clear
ownership and land markets often do not exist (Waggoner, 2009).
Few studies have considered the OCs of REDD+ via CFM. In Nepstad et al. (2007)
the costs of REDD+ are assessed in the Brazilian Amazon. They establish the OCs
of land for private forest stewards and for the government, and also suggest a
payment level that can incentivise forest stewardship and conservation on ‘social’
forest reserves. These social forests comprise 26% of the Amazon’s forest and
include indigenous lands, extractive reserves, and sustainable development
reserves. Nepstad et al. propose a Public Forest Stewardship Fund on these forest
areas from which direct payments can be made to households. The payment is
delivered per household, not by area, and payments are uniform and anchored to
half a minimum salary (amounting to US$1200 per year). These payments are
lacking conditionality on service provision and it is noted that more research is
required to make these payments performance based.
In Karky and Skutsch (2010), the costs of carbon abatement through community
forestry are calculated in Nepal. Establishing the break-even price that would be
required for emission reductions to make REDD+ via CFM feasible, they call for
the analysis of the OCs of land that encompasses more than agricultural returns
and note the numerous other drivers of deforestation such as the harvest of

95
fuelwood, fodder, timber and NTFP. Studies based on marginal analysis of the
OCs of agriculture may be inadequate to anchor payments for REDD+ via CFM
where they do not consider other inputs for subsistence livelihoods. In Chapter 6, I
therefore, estimate both the OCs of agricultural production but also the OCs of
fuelwood and timber on a hectare of land. These bottom-up estimates are based on
household returns to land uses which are established through household survey
and market price valuation.
4.3.2.2. Estimating OCs at the case study site
In the BME, under the proposed Bale REDD+ Project of REDD+ via CFM
households will experience a change from open access to the forest resource to a
common property regime. Despite the illegality of the expansion of agricultural
land and the harvesting of fuelwood from live trees, in the status-quo anyone is
able to use resources from the forest to the level they desire. This de facto open
access situation is due to a lack of law enforcement and political interest in
conserving the forest resource base (see the full Bale REDD+ Project description in
Chapter 3).
Under the CFM regime, clearly defined use rights to the forest will make forest use
excludable from those not participating in CFM and also to regulate forest use. The
forest management agreement signed by the community groups will prohibit
household expansion of agricultural land and engagement in timber and fuelwood
extraction. Timber and fuelwood harvest reduces the biomass content of the forest
where they are in excess of annual biomass growth. These are therefore termed,
high-impact forest products here. The extraction of bamboo, honey, coffee, and
climbers from the forest, will still be allowed under the intervention. These
products can be managed such that they are harvested without the reduction in the
96
biomass of the forest (Naidoo and Adamowicz, 2006). They are, therefore, termed
here, low-impact forest products. While agricultural expansion and harvest of
high-impact forest products will be prohibited by the Bale REDD+ Project, low-
impact forest products can still be harvested, providing this extraction remains at
sustainable levels.
The OCs of forest conservation will therefore be those of agriculture or high-
impact forest products on a given hectare. As no model of land use change exists
for the BME, so it cannot be predicted whether the next hectare will be converted
to agriculture or deforested through harvest of high-impact forest products. Both
OCs of land are therefore estimated in Chapter 6 and explored in regard to the
implementation of the Bale REDD+ Project.
The OCs for a hectare of forest conservation (US$/ha) is first modelled as the
foregone income from crop production. A second calculation is made of the OCs
for a hectare of forest conservation net of low-impact forest product income that
can instead be derived from the hectare of forest conserved. The inclusion of these
market benefits of low-impact forest products better capture the household trade-
offs on this hectare of land.
The OCs of high-impact forest product (US$/ha) is then estimated by aggregating
the village forest income from timber and firewood, through household survey
and market price valuation, and then dividing over the total forest area. While
other studies have estimated by biomass per hectare and converted by market
survey to estimate land use values (Fisher et al., 2011), it was not possible to do so
at the case study site as estimates of a donkey load of biomass for fuelwood were
unavailable (see Section 4.4.4). This assessment of OCs of high-impact forest
products assumes that all household use of high-impact forest products must stop
97
under the Bale REDD+ Project. It is recognised, however, that households need
fuelwood. The Bale REDD+ Project implementers are already undertaking
activities to meet these energy needs through woodlot establishment, fuel-efficient
stove promotion and biomass briquettes. However, the measures to reduce the
need for households to gather these products from natural forest will take time to
be implemented. Woodlots, for example, will take time to be planted and mature.
These OCs of the intervention may therefore be overcome as the intervention
matures. As with agriculture, a second calculation of the OCs of high-impact forest
products is calculated net of low-impact forest products.
Having estimated the OCs of forest conservation, the implications of the different
OCs measures, with regard to any payment design of REDD+ via CFM as a local-
level PES, are discussed in Chapter 6. The OCs of land generated by the REDD+ via
CFM intervention are directly compared with the carbon revenues per hectare of
conserved forest in Chapter 7.
Households also derive value from non-market benefits of the forest. These include
other direct use values such as shade, recreation and cultural values; indirect use
values that support and protect production such as soil fertility and the micro-
climate; option value for future direct and indirect value; and, non-use values
which capture the value of the forest’s existence and bequest for future generations
(Davies and Richards, 1999). The values that households derive from forests in the
status-quo are, however, net of the negative externality that households exert on
each other due to the non-excludable, rival nature of the forest. Inherent in the
definition of an externality is that households do not take into account the effect on
others when deciding how much of this externality to produce (Kolstad, 2000).
Under CFM, households will experience benefits from the removal of the negative
98
externality of a common pool resource, thus it is likely that non-market
environmental benefits will be greater than in the status-quo.
Households will also benefit from the scheme according to the value placed on the
use rights which they are awarded, any increase in social capital and
empowerment as a result of CFM, as well as any payments for carbon under a
REDD+ project. These benefits of the conservation intervention may serve to offset
some of a household’s OCs, but transaction costs will also be incurred by
household participating in the scheme including negotiation, monitoring and
enforcement costs that are not measured here. These transaction costs include;
arranging, bargaining, monitoring and enforcing agreements (North, 1990).
An understanding of transaction costs can help in intervention design to reduce
negative social impacts. Meshack et al. (2006), for example, assessed the transaction
costs of CFM in Tanzania including for forest monitoring and meetings, against the
benefits including the forest products consumed at the household level. Poorer
households were found to benefit more than medium and rich households,
although richer households had greater net benefits; poor taking on more of the
transaction costs of CFM. Although it is noted that forest condition also plays a
role in determining the transaction costs of CFM. Similarly, in Nepal it was found
that while richer household bore almost twice as much as poorer households, 2312
versus 1265 Nepalese rupees per year, costs are higher as a percentage of resource
appropriation costs for poorer households; with all households investing a mean of
between 20 and 30 days per year (Adhikari and Lovett, 2006).
Transaction costs of CFM, however, are complex to measure. With varying
definition, they are also difficult to separate from production decisions in addition
to which each individual will experience different transaction costs (Benham and
99
Benham, 2000). Estimates of transaction costs in CFM are, therefore, few (Richards
et al., 1999, Adhikari and Lovett, 2006, Meshack et al., 2006). While this thesis does
not assess transaction costs of CFM, or the non-market benefits of the forest that
result from conservation are omitted in the OC calculations in Chapters 6 and 7,
they are discussed further in Chapter 8 and in Chapter 9.
In order to estimate the three OC measures, a number of simplifying assumptions
are made about the household and about the costs and benefits of the intervention
(see Table 2). One major assumption is that a household is a pure profit maximiser;
thus profit affects consumption with no feedback on production decisions.
However, it is well recognised that rural households in developing countries face a
number of market imperfections and constraints. This includes variable transaction
costs for households of accessing markets, inexistence of land markets and
constraints on market participation (Sadoulet and de Janvry, 1995). In such
situations, there is a link between production and consumption behaviour; where
production is the inputs, choice of activities and desired production levels, while
consumption is affected by consumption preferences, and demographic
composition of the household, for example. Behaviour can therefore be understood
in a non-separable household model (for example see; Palmer and Macgregor,
2009). A non-separable model has implications for the market price of what is
consumed and the household internal equilibrium determines the shadow price of
a product. At the case study site, however, it was not possible to estimate shadow
prices for each household for each product due to resource and time limitations
(see also Section 4.4.5) and therefore production and consumption decisions were
assumed separable that is likely to overestimate values. These limitations are
returned to in Chapter 9.

100
Another assumption is that low-impact forest products are sustainably harvested
and high-impact forest products are not. These stylised assumptions were
necessary as incomplete data existed on whether these uses are sustainable and at
what level harvests can be maintained. There were also insufficient resources to
estimate this at the case study site. It is acknowledged that the reduction in OCs of
land as a result of low-impact forest products may, therefore, be an overestimate if
they are to be restricted under the intervention. Furthermore, some harvest of
biomass growth or gathering of dead biomass for fuelwood may be allowed under
the intervention and would not necessarily prove unsustainable use of forest
resources. As an ex-ante study of the OCs of high-impact forest conservation,
however, it was also not possible to estimate the impact of restrictions on a
household that were less than 100%. This is firstly as the by-laws that will generate
these restrictions are yet to be negotiated and agreed by the communities with the
authorities, and secondly as restrictions are difficult to relate to household
harvests. Thus, the OCs of forest conservation was estimated as a total ban on
harvesting of all high-impact forest products and with no restrictions on low-
impact forest products. Further research into the sustainability and extractive
potential of forest products is necessary.
Finally, in order to establish a per hectare value for the OCs of forest products, it is
also assumed that the complete forest area in a village is utilised evenly. This
assumption of area was used to calculate both the OCs of high-impact forest
products, but also those of low-impact forest products per hectare. While the
income per hectare of agricultural land was based on reported area of a
household’s cultivated land, households were unable to recall areas of forest used.
It is recognised that problems of attribution of deforestation to households or
individuals exist in the REDD+ literature (Börner and Wunder, 2008). This is
acknowledged as a substantial assumption and explored further in Chapter 6, but
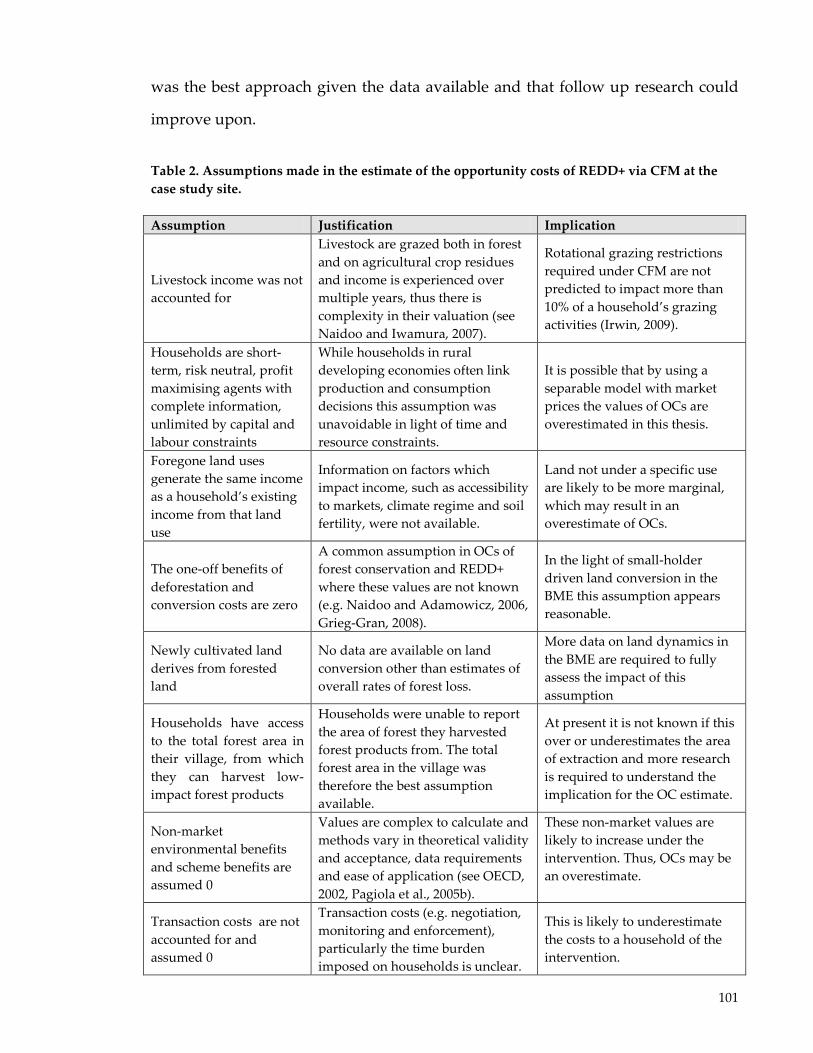
101
was the best approach given the data available and that follow up research could
improve upon.
Table 2. Assumptions made in the estimate of the opportunity costs of REDD+ via CFM at the case study site. Assumption Justification Implication
Livestock income was not accounted for
Livestock are grazed both in forest and on agricultural crop residues and income is experienced over multiple years, thus there is complexity in their valuation (see Naidoo and Iwamura, 2007).
Rotational grazing restrictions required under CFM are not predicted to impact more than 10% of a household’s grazing activities (Irwin, 2009).
Households are short-term, risk neutral, profit maximising agents with complete information, unlimited by capital and labour constraints
While households in rural developing economies often link production and consumption decisions this assumption was unavoidable in light of time and resource constraints.
It is possible that by using a separable model with market prices the values of OCs are overestimated in this thesis.
Foregone land uses generate the same income as a household’s existing income from that land use
Information on factors which impact income, such as accessibility to markets, climate regime and soil fertility, were not available.
Land not under a specific use are likely to be more marginal, which may result in an overestimate of OCs.
The one-off benefits of deforestation and conversion costs are zero
A common assumption in OCs of forest conservation and REDD+ where these values are not known (e.g. Naidoo and Adamowicz, 2006, Grieg-Gran, 2008).
In the light of small-holder driven land conversion in the BME this assumption appears reasonable.
Newly cultivated land derives from forested land
No data are available on land conversion other than estimates of overall rates of forest loss.
More data on land dynamics in the BME are required to fully assess the impact of this assumption
Households have access to the total forest area in their village, from which they can harvest low-impact forest products
Households were unable to report the area of forest they harvested forest products from. The total forest area in the village was therefore the best assumption available.
At present it is not known if this over or underestimates the area of extraction and more research is required to understand the implication for the OC estimate.
Non-market environmental benefits and scheme benefits are assumed 0
Values are complex to calculate and methods vary in theoretical validity and acceptance, data requirements and ease of application (see OECD, 2002, Pagiola et al., 2005b).
These non-market values are likely to increase under the intervention. Thus, OCs may be an overestimate.
Transaction costs are not accounted for and assumed 0
Transaction costs (e.g. negotiation, monitoring and enforcement), particularly the time burden imposed on households is unclear.
This is likely to underestimate the costs to a household of the intervention.

102
4.3.2.3. Household survey of land use income
In order to elicit information about a household’s use of the forests, agricultural
production and other economic activities, semi-structured surveys were
undertaken at the case study site. A household is defined here as ‘the people that
normally eat and sleep under the same roof’ (Rowland and Gatward, 2003). Semi-
structured household surveys allow the collection of data in a formal standardised
manner, but also have room for open-ended responses. The household survey was
formulated according to best practice guidelines and to be as specific and simple as
possible (de Vaus, 2002). It collected data on the previous year of crop production
and forest product collection, with income defined to households as production
both consumed at home and exchanged on markets.
Surveys were designed to be verbally administered in either Amharic or Oromifa,
the two dominant dialects at the case study site. Neither postal nor telephone
surveys were a viable option and self-completing questionnaires would suffer
from problems of illiteracy. Households were considered as the appropriate unit
for decision-making and respondents were largely household heads, defined by
Adhikari et al. (2004) as ‘the person who makes all decisions on behalf of all the family and
decides livelihood activities for the welfare of family members’. Each respondent was
given an introduction to the research, a promise of confidentiality of the
information gathered, and an estimation of the survey duration. Respondents were
then asked if they wished to proceed.
The survey began with questions regarding attitudes to the environment and forest
management. Values and beliefs were elicited in agree/disagree statements and
open-ended questions explored environmental concerns as well as opinions of

103
past, present and proposed forest management regimes. More sensitive data were
gathered in part two which explored the household’s forest use and agricultural
production including the products, yields, any inputs (seeds, fertiliser and
equipment per year) and the share of production consumed at home versus that
sold in local markets. Part three of the household survey went into more detail on
the proposed Bale REDD+ Project and the final section elicited household
information including family size and the education level of the household head
(see Appendix 1).
The quality of the survey data relies on the reliability of self-reporting by
households. Reliability of data can be called into question where respondents have
motives to alter their apparent resource use or if respondents are unable to
accurately recall production information over a given time span (Milner-Gulland
and Rowcliffe, 2007, Angelsen et al., 2011). In the first instance, respondents might
be reluctant to answer accurately where it is feared that information would reach
the authorities, for example, where resource use is illegal as hypothesised in Gross-
Camp et al. (2012). Alternatively, respondents may inflate their use of resources
where they perceive future benefits, for example strategic responses might be
given when households are asked their willingness-to-accept restrictions
(Whittington, 1998). In order to minimise the risk of false self-reports, interviews
were designed for a sole respondent and those participating in the survey were
given the assurance of anonymity. Respondents also had the opportunity to opt
out of participation. No government staff accompanied the fieldwork team,
although permissions to conduct surveys were necessarily sought from the Federal
government and also the regional Ministry of Agriculture and Rural Development.
At each survey location permission to conduct surveys was also requested from
village leaders after an introduction to the research aims and the fieldwork team
had been given. Time was invested at each survey location in earning the trust of

104
communities; three to four weeks were spent at each location, and no payments
were offered for participation in the survey.
Recall error may also erode confidence in household survey data (Angelsen et al.,
2011). In order to address recall issues focus groups were conducted to ask locals
the longest recall periods that were possible. Four small groups of between four
and seven people were brought together to discuss whether households would be
able to recall production from the last 12 months. Respondents were confident they
could accurately recall this information, with some focus group participants stating
they could remember as much as five years back. Confidence in recall amounts is
also high because many crops only have one harvest per annum. With some forest
products, such as fuelwood, enumerators were able to scale up where respondents
recalled monthly or weekly yields.
4.3.2.4. Market price valuation
Research into household incomes and household income from forest resources has
been primarily undertaken with a focus on the dependence and resilience of rural
households (see reviews of Lampietti and Dixon, 1995, Godoy and Lubowski, 1992,
Vedeld et al., 2004). Household incomes are commonly assessed through
household surveys to which market-based valuation of household production is
employed, particularly to determine the relative reliance of households on forests
as a livelihood-generating resource (e.g. Dercon, 1998, Dovie et al., 2005,
Shackleton and Campbell, 2001).
The costs of household labour were not subtracted from the income calculations, as
is common in household income studies, (Cavendish, 2000, Fisher, 2004, Babulo et
al., 2009, Yemiru et al., 2010). In 2008, focus groups also revealed that job
105
opportunities in rural areas were extremely limited, seasonal and largely only
available for males. Thus, the market wage was not a good measure of the shadow
wage and resources were insufficient to estimate the shadow wage indirectly as an
opportunity cost of time (Palmer and Macgregor, 2009). Thus income is defined as
the return to capital and labour a household has access to.
The household income calculation includes production of agricultural goods and
forest goods both for home consumption and market exchange. These methods
vary in theoretical validity and acceptance, data requirements and ease of
application (see OECD, 2002, Pagiola et al., 2005b). Where goods and services are
marketed, they have evident values. Where goods and services are not present in
markets revealed preference, using surrogate markets to infer value, and stated
preference methods, using hypothetical markets, can be applied (see Arrow et al.,
1993). In addition to these methods, benefit transfer can be used to determine value
from related studies (Splash and Vatn, 2006).
I apply market-based valuation to establish the income that households derive
from both forest and agricultural land use. Following observation of a household’s
products and yields, for both subsistence and sale, local market prices are applied.
The cost of similar goods or next best alternatives can also be used as a proxy
where there is a high degree of substitution between goods (see Section 4.4.5). It is
recognised, however, that production and consumption decisions are non-
separable in many rural developing country households (Sadoulet and de Janvry,
1995). Multiple market failures mean that there can be a large discrepancy between
seller and buyer prices of a product; each household, therefore, will have its own
shadow price for a product.
There are a number of ways to establish a households’ shadow price which can be
used to better value non-marketed products; i.e. those consumed at home. This

106
includes establishing barter values for non-traded commodities that are exchanged
between households; using contingent valuation to ask respondents directly for
their value preferences; considering substitute good values; using local prices; and,
assessing time embedded in products as well as other inputs (Angelsen et al.,
2011). Ideally, establishing the time and other inputs would allow better
calculation of minimum values of products. Chopra (1993) for example, valued
firewood collection and other NTFP through embedded labour collection time; the
opportunity cost of labour time. It is however, difficult to measure embedded time
and thus shadow prices for each product. Individuals often multi-task, shadow
costs vary according to the household members whose labour is used and can also
vary by season (Angelsen et al., 2011).
As it was not possible to establish a shadow price for each product for each
household, this study uses market price valuation. Market prices reflect decision-
making reality and so are good estimates of WTP (UNEP, 1998). Adopting a
utilitarian concept of value, WTP reveals the value individuals hold for market and
non-market goods and the trade-offs made in the pursuit of these goods (Freeman,
2003). However, using market price valuation assumes that the market is efficient
and so inclusive of input costs (Bishop, 1999). As it is noted that market
imperfections are commonplace in rural developing countries, it is likely that this
method causes and overestimate of value as a result of included marketing and
transport costs, or where middle men are buyers and seller increasing the
difference between market price and shadow price.
In attempting to minimise this overestimate, local-level market prices were used
and extrapolated to ‘free’ products that were consumed within the home but not
traded. In the BME, households sell home produce in unrestricted markets where
there are no barriers to entry. On market days many buyers and sellers converge to
107
sell identical produce brought predominantly by pack animals. These local
markets are not for sale to intermediaries or middle-men, and although the use of
market prices may lead to overestimation it represents the best price for products
that were available (see Appendix 2).
4.3.2.5. Scenario modelling futures
Complete knowledge of the future is just not possible. Partial forecasting of
futures, however, can be achieved through systematic historical trend analysis and
extrapolation (Helmer, 1977, Wack, 1985, Bell, 1997). Regarded as a strategic tool,
futures research explores a range of possible, plausible futures and, therefore,
differs from research attempting to converge on a single view or answer (Gordon,
1992). Alternative futures can answer questions such as: what can or could be
(possible)?; what is likely to be (probable)?; and, what ought to be (preferable)?
(Börjeson et al., 2006). Thus futures research is useful for strategic decision-making
under uncertain but predictable situations, where adaptation is possible through
the reallocation of means and resources (Kaivo-oja et al., 2004). Futures research
therefore has applications for the private sector (Huss and Honton, 1987), as well
as being important for policy planning where they can be used to identify and
evaluate alternative policies and provide early warning of threats and
opportunities. In addition, where more desirable futures can be selected,
stakeholders can act to maximise the probability of desirable futures being
achieved (Gordon, 1992, Kaivo-oja et al., 2004).
Futures research encompasses a number of methods. Reviewed in Gordon (1992),
the most simplistic division of futures methods is by quantitative or qualitative
and normative futures (those that seem desirable), or exploratory futures (those
that seem plausible) (Table 3). There is a substantial terminology in futures
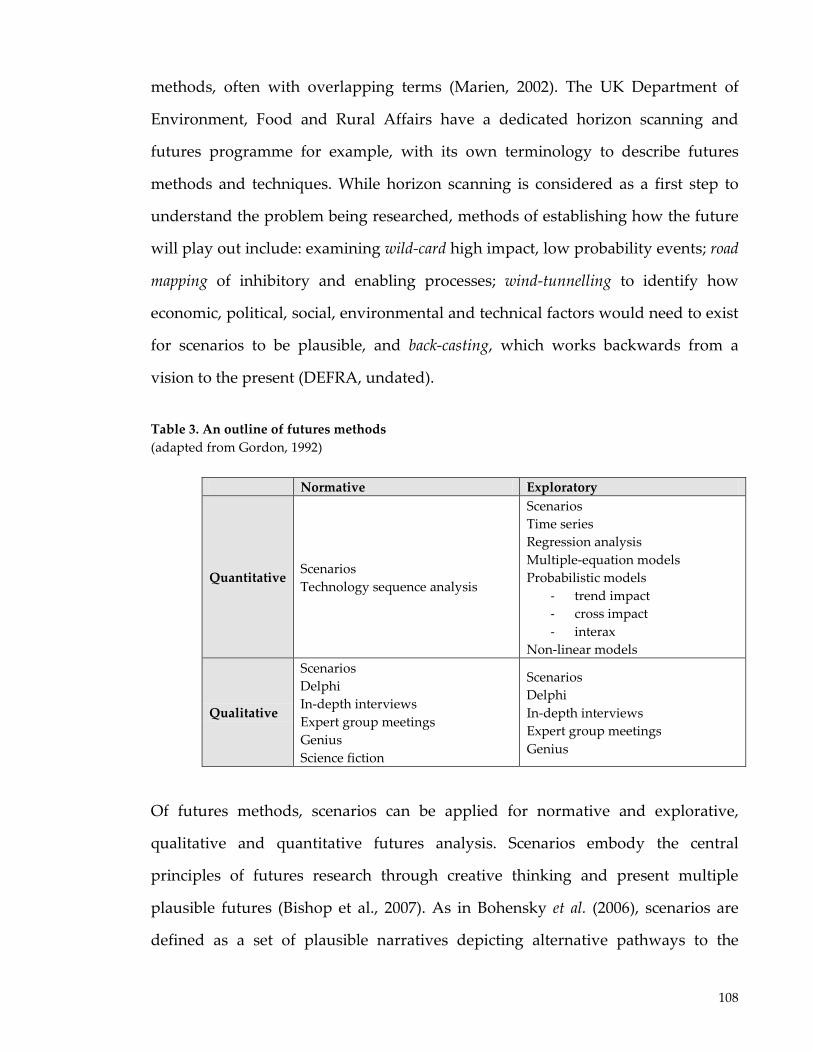
108
methods, often with overlapping terms (Marien, 2002). The UK Department of
Environment, Food and Rural Affairs have a dedicated horizon scanning and
futures programme for example, with its own terminology to describe futures
methods and techniques. While horizon scanning is considered as a first step to
understand the problem being researched, methods of establishing how the future
will play out include: examining wild-card high impact, low probability events; road
mapping of inhibitory and enabling processes; wind-tunnelling to identify how
economic, political, social, environmental and technical factors would need to exist
for scenarios to be plausible, and back-casting, which works backwards from a
vision to the present (DEFRA, undated).
Table 3. An outline of futures methods (adapted from Gordon, 1992)
Normative Exploratory
Quantitative Scenarios Technology sequence analysis
Scenarios Time series Regression analysis Multiple-equation models Probabilistic models
- trend impact - cross impact - interax
Non-linear models
Qualitative
Scenarios Delphi In-depth interviews Expert group meetings Genius Science fiction
Scenarios Delphi In-depth interviews Expert group meetings Genius
Of futures methods, scenarios can be applied for normative and explorative,
qualitative and quantitative futures analysis. Scenarios embody the central
principles of futures research through creative thinking and present multiple
plausible futures (Bishop et al., 2007). As in Bohensky et al. (2006), scenarios are
defined as a set of plausible narratives depicting alternative pathways to the

109
future. They can synthesise and communicate information, including uncertainties,
to stakeholders as well as the public (Alcamo, 2001). Gordon (1992) rates scenarios
as less complex than alternative quantitative models methods. Models often rely
on the past as being able to predict the future but in the future relationships
between variables may change. Time series analysis is more demanding
numerically, necessitating the fitting of mathematical models to trend data.
Scenarios are also relatively low on training and data requirements as compared to
other quantitative futures methods. Scenarios are also unlike other methods to deal
with decision-making under uncertainty. Unlike decision theory, for example,
scenarios do not require information on the probabilities of outcomes (Polasky et
al., 2011). Unlike sensitivity analysis, which focuses on marginal changes in
specific biophysical or economic parameters, scenarios have the benefit of being
able to change groups of parameters (White and Minang, 2011).
The internally consistent and realistic narratives describing potential future states
established in quantitative scenarios can lead to more resilient conservation
policies (Peterson et al., 2003). Despite this utility, scenarios have been
underutilised in conservation intervention planning (Peterson et al., 2003,
Bohensky et al., 2006).
The application of scenarios in environment policy is, however, growing. The IPCC
produces special reports on emission scenarios, or ‘projections of the future state of
the society and environment based on specific assumptions about key determinants such as
population, economic growth, technological change, or environmental policies’
(Nakicenovic et al., 2000). The Millennium Ecosystem Assessment built scenarios
to explore user needs, supply and demand for ecosystem services and how well-
being might change into the future (MA, 2005, Carpenter et al., 2006). Participatory
methods were used to generate four policy relevant scenarios with ecologists,
110
economists, and social scientists from the private sector, public sector, NGOs and
indigenous groups all engaged in the process (Bohensky et al., 2006). Similarly,
scenarios were used in the recent UK National Ecosystem Assessment, to explore
how ecosystems and their services will change in the future and the associated
impacts on human-well-being. The National Ecosystem Assessment created six
scenarios of ecosystem service impacts on society, economy and human well-being
up to 2060. These incorporated five indirect drivers of change; demographic, socio-
political, economic, science and technological, and cultural and religions, and three
dominant direct drivers of change; climate change, land-use change, and resource
consumption (Haines-Young et al., 2010).
Where applied for environmental policy scenarios are more commonly applied at
broad spatial scale. Osvaldo et al. (2000) created three scenarios of the future
biodiversity of ten major biomes based on assumptions about the five main drivers
of biodiversity change; land use, climate, nitrogen deposition, biotic exchange, and
atmospheric CO2. The scenarios considered no interaction, synergistic interaction
and antagonistic interactions between the drivers and land-use change was
projected to have the biggest impact on biodiversity distribution in 2100. However,
the authors recognise that regional analysis, with tailored biological, social and
economic characteristics, will improve the accessibility of the scenarios to policy-
makers (Osvaldo et al., 2000).
Scenarios are being increasing used to consider carbon storage in natural
ecosystems. Swetnam et al. (2011) was also at broad-scale, building two scenarios
of carbon storage in the Eastern Arc Mountains of Tanzania. Considering change in
five sectors; energy, formal economy, agriculture, forestry and population, it was
estimated that in 2025 there would be a 41% loss in carbon storage under business
as usual charcoal production and agricultural expansion. Translating scenarios

111
onto land use maps, it was shown that in the optimistic scenario only 3.8% of
carbon storage of might be lost. Strassburg et al. (2012) applied scenarios of global
carbon values to explore how REDD+ might influence biodiversity conservation.
They found that under all scenarios, REDD+ will help reduce biodiversity losses.
A qualitative study by Wollenberg et al. (2000) argued that scenarios should be
utilised in bottom-up conservation planning. Applied to anticipatory learning for
adaptive co-management of community forests, the study finds that scenarios may
not remove uncertainties, but they can help stakeholders to prepare for them, and
thus cope with them.
Studies that consider the OCs of conservation largely report OCs for a single year
or assume OCs are constant over time subject only to discounting (Börner et al.,
2009, Naidoo and Adamowicz, 2006, Chomitz et al., 2005). Incorporating the lack
of information the on on-going drivers of change and the underspecificity
uncertainty in conservation objectives, scenarios are applied in Chapter 7 to
understand how OCs may change over the lifespan of a conservation intervention.
Three scenarios are generated which explore how assumptions of agricultural
productivity improvements, proposed commercialisation of forest products, and
the sustainability of land use impact upon three OCs measures of forest
conservation through CFM. The annual OCs are those experienced by a household
in a given project year. The cumulative OCs are those experienced for a hectare of
land taken out of production at a given project-year until the end of the project.
The total OCs are the sum of the cumulative OCs, over the area of avoided
deforestation, for the project lifespan.
Scenario analysis can include indirect socio-political, economic, science and
technological, cultural and religious, and demographic drivers (Haines-Young et
112
al., 2010). This study focuses on the direct economic drivers of resource
consumption, with simple but credible changes in income from land uses modelled
under the proposed CFM conservation intervention in the BME. Two explorative,
or probable, scenarios utilised subjective judgements about the drivers of land-use
change to illustrate what may happen under a CFM conservation intervention. The
third scenario is normative and back-casts from a goal of zero total OCs of forest
conservation. Scenarios are calibrated with data from peer reviewed and grey
literature, research institutions, government sources and non-governmental
organisations outlined in Chapter 3, as well as knowledge of the region and
intervention gathered through fieldwork. The potential of REDD+ revenues from
the project to overcome the OCs of forest conservation is then assessed by applying
revenue estimates from Chapter 5.
4.3.3. Environmental attitudes, perceptions and intention to cooperate in CFM
The qualitative study of opinions and perceptions of conservation interventions
allows unobservable values to be better understood (Kotchen and Reiling, 2000).
At the case study site, open ended questions and agree/disagree statements were
included in the household survey described in section 4.3.2.3. A series of open-
ended questions also explored opinions of past, present and proposed forest
management regimes in the survey villages. Following a description of the
intervention, households were also asked if they would take part in CFM as it was
proposed. Chapter 8 reports these findings to provide an understanding of local
attitudes to resource management and conservation at the case-study site.
Qualitative data complements the empirical estimates of households’ OCs of
REDD+ via CFM as a household’s decision to cooperate is based on them weighing
up the costs and the benefits that they perceive they will incur (Lubell, 2002,
113
Adams et al., 2003). The household survey also elicited a household’s intention to
cooperate in the proposed forest conservation intervention through a voluntary
contribution. The voluntary contribution was a portion of their yearly income that
they would pay into the CFM cooperative so that it could be used to better manage
the forest. This voluntary contribution can be considered a quantitative indicator of
intention to cooperate in the proposed CFM intervention. A higher voluntary
contribution is assumed to represent greater cooperative intention where
cooperation is defined here as a household entering into a scheme, abiding by the
rules, and undertaking pro-conservation behaviours.
Other studies have elicited WTP in order to value environmental goods or services
through a method called contingent valuation. For example, Köhlin (2001) assesses
the WTP for community forest plantations in India. Urama and Hodge (2006)
consider WTP for a river basin restoration scheme in Nigeria. Contingent valuation
relies on the stated preferences of individuals rather than their preferences
revealed through behavioural trails through the elicitation of a value for changes in
the level of provision of a good or service through intended action on a
hypothetical market (Mitchell and Carson, 1989). Eliciting an individual’s WTP to
avoid a loss or for a gain, or willingness-to-accept in lieu of a gain or to suffer a
loss, contingent valuation is able to capture not only direct-use values, but also
indirect, option (potential to be used either directly or indirectly in the future), and
non-use values (existence, bequest and altruistic values) (Christie et al., 2008).
Despite difficulties in its application in developing countries (Whittington, 1998),
contingent valuation has been applied in Ethiopia (e.g. Mekonnen, 2000). In 2009,
however, a pilot contingent valuation survey was conducted at the case study site
and the value elicitation question was met with either exceedingly high monetary
amounts or protest responses, thus contingent valuation was not feasible at the
case study site.

114
As it was unable to observe preferences through a contingent valuation question, a
households’ voluntary contribution was instead elicited as a quantitative measure
of behavioural intention. Such an approach was has been taken elsewhere in the
literature. Howe et al. (2011) use a voluntary pledge to measure behavioural
intention to contribute to a conservation intervention in Russia. Champ et al. (1997)
considered voluntary contributions to road removal near the Grand Canyon in the
United States. In adopting the voluntary contribution approach a number of
methodological limitations are acknowledged. In particular a voluntary
contribution may not be incentive compatible, free-riding on the donation of others
towards a public good could lead to the reduction of donation amounts and free
riding on others (Champ et al., 1997). Alternatively, the hypothetical nature of the
contribution could lead to inflated donation responses for a warm glow effect
(Andreoni, 1989). As a result of the limitations of the measure, the voluntary
contribution is not interpreted as a welfare measure, but instead a focus is given to
the determinants of households’ cooperative intention.
The determinants of a household’s intention to cooperate were investigated
through regression analysis based on a priori assumptions of impact on cooperation
established through literature review. The literature on common pool resource and
that on common property regimes have explored cooperation through a large body
of case-studies. Some have found that wealthier individuals take on more of the
burden of initiating collective action (Baland and Platteau, 1999, Bardhan, 2000). In
contrast, others have found non-linear wealth impacts on cooperation (Dayton-
Johnson and Bardhan, 2002). Many find that the poor bear a higher share of
transaction costs and receive lower benefits from access to forest products
(Adhikari and Lovett, 2006, Lund and Treue, 2008, Nielsen and Treue, 2012).
Appropriator’s returns from the forest have been shown to provide material
115
incentives to cooperate (Baland and Platteau, 1999, Lise, 2000, Agrawal and
Chhatre, 2006). Adhikari and Di Falco (2009) consider the determinants of access to
participatory processes, defined as procedural justice or involvement in decision-
making rather than entry to a scheme (Skutsch, 2000, Pascual et al., 2010). Looking
at the probability of membership in local forest management institutions in Nepal,
Adhikari and Di Falco find that lower-caste groups have lower probability of being
elected as members of the committee of user groups. Dayton-Johnson (2000)
creates a model of determinants of collective action supported by evidence from
Mexican cooperative irrigation systems. The paper finds that cooperation is highly
dependent on the distributive rules for cost sharing and water allocation, with
social heterogeneity and landholding inequality associated with lower
maintenance of irrigation systems.
The literature on cooperation has focussed on the impact of heterogeneity in
wealth, interest, and social diversity of resource appropriators. Naidu (2009)
summarises that the impact of wealth depends on the relationship between wealth
and the returns from the forest resource. Naidu also finds that moderate levels of
social diversity lead to low collective management, but high social diversity can
lead to high collective management. This study underlines that the impact of
wealth, interest and social diversity on CFM success remain mixed (see also
Poteete and Ostrom, 2004 for a review). This is complicated by studies using
different measures of cooperation, undertaken at differing scales and with a
variety of methods. The existing body of literature on cooperation largely
considers cooperation ex-post. As Cavalcanti (2010) notes, if factors to improve
cooperative self-governance are known they can be actively promoted and that this
is particularly relevant where common property regimes are instigated by external
actors. This is the case for REDD+ via CFM at the case-study site, hence
household’s attitudes and cooperative intention are explored ex-ante.

116
4.4. Data collection and analysis
4.4.1. Fieldwork permissions
In order to undertake research in Ethiopia, a memorandum of understanding was
signed with the Ethiopian Wildlife Conservation Authority of the Ethiopian
Federal Government. Permissions were also sought from the Oromia Ministry of
Agriculture and Rural Development, the Bale Mountains National Park authorities,
and the woreda level Ministry of Agriculture and Rural Development offices. At
each survey location permission to conduct surveys was also requested from
village leaders after an introduction to the research aims and the fieldwork team
had been given. The Economic and Social Research Council provided funding for a
total of 61 weeks of fieldwork (inclusive of 14 weeks for difficult language
training). The Frankfurt Zoological Society and BERSMP provided further financial
and logistical support in-country. The British Embassy in Ethiopia also provided
additional finance to undertake forest carbon stock assessment in the (proposed)
Bale Mountains National Park.
4.4.2. Fieldwork teams
Primary data for forest carbon stock analysis was undertaken with a team of para-
ecologists who were trained how to undertake direct tree measurements. Between
December 2008 and April 2009, 49 carbon plots were undertaken. In a second
fieldwork period between December 2009 and April 2010 a further 59 carbon plots
were inventoried by a smaller team also trained in the same methodologies.
Two enumerators were employed to conduct the household survey on the basis of
their English language skills in an attempt to limit information lost in translation.

117
One enumerator also had prior experience with household surveys and with
undertaking research. These enumerators were local to the region, but not to the
villages surveyed. Thus they had in-depth local knowledge particularly about local
conditions and customs, without creating data sensitivity issues. At each survey
location a local liaison officer was also employed to guide the enumerators to
households. Enumerators were first trained in the objectives of the research,
rationale and objectives, the application of the methodologies, how to approach
respondents and the recording of responses. These enumerators were accompanied
at fieldwork sites and supervised during questionnaires at intervals. Enumerators
recorded responses in data books also reviewed at regular intervals.
4.4.3. Forest carbon plots
Forest carbon plot sampling was based on forest stratification by UNIQUE forestry
consultants into: tropical moist degraded forest; tropical moist non-degraded
forest; degraded tropical dry forest; degraded woodland; and non-degraded
woodland (UNIQUE, 2008). No non-degraded tropical dry forest remains. Carbon
stocks were assessed in all forest types except woodlands where allometric
relationships were not available for the specific location in the BME. Furthermore,
the woodlands will act as a leakage belt under the proposed REDD+ project and
will therefore not generate emission reductions for sale. Forest carbon plots were
dispersed across the study area, but limited to logistically accessible areas.
Logistical limitations of permissions and transport prevented a priori calculation of
the sample size required to estimate mean forest carbon stocks with a particular
level of confidence. However, retrospective power analysis was undertaken to
establish the maximum predictive power achieved by the primary data collection.
118
Drawing on forest inventory protocols (MacDicken, 1997, Pearson et al., 2005,
Greenhalgh et al., 2006), tree measurements were collected from a total of 108
forest plots of 20m by 20m (Figure 5). The geo-coordinates of forest plots were
identified by overlaying 1km by 1km latitude and longitude grids on maps of the
selected study areas, with random number generation used to identify crosshairs
representing the centre of forest plots. Plots were then located on foot with a
compass and a handheld global positioning system. Within each plot, the diameter
at breast height (dbh) – or 1.3 metres above the ground – of all trees was recorded
with a lower limit of 5cm dbh was used to define a ‘tree’ and buttress roots not
encountered. In addition to canopy cover, the angle of the slope of the land,
altitude and aspect was also recorded. Tree measurements were noted on data
sheets, later entered into Excel after which documented allometric relationships
were applied to estimate forest carbon stocks.
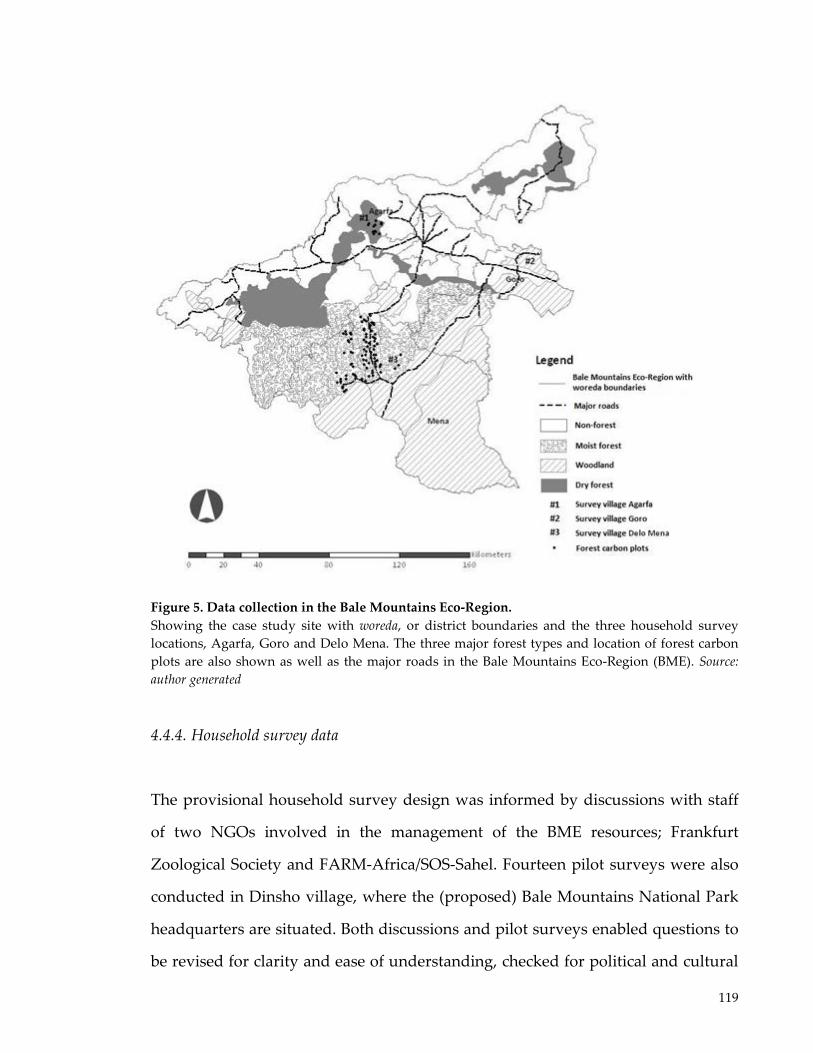
119
Figure 5. Data collection in the Bale Mountains Eco-Region. Showing the case study site with woreda, or district boundaries and the three household survey locations, Agarfa, Goro and Delo Mena. The three major forest types and location of forest carbon plots are also shown as well as the major roads in the Bale Mountains Eco-Region (BME). Source: author generated 4.4.4. Household survey data
The provisional household survey design was informed by discussions with staff
of two NGOs involved in the management of the BME resources; Frankfurt
Zoological Society and FARM-Africa/SOS-Sahel. Fourteen pilot surveys were also
conducted in Dinsho village, where the (proposed) Bale Mountains National Park
headquarters are situated. Both discussions and pilot surveys enabled questions to
be revised for clarity and ease of understanding, checked for political and cultural

120
sensitivities, and tailored to the dominant activities of the region. Post pilot, the
household survey was condensed substantially due to lengthy completion times
could impact on results due to respondent fatigue (Angelsen et al., 2011). A by-
product of the reduction of the survey is the omission of household composition,
which means that the standardisation to adult equivalents is not possible, as well
as more detailed information on households with respect to their distance from
market and assets such as livestock holdings. Due to the sensitive nature of the
question, data on total household income was also removed at the pilot stage.
Between January and April 2010, 237 household surveys were undertaken in three
survey villages (see Chapter 3; Figure 5). Given the disbursed nature of households
at the household survey villages, respondents were selected opportunistically from
walks through town and agricultural fields. It is acknowledged that this non-
probabilistic sampling method suffers from self-selection, but was an unavoidable
limitation of the survey. Ideally, to reduce bias complete randomisation of
households would be achieved given prior knowledge of number and identity of
households in the area. This information was not available. A further limitation
was that survey respondents were also all male. This was a result of cultural
barriers preventing enumerators approaching females within their households.
These limitations and their implications are discussed further in Chapter 9.
It had been intended that the biomass needs of households could be established
through survey data. Households reported fuelwood and other products in
‘donkey loads’, however. Although an attempt was made to assess the weights of
donkey loads at a major market place, neither sellers no buyers were willing to
participate as both sale and purchase is currently illegal: dead firewood can only
be collected for home consumption. Furthermore, I was also unable to find
consistent or valid estimates of donkey load volumes for the region. As households
121
were also unable to estimate the area of forest which they utilise I was also unable
to estimate the area over which forest products were sourced. Even with the
forester’s rule of thumb of 1m3/ha/year of growth, I was therefore unable to
estimate if wood extraction was sustainable. This is a limitation of the thesis that
could be conducted in the future to increase the utility of this analysis, and is
returned to in Chapter 9.
4.4.5. Market price survey
In the BME, households sell home produce in unrestricted markets, there are no
barriers to entry, and on market days many buyers and sellers converge to sell
identical produce. As noted in Section 4.3.2.4. there are limitations to the market
price approach under imperfect market conditions, however, overestimation was
attempted to be minimised as much as possible through surveying local-level
markets as establishing shadow prices was not possible.
In order to determine market prices, twelve market price surveys for key forest
and crop products were conducted during the household survey period (see
Appendix 2). A limitation of the market price survey is that seasonality in prices
could not be assessed; field work was restricted to dry season due to transport
limitations and lack of all-weather roads. Three market surveys were conducted in
major towns and three at survey villages, with two individuals gathering price
data at each. Market prices were averaged out over all locations. These market
prices were applied to products that households derive from the forest area and to
households’ crop yields. Income was converted from Ethiopian Birr (ETB) to US
dollars at 1 ETB to US$ 0.0749, the average exchange rate of the first quarter of
2010, when the survey was carried out.
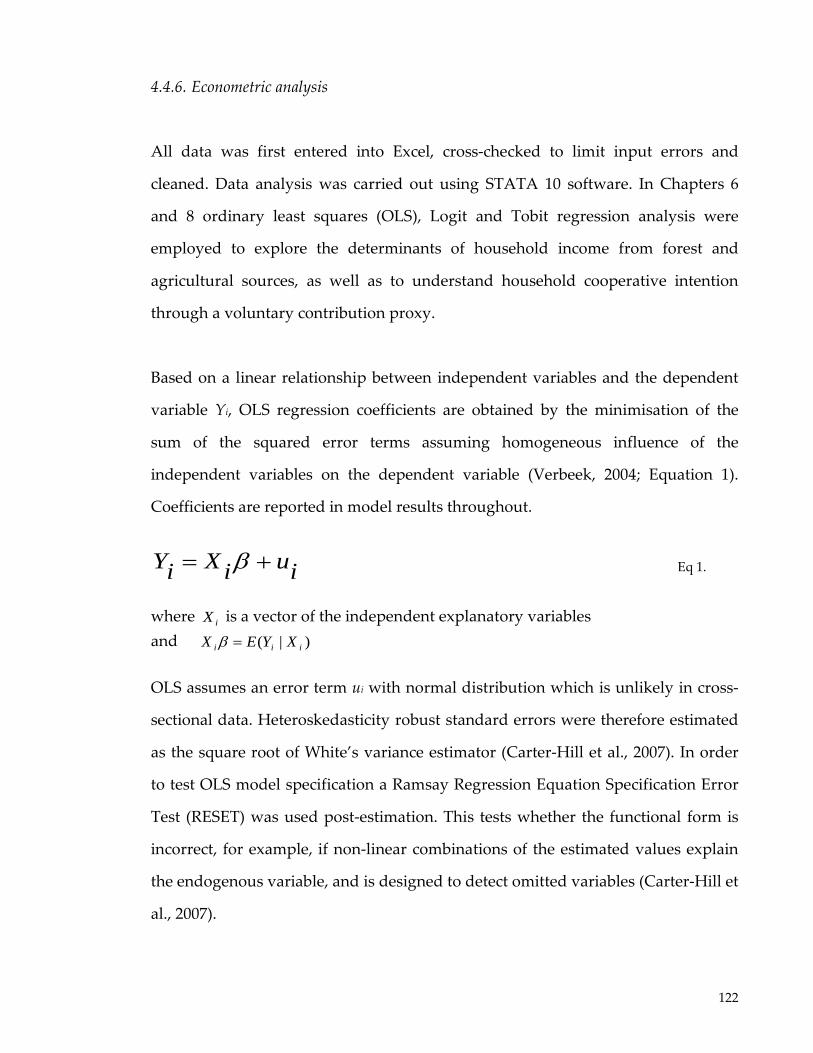
122
4.4.6. Econometric analysis
All data was first entered into Excel, cross-checked to limit input errors and
cleaned. Data analysis was carried out using STATA 10 software. In Chapters 6
and 8 ordinary least squares (OLS), Logit and Tobit regression analysis were
employed to explore the determinants of household income from forest and
agricultural sources, as well as to understand household cooperative intention
through a voluntary contribution proxy.
Based on a linear relationship between independent variables and the dependent
variable Yi, OLS regression coefficients are obtained by the minimisation of the
sum of the squared error terms assuming homogeneous influence of the
independent variables on the dependent variable (Verbeek, 2004; Equation 1).
Coefficients are reported in model results throughout.
iuiXiY += β Eq 1.
where iX is a vector of the independent explanatory variables and )|( iii XYEX =β OLS assumes an error term ui with normal distribution which is unlikely in cross-
sectional data. Heteroskedasticity robust standard errors were therefore estimated
as the square root of White’s variance estimator (Carter-Hill et al., 2007). In order
to test OLS model specification a Ramsay Regression Equation Specification Error
Test (RESET) was used post-estimation. This tests whether the functional form is
incorrect, for example, if non-linear combinations of the estimated values explain
the endogenous variable, and is designed to detect omitted variables (Carter-Hill et
al., 2007).
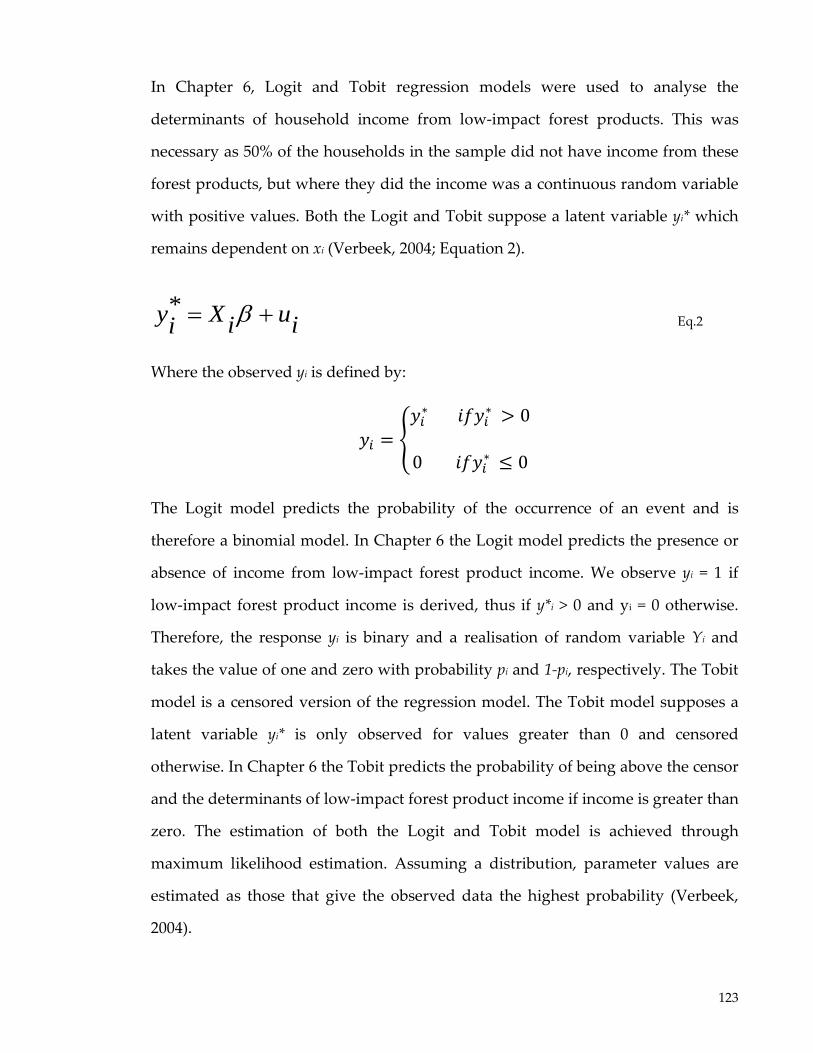
123
In Chapter 6, Logit and Tobit regression models were used to analyse the
determinants of household income from low-impact forest products. This was
necessary as 50% of the households in the sample did not have income from these
forest products, but where they did the income was a continuous random variable
with positive values. Both the Logit and Tobit suppose a latent variable yi* which
remains dependent on xi (Verbeek, 2004; Equation 2).
iuiXiy += β* Eq.2
Where the observed yi is defined by:
𝑦𝑖 = �𝑦𝑖∗ 𝑖𝑓𝑦𝑖 ∗ > 0
0 𝑖𝑓𝑦𝑖 ∗ ≤ 0
The Logit model predicts the probability of the occurrence of an event and is
therefore a binomial model. In Chapter 6 the Logit model predicts the presence or
absence of income from low-impact forest product income. We observe yi = 1 if
low-impact forest product income is derived, thus if y*i > 0 and yi = 0 otherwise.
Therefore, the response yi is binary and a realisation of random variable Yi and
takes the value of one and zero with probability pi and 1-pi, respectively. The Tobit
model is a censored version of the regression model. The Tobit model supposes a
latent variable yi* is only observed for values greater than 0 and censored
otherwise. In Chapter 6 the Tobit predicts the probability of being above the censor
and the determinants of low-impact forest product income if income is greater than
zero. The estimation of both the Logit and Tobit model is achieved through
maximum likelihood estimation. Assuming a distribution, parameter values are
estimated as those that give the observed data the highest probability (Verbeek,
2004).
124
The explanatory variables used in regression models were selected based on their
predicted impacts on the dependent variable. Thus cause and effect relationships
are based on a priori assumptions. This is opposed to an ecological or more natural
sciences reductionist approach where non-significant explanatory variables are
eliminated in a step-wise approach (Armsworth et al., 2009). The cross-sectional
data-set is limited given that there are three survey locations with three differing
forest types. Effects due to forest characteristics and village characteristics,
therefore, cannot be separated. A village dummy variable was included to
encapsulate these differences to help control for unobserved but constant variation
across survey locations. These village fixed effects should provide consistent
estimates even in the presence of correlation between village-specific
heterogeneity, which is time invariant, and the right hand side variables. A
correlation matrix was assessed pre-estimation to assess the possibility of
multicolinearity – where a linear relationship between explanatory variables gives
an unreliable regression estimate – as the individual impact of each variable is
hard to determine (Verbeek, 2004).

125
Chapter 5: Uncertain emission reductions from forest conservation
5.1. Introduction
5.1.1. Problem statement
Assessing the decrease in emissions from projects or policies impacting on forests
still contains substantial uncertainty despite a global proliferation of REDD+
activities. This emission reductions accounting is necessary to illustrate both
climate change mitigation potential of forests, as well as monitoring progress
towards climate change mitigation targets through forest conservation activities.
Emission reduction estimates are therefore necessary irrespective decisions to be
made on the ultimate financing mechanism of REDD+ under the United Nations
Convention on Climate Change (UNFCCC) (see Section 2.1 for a discussion of
financing options for REDD+). Under a project-based approach to REDD+,
however, emission reductions accounting is critical. These sub-nationally
implemented REDD+ projects generate lessons for future REDD+ implementation,
with a view to trading emission reductions in voluntary carbon markets (see
Section 4.3.1 for a discussion on REDD+ and the voluntary carbon markets). Thus
the revenues available to alter economic incentives for forest conservation in such
REDD+ projects will be dependent on the market value of the emission reductions
and the costs of getting them to market.
Emission reductions accounting requires the quantification of forest area, forest
area change and forest carbon stock. Advances are being made in the technology
and accessibility of remote sensing imagery for the measurement of forest area and
forest area change and it is being increasingly used to infer forest biomass and so
foret carbon stocks (Achard et al., 2004, Mayaux et al., 2005, DeFries et al., 2007,
Ramankutty et al., 2007, Baccini et al., 2008, Goetz et al., 2009, Bucki et al., 2012).

126
Baker et al. (2010) report that remote sensing is mature enough to use in national
systems of forest cover monitoring systems; although more research could still
improve accuracy and detail of this imagery. Romijn et al. (2012), however, found
capacity gaps for forest monitoring for REDD+ still existed in many forested
nations and particularly in Africa and many countries lacked resources and
expertise to make the most in advances in satellite imagery technology, for
example.
Appropriate methods to establish the past and predicted rates of forest change in
order to calculate the emission reductions resulting from an intervention continue
to be developed (Angelsen, 2008, Olander et al., 2008, Bond et al., 2009, Griscom et
al., 2009, Huettner et al., 2009, Estrada, 2011). For project-based REDD+, standards
have emerged that set out detailed methods and procedures, including for the
establishment of baselines (Estrada and Joseph, 2012). The Voluntary Carbon
Standard (VCS) is the most commonly applied in voluntary carbon markets, and
price premiums can be received for emission reductions registered to the VCS and
other carbon standards (e.g. VCS, 2007, CCBA, 2008).
This Chapter focusses on the third aspect of emission reductions accounting; forest
carbon stocks. Forest carbon stock refers to the carbon content in the dry biomass
of a forest per unit area, often measured in tonnes of carbon per hectare (UNDP,
2009). High uncertainty in forest carbon stock estimates often results from a lack of
data on key forest variables and parameters, resources or capacity (Brown et al.,
1989, Smith and Heath, 2001, Andersson et al., 2009). Changes in the estimates of
forest carbon stock in the FAO Forest Resource Assessment, a widely used
database of global and national forest statistics, for example, are found to have
changed due to information availability rather than stock changes (Houghton,
2005). In 2009, a technical paper of the UNFCCC considering the costs of

127
monitoring systems for REDD+ indicated that a number of developing countries
have insufficient capacity to undertake forest monitoring and mapping; inclusive
of forest carbon stocks (UNFCCC, 2009). Three years later, Romijn et al. (2012)
found similar conclusions to the UNFCCC in their assessment of the status and
development of monitoring capacities for REDD+, also identifying that Africa
suffers the greatest capacity gap.
As popularity in REDD+ has grown, so has literature on the estimation of forest
carbon stocks and uncertainty in forest carbon stocks as they pertain to a REDD+
mechanism (Houghton and et al., 2001, Houghton, 2005, Mollicone et al., 2007,
Ramankutty et al., 2007, Pelletier et al., 2010). The uncertainty of forest carbon
stocks has also been demonstrated through global and regional forest carbon stock
mapping efforts. Saatchi et al. (2011), for example, produced a global map of forest
carbon stocks through satellite imagery and on-the-ground forest plots.
Propagating errors through the estimation process they found uncertainty in forest
carbon stocks of 38% over Latin America, sub-Saharan Africa and Southeast Asia;
although the analysis was not applied at a country level. Work is ongoing to
improve forest carbon stock estimates; Le Toan et al. (2011) outline an ongoing
initiative to map global biomass, of which approximately 50% is carbon, with error
not exceeding 20%.
As a result of lack of data at finer resolution at national and sub-national scales, the
application of biome-averaged forest carbon stock data to estimate emission
reductions has, therefore, become widespread where data on forest carbon stock is
not available locally (Brown and Gaston, 1995, Gibbs et al., 2007, Djomo et al.,
2010). The Intergovernmental Panel on Climate Change (IPCC) have compiled best
available methods and published guidance and guidelines for countries to
undertake GHG inventories and to identify the emissions and removals of GHGs
128
from land use, land-use change and forestry activities (IPCC, 2003, IPCC, 2006).
IPCC guidance is intended to promote broad engagement of countries irrespective
of their data sets and capacities to manipulate this data (see Baker et al., 2010). As a
result there are three Tiers of methods with increasing levels of uncertainty, with
countries selecting Tiers based on data requirements and methodological
complexity. While Tier 3 uses advanced estimation approaches that involve
complex models and highly disaggregated data, Tier 2 employs more country-
specific carbon stock information and requires activity data disaggregated to
smaller scales, and Tier 1 is based on biome-averaged data for carbon stocks
(Böttcher et al., 2009).
Biome-averaged data used in Tier 1 is able to capture broad ecological variables
influencing forest carbon stocks, such as temperature and rainfall (Chave et al.,
2004, GOFC-GOLD, 2008), but it obscures substantial local forest heterogeneity
(Houghton and et al., 2001, Bradford et al., 2010). An emission reductions estimate
using this simple accounting method is, therefore, likely to contain more
uncertainty than applying more complex and data intense methods which
statistically relate measured forest attributes to above-ground carbon stock using
allometric relationships (Brown, 1997, Chave et al., 2005). Comparisons across six
countries by GOFC-GOLD (2008) found that application of biome-averaged
defaults overestimated forest carbon stock as much as 33% in Mexican temperate
forest and underestimated by as much as 44% in African rainforest when
compared to plot measurements. The uncertainty introduced by carbon accounting
methods is non-trivial, but the magnitude and direction of the discrepancy so far
varies from case to case.
While IPCC guidance was not designed to produce emission estimates for REDD+
projects, the UNFCCC has supported the use of guidance by countries for REDD+

129
(UNFCCC, 2009). A large discrepancy between the use of simple and complex
forest carbon stock methods in estimating emission reductions could be the
difference between making a decision to implement a REDD+ project or not.
However, there is no standardised method to assess or communicate uncertainty
in emission reductions accounting. Where carried out, uncertainty assessments
have relied upon published information and expert judgement. Less commonly
measurement data has been used and total uncertainty quantified through
propagation of error and Monte Carlo simulation methods (Heath and Smith, 2000,
Smith and Heath, 2001, IPCC, 2003, Peltoniemi et al., 2006, Monni et al., 2007).
The principle of conservativeness remains a dominant approach to dealing with
uncertainty in emission reductions accounting (Mollicone et al., 2007, Grassi et al.,
2008). The principle of conservativeness requires omitting carbon pools or taking
lower bound estimates to ensure a low probability that carbon emission reductions
are overestimated (GOFC-GOLD, 2008). However, conservativeness assumes zero
uncertainty and decision-makers are left without an idea of the confidence interval
of estimate of emission reductions (Andersson et al., 2009). Attempts are being
made to communicate the uncertainties of emission reductions accounting to
policy-makers and to aid decision-making (Brown, 2002, Andersson et al., 2009,
Waggoner, 2009). Kerr et al. (2004), for example, quantitatively translate errors in
estimating carbon stocks into environmental integrity of emission reductions for
avoided deforestation in their assessment of potential emission reductions in Costa
Rica, finding that uncertainty is impacted strongly by forest type; particularly in
tropical wet forest. Pelletier et al. (2010) used five carbon stock estimates for
Panamanian forests in land conversion and transition models, finding 144%
difference in emission reductions resulted from highest to lowest. Acceptance of
Tier 1 accounting, however, remains high.
130
Feasibility studies for project-based REDD+ will often combine uncertain forest
carbon stocks with uncertain market variables. With a 20-100 year project lifespan,
a feasibility assessment for a REDD+ mechanism requires assumptions and best-
guesses to be made regarding voluntary carbon market price trends,
implementation and transaction costs. Using a back of the envelope calculation
Pelletier et al. (2010) take their emission reduction accounting using five forest
carbon stock estimates further, by demonstrating that break even prices for
emission reductions were more than twice as high with lowest global default forest
carbon stocks as compared to local forest carbon stock estimates in Panama.
There are a number of REDD+ projects and activities emerging in Sub-saharan
Africa (Diaz et al., 2011, Climate Funds Update, 2011, Forest Carbon Portal, 2012).
The Kasigua Corridor REDD+ Project in Kenya, run by Wildlife Works, for
example, has been generating emission reductions since 2005 and has been
exemplary in being the first REDD+ project to deliver validated, verified and
issued VCS certification emission reductions (Wildlife Works, 2012). Other
countries in East Africa are following this example, but Africa suffers substantial
data gaps for forest carbon stocks (Glenday, 2006, FPAN, 2010, Mustalahti et al.,
2012, Romijn et al., 2012). While simple accounting methods can be, and often are,
applied to calculate emission reductions potential in REDD+ feasibility studies,
complex accounting methods are applied during project development and to meet
carbon standards (Shoch et al., 2011). Resulting discrepancies in emission
reductions between these estimates are likely to erode the credibility of a REDD+
project. It may not, therefore, be surprising that expectations of wealth transfer
through REDD+ mechanisms have been high but not always forthcoming
(Clements, 2010).

131
REDD+ may not be suitable to overcome the opportunity cost of private incentives
driving deforestation in all situations. For REDD+ projects, if estimated revenues
are insufficient to meet cost demands of REDD+ then other tools to fund forest
conservation should be considered (Fisher et al., 2011). Conversely, climate change
mitigation potential is lost where emission reductions are more substantial than a
feasibility assessment would indicate. Uncertainty in emission reductions
accounting must be quantified, reduced where possible, and communicated more
appropriately (Waggoner, 2009, Baker et al., 2010).
5.1.2. Aims and objectives
Using a proposed REDD+ project in the Bale Mountains Eco-Region (BME) of
Ethiopia, this paper quantifies the discrepancy between simple and complex forest
carbon stock methods to estimate emission reductions. It then explores the
potential REDD+ revenues under uncertainties in both forest carbon stock and
market variables and the resultant implications for project implementation at the
case study site. This paper adds to current knowledge through the collection of
primary forest data and calculation of forest carbon stock in the BME. It also builds
on a limited literature on the financial implications of emission reductions
accounting discrepancies as well as implications on the environmental integrity of
REDD+ projects.
5.2. Methods
5.2.1. Assessing carbon stocks and estimating emission reductions
In the BME of Ethiopia a REDD+ project is being developed by the Oromia Forest
and Wildlife Enterprise (OFWE), with the support of the Bale Eco-Region
Sustainable Management Program (BERSMP): a joint NGO program between

132
FARM-Africa and SOS Sahel Ethiopia (see Chapter 3 for a full project description).
Ethiopia is not well known for REDD+ activities and East African forests are often
characterised by miombo and acacia woodland; thus they are not as dense as
rainforest of the Congo Basin or West Africa. The dry and moist, montane forests
of East Africa, however, are gaining prominence for REDD+ project activities (see
FPAN, 2010, Diaz et al., 2011).
The proposed REDD+ project lies in the south eastern Ethiopian Highlands in
Oromia Regional State between 50˚22'-80˚08'N and 38˚41-40˚44'E. The annual
temperature of the Bale zone is 17.5˚C ranging from 10˚C to 25˚C, with annual
rainfall of 875mm experienced in one long season between June and October, and
one short rainy season between March and May (Yimer et al., 2006). Moist tropical
forest is found between 2600 masl and 1500 masl, characterised by Hagenia
abyssinica and wild coffee (Coffea arabica). North of the plateau habitats comprise of
dry forest, woodlands, grasslands and wetlands, largely between 2500 masl and
3500 masl. The dry forests contain high-value commercial species such as Juniperus
procera and Podocarpus falcatus as well as Prunus africanus, a threatened species. The
lower altitude land of the south east of the BME, below 1500 masl, is dominated by
acacia woodland (Teshome et al., 2011, UNIQUE, 2008).
The BME has deforestation rates four times the national average at 4% losses in
forest area annually (Dupuy, 2009). Ethiopia is also in the top ten countries for
forest loss in tropical Africa (FPAN, 2010). The main drivers of deforestation and
forest degradation in Ethiopia are small scale conversion to agriculture, large scale
conversion to agriculture, and unsustainable forest management (R-PP, 2011). This
pattern of exploitation is consistent over the BME, with rural communities rapidly
deforesting to procure land for crops and livestock grazing and to meet livelihood
needs through timber and firewood extraction (BERSMP, 2006, BMNP, 2007).
133
To address the decline in forest area, the Oromia Forest and Wildlife Enterprise
(OFWE) are implementing CFM across all forests of the BME. Therefore, CFM is
regarded here as a mechanism to implement the REDD+ project, alongside the
creation of 15,000 hectares of woodlots and fuel efficient stoves to reduce
household wood fuel demands (see Chapter 3 and Chapter 9 for a discussion on
REDD+ via CFM). The project is in the early stages of development and secondary
data in this paper is based on an early feasibility studies by forestry consultants
UNIQUE (UNIQUE, 2008, UNIQUE, 2010). The estimates of required area for
woodlots to meet household demands, however, are based on their expert
judgement rather than through assessment of biomass needs per households.
The project area covers 923,593 hectares, of which 60% is dry and moist tropical
forest, the REDD+ project aims to reduce deforestation to 1% a year by project-year
20 within this area. The decline in deforestation is predicted to be gradual as the
project is implemented, with rates of deforestation slowed to 3% in years 1 to 5, 2%
in years 6 to 10, and 1% in years 11 to 20. REDD+ revenue is generated from
avoided deforestation only on dry and moist forest. The area of avoided
deforestation amounts to 5,769 ha/yr in years 1-5, 11,537 ha/yr in years 6-10 and
17,306 ha/yr in years 11 to 20. This amounts to 259,585 ha of avoided deforestation
over the project lifespan. Although emission reductions generated on woodland
are not sold, they still must be generated, thus the area of avoided deforestation
including dry forest, moist forest and woodland amounts to 9,236 ha/yr in years 1-
5, 18,472 ha/yr in years 6-10 and 27,708 ha/yr in years 11 to 20: a total of 415,617 ha.
As reported across wider Africa, local estimates of forest carbon stocks for use in
modelling emission reductions from REDD+ in Ethiopia are few, and what exists is
wide-ranging (FPAN, 2010). The IPCC present an Africa specific forest carbon

134
stock estimate of 122tC/ha in tropical moist forest and 56tC/ha in tropical dry
forest, as well as estimates based on ecological zones of 85tC/ha in tropical moist
forest and 61tC/ha in tropical dry forest (IPCC, 2006based on converting biomass
to carbon using 0.47 carbon fraction of biomass). Gibbs et al. (2007) reviews forest
carbon stock estimates across forest types in Africa with estimates in the range of
30 to 200tC/ha. A later study estimated forest carbon stocks in Africa between 0
and 454tC/ha, although only three countries are used to produce this estimate;
Republic of Congo, Cameroon and Uganda (Baccini et al., 2008). Lewis et al. (2009)
estimated forest carbon stocks from permanent plots across Africa with average of
202 tC/ha. Ethiopia’s national average forest carbon stocks have been reported at
37tC/ha and 47tC/ha (FAO, 2000, Brown, 1997). The national forest inventory of
Ethiopia, however, is criticised for conflicting data (Teketay et al., 2010) and no
estimates of forest carbon stock are known by the author for the BME. The country-
wide estimate, however, is predicted to underestimate forest carbon found in the
BME REDD+ project area as a result to Ethiopia’s wide-ranging topography.
Three forest carbon stock estimates were used to model emission reductions:
1. Ecological zone specific forest carbon stock from the IPCC Land Use, Land-
Use Change and Forestry (LULUCF) Good Practice Guidance (IPCC, 2003)
2. Africa specific forest carbon stock from the IPCC Agriculture, Forestry and
Other Land Use guidelines (IPCC, 2006)
3. Primary estimate of forest carbon stock reliant on field sampling of above-
ground tree biomass in the BME.
The application of default data from the Intergovernmental Panel on Climate
Change (IPCC) illustrates simple forest carbon stock methods, whereas primary
data collection in the moist and dry tropical forest of the BME represents more
complex forest carbon stock methods.

135
The annual emission reductions generated by the BME REDD+ project can be
represented by Equation 3. Where ERt,i are emission reductions in tons of carbon
dioxide (tCO2) in year t, utilising forest carbon stock estimate Ci (tC/ha) where i can
take the value of 1, 2 or 3, representing the three forest carbon stock estimates used
to model emission reductions. DBAU is the annual business-as-usual (BAU)
deforestation in a without project baseline in hectares; DREDD the area of
deforestation (ha) during the project in year t; and 44/12 is the ratio of the
molecular weight of carbon dioxide to that of carbon.
( )1244DD CER REDDtBAUiit, −= Eq. 3
The annual area of deforestation under a BME REDD+ project baseline, DREDD, is
based on project goals to reduce deforestation below the annual BAU baseline in
three stages. In years 1 to 5 DREDD is 3% as compared to DBAU of 4%, in years 6 to 10
DREDD is 2%, and in years 11 to 20 DREDD is 1%. The total emission reductions
generated by the project, Eproject, i (tCO2), can be represented by Equation 4 which
sums annual emissions over the 20-year project lifespan.
1244DD 20 CER
20
1tREDDtBAUiiproject,
−= ∑
= Eq. 4
5.2.1.1. Forest plots and carbon stocks
Primary data collection was focussed on the above-ground tree biomass carbon
pool. Containing the greatest fraction of total living biomass in a forest, this pool is
most immediately impacted by deforestation and degradation (Brown, 1997, FAO,
136
2003). This estimate therefore omits below-ground carbon in tree roots, soil organic
carbon, and that contained in dead wood and litter. The forest was stratified using
satellite imagery by UNIQUE forestry consultants into: tropical moist degraded
forest; tropical moist non-degraded forest; degraded tropical dry forest; degraded
woodland; and non-degraded woodland. No non-degraded tropical dry forest
remains (UNIQUE, 2008). Carbon stocks were assessed in all forest types except
woodlands, which will act as a leakage belt under a REDD+ project and will not
generate emission reductions for sale.
Drawing on forest inventory protocols (MacDicken, 1997, Pearson et al., 2005,
Greenhalgh et al., 2006), data were collected from 108 forest plots of 20m by 20m
between December 2008 and April 2010 (see Figure 5, Chapter 4). Plots were
dispersed across the study area, but limited to logistically accessible areas and
regions for which permissions to undertake field sampling was granted by the
Ministry of Agricultural and Rural Development and village elders. The geo-
coordinates of forest plots were identified by overlaying 1km by 1km latitude and
longitude grids on region maps, with random number generation used to identify
crosshairs representing the centre of forest plots. Plots were then located on foot
with a compass and a handheld global positioning system (Figure 6). Within each
forest plot, the diameter at breast height (dbh) – or 1.3 metres above the ground –
of all trees was recorded. Butress roots that obstructed dbh measurements were not
encountered. In addition to dbh, canopy cover, the angle of the slope of the land,
altitude and aspect were also measured. Tree saplings with dbh less than 5cm dbh
were not measured; a lower limit of 5cm dbh was used to define a ‘tree’.
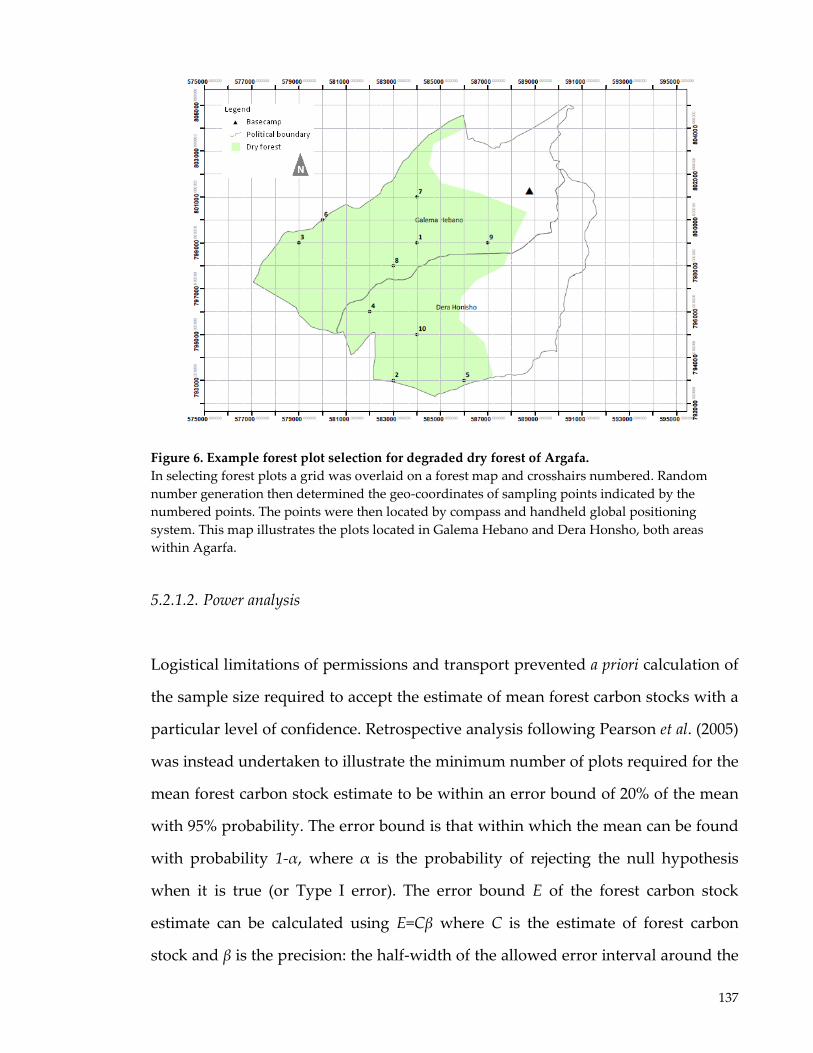
137
Figure 6. Example forest plot selection for degraded dry forest of Argafa. In selecting forest plots a grid was overlaid on a forest map and crosshairs numbered. Random number generation then determined the geo-coordinates of sampling points indicated by the numbered points. The points were then located by compass and handheld global positioning system. This map illustrates the plots located in Galema Hebano and Dera Honsho, both areas within Agarfa.
5.2.1.2. Power analysis
Logistical limitations of permissions and transport prevented a priori calculation of
the sample size required to accept the estimate of mean forest carbon stocks with a
particular level of confidence. Retrospective analysis following Pearson et al. (2005)
was instead undertaken to illustrate the minimum number of plots required for the
mean forest carbon stock estimate to be within an error bound of 20% of the mean
with 95% probability. The error bound is that within which the mean can be found
with probability 1-α, where α is the probability of rejecting the null hypothesis
when it is true (or Type I error). The error bound E of the forest carbon stock
estimate can be calculated using E=Cβ where C is the estimate of forest carbon
stock and β is the precision: the half-width of the allowed error interval around the

138
mean expressed as a percentage of the mean. The precision is also the probability
of not rejecting a false null hypothesis (or a Type II error), and from this the
probability of finding a difference that does exist, or the power of a statistical test,
can be calculated using 1-β.
This retrospective power analysis can, therefore, establish the maximum predictive
power achieved by the primary data collection and estimation of forest carbon
stocks. Given that the total project area, total size of each forest strata, the forest
plot area, and standard deviation of carbon stocks for each stratum is known, for L
strata, n plots are required and can be calculated in Equation 5.
∑
∑
=
=
×+×
×
= L
1j
2jj2
22
L
1j
2jj
)sN(t
EN
)sN(
nTOT Eq. 5
where, Nj is the maximum number of sample forest plots in stratum j, sj is the
standard deviation for stratum j, NTOT is the maximum number of sample plots in
the project area, E is the allowable error or the half-width of the desired error
interval (calculated by multiplying mean carbon stock by the desired precision in
percentage), and t is the sample statistic from the t-distribution for the 95%
confidence level.
Once n has been determined, the required distribution of plots across strata is
shown by Equation 6. The actual number of plots sampled can then be compared
to the number of plots estimated by this power analysis to achieve a forest carbon
stock estimate with at least 20% precision with a 95% probability.
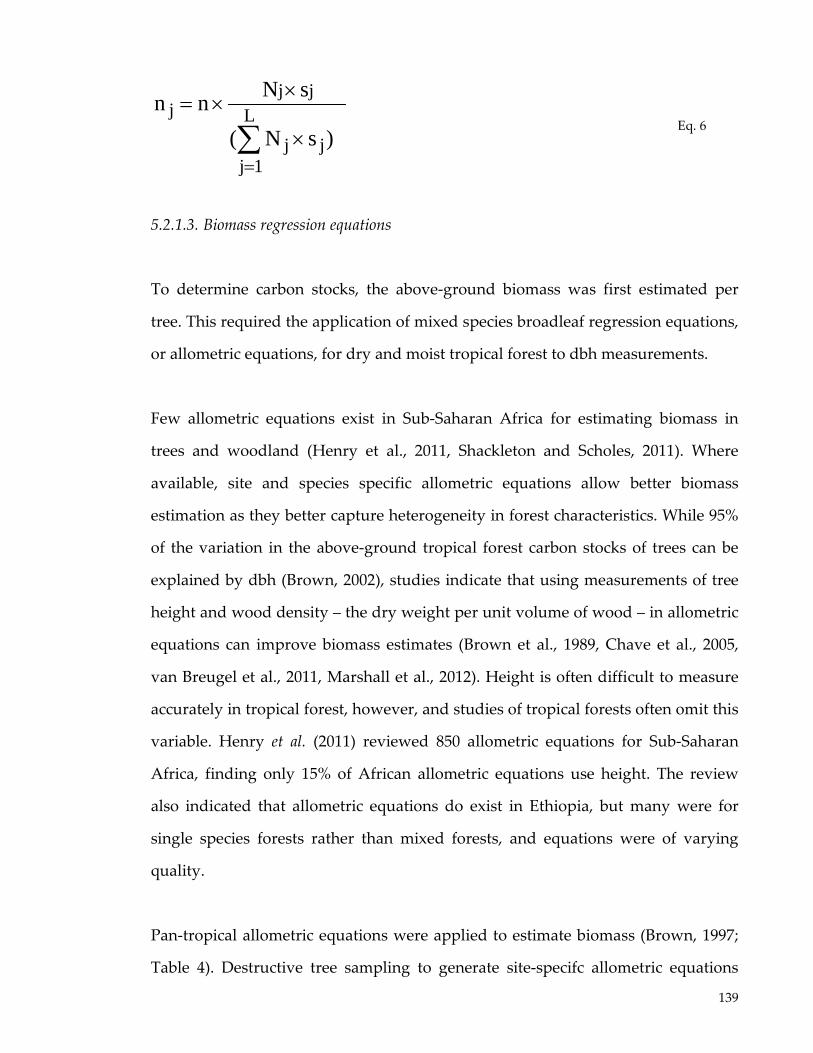
139
∑=
×
××= L
1jjj
jjj
)sN(
sNnn Eq. 6
5.2.1.3. Biomass regression equations
To determine carbon stocks, the above-ground biomass was first estimated per
tree. This required the application of mixed species broadleaf regression equations,
or allometric equations, for dry and moist tropical forest to dbh measurements.
Few allometric equations exist in Sub-Saharan Africa for estimating biomass in
trees and woodland (Henry et al., 2011, Shackleton and Scholes, 2011). Where
available, site and species specific allometric equations allow better biomass
estimation as they better capture heterogeneity in forest characteristics. While 95%
of the variation in the above-ground tropical forest carbon stocks of trees can be
explained by dbh (Brown, 2002), studies indicate that using measurements of tree
height and wood density – the dry weight per unit volume of wood – in allometric
equations can improve biomass estimates (Brown et al., 1989, Chave et al., 2005,
van Breugel et al., 2011, Marshall et al., 2012). Height is often difficult to measure
accurately in tropical forest, however, and studies of tropical forests often omit this
variable. Henry et al. (2011) reviewed 850 allometric equations for Sub-Saharan
Africa, finding only 15% of African allometric equations use height. The review
also indicated that allometric equations do exist in Ethiopia, but many were for
single species forests rather than mixed forests, and equations were of varying
quality.
Pan-tropical allometric equations were applied to estimate biomass (Brown, 1997;
Table 4). Destructive tree sampling to generate site-specifc allometric equations

140
was not feasible at the case study site. Height measurements were also impractical
with time restraints, and wood density estimates did not exist for the area. These
allometric equations are not applicable to woodland and forest carbon stocks in
woodland are therefore not estimated. Woodland allometry is under development,
however, and Shirima et al. (2011) estimated mean above ground carbon storage in
Tanzania’s miombo woodlands to be between 13-30tC/ha.
Trees with diameters that exceeded the upper limit of the range used to create the
regression equations were restricted to 148cm dbh as Chave et al. (2005) found that
tree allometry is conserved across sites in different continents and so regression
models should be applicable in all forests, within their range of validity as
determined by the maximum and minimum tree dbh used to generate the
equation. Of 2698 measured living trees, 12 exceeded the limit of 148 cm dbh,
implying the resultant carbon stock estimate may be an underestimate of forest
carbon stock. Given that large diameter trees account for a large proportion of
above-ground biomass (Brown, 2002), it is acknowledged that this is a further
source of uncertainty that could be substantial.
Table 4. Biomass regression equations applied to direct tree measurements in order to establish the above-ground tree biomass in forest plots. These equations are valid when applied to trees within the range of diameter at breast height (dbh) of trees used to generate the equations (sourced from Brown, 1997).
Climatic Zone Equation Range in dbh (cm) Moist Forest Y = exp(-2.134+2.530ln(dbh)) 5-148 Dry Forest Y = exp(-1.996+2.32ln(dbh)) 5-40
Tree biomass was converted to carbon using a carbon fraction of 0.47 (IPCC, 2006).
Forest carbon stock per hectare was established by adjusting plot areas for their
average slope angle using cos (slope). This slope correction is necessary as forest
area is estimated without taking topography into account. This correction
141
improves the likelihood that each quadrat contained the same total area as seen on
a two-dimensional satellite image.
The weighted mean of forest carbon stocks in non-degraded moist, degraded moist
and degraded dry forest were calculated. Forest plots were randomly resampled
with replacement 1000 times to obtain an empirical bootstrap distribution for forest
carbon stock (Efron, 1979, Guan, 2003). Bootstrapped confidence intervals were
established using the percentile method; where the 2.5 and 97.5 percentiles
constitute the limits of the 95% confidence interval.
While natural variation in the forest ecosystem will always result in some
uncertainty, in the final estimate of forest carbon stock, uncertainty arises from
sampling error, measurement error, and that inherent in underlying equations and
assumptions. Table 5 identifies these sources of uncertainty and the methods
applied in this study to reduce uncertainty. This study focussed on sampling error
as errors in measurement. The application of the allometric equation, and the ratio
of biomass to carbon has been addressed elsewhere in the literature (Clark and
Clark, 2000, Keller et al., 2001, Ketterings et al., 2001, Chave et al., 2004).
5.2.1.4. Estimating emission reductions
Estimated forest carbon stocks were utilised to estimate emission reductions,
evaluated by the difference between a BAU deforestation baseline and an avoided
deforestation REDD+ project baseline. The establishment of a BAU baseline relies
on forest area and area change data as well as predictions of future drivers of
deforestation. As noted in Baker et al. (2010), the IPCC guidance was not developed
with REDD+ in mind and therefore does not deal with estimating a baseline (nor
issues of leakage, additionality, and permanence). Methods to establish this

142
deforestation baseline are controversial and have been discussed in length
elsewhere in the literature (see Olander et al., 2008, Huettner et al., 2009).
Table 5. Inputs and sources of uncertainty in estimates of forest carbon stock as well as methods applied to reduce these uncertainties as far as possible.
Input Source of uncertainty
Method to reduce uncertainty
Selection of forest plots
Sampling error
Forest plot geo-coordinates were selected using random number generation, but within logistical constraints, and good practice for sampling design and forestry inventory was followed (MacDicken, 1997, Pearson et al., 2005, Greenhalgh et al., 2006, Grassi et al., 2008).
Measurement of dbh
Measurement error
Training and education in measurement of dbh was conducted to reduce measurement error. It was ensured that trees were not measured twice or dead trees counted as living. Measurement uncertainty on a single tree of diameter 10cm or greater has been estimated at 16%, but found to average out at forest stand level (Chave et al., 2004) and so it is not addressed in this study.
Application of allometric equation
Estimation error: allometric equations originating from Asian and Latin American data
Allometric uncertainty is not addressed here. Although acknowledged as a potential source of error, pan-tropical equations are based on a large number of trees that span a range of dbh. As the destructive sampling of a sufficient number of trees to create an area-specific allometric regression equation was not possible, their application is appropriate. The dbh was, however, restricted to values used to create the regression equations. Error due to the application of the allometric equation is estimated at 10-20% and can be amplified where large trees are numerous (Clark and Clark, 2000, Keller et al., 2001, Ketterings et al., 2001, Chave et al., 2004).
Application of ratio of biomass to carbon
Estimation error: the carbon content of biomass components and tree species differ
The error of the carbon fraction is not addressed here. The IPCC (2006) present a default value of 0.47 for tropical and sub-tropical forest, but within an interval estimate of 0.44-0.49. This is an improvement on 0.5 suggested by Westlake (1966), but suggests relative error of 5%.
The BAU deforestation baseline for the BME was generated from GIS imagery
analysed by the BERSMP and assumes a linear deforestation rate of 4% in all forest
types. The uncertainty of this rate of loss is dependent on the resolution of GIS
143
imagery and method of image analysis, as well as assumptions regarding the rate
and location of changes in forest area in the future. Research has shown that forest
area data based on satellite imagery has accuracies between 80% to more than 99%
(Achard et al., 2001, DeFries et al., 2007, Grassi et al., 2008, Gonzalez et al., 2010). In
the (proposed) Bale Mountains National Park the accuracy of estimation of forest
area follows these findings, ranging between 81% and 97% (Teshome et al., 2011).
Deforestation resulting during implementation of the BME REDD+ project is based
on stated project goals to reduce deforestation. These predictions of are subjective
rather than based on past experience of intervention. Until the project in the BME
progresses, estimating how much deforestation can be reduced as a result of
REDD+ policies, actions and measures will continue be uncertain and models of
emission reductions will need to be revised regularly as new information is
acquired.
It is acknowledged that this carbon accounting exercise is a static representation of
the forest ecosystem in the BME. The methodology contains an inherent
assumption of a steady state in mature forest. This assumption is still under debate
and there is no easy way to assess if this is the case (Phillips et al., 1998, Houghton,
2005, Bonan, 2008, Grote et al., 2011). Anthropogenic impacts on carbon stocks of
forests are also ongoing and non-linear, which makes it difficult to differentiate
between inter-annual variability in the forest ecosystem and indirect feedbacks
from direct human activities (UNDP, 2009).
In the case of avoided deforestation, it is common to assume that all carbon in
biomass would be emitted to the atmosphere at the time of forest loss. It is possible
that this may overestimate emission reductions where harvested wood products
(HWPs) are manufactured (Lim et al., 1999, Karjalainen et al., 1999). In the BME,
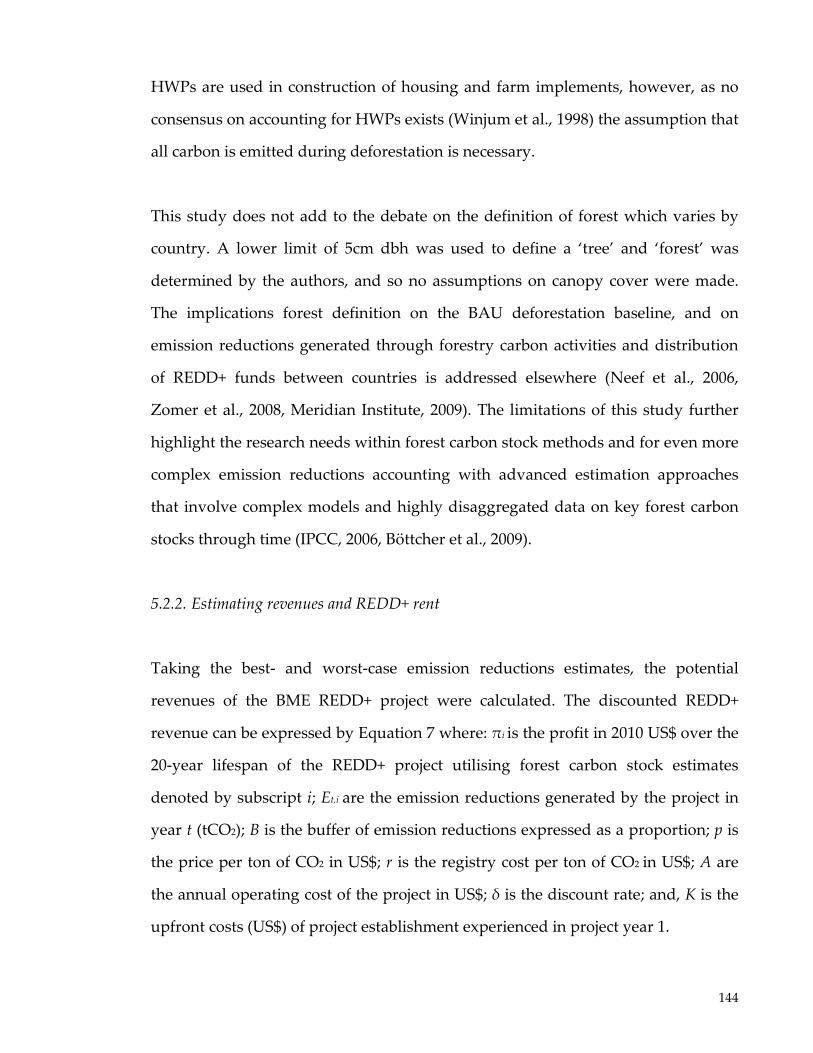
144
HWPs are used in construction of housing and farm implements, however, as no
consensus on accounting for HWPs exists (Winjum et al., 1998) the assumption that
all carbon is emitted during deforestation is necessary.
This study does not add to the debate on the definition of forest which varies by
country. A lower limit of 5cm dbh was used to define a ‘tree’ and ‘forest’ was
determined by the authors, and so no assumptions on canopy cover were made.
The implications forest definition on the BAU deforestation baseline, and on
emission reductions generated through forestry carbon activities and distribution
of REDD+ funds between countries is addressed elsewhere (Neef et al., 2006,
Zomer et al., 2008, Meridian Institute, 2009). The limitations of this study further
highlight the research needs within forest carbon stock methods and for even more
complex emission reductions accounting with advanced estimation approaches
that involve complex models and highly disaggregated data on key forest carbon
stocks through time (IPCC, 2006, Böttcher et al., 2009).
5.2.2. Estimating revenues and REDD+ rent
Taking the best- and worst-case emission reductions estimates, the potential
revenues of the BME REDD+ project were calculated. The discounted REDD+
revenue can be expressed by Equation 7 where: πi is the profit in 2010 US$ over the
20-year lifespan of the REDD+ project utilising forest carbon stock estimates
denoted by subscript i; Et,i are the emission reductions generated by the project in
year t (tCO2); B is the buffer of emission reductions expressed as a proportion; p is
the price per ton of CO2 in US$; r is the registry cost per ton of CO2 in US$; A are
the annual operating cost of the project in US$; δ is the discount rate; and, K is the
upfront costs (US$) of project establishment experienced in project year 1.
145
( )( )( )( )
KArpBt
t −
+−−−
=Π ∑=
−
20
111
1E it,
δ i Eq. 7
Not all emission reductions generated by the project activities can be sold. Forestry
carbon projects must account for the risk that emission reductions will not persist
over time. Termed ‘permanence’, it is possible that forest carbon stocks could
deteriorate or be depleted over time due to natural disturbances such as fire, pests
and disease, or anthropogenic disturbances such as political instability leading to
land-use change (see Sedjo and Marland, 2003). No assumptions are made
regarding the liability for non-permanence, however see Chapter 9 where this is
discussed in the context of the BME REDD+ project. In addition, leakage might
relocate emissions outside of the woodlands and REDD+ project area. To deal with
non-delivery risks of permanence and leakage, a non-tradable buffer, or reserve, of
emission reductions is commonly set-aside as insurance (Peskett and Harkin,
2007).
In this study, 40% of emission reductions were set-aside for non-permanence, and
a further 25% of emission reductions were set-aside in case of leakage. These
buffers are at the higher ranges for project activities, and were chosen to reflect
imminent infrastructure development, a history of forest fire, and potential land
tenure disputes and political instability in the BME (UNIQUE, 2010).
Remaining emission reductions were valued at predicted over-the-counter (OTC)
voluntary carbon market prices. Although social costing of carbon would value
emission reductions more highly at US$23/tCO2e (Tol, 2008), the voluntary carbon
market is currently the only trading platform from which value can be realised
from avoided deforestation. The OTC voluntary carbon market is motivated by
corporate social responsibility and individuals wishing to contribute to a ‘solution’

146
for climate change. In 2009, the price of emission reductions on the OTC ranged
from US$0.30 to US$111/tCO2e, with an average price of US$6.50/tCO2e. In the
following two years, average OTC prices have remained around US$6/tCO2e,
although price ranges have remained wide. Volume weighted prices for REDD+
emission reductions were US$2.9/tCO2e in 2009, varying from approximately US$1
to US$13/tCO2e, and lower than the previous three years. However, REDD+
emission reduction prices rebounded to US$5/tCO2e in 2010 and US$12 in 2011,
but with large range in prices for emission reductions. For emission reductions
from Africa, average 2009 prices are lower than those in 2006 and 2007, but since
2009 prices have remained around US$8/tCO2e (Hamilton et al., 2007, Hamilton et
al., 2008, Hamilton et al., 2009, Hamilton et al., 2010, Peters-Stanley et al., 2011,
Peters-Stanley and Hamilton, 2012; see Table 6).
With no clear trend in the value of emission reductions from REDD+ or African
projects, there is uncertainty in the price that can be expected for emission
reductions from the BME REDD+ project. Early interest indicates that the first
tranche of emission reductions could sell for US$3/tCO2e (UNIQUE, 2010). When
the BME REDD+ project is certified to Voluntary Carbon Standard (VCS) and
Climate, Community and Biodiversity Alliance (CCBA) standards, as is planned,
emissions reductions might receive a price premium. In light of this, and current
OTC market prices for emission reductions, potential revenues were predicted
using both US$3 and US$6/tCO2e.
The costs of generation and sale of emission reductions are subtracted from
expected revenues to give the REDD+ revenues of the BME REDD+ project. The
costs of listing the BME REDD+ emission reductions in a public register, which
increases transparency of the voluntary carbon market, were estimated at
$0.10/tCO2e. One-off costs of US$3,225,000 for REDD+ project establishment,
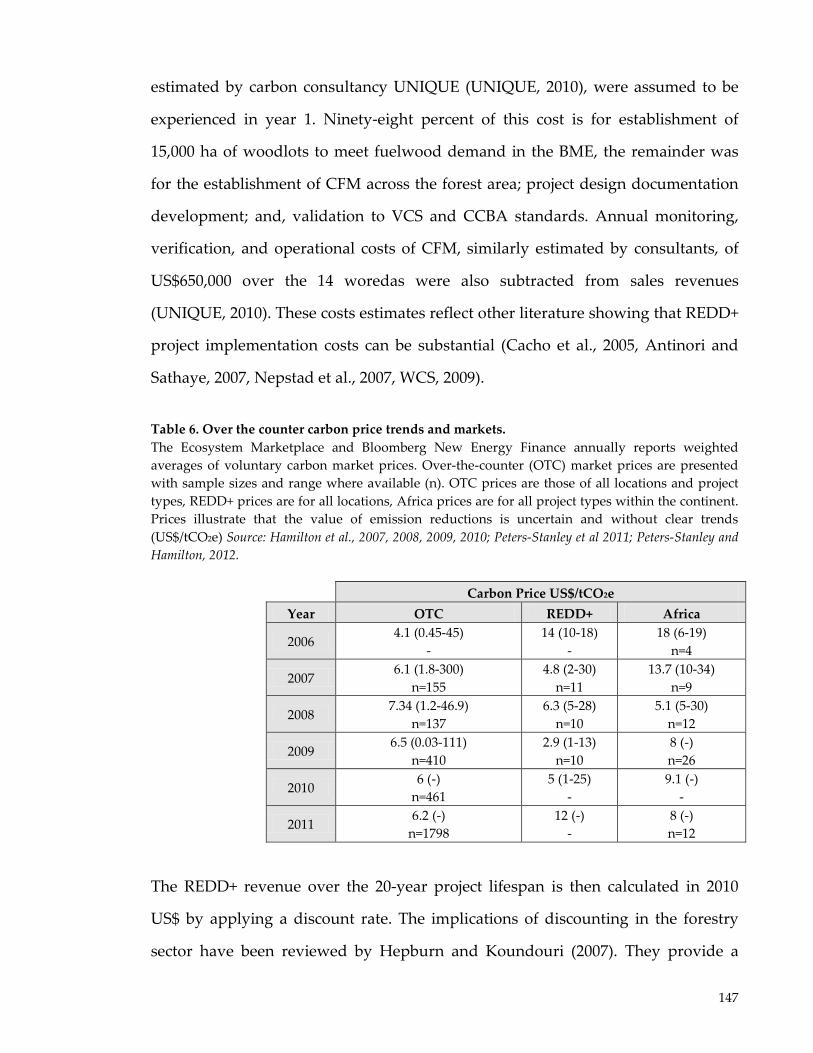
147
estimated by carbon consultancy UNIQUE (UNIQUE, 2010), were assumed to be
experienced in year 1. Ninety-eight percent of this cost is for establishment of
15,000 ha of woodlots to meet fuelwood demand in the BME, the remainder was
for the establishment of CFM across the forest area; project design documentation
development; and, validation to VCS and CCBA standards. Annual monitoring,
verification, and operational costs of CFM, similarly estimated by consultants, of
US$650,000 over the 14 woredas were also subtracted from sales revenues
(UNIQUE, 2010). These costs estimates reflect other literature showing that REDD+
project implementation costs can be substantial (Cacho et al., 2005, Antinori and
Sathaye, 2007, Nepstad et al., 2007, WCS, 2009).
Table 6. Over the counter carbon price trends and markets. The Ecosystem Marketplace and Bloomberg New Energy Finance annually reports weighted averages of voluntary carbon market prices. Over-the-counter (OTC) market prices are presented with sample sizes and range where available (n). OTC prices are those of all locations and project types, REDD+ prices are for all locations, Africa prices are for all project types within the continent. Prices illustrate that the value of emission reductions is uncertain and without clear trends (US$/tCO2e) Source: Hamilton et al., 2007, 2008, 2009, 2010; Peters-Stanley et al 2011; Peters-Stanley and Hamilton, 2012.
Carbon Price US$/tCO2e Year OTC REDD+ Africa
2006 4.1 (0.45-45)
- 14 (10-18)
- 18 (6-19)
n=4
2007 6.1 (1.8-300)
n=155 4.8 (2-30)
n=11 13.7 (10-34)
n=9
2008 7.34 (1.2-46.9)
n=137 6.3 (5-28)
n=10 5.1 (5-30)
n=12
2009 6.5 (0.03-111)
n=410 2.9 (1-13)
n=10 8 (-) n=26
2010 6 (-)
n=461 5 (1-25)
- 9.1 (-)
-
2011 6.2 (-)
n=1798 12 (-)
- 8 (-) n=12
The REDD+ revenue over the 20-year project lifespan is then calculated in 2010
US$ by applying a discount rate. The implications of discounting in the forestry
sector have been reviewed by Hepburn and Koundouri (2007). They provide a
148
rationale for time-declining discount rates in long-term forestry projects to both
increase intertemporal efficiency and intergenerational equity. However, they also
conclude that a constant discount rate will generally be appropriate for short-term
projects of 22 years or less. As the choice of constant discount rate does, however,
remain influential on the net present value, both 5 and 10% discount rates are
modelled in this study following Greig-Gran (2006) of the Stern Review (Stern,
2007).
It can be seen that the REDD+ revenue is an outcome that relies on uncertain
inputs in addition to the forest carbon stock estimated in section 6.2.2. Table 7
summarises these uncertainties and presents the method by which these
uncertainties are addressed in this paper. Total uncertainty is communicated using
an interval estimate of the possible values of REDD+ revenue that a REDD+ project
in the BME could generate.
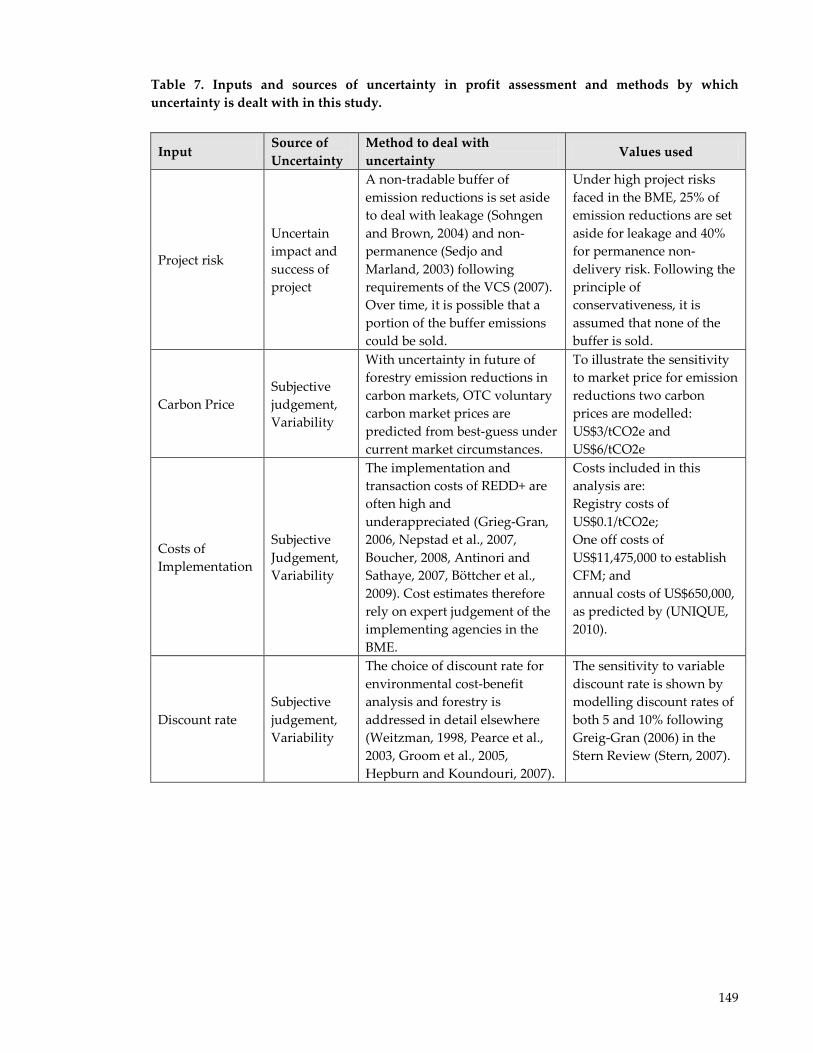
149
Table 7. Inputs and sources of uncertainty in profit assessment and methods by which uncertainty is dealt with in this study.
Input Source of Uncertainty
Method to deal with uncertainty
Values used
Project risk
Uncertain impact and success of project
A non-tradable buffer of emission reductions is set aside to deal with leakage (Sohngen and Brown, 2004) and non-permanence (Sedjo and Marland, 2003) following requirements of the VCS (2007). Over time, it is possible that a portion of the buffer emissions could be sold.
Under high project risks faced in the BME, 25% of emission reductions are set aside for leakage and 40% for permanence non-delivery risk. Following the principle of conservativeness, it is assumed that none of the buffer is sold.
Carbon Price Subjective judgement, Variability
With uncertainty in future of forestry emission reductions in carbon markets, OTC voluntary carbon market prices are predicted from best-guess under current market circumstances.
To illustrate the sensitivity to market price for emission reductions two carbon prices are modelled: US$3/tCO2e and US$6/tCO2e
Costs of Implementation
Subjective Judgement, Variability
The implementation and transaction costs of REDD+ are often high and underappreciated (Grieg-Gran, 2006, Nepstad et al., 2007, Boucher, 2008, Antinori and Sathaye, 2007, Böttcher et al., 2009). Cost estimates therefore rely on expert judgement of the implementing agencies in the BME.
Costs included in this analysis are: Registry costs of US$0.1/tCO2e; One off costs of US$11,475,000 to establish CFM; and annual costs of US$650,000, as predicted by (UNIQUE, 2010).
Discount rate Subjective judgement, Variability
The choice of discount rate for environmental cost-benefit analysis and forestry is addressed in detail elsewhere (Weitzman, 1998, Pearce et al., 2003, Groom et al., 2005, Hepburn and Koundouri, 2007).
The sensitivity to variable discount rate is shown by modelling discount rates of both 5 and 10% following Greig-Gran (2006) in the Stern Review (Stern, 2007).

150
5.3. Results
5.3.1. Carbon stock and emission reductions potential
5.3.1.1. Forest carbon stock
The dbh of 2698 trees were measured, with average of 35 trees per plot, with
higher tree occurrence in moist non degraded forest (59). Both moist degraded
forest (25) and dry forest plots had fewer trees (20) as expected. Four plots in moist
forest had no trees present when the geo-coordinates were reached, reflecting
either delay between imagery and survey, or misclassification of forest glades.
Applying allometric equations to primary field data indicated the highest carbon
stocks of 289tC/ha ± 108 (expressed as the 95% confidence interval of the mean) are
found in moist non-degraded forest, followed by moist degraded forest at 199tC/ha
± 54 and dry degraded forest at 132tC/ha ± 73 (Figure 7). The confidence interval of
the mean of the forest carbon stock estimates is large, particularly for dry degraded
forest, due to the small sample size (n=18) and large variation between plots.
Despite this, non-parametric comparison of carbon stock between forest types
shows a significant difference between forest types at the 5% level (Kruskall-
Wallis, K=6.942, df=2, p=0.0311*).
High variation in above-ground forest carbon stocks has been observed elsewhere
(Henry et al., 2011). This can be due to differences in temperature, precipitation
and soil fertility as well as disturbance such as; selective wood harvest, ground
fires, shifting cultivation, browsing and grazing (Houghton, 2005). Signs of human
disturbance were observed in a number of plots ranging from pathways and
evidence of grazing. Estimated canopy cover of the plots was 50% in dry forest,
rising to 58% in moist forest. Some plots in moist forest contained very high carbon
stocks as a result of the presence of high dbh trees.

151
Figure 7. Average forest carbon stocks by forest type. Shown with 95% bootstrapped confidence intervals the highest forest carbon stocks are found in moist non-degraded forest, follwed by moist degraded and dry degraded forest in the Bale Mountains Eco-Region.
The area weighted mean forest carbon stock across the forests of the BME is
195tC/ha ± 81. Although forest carbon stock distribution is found to be non-normal
for all forest types (Shapiro-Wilks for moist non-degraded forest n=32, W=0.77,
p<0.000; moist degraded forest n=58, W=0.76, p<0.000; dry forest n=18, W=0.68,
p<0.000), a more robust bootstrapped distribution that resampled with
replacement 1000 times, gave a very similar result to the normal approximation
(Table 8).
The above-ground weighted mean forest carbon stock estimate from primary data
is consistent with global forest ranges of 20 to 400 tC/ha reported by Hairiah et al.,
(2001), but substantially higher than published Ethiopia-wide data of 37tC/ha and
47tC/ha (FAO, 2000, Brown, 1997). The all forest weighted mean is comparable to
Africa wide estimates (Gibbs et al., 2007, Baccini et al., 2008, Lewis, 2009; see 5.2.1.)
as well as forest carbon stock studies in the region. Glenday (2006) found forest
carbon stocks of 330tC/ha in tropical moist forest in Kenya; although her estimates
0
100
200
300
400
500
600
700
800
Moist Non-Degraded(n=32)
Moist Degraded(n=58)
Dry Degraded (n=18)
tC/h
a
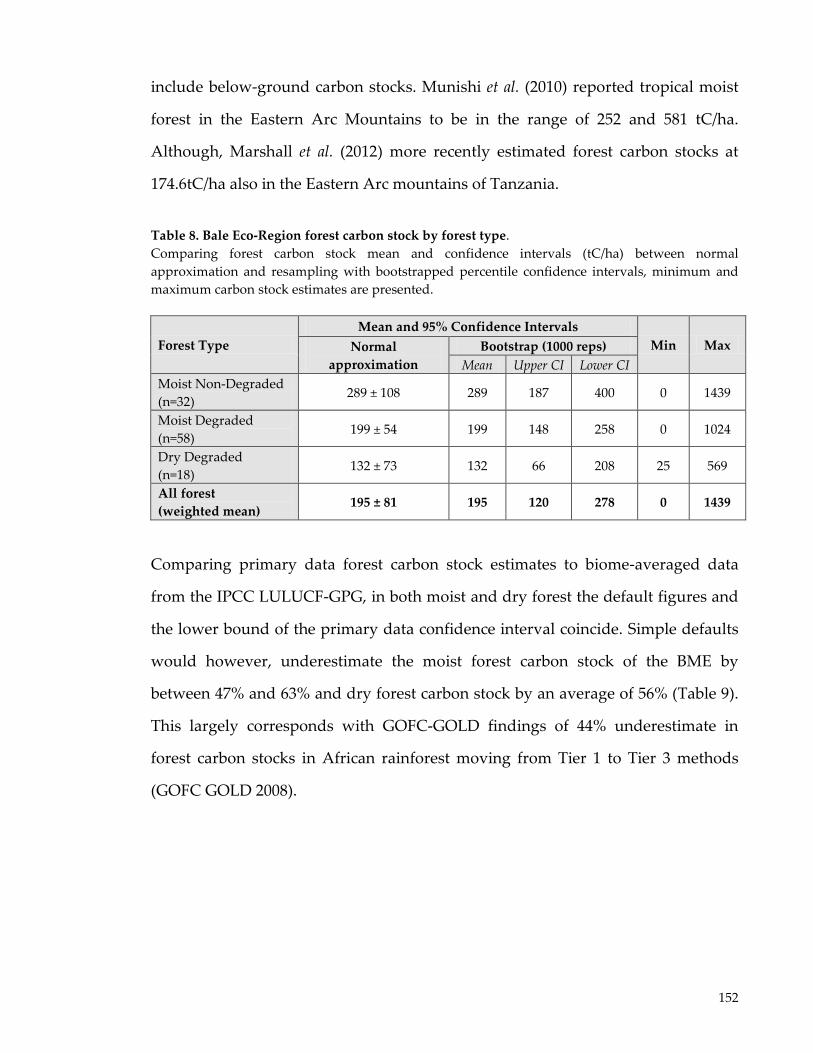
152
include below-ground carbon stocks. Munishi et al. (2010) reported tropical moist
forest in the Eastern Arc Mountains to be in the range of 252 and 581 tC/ha.
Although, Marshall et al. (2012) more recently estimated forest carbon stocks at
174.6tC/ha also in the Eastern Arc mountains of Tanzania.
Table 8. Bale Eco-Region forest carbon stock by forest type. Comparing forest carbon stock mean and confidence intervals (tC/ha) between normal approximation and resampling with bootstrapped percentile confidence intervals, minimum and maximum carbon stock estimates are presented.
Forest Type Mean and 95% Confidence Intervals
Min Max Normal approximation
Bootstrap (1000 reps) Mean Upper CI Lower CI
Moist Non-Degraded (n=32)
289 ± 108 289 187 400 0 1439
Moist Degraded (n=58)
199 ± 54 199 148 258 0 1024
Dry Degraded (n=18)
132 ± 73 132 66 208 25 569
All forest (weighted mean)
195 ± 81 195 120 278 0 1439
Comparing primary data forest carbon stock estimates to biome-averaged data
from the IPCC LULUCF-GPG, in both moist and dry forest the default figures and
the lower bound of the primary data confidence interval coincide. Simple defaults
would however, underestimate the moist forest carbon stock of the BME by
between 47% and 63% and dry forest carbon stock by an average of 56% (Table 9).
This largely corresponds with GOFC-GOLD findings of 44% underestimate in
forest carbon stocks in African rainforest moving from Tier 1 to Tier 3 methods
(GOFC GOLD 2008).
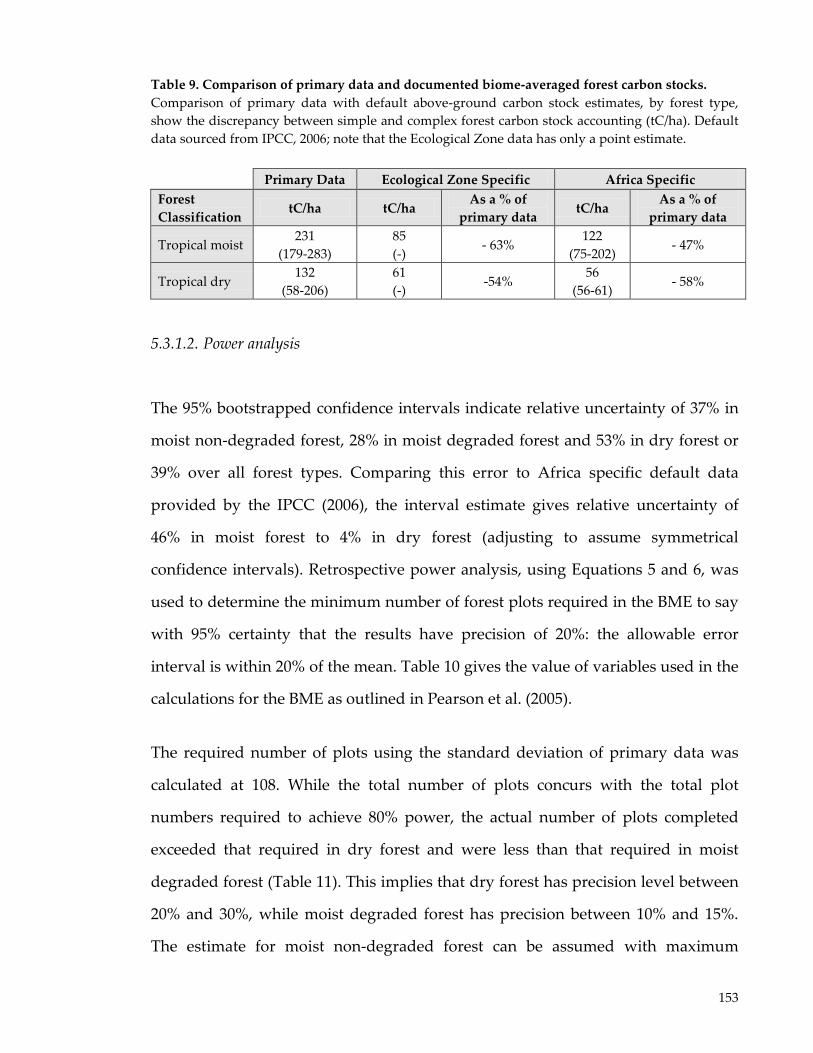
153
Table 9. Comparison of primary data and documented biome-averaged forest carbon stocks. Comparison of primary data with default above-ground carbon stock estimates, by forest type, show the discrepancy between simple and complex forest carbon stock accounting (tC/ha). Default data sourced from IPCC, 2006; note that the Ecological Zone data has only a point estimate.
Primary Data Ecological Zone Specific Africa Specific Forest Classification
tC/ha tC/ha As a % of
primary data tC/ha
As a % of primary data
Tropical moist 231
(179-283) 85 (-)
- 63% 122
(75-202) - 47%
Tropical dry 132
(58-206) 61 (-)
-54% 56
(56-61) - 58%
5.3.1.2. Power analysis
The 95% bootstrapped confidence intervals indicate relative uncertainty of 37% in
moist non-degraded forest, 28% in moist degraded forest and 53% in dry forest or
39% over all forest types. Comparing this error to Africa specific default data
provided by the IPCC (2006), the interval estimate gives relative uncertainty of
46% in moist forest to 4% in dry forest (adjusting to assume symmetrical
confidence intervals). Retrospective power analysis, using Equations 5 and 6, was
used to determine the minimum number of forest plots required in the BME to say
with 95% certainty that the results have precision of 20%: the allowable error
interval is within 20% of the mean. Table 10 gives the value of variables used in the
calculations for the BME as outlined in Pearson et al. (2005).
The required number of plots using the standard deviation of primary data was
calculated at 108. While the total number of plots concurs with the total plot
numbers required to achieve 80% power, the actual number of plots completed
exceeded that required in dry forest and were less than that required in moist
degraded forest (Table 11). This implies that dry forest has precision level between
20% and 30%, while moist degraded forest has precision between 10% and 15%.
The estimate for moist non-degraded forest can be assumed with maximum
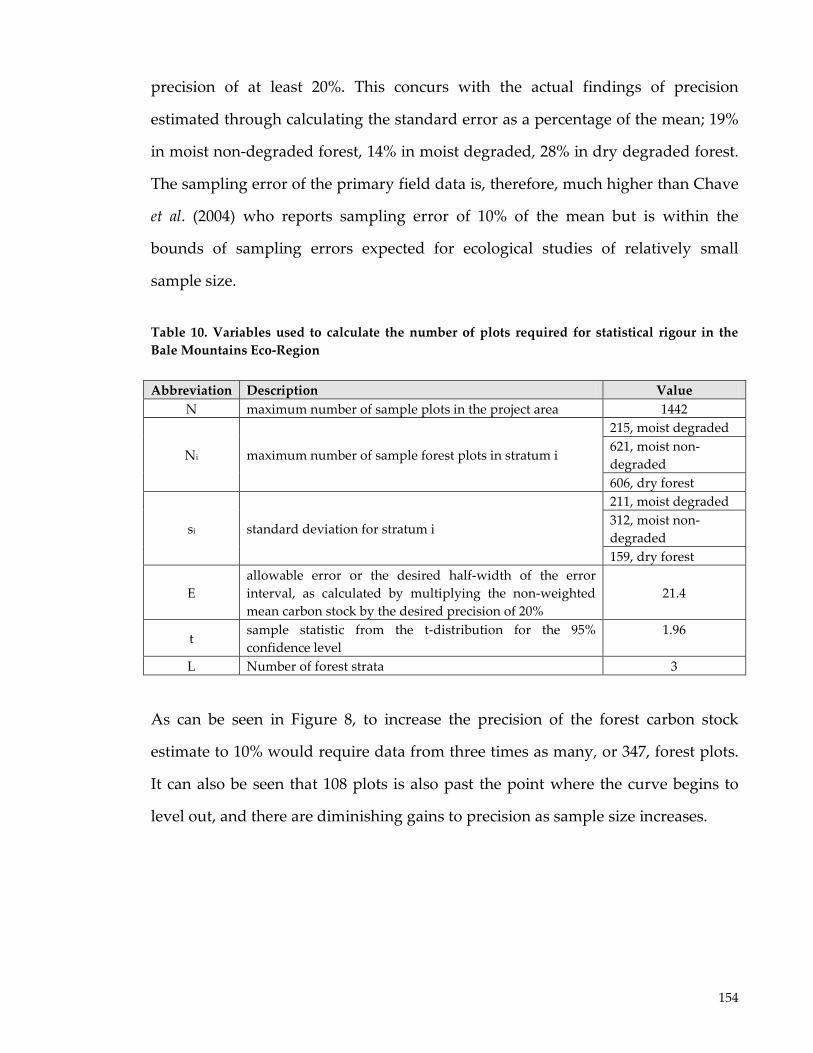
154
precision of at least 20%. This concurs with the actual findings of precision
estimated through calculating the standard error as a percentage of the mean; 19%
in moist non-degraded forest, 14% in moist degraded, 28% in dry degraded forest.
The sampling error of the primary field data is, therefore, much higher than Chave
et al. (2004) who reports sampling error of 10% of the mean but is within the
bounds of sampling errors expected for ecological studies of relatively small
sample size.
Table 10. Variables used to calculate the number of plots required for statistical rigour in the Bale Mountains Eco-Region Abbreviation Description Value
N maximum number of sample plots in the project area 1442
Ni maximum number of sample forest plots in stratum i
215, moist degraded 621, moist non-degraded 606, dry forest
si standard deviation for stratum i
211, moist degraded 312, moist non-degraded 159, dry forest
E allowable error or the desired half-width of the error interval, as calculated by multiplying the non-weighted mean carbon stock by the desired precision of 20%
21.4
t sample statistic from the t-distribution for the 95% confidence level
1.96
L Number of forest strata 3
As can be seen in Figure 8, to increase the precision of the forest carbon stock
estimate to 10% would require data from three times as many, or 347, forest plots.
It can also be seen that 108 plots is also past the point where the curve begins to
level out, and there are diminishing gains to precision as sample size increases.
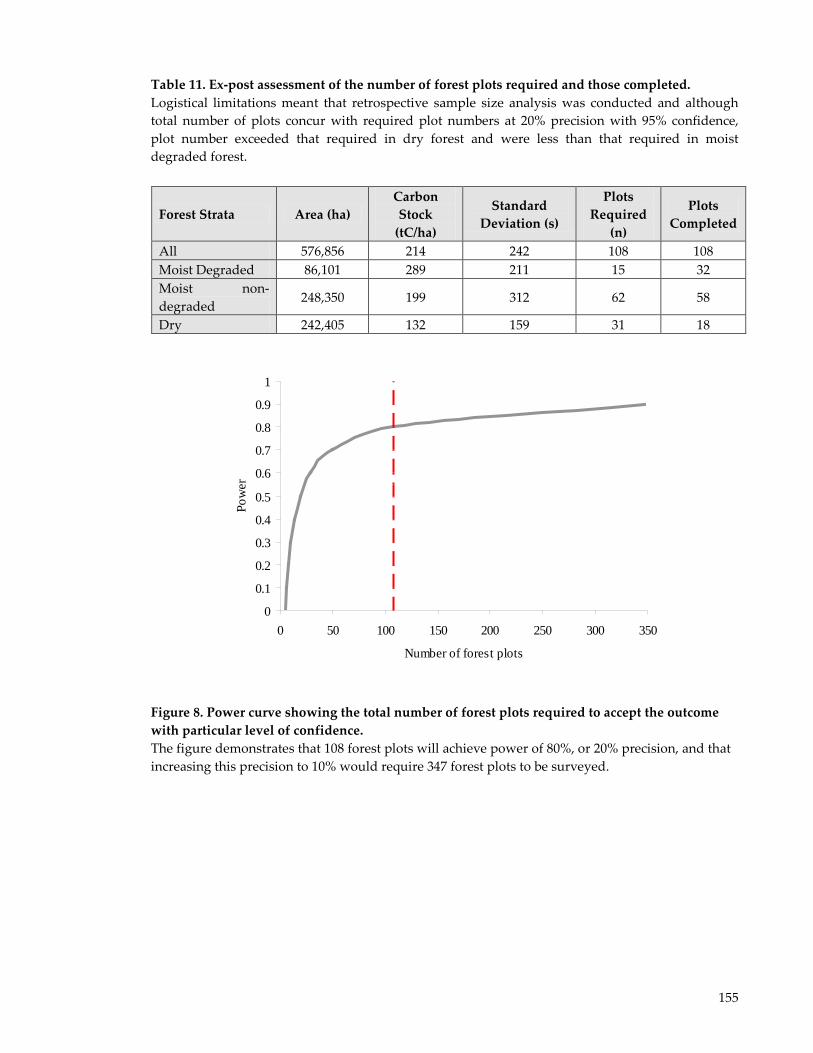
155
Table 11. Ex-post assessment of the number of forest plots required and those completed. Logistical limitations meant that retrospective sample size analysis was conducted and although total number of plots concur with required plot numbers at 20% precision with 95% confidence, plot number exceeded that required in dry forest and were less than that required in moist degraded forest.
Forest Strata Area (ha) Carbon Stock
(tC/ha)
Standard Deviation (s)
Plots Required
(n)
Plots Completed
All 576,856 214 242 108 108 Moist Degraded 86,101 289 211 15 32 Moist non-degraded
248,350 199 312 62 58
Dry 242,405 132 159 31 18
Figure 8. Power curve showing the total number of forest plots required to accept the outcome with particular level of confidence. The figure demonstrates that 108 forest plots will achieve power of 80%, or 20% precision, and that increasing this precision to 10% would require 347 forest plots to be surveyed.
0
0.1
0.2
0.3
0.4
0.5
0.6
0.7
0.8
0.9
1
0 50 100 150 200 250 300 350
Number of forest plots
Pow
er
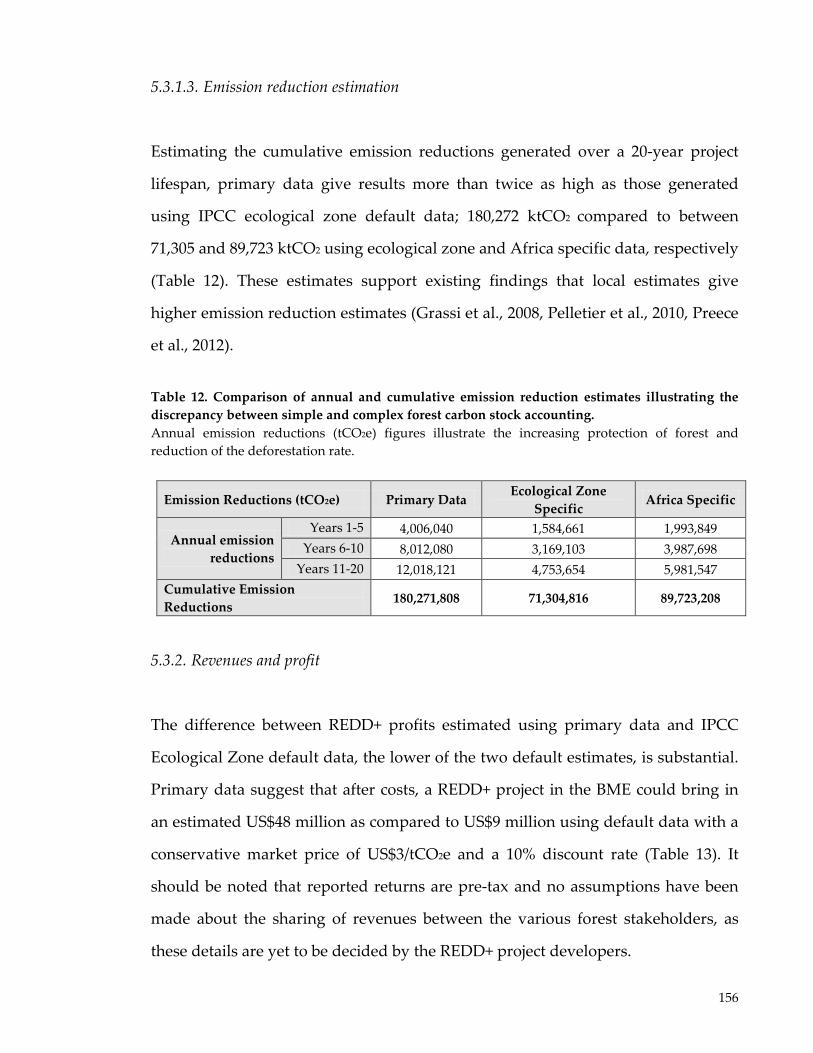
156
5.3.1.3. Emission reduction estimation
Estimating the cumulative emission reductions generated over a 20-year project
lifespan, primary data give results more than twice as high as those generated
using IPCC ecological zone default data; 180,272 ktCO2 compared to between
71,305 and 89,723 ktCO2 using ecological zone and Africa specific data, respectively
(Table 12). These estimates support existing findings that local estimates give
higher emission reduction estimates (Grassi et al., 2008, Pelletier et al., 2010, Preece
et al., 2012).
Table 12. Comparison of annual and cumulative emission reduction estimates illustrating the discrepancy between simple and complex forest carbon stock accounting. Annual emission reductions (tCO2e) figures illustrate the increasing protection of forest and reduction of the deforestation rate.
Emission Reductions (tCO2e) Primary Data Ecological Zone
Specific Africa Specific
Annual emission reductions
Years 1-5 4,006,040 1,584,661 1,993,849 Years 6-10 8,012,080 3,169,103 3,987,698
Years 11-20 12,018,121 4,753,654 5,981,547 Cumulative Emission Reductions
180,271,808 71,304,816 89,723,208
5.3.2. Revenues and profit
The difference between REDD+ profits estimated using primary data and IPCC
Ecological Zone default data, the lower of the two default estimates, is substantial.
Primary data suggest that after costs, a REDD+ project in the BME could bring in
an estimated US$48 million as compared to US$9 million using default data with a
conservative market price of US$3/tCO2e and a 10% discount rate (Table 13). It
should be noted that reported returns are pre-tax and no assumptions have been
made about the sharing of revenues between the various forest stakeholders, as
these details are yet to be decided by the REDD+ project developers.
157
Calculating REDD+ revenue per hectare, positive net revenues are generated under
both simple and complex forest carbon stock methods. Shared over all conserved
ha of forest, primary data estimates generate between US$115 and US$445/ha
depending on the area under consideration, the carbon price and discount rate
chosen. Default, secondary data returns are less substantial over the same area at
between US$21 to US$152/ha (Table 13). In fact, the cumulative REDD+ revenues
show that using secondary data with US$3/tCO2e and a 10% discount rate, the
project does not break even until year 6 (Figure 9).
Table 13. Net present value of profits under different forest carbon stock methods. Calculated by subtracting the costs of REDD+ project implementation from revenues generated through sale of emission reductions. Two prices are modelled, US$3 and US$6, and two discount rates (5 and 10%) are presented and net profits given in 2010 US$.
Primary Data Ecological Zone IPCC default
Carbon Price US$6 US$3 US$6 US$3 Discount Rate 5% 10% 5% 10% 5% 10% 5% 10% Profit US$ (000) 184,978 113,607 82,671 47,591 63,359 35,129 22,893 9,017
REDD+ revenue (US$/ha)
conserved moist and dry forest
713 438 318 183 244 135 88 35
all conserved forest
445 273 199 115 152 85 55 21
all forest 200 123 90 52 69 38 25 10

158
Figure 9. Estimated projected cumulative profits over the Bale Mountains Eco-Region REDD+ project lifespan showing primary and secondary IPCC data under variable carbon price and discount rates (DR).
159
5.4. Discussion
Comparing primary data from the BME to default forest carbon stock given by
the IPCC, however, reveals a large discrepancy between Tier 1 and an
estimation of forest carbon stock through tree measurements. Primary data
estimated area-weighted average forest carbon stock of 195tC/ha ± 81, ranging
from 298tC/ha in non-degraded tropical moist forest to 132tC/ha in tropical dry
degraded forest. Secondary data, therefore, underestimated carbon density by
as much as 63% in combined moist forest and 58% in dry forest. This scale of
discrepancy is higher than the 44% for African rainforest reported in GOFC-
GOLD (2008) but, in the same direction as four of the five comparisons that the
GOFC-GOLD project made in tropical rainforest. These results suggest that
diversity of forests is not sufficiently captured by the twenty ecological zones
and four climate domains encompassed by the IPCC data (IPCC, 2006). Thus
Tier 1 does not meet the call of the IPCC for accurate emission reductions
accounting that is neither an under nor an overestimates, with uncertainties
reduced where possible (Nakicenovic et al., 2000). The application of biome-
averages appear to underestimate forest carbon stock at the project site.
Findings also confirm high uncertainty surrounding the use of mean estimates.
The 95% confidence intervals for primary forest carbon stock estimates are, on
average, 39% of the forest strata mean. The large uncertainty results in the
overlap of the lower confidence interval bounds of primary data with upper
bounds of the secondary data interval. The total uncertainty of forest carbon
density estimates is likely to have been even higher if measurement and
estimation errors were included this study. While increasing sample size can
also improve the precision of forest carbon stock estimates in this case, it would
take three times as many forest carbon plots to achieve precision of 10% rather
than 20%. Given the substantial time and resource requirements of field data

160
collection, the costs of increasing the statistical power of forest carbon stock
estimates may, therefore, be greater than the benefits given diminishing returns
to sampling effort.
The discrepancy between accounting methods leads to more than a two-fold
difference in potential emission reductions from a REDD+ project in the BME.
At a voluntary carbon market price of US$3 and discount rate of 10%, this
difference in emission reductions is worth close to US$39 million over the
project lifespan, even after project costs and project delivery risks have been
accounted for. Despite the fact that emissions accounting using simple biome-
averaged data can be undertaken immediately for low or no cost, which has
made them an attractive option in developing countries, there are clear financial
incentives for investing finance and time, and building the capacity to gather
primary data. However, with costs of reducing uncertainty rising as methods
become more data-intensive, trade-offs may emerge. Tools such as sensitivity
analysis could be employed to identify components with the most impact on
total uncertainty which can then be prioritised (Elston, 1992). With the
popularity of REDD+ partially dependent on the transfer of finance from
developed to developing countries, more complex accounting can also ensure
that rewards for reducing deforestation and degradation are of appropriate
scale.
Despite differences between accounting methods and subsequent revenues,
models predicted net positive profits at the end of the 20-year BME REDD+
project lifespan. Best case returns were US$445/ha while worst case returns
were US$21 per hectare of avoided deforestation in dry forest, moist forest and
woodland. Even though the financial calculation does not include tax that
might be taken by federal and regional government or payments to forest
stakeholders which have yet to be negotiated, the returns to investment in the
BME REDD+ project are positive. Given that finance for forest conservation in

161
the BME is low and currently largely donor funded, even small net positive
revenue from this forest management strategy may be a sufficient argument for
implementing REDD+. This is further supported by the fact that the
implementation of REDD+ through CFM also intends to shift forest resource
use onto a sustainable path from the current unsustainable one. Decisions on
whether to implement REDD+ may therefore not rely on completely of cost-
benefit feasibility analyses. This decoupling of REDD+ policy decisions and
cost-benefit analysis is evidenced by many cases where the costs of REDD+
project and policy development are being absorbed by intermediaries or met
through donor finance.
While this paper considers project-based REDD+ financed through the VCM,
whatever a future REDD+ mechanisms looks like, there is a need to understand
carbon stocks better. Verchot et al. (2012) report slow progress to generate new
data for GHG inventories from forests and the capacity of countries to
implement higher tier inventories. Expecting all countries to be able to
undertake higher Tier accounting in the near term might be infeasible, but
ensuring that countries are making efforts to do so will speedy up the process.
This study, therefore, makes a case for earmarking a portion of international
finance flowing to prepare countries for a REDD+ mechanism for reducing
uncertainty and improving national forest inventories through long-term
institutional backing and resources. This can come from dedicated REDD+
initiatives such as UN-REDD and the World Bank’s Forest Carbon Partnership
Facility, but also through a number of other climate finance initiatives
supporting REDD+ (Climate Funds Update, 2011).
This Chapter emphasises the uncertainty in emission reductions accounting for
REDD+ projects. It is not intended to offer authoritative results on the carbon
stocks of the Bale Mountains; further study could improve forest carbon stock
estimates by increasing sample sizes and through the testing or development of

162
allometric equations. With large discrepancy and no standardisation of
methods to estimate forest carbon stocks, expected emissions reductions may
not actually be realised due to the choice of method of accounting rather than
changes in actual forest carbon stock. If this occurs then the environmental
integrity, and so credibility, of a REDD+ mechanism will be called into question.
There is, therefore, a need to improve the quantification of uncertainty,
reduction of uncertainty where possible and better communication so that
uncertainty forms part of policy decisions. Reducing the sectors reliance on the
conservativeness principle to deal with uncertainty in emission reductions
accounting will aid a more appropriate handling of uncertainty. While the
conservativeness principle will remain important to ensure emission reductions
are not overestimated, it should not preclude the quantification and
communication of forest carbon stock uncertainties.
Dealing with decision-making under uncertainty is not novel in climate change
policy (see Webster et al., 2002). Under UNFCCC negotiations, countries are
encouraged but not obliged to include uncertainty estimates in their national
communications to the UNFCCC (UNFCCC, 2002). While highly uncertain
accounting might be acceptable for national communications, it is insufficient
for a performance-based incentive mechanism like REDD+. Although additional
costs will be incurred to reduce uncertainty, and trade-offs between factors in
the accounting process may be introduced, the financial incentives for
improved emission reductions accounting are clear.
163
Chapter 6: Household heterogeneity in forest income and the
opportunity cost of forest conservation
6.1. Introduction
6.1.1. Problem statement
There are growing calls for community forest management (CFM) to be used a
policy mechanism to deliver REDD+ (Klooster and Masera, 2000, Murdiyarso
and Skutsch, 2006, Agrawal and Angelsen, 2009, Hayes and Persha, 2010). CFM
establishes a common property regime where members of a well-defined group
of forest users establish collective regulations for resource use, membership,
monitoring, and sanctioning procedures (Arnold, 2001, Baland and Platteau,
2003, Agrawal and Angelsen, 2009). It has been shown that CFM can lead to
reductions in GHG emissions where forest use becomes more sustainable
(Chhatre and Agrawal, 2009, Skutsch and Ba, 2010). Thought to inherently
address the livelihood needs of communities, REDD+ via CFM could reduce the
risks and associated costs of dealing with the displacement of emissions outside
of the project area, termed leakage (Smith and Scherr, 2003). Research is also
emerging that indicates that the costs of MRV and community enforcement of
forest conservation regulations can also be lower under CFM than the
equivalent labour and administration requirements provided by professionals
and central forest departments (Somanathan et al., 2009, Palmer Fry, 2011).
REDD+, however, emerged as a PES scheme whereby the environmental service
of carbon dioxide emission reductions are sold, through a voluntary
transaction, and payment is conditional upon the provision of that service
(Wunder, 2005). This view of REDD+ as a PES scheme predominantly discusses
a mechanism with direct, output based payments that are strongly additional
and conditional on continued service provision (see Santilli et al., 2005, Parker

164
et al., 2008, Bond et al., 2009). Such theory of PES works best where there are
well-defined buyers and providers with clear property rights; thus property
rights are a foremost issue in PES (Wunder, 2007, Engel and Palmer, 2008,
Clements et al., 2010). With voluntary enrolment into a local-level PES scheme,
theory predicts that households will not engage with a REDD+ scheme with
voluntary participation at the household level if their costs of participation are
not met (Wünscher et al., 2008). Although it is also known that decisions to
participate in PES will also be driven by non-use values and individuals
preferences for altruism, reciprocity, and conformity with the wider community
(Velez et al., 2009; see also Chapter 8). It has been proposed that an estimate of
the private opportunity costs (OCs) of forest conservation could be used to
anchor the level of payment needed to achieve the desired level of forest
conservation for REDD+ (Pirard, 2008, Wertz-Kanounnikoff, 2008, Pagiola and
Bosquet, 2009, White and Minang, 2011).
Estimates of the OCs of forest conservation are predominantly based on
agricultural productivity as the main driver of deforestation. These are
estimated as forgone revenues per hectare, thus the OCs of land (e.g. Chomitz
et al., 2005, Naidoo and Adamowicz, 2006, Börner et al., 2009). The OCs of land
resulting from other drivers of deforestation such as; logging, cattle ranching or
small-scale staple crop and fuelwood collection, are less frequently assessed.
Fisher et al. (2011) is rare in considering the OCs of charcoal production on land
as well as of agriculture; finding the OCs of agriculture to exceed those of
charcoal per hectare of forest in the districts across Tanzania. Karky and
Skutsch (2010), in considering the abatement costs of REDD+ via CFM in Nepal,
note that households may incur OCs of agricultural land, but will also
experience the impacts of restrictions on their use of fuelwood, fodder, timber
and NTFP. Although they do not estimate per hectare values, they suggest that
the OCs of agriculture may not be the appropriate measure to gauge incentives
for REDD+. It is also clear that forgone agricultural benefits may be somewhat

165
offset by the benefits that standing forest can continue to provide through
NTFPs, but also a host of other use and non-use values (see also Chapter 8).
The PES literature has afforded less attention to community-level PES than PES
negotiated with private individuals (Muradian et al., 2010). Community-level
PES schemes provide payment at the community level, such as in Mexico where
the national Programme of Payments for Biodiversity, Carbon and Agroforestry
Services distributes funds to communities from the government (Corbera and
Brown, 2008). Others provide in-kind payments including, clinics, schools,
public transport and infrastructure (Sommerville et al., 2009). This contrasts
with PES schemes that typically operate on a per hectare payment where
individual land rights can be established (Engel et al., 2008).
Community level payments are often made when the attribution of costs and
benefits to one household or individual is complex. In undertaking REDD+ via
CFM this will be the case. Multiple members of the CFM group will overlap in
their use of the forest, all members of the CFM group will have legitimate forest
use rights and it is not clear who would have deforested under the status quo,
either for agriculture or via other unsustainable practices. The resulting
difficulty in establishing costs and benefits on any hectare, and to a particular
household, complicates the establishment of a payment level. This is
particularly true given that the literature on household income from forest
resources shows that reliance on forests and households returns from
agriculture are highly heterogeneous even within a small geographical area
(Godoy and Lubowski, 1992, Byron and Arnold, 1999, Cavendish, 2000, Coomes
et al., 2004, Dovie et al., 2005).
It is worth noting that many PES schemes implemented in developing countries
find environmental service provision hard to attribute to individuals. As a
result, payments are commonly uniform and input-based with indirect and in-

166
kind incentives; but this is especially so where PES operates at a community
level (Sommerville et al., 2009, Southgate et al., 2009, Skutsch et al., 2011).
Studies that consider the OCs of forest conservation have often deliberately
excluded forests that are de facto common pool resources. Some note that use
and deforestation on such common pool resources are often forbidden by
statutory law (e.g. Grieg-Gran, 2006, Börner and Wunder, 2008). It is, therefore,
suggested that the OCs of land may be an inappropriate measure for
assessment of the feasibility of REDD+ policy as either illegal behaviours would
be rewarded or emission reductions may not be additional (Börner and
Wunder, 2008). It is for this reason that Wünscher et al. (2008), in their
calculation of OCs of forest conservation, assume natural forest produces no
commercial income. The costs incurred by the government of improving laws
and law enforcement have in some cases been considered more relevant than
the OCs of land for forest users in planning interventions where forest use is
illegal (Börner and Wunder, 2008, Busch et al., 2009, Gregersen et al., 2010).
Under CFM, however, communities are recognised as forest management
agents and legally become environmental service providers. A common
property regime is established, often on previously de facto common pool
resources. Despite the complexity, the quantitative assessment of the OCs of
forest conservation under a CFM regime can, therefore, still be used to provide
information on the private economic incentives that need to be overcome to
generate the desired level of conservation, and so to help assess payment levels
and implementation design. Appreciating the heterogeneity in OCs could, at
the least, inform obligations to ensure that REDD+ projects ‘do no harm’ to
forest communities (e.g. Griffiths, 2007, CCBA, 2008, Griffiths, 2009).
In considering the OCs of forest conservation for REDD+ on community forest
lands in the Brazilian Amazon, Nepstad et al. (2007) propose the creation of a

167
Public Forest Stewardship Fund for avoided deforestation on ‘social’ forest
reserves comprising 26% of the area’s forests, including indigenous lands,
extractive reserves, and sustainable development reserves. From this fund, it is
proposed that direct uniform payments should be made to households of these
communities anchored to half a minimum salary at US$1200 per year. A
uniform payment for REDD+ via CFM that is not linked to the OCs of forest
conservation for stakeholders, however, is more of a ‘PES-like’ scheme, in
which the voluntary or conditional nature of the payment is relaxed (Landell-
Mills and Porras, 2002, Wunder, 2008). Uniform payments in PES, however, are
not able to account for heterogeneity in the OCs of forests conservation. The
conditionality of the payment on service provision is reduced and the
additionality of the emission reductions can also be called into question if
payments are in excess of forgone benefits. Alternatively, payments may be
insufficient to fully overcome the OCs of those most involved in damaging
activities. With the potential to make households worse off if this is the case, it
may threaten the longevity, and thus permanence, of REDD+ via CFM.
In Ethiopia a project to generate REDD+ through CFM is being undertaken in
the Bale Mountains Eco-Region (BME; see Chapter 3 for a full description of the
Bale REDD+ Project). A number of national REDD+ strategies submitted to
multilateral initiatives financing REDD+ activities, such as the World Bank’s
Forest Carbon Partnership Facility (FCPF), are also pursuing REDD+ via CFM
(see FCPF, 2011). If CFM continues to be a favoured approach for implementing
REDD+, there is a need for more empirical research into the impacts of REDD+
via CFM on households’ OCs and into the mechanisms by which PES-type
interventions can operate in a common property regime. Empirical, ex-ante
assessment of the OCs of forest conservation at the case study site can give a
greater understanding of the incentives that drive deforestation. These
assessments can also inform the Bale REDD+ Project design. If the magnitude
and heterogeneity of the OCs of REDD+ via CFM are not sufficiently addressed
168
in payments to communities, the longevity of the intervention, the permanence
of emission reductions and thus climate change mitigation benefits are called
into question.
6.1.2. Aims and objectives
This chapter uses primary cross-sectional data gathered from household
surveys in southwest Ethiopia to estimate household forest income and
heterogeneity in forest use. Household income from agriculture is also
established. Multivariate regression is used to investigate the determinants of
household income from forest use and agriculture. The OCs of forest
conservation under the proposed Bale REDD+ Project are then estimated as the
forgone income from a hectare of agricultural revenues and the forgone
revenues from forest products at the case study site. As an ex-ante study, these
OC estimates are discussed with a view to understanding how the design of a
proposed Bale REDD+ Project, achieved via CFM, might capture income
heterogeneity in payment incentives. The study adds to the limited literature on
the OCs of forest conservation, particularly the OCs of REDD+ via CFM. I also
contribute to the limited literature on community-level PES, with wider
implications for REDD+ via CFM in tropical forests.
6.2. Methods
6.2.1. Household income from forests and agriculture in the Bale Mountains
Through household surveys information about a household’s use of the forest,
agricultural production and other economic activities were elicited. From these
household surveys the income from the previous years’ crop production and
forest products was estimated using market price valuation. Total household
income was not estimated as income from other sources such as livestock and
trade were not valued (see Chapter 4). Income is defined here as the return to

169
capital and labour that a household has access too. It includes both products
consumed at home as well as those sold on markets. To reported products and
yields, local-market prices were applied (see Appendix 2).
It was not possible to establish the shadow price for each household, such as
through embedded time or barter values (see Section 4.5.5). Being able to
attribute a shadow price to each household for each product would provide a
more accurate estimate of income. The estimated income may, therefore, be an
overestimate. However, market prices were applied from local markets which
had no entry restrictions or middle men, in an attempt to minimise
overestimation. In establishing OCs the main input costs were subtracted. The
agricultural income established was net of inputs including fertiliser, seed and
equipment, which were estimated as costs by the survey respondents, however,
the costs of household labour were not subtracted. The main input for forest
products was labour and was not subtracted. As noted in Section 4.3, the
market wage was not a good measure of the shadow wage and resources were
insufficient to estimate the shadow wage indirectly.
Forest income was separated into two types of forest products based on broad
assumptions about their impact on the Bale REDD+ Project. Timber and
fuelwood are considered high-impact forest products as they involve the
removal of large amounts of biomass from the forest. Bamboo, coffee, climber
and honey are considered low-impact forest products, as they perceived to
remove lower amounts of biomass when harvested. These broad categorisations
are in line with the Bale REDD+ Project intentions to impose forest product use
restrictions on high-impact forest product extraction and none on low-impact
forest product extraction. It is acknowledged, however, that further research
would need to be conducted on their wider impact on biomass, such as of
cultivation and harvest method, and thus on emission reductions. For example,
high-impact forest products such as timber, can still be sustainable if harvest is
170
less than growth, and the production of forest coffee may lead to losses in
biomass if canopy cover is altered. Schmitt et al. (2009), for example, consider
wild forest coffee management in the southwest of Ethiopia. They find that
natural forest yields of coffee are lower than in semi-managed systems where
canopy cover is and undergrowth vegetation is removed.
6.2.2. Econometric analysis
An understanding of what drives household incomes allows a more detailed
exploration of how households will be impacted by the Bale REDD+ Project
intervention. Household’s income from agricultural production, and from
forests, disaggregated into low-impact and high-impact forest income, is
regressed against predicted determinants. This enables the OC estimates to be
placed in the context of the proposed Bale REDD+ Project intervention.
An ordinary least squares (OLS) regression model is used to investigate the
determinants of a household’s income from high-impact forest products and
agricultural production. Continuous income variables were log transformed to
allow for a non-linear relationship between the dependent and independent
variables. The log transformation also normalises the residuals and reduces
potential outliers. A Logit and a Tobit regression were used to determine
household income from low-impact forest products. These model specifications
were necessary as 50% of the households in the sample did not have income
from biomass conserving forest products, neither for home consumption nor
sale, but where they did the income was a continuous random variable with
positive values. The Logit model predicts the presence or absence of income
from low-impact forest products with a binary, yes or no, response. Tobit, on
the other hand, predicts the probability of being above zero and the
determinants if the income is greater than zero (see Chapter 4 for a description
of the regression models).
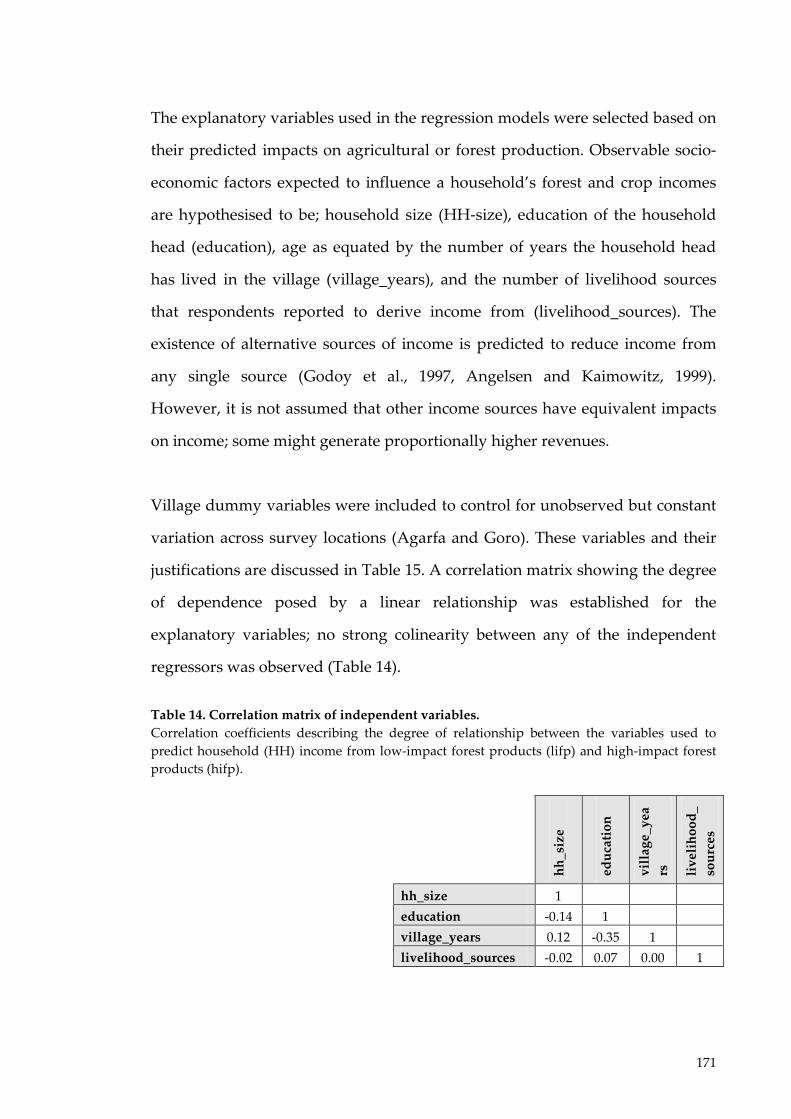
171
The explanatory variables used in the regression models were selected based on
their predicted impacts on agricultural or forest production. Observable socio-
economic factors expected to influence a household’s forest and crop incomes
are hypothesised to be; household size (HH-size), education of the household
head (education), age as equated by the number of years the household head
has lived in the village (village_years), and the number of livelihood sources
that respondents reported to derive income from (livelihood_sources). The
existence of alternative sources of income is predicted to reduce income from
any single source (Godoy et al., 1997, Angelsen and Kaimowitz, 1999).
However, it is not assumed that other income sources have equivalent impacts
on income; some might generate proportionally higher revenues.
Village dummy variables were included to control for unobserved but constant
variation across survey locations (Agarfa and Goro). These variables and their
justifications are discussed in Table 15. A correlation matrix showing the degree
of dependence posed by a linear relationship was established for the
explanatory variables; no strong colinearity between any of the independent
regressors was observed (Table 14).
Table 14. Correlation matrix of independent variables. Correlation coefficients describing the degree of relationship between the variables used to predict household (HH) income from low-impact forest products (lifp) and high-impact forest products (hifp).
hh_s
ize
educ
atio
n
villa
ge_y
ears
livel
ihoo
d_so
urce
s
hh_size 1 education -0.14 1 village_years 0.12 -0.35 1 livelihood_sources -0.02 0.07 0.00 1
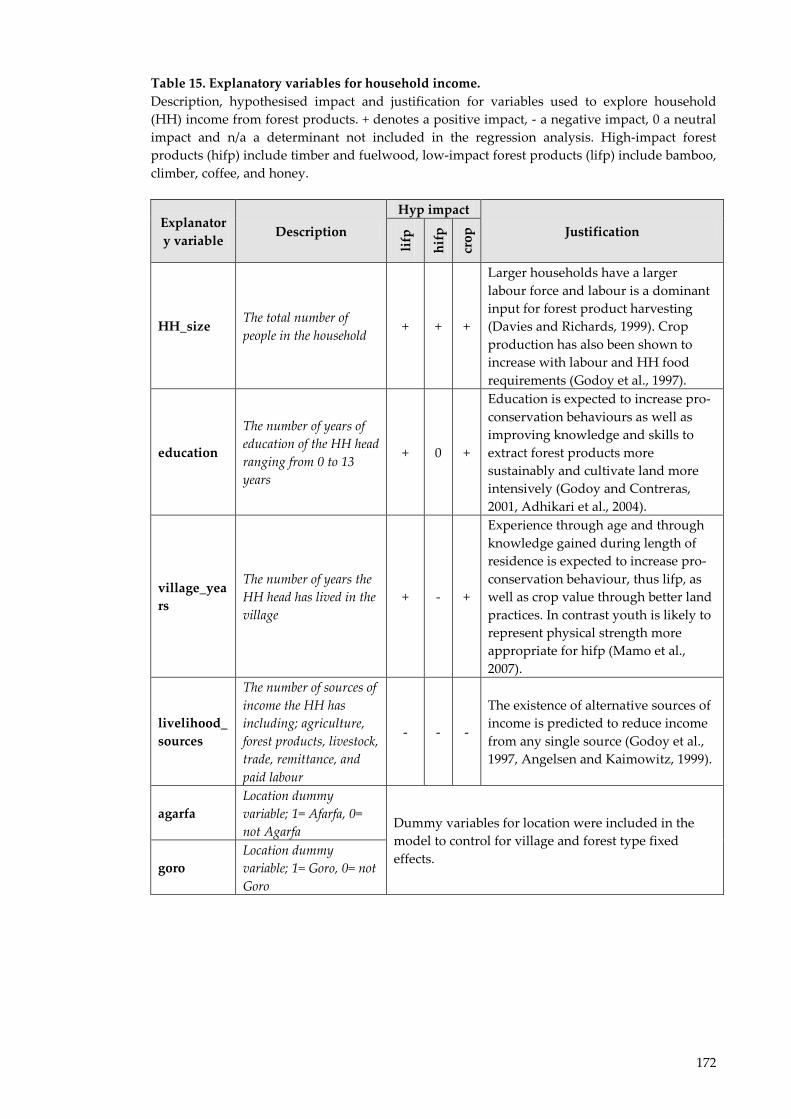
172
Table 15. Explanatory variables for household income. Description, hypothesised impact and justification for variables used to explore household (HH) income from forest products. + denotes a positive impact, - a negative impact, 0 a neutral impact and n/a a determinant not included in the regression analysis. High-impact forest products (hifp) include timber and fuelwood, low-impact forest products (lifp) include bamboo, climber, coffee, and honey.
Explanatory variable
Description Hyp impact
Justification
lifp
hifp
crop
HH_size The total number of people in the household
+ + +
Larger households have a larger labour force and labour is a dominant input for forest product harvesting (Davies and Richards, 1999). Crop production has also been shown to increase with labour and HH food requirements (Godoy et al., 1997).
education
The number of years of education of the HH head ranging from 0 to 13 years
+ 0 +
Education is expected to increase pro-conservation behaviours as well as improving knowledge and skills to extract forest products more sustainably and cultivate land more intensively (Godoy and Contreras, 2001, Adhikari et al., 2004).
village_years
The number of years the HH head has lived in the village
+ - +
Experience through age and through knowledge gained during length of residence is expected to increase pro-conservation behaviour, thus lifp, as well as crop value through better land practices. In contrast youth is likely to represent physical strength more appropriate for hifp (Mamo et al., 2007).
livelihood_sources
The number of sources of income the HH has including; agriculture, forest products, livestock, trade, remittance, and paid labour
- - -
The existence of alternative sources of income is predicted to reduce income from any single source (Godoy et al., 1997, Angelsen and Kaimowitz, 1999).
agarfa Location dummy variable; 1= Afarfa, 0= not Agarfa Dummy variables for location were included in the
model to control for village and forest type fixed effects.
goro Location dummy variable; 1= Goro, 0= not Goro

173
6.2.3. The opportunity costs of forest conservation
6.2.3.1. The opportunity costs of forest products
Under the proposed Bale REDD+ Project, households will move from the open
access status-quo to the proposed CFM, common property regime. A
cooperative of households will be required to negotiate a Forest Management
Agreement with the forest government agency that outlines resource use and
deforestation restrictions as well as household responsibilities (see Chapter 3
for a more detailed discussion on the Bale REDD+ Project design and case study
site).
Under Forest Management Agreement, to prevent the loss of forest cover,
households will be limited in their collection of timber and fuelwood;
collectively termed high-impact forest products. Households will be allowed to
continue to gather forest coffee, honey, bamboo and climbers; collectively
termed as low-impact forest products. The complete by-laws of forest use had
not yet been negotiated with the forest government agency and the community
at the time of the survey. These would dictate the restrictions on the households
for high-impact forest products. It was necessary to assume, therefore, that all
high-impact forest products were restricted. Predominantly as by-laws have yet
to be agreed, and secondly as restrictions are difficult to relate to household
harvests. For example, if fuelwood collection is restricted to deadwood for three
days a week, it is not clear what proportion reduction this would have on a
household.
The OCs of forest conservation were estimated as a total ban on harvesting of
all high-impact forest products and with no restrictions on low-impact forest
products. As households need to access fuelwood and alternative energy
sources are few, the Bale REDD+ Project implementers are distributing more
fuel-efficient stoves, mechanisms to generate biomass briquettes and are

174
establishing woodlots (BERSMP, 2006). These measures will reduce or
substitute household demand and thus reduce the OCs of these high-impact
forest products. However, it may be some years until woodlots are mature
enough to substitute the needs of households completely, thus the OCs of high-
impact forest products may only be experienced by households at the outset of
the intervention.
Household’s reported the forest products and quantities that were collected, but
were understandably unable to estimate the area of land from which they
harvested these products. It is therefore difficult to establish the area of land
and associated income from forest products for any given hectare of forest, as
has been used in other studies of the OCs of forest conservation (Börner et al.,
2009). To establish the OCs of forest products on a per hectare basis, average
forest income of the survey households was first aggregated to all households
to estimate the total village’s income from forest products, which is then
divided by the total area of forest available to the village population. This
assumes that the whole of the forest area of the village is available for
exploitation; that the forest income is representative of the village as a whole;
and, the forest is freely accessible to all villagers. Although some dense areas of
forest may be underused, the majority of forest observed in the BME is
exploited. The number of households in the survey locations and the area of
forest used in the estimates of OCs of forest products per hectare were sourced
from local Agricultural and Rural Development Offices at the relevant villages
(see Table 1, Chapter 3).
A second option to establish area of forest use, if sufficient data had been
available, would be to use estimates of the biomass in a hectare of forest and
then value this biomass as the diversity of products from that hectare. Fisher et
al. (2010), for example, established the OCs of charcoal production by using
statistical relationships between yield of wood available for charcoal, kiln
175
efficiencies for turning biomass into charcoal and profit data from charcoal
supply chain analyses. To have estimated the value of biomass in a hectare of
forest at the case study site, however, it would be necessary to know what
proportion of the biomass can be used for each purpose, so for example the
above-ground tree biomass established in Chapter 5 would be a starting point
of the biomass per hectare if all of it was to be used for firewood. Secondly, it
would be necessary to establish the biomass content of a donkey load of
fuelwood, so as to establish a market price. But this was not possible at the case
study site for reasons noted in Chapter 4. Although it is reported by the Bale
REDD+ Project implementers (see Chapter 3) that on average,
6m3/household/year is required for fuelwood consumption in the BME, it is also
observed that forest use is not sustainable. Therefore, without an estimate of the
biomass content of a donkey load of fuelwood, it was not possible to estimate
the OCs of high-impact forest products in this way.
6.2.3.2. The opportunity costs of land for agriculture
Under the Forest Management Agreement, households will be unable to
expand their cultivated land. Agricultural production is a rival and excludable
use of land in direct opposition to REDD+ via CFM. Households that would
have expanded in the status-quo will have to forego this income. No established
land markets exist in Ethiopia, which under perfect market conditions could
serve as a proxy for OCs, therefore, in order to establish the OCs of agricultural
production per hectare, the household incomes that were established were
divided by the area of cultivated land from which households reported yields
(see Chapter 4, Section 4.3.2.3).
The OCs of agriculture may be reduced by the presence of low-impact forest
product income on the conserved forest. Low-impact forest product income
(including extraction of bamboo, climber, coffee and honey) is not in opposition

176
to the project and households can continue to derive this income source under
the Bale REDD+ Project intervention. Thus net OCs of a hectare of land can be
established from the difference between agricultural and low-impact forest
product revenues per hectare which may better represent the trade-offs that
household may make on a hectare of land. Two agricultural OC measures were
generated for each household; the OCs of agricultural land (US$/ha) and the net
OCs of land offsetting forgone agriculture with low-impact forest production
(US$/ha).
6.3. Results
6.3.1. Descriptive statistics
Of 237 household surveys, two households were dropped due to apparent
misreporting of yields. Descriptive statistics for the remaining surveys support
the assumption that the sample population is representative of the wider BME
as they are largely consistent with other household surveys of Ethiopia
(Mekonnen, 2000, Mamo et al., 2007, Babulo et al., 2009, Yemiru et al., 2010,
Tesfaye et al., 2011). The average number of people in survey households is 6.5
where other Ethiopian studies find household size between 5.35 and 8.3. The
average years of education of the household heads in the survey population
was 4.27. The number of years the household head has lived in the village can
be roughly equated to the age of the household head. An average of 42 years
aligns with existing studies in Ethiopia of 35 to 50. Average land holdings of 2.2
are comparable with means reported in other household surveys from Ethiopia
of between 1 and 2.1 hectares. The average number of livelihood sources was
three; agriculture, forest and livestock incomes, with only a few households
engaging in trade or waged labour as also found in other household income
studies within Ethiopia (Table 16) (Mekonnen, 2000, Mamo et al., 2007, Babulo
et al., 2009, Yemiru et al., 2010, Tesfaye et al., 2011).
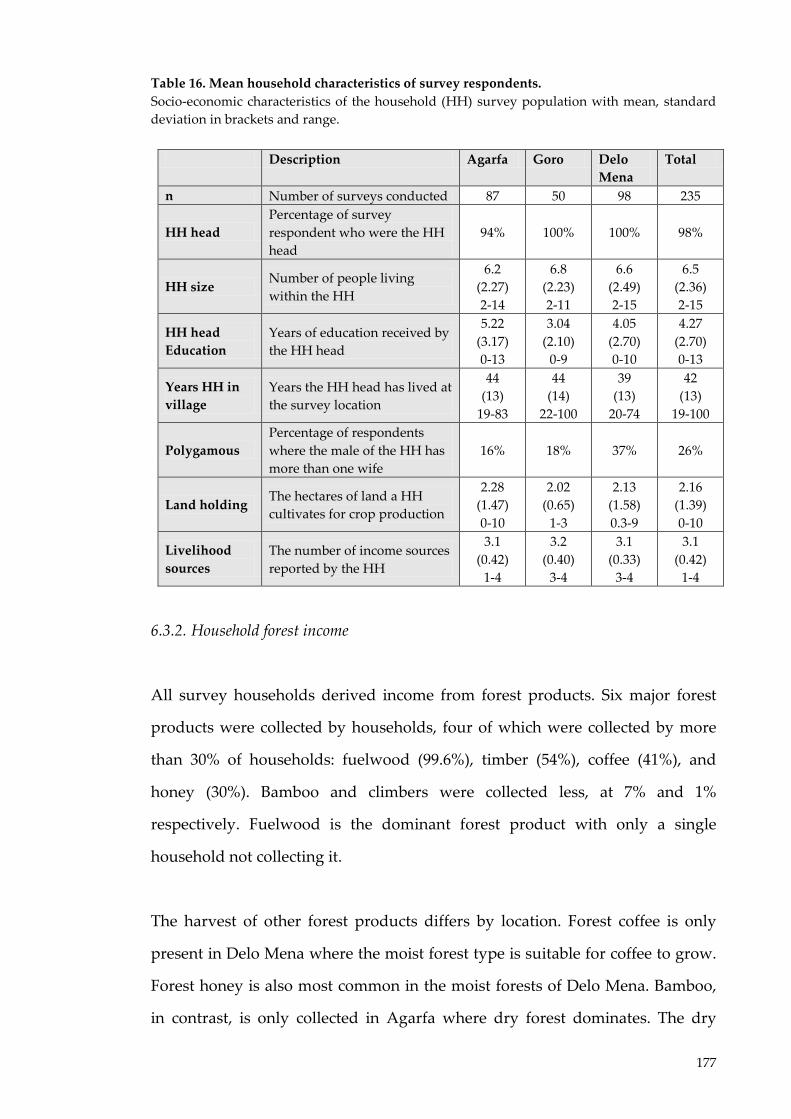
177
Table 16. Mean household characteristics of survey respondents. Socio-economic characteristics of the household (HH) survey population with mean, standard deviation in brackets and range.
Description Agarfa Goro Delo Mena
Total
n Number of surveys conducted 87 50 98 235
HH head Percentage of survey respondent who were the HH head
94% 100% 100% 98%
HH size Number of people living within the HH
6.2 (2.27) 2-14
6.8 (2.23) 2-11
6.6 (2.49) 2-15
6.5 (2.36) 2-15
HH head Education
Years of education received by the HH head
5.22 (3.17) 0-13
3.04 (2.10)
0-9
4.05 (2.70) 0-10
4.27 (2.70) 0-13
Years HH in village
Years the HH head has lived at the survey location
44 (13)
19-83
44 (14)
22-100
39 (13)
20-74
42 (13)
19-100
Polygamous Percentage of respondents where the male of the HH has more than one wife
16% 18% 37% 26%
Land holding The hectares of land a HH cultivates for crop production
2.28 (1.47) 0-10
2.02 (0.65)
1-3
2.13 (1.58) 0.3-9
2.16 (1.39) 0-10
Livelihood sources
The number of income sources reported by the HH
3.1 (0.42)
1-4
3.2 (0.40)
3-4
3.1 (0.33)
3-4
3.1 (0.42)
1-4
6.3.2. Household forest income
All survey households derived income from forest products. Six major forest
products were collected by households, four of which were collected by more
than 30% of households: fuelwood (99.6%), timber (54%), coffee (41%), and
honey (30%). Bamboo and climbers were collected less, at 7% and 1%
respectively. Fuelwood is the dominant forest product with only a single
household not collecting it.
The harvest of other forest products differs by location. Forest coffee is only
present in Delo Mena where the moist forest type is suitable for coffee to grow.
Forest honey is also most common in the moist forests of Delo Mena. Bamboo,
in contrast, is only collected in Agarfa where dry forest dominates. The dry
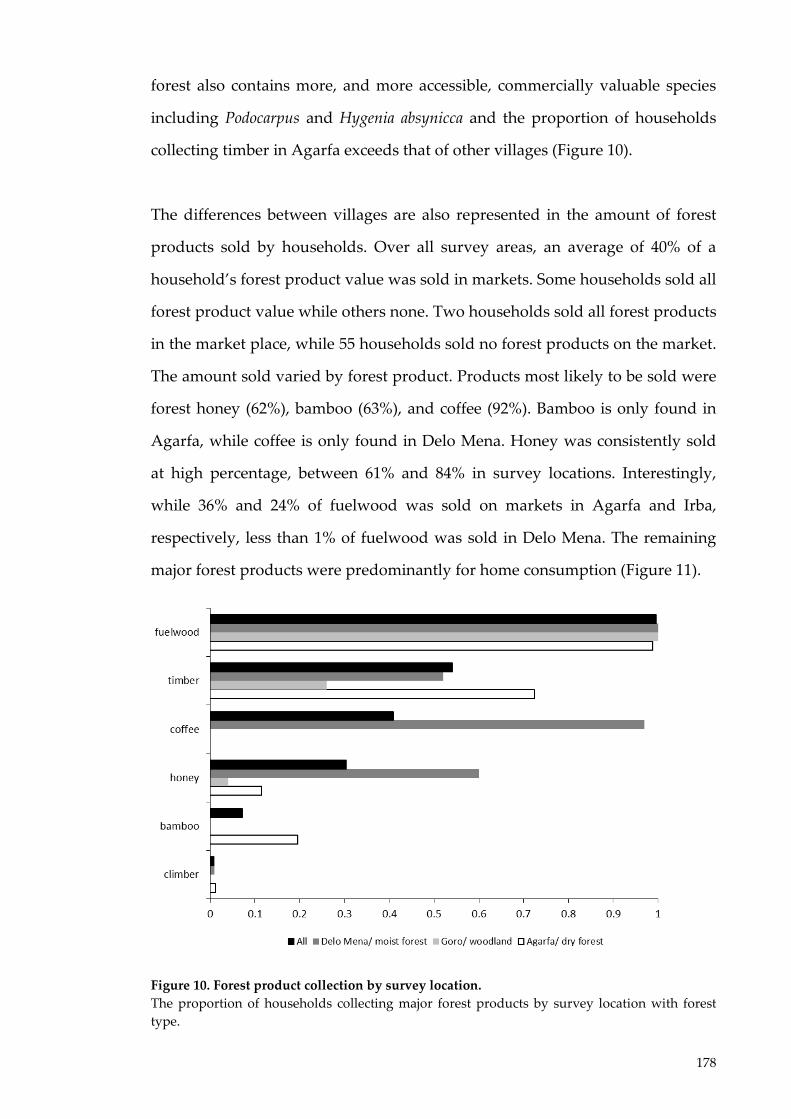
178
forest also contains more, and more accessible, commercially valuable species
including Podocarpus and Hygenia absynicca and the proportion of households
collecting timber in Agarfa exceeds that of other villages (Figure 10).
The differences between villages are also represented in the amount of forest
products sold by households. Over all survey areas, an average of 40% of a
household’s forest product value was sold in markets. Some households sold all
forest product value while others none. Two households sold all forest products
in the market place, while 55 households sold no forest products on the market.
The amount sold varied by forest product. Products most likely to be sold were
forest honey (62%), bamboo (63%), and coffee (92%). Bamboo is only found in
Agarfa, while coffee is only found in Delo Mena. Honey was consistently sold
at high percentage, between 61% and 84% in survey locations. Interestingly,
while 36% and 24% of fuelwood was sold on markets in Agarfa and Irba,
respectively, less than 1% of fuelwood was sold in Delo Mena. The remaining
major forest products were predominantly for home consumption (Figure 11).
Figure 10. Forest product collection by survey location. The proportion of households collecting major forest products by survey location with forest type.

179
Figure 11. Forest products sold on markets. The average percentage of a household’s forest products collected for home consumption versus that sold on markets, across all survey locations.
The average income from forest products collected by households was US$1,344
in the survey year, ranging between US$51 and US$12,969 (Figure 12).
Significant differences exist between survey locations in the value of total forest
production, forest production for home consumption, and forest production for
sale on markets (Kruskall-Wallis tests: total forest production, K=81.189, df=2,
p=0.0001***; home consumption, K=5.514, df=2, p=0.0635*; forest production for
sale on markets, K=94.969, df=2, p=0.0001***). Woodland households in Goro
derive the lowest average forest value at US$444 and moist forest households in
Delo Mena the highest at US$1,978; more than four times greater. The average
household forest income in the BME is higher than the mean forest income of
US$678 per household found in a meta-study of 54 cases over 17 countries
(Vedeld et al., 2004), but comparisons are complicated by a host of context-
specific differences in the forest resource base.
Dividing forest uses into categories of low-impact (honey, coffee, climber and
bamboo) and high-impact (fuelwood and timber), households derive more
income from low-impact forest products overall at US$791 ± 167 as opposed to
0% 10% 20% 30% 40% 50% 60% 70% 80% 90% 100%
Timber
Fuelwood
Climber
Honey
Bamboo
Coffee
Home consumption Sold at market

180
US$553 ± 94 from high-impact forest products. There are statistically significant
differences in both forest income types across survey locations (Kruskall-Wallis
tests: low-impact products, K=144.620, df=2, p=0.001***; high-impact forest
products, K=50.846, df=2, p=0.0001***). This difference is driven largely by the
substantial income from forest coffee in Delo Mena. In Agarfa and Goro, the
income from high-impact forest products to the average household is much
greater than low-impact forest products as a result of timber and fuelwood,
respectively (Figure 13).
Figure 12. Mean household forest income. Mean household income of total forest products, home consumption and that sold on markets (US$) established through market price valuation reported by survey location with total forest income 95% confidence intervals.

181
Figure 13. Mean household forest income from low-impact and high-impact forest products. Mean household income of low-impact forest products, bamboo, climber, coffee and honey (FP)(US$), and high-impact FP, timber and fuelwood (US$), established through market price valuation reported by survey location with total forest income 95% confidence intervals and range.
6.3.3. Household agricultural income
The average land holding across survey locations was found to be 2.16 ha, with
a range from 0 to 10 ha. Only three of 235 surveyed households reported no
gross income from agricultural land during the 12 month recall period. Of
these, two did not have land holdings while the third experienced total crop
failure due to drought, although others reported no such drought. Twenty crop
types were identified. The top five most commonly cultivated were cereal
crops: Maize, Teff, Wheat, Barley, and Sorghum.
The average household crop income was US$907 in the year of the survey
ranging between US$ -157 and US$5,355 per household (Table 17). Two
households had negative incomes due to higher inputs from fertilizer, seed and
equipment in that year than the market valuation of their yields. Unlike income

182
to forest use, no significant differences in agriculture were found between
locations (Kruskall-Wallis tests: crop total US$/household, K=2.110, df=2,
p=0.348). Over all crop types, the average household sold 20% of gross crop
value with no significant differences found in the amount kept for home
consumption, but significant differences found at the 1% level for the
proportion sold. Goro sold 38% of agricultural yields, whereas Agarfa and Delo
Mena sold less at 22% and 6% respectively (Kruskall-Wallis tests: crop home
consumption US$/household, K=739, df=2, p=0.6912; crop sale US$/household,
K=26.700, df=2, p=0.0001***; Figure 14).
Table 17. Mean household income from forest products and agriculture. Mean household income (US$) for low-impact forest products (including bamboo, climber, coffee and honey) and high-impact forest products (fuelwood and timber) and agriculture, established through market price valuation reported by survey location with 95% confidence intervals and range.
Location Income description (US$/household)
High-impact forest products
Low-impact forest products
Crop production
Agarfa (n=87)
937 ± 222 (102 to 5,123)
210 ± 189 (0 to 7,755)
914 ± 160 (-154 to 3,490)
Goro (n=50)
435 ± 95 (51 to 1,746)
10 ± 18 (0 to 459)
1,088 ± 266 (174 to 5,355)
Delo Mena (n=98)
272 ± 36 (88 to 985)
1,705 ±276 (0 to 7,126)
808 ± 125 (54 to 3,726)
All (n=235)
553 ± 94 (51 to 5,213)
791 ± 167 (0 to 7,755)
907 ± 98 (-154 to 5,355)
Babulo et al.’s (2009) findings for the marketed and non-marketed value of
household crop production in Tigray, Northern Ethiopia, are substantially
lower than these findings, with annual household income from crops ETB 414
(or approximately US$ 50). Mamo et al. (2006) instead found mean agricultural
income of households of approximately US$675 in the Dendi district of
Ethiopia. As with household forest incomes, comparisons are complicated by
the context-specific differences in ecological and market variables. Mamo et al.
also demonstrates the significant ranges in household income; with standard
deviation of household incomes from agriculture ranging at just over US$ 600.
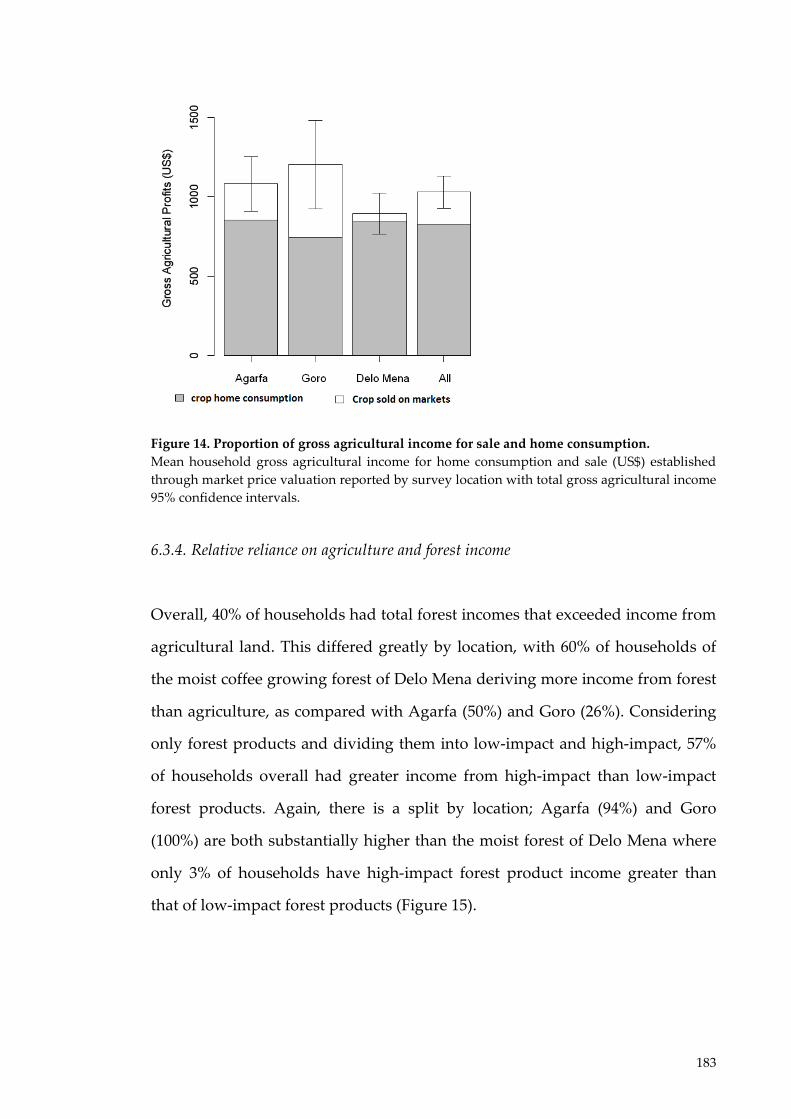
183
Figure 14. Proportion of gross agricultural income for sale and home consumption. Mean household gross agricultural income for home consumption and sale (US$) established through market price valuation reported by survey location with total gross agricultural income 95% confidence intervals.
6.3.4. Relative reliance on agriculture and forest income
Overall, 40% of households had total forest incomes that exceeded income from
agricultural land. This differed greatly by location, with 60% of households of
the moist coffee growing forest of Delo Mena deriving more income from forest
than agriculture, as compared with Agarfa (50%) and Goro (26%). Considering
only forest products and dividing them into low-impact and high-impact, 57%
of households overall had greater income from high-impact than low-impact
forest products. Again, there is a split by location; Agarfa (94%) and Goro
(100%) are both substantially higher than the moist forest of Delo Mena where
only 3% of households have high-impact forest product income greater than
that of low-impact forest products (Figure 15).

184
Figure 15. Proportion of household income from forest and agriculture. Mean household agricultural income and forest income (US$) established through market price valuation reported by survey location with total forest product and crop income 95% confidence intervals.
6.3.5. Econometric analysis of household income from land uses
As in the descriptive results, the strong effect of location on forest incomes is
also clear in the regression results. As noted in Chapter 4, this cross-sectional
data-set is limited given that there are three survey locations with three
differing forest types. Effects due to forest characteristics and village
characteristics, therefore, cannot be separated. The inclusion of a village
dummy variable however, encapsulates differences to help control for
unobserved but constant variation across survey locations. By controlling for
the location differences with dummy variables, further socio-economic factors
driving income from forests and agriculture were investigated. The majority of
findings correspond with hypotheses of forest and crop income reliance (see
Table 15; Table 18).
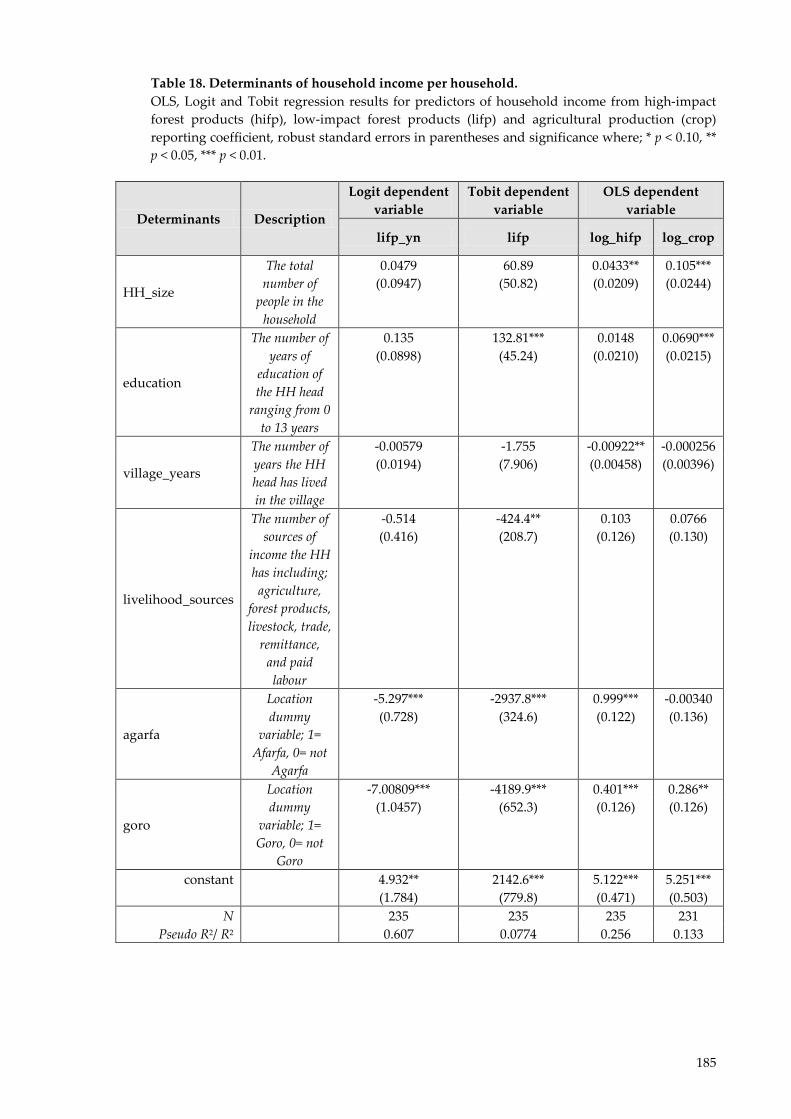
185
Table 18. Determinants of household income per household. OLS, Logit and Tobit regression results for predictors of household income from high-impact forest products (hifp), low-impact forest products (lifp) and agricultural production (crop) reporting coefficient, robust standard errors in parentheses and significance where; * p < 0.10, ** p < 0.05, *** p < 0.01.
Determinants Description
Logit dependent variable
Tobit dependent variable
OLS dependent variable
lifp_yn lifp log_hifp log_crop
HH_size
The total number of
people in the household
0.0479 60.89 0.0433** 0.105*** (0.0947) (50.82) (0.0209) (0.0244)
education
The number of years of
education of the HH head
ranging from 0 to 13 years
0.135 132.81*** 0.0148 0.0690*** (0.0898) (45.24) (0.0210) (0.0215)
village_years
The number of years the HH head has lived in the village
-0.00579 -1.755 -0.00922** -0.000256 (0.0194) (7.906) (0.00458) (0.00396)
livelihood_sources
The number of sources of
income the HH has including; agriculture,
forest products, livestock, trade,
remittance, and paid labour
-0.514 -424.4** 0.103 0.0766 (0.416) (208.7) (0.126) (0.130)
agarfa
Location dummy
variable; 1= Afarfa, 0= not
Agarfa
-5.297*** -2937.8*** 0.999*** -0.00340 (0.728) (324.6) (0.122) (0.136)
goro
Location dummy
variable; 1= Goro, 0= not
Goro
-7.00809*** -4189.9*** 0.401*** 0.286** (1.0457) (652.3) (0.126) (0.126)
constant 4.932** 2142.6*** 5.122*** 5.251*** (1.784) (779.8) (0.471) (0.503)
N Pseudo R2/ R2
235 235 235 231 0.607 0.0774 0.256 0.133
186
The R2 value for the OLS regression for log transformed high-impact forest
product income indicates that the models explain 31% of the variation. For log
transformed crop income, the OLS model explains only 13% of the variation.
These R2 indicate that there are other factors not observed here which impact on
income, in particular for agricultural income. A Ramsey RESET test was used to
assess the functional form of the OLS models to detect omitted variables,
suggesting that the models were not miss-specified (Ramsey RESET; log_hifp
F(3, 224)=0.64, p=0.5922); and log_crop F(3, 221)=1.74, p=0.1606).
As in the OLS regressions, there are likely other factors that influence on
income that are not included in the Logit and Tobit model. There is not an
equivalent test to the Ramsey RESET for the miss-specification of the Logit
model and Tobit models. A Lagrange Multiplier test, however, was used to
determine whether the Logit specification was affected by omitted variable bias.
Results for the Logit model showed that household size was an important
control variable to include in the model, significant at the 10% level. Other
controls of education, village years and livelihood sources, are not significant
and could have been omitted them from the Logit specification. The Lagrange
Multiplier test indicated that in the Tobit model other controls were not
significant and could have been omitted from the Tobit specification. For
consistency with the OLS regressions, however, even these controls which are
not significant are reported in the Logit and Tobit regressions (Table 19). The
most important thing to stress is that the results from the estimated coefficients
for location are significant and robust across the models.

187
Table 19. Lagrange Multiplier test for miss-specification of the Logit and Tobit model. Significance is noted as; * p < 0.10, ** p < 0.05, *** p < 0.01
Term LM score degrees of freedom p value Logit lifp_yn HH_size 0.02 1 0.9025 education 2.87 1 0.0901* village_years 1.55 1 0.2130 livelihood_sources 0.77 1 0.3807 simultaneous test 8.02 5 0.1549 Tobit lifp hh_size 1.98 1 0.1598 years_in_village 0.01 1 0.9042 simultaneous test 3.78 3 0.2857
Household size
For both high-impact forest products and crop income, household size is a
significant determinant of income. This result follows that found in the
literature of increasing household size indicating increased labour availability
for forest product harvesting (Davies and Richards, 1999). The coefficient can be
interpreted as a one person increase in household size leading to almost a 4%
increase in income from high-impact forest products. In larger households more
crops may also be grown to feed more household members and labour is
commonly found as a limiting factor for crop production in other household
income studies (Godoy et al., 1997). A one person increase in household size
leads to an 11% increase in crop income. No impact of household size was
found for the presence or absence of low-impact forest product income
indicating perhaps this income is not labour constrained.
Household head education and years in village
Although the average education of the household head does not exceed a
primary education, education is a significant determinant of income from crops.
The coefficient can be interpreted as one year of additional schooling leading to
a 7% increase in crop income. This suggests that education can improve
household income from a parcel of land, perhaps through knowledge of the
application of fertiliser, improved seeds and farming techniques. Similar results

188
on the impact of education have been found in other studies (Godoy and
Contreras, 2001). Education was not found to impact on high-impact forest
product income, or low-impact forest product income in the Logit model.
However, the Tobit model shows that higher education significantly and
positively determines income from low-impact forest products.
The number of years the household head has been in the village can be
considered a proxy for the age of the household head. Older households derive
less income from high-impact forest products, with no effects of age found on
other income sources. The coefficient can be interpreted as a year less within the
village increasing high-impact forest product income by 1%. This could be due
to the physical intensity of labour required for high-impact forest product
income sources, as Mamo et al. (2007) also found in Ethiopia; timber harvest
requires physical strength. From household interviews and discussions at the
case-study site, it was also clear that younger households resort to fuelwood
and timber extraction to derive income through lack of alternatives; thus
increasing their high-impact forest product income.
Alternative livelihoods and income from other sources
The number of livelihood sources a household derives income from was not
found to determine income from high-impact forest products or agriculture.
This could suggest that subsistence levels of high-impact forest products of
fuelwood and timber as well as a certain level of crop production is necessary
for household survival and, therefore, they are non-substitutable livelihood
sources. While the Logit model did not reveal impact of other livelihood
sources on low-impact forest product income, the Tobit model shows that if
income is received from this source, the presence of other livelihood sources
including trade, waged labour, remittance and livestock, reduced the income
from low-impact forest products.
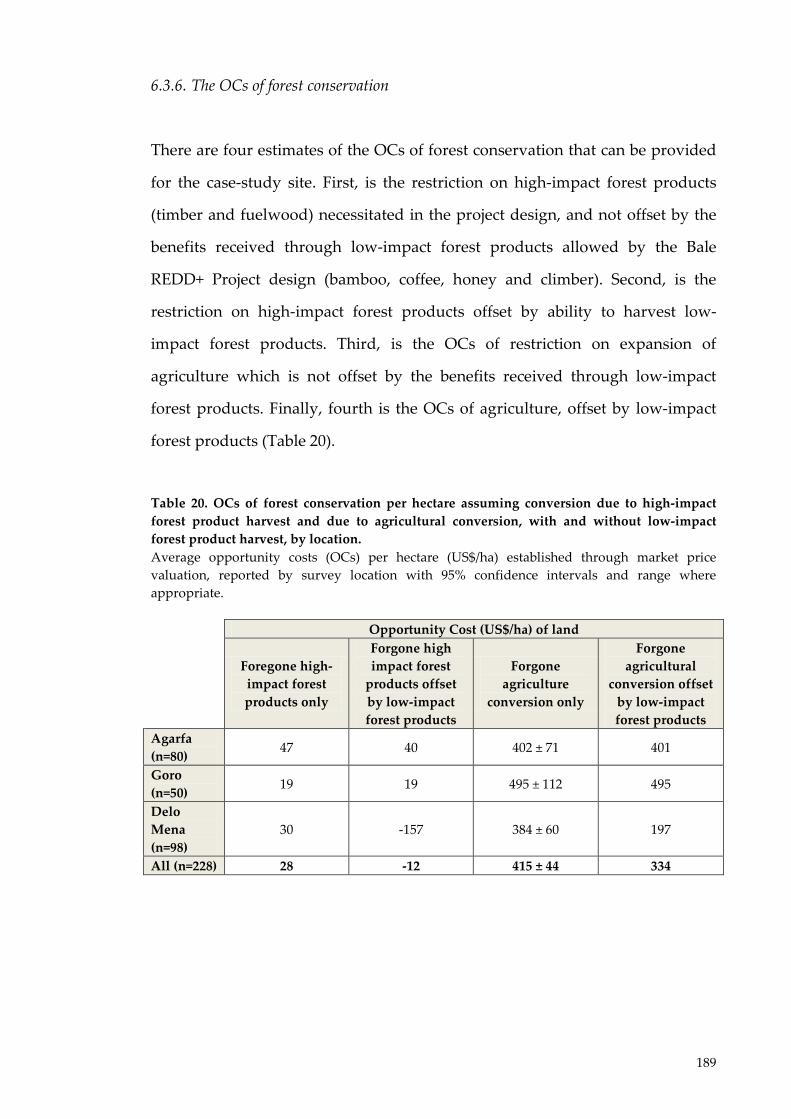
189
6.3.6. The OCs of forest conservation
There are four estimates of the OCs of forest conservation that can be provided
for the case-study site. First, is the restriction on high-impact forest products
(timber and fuelwood) necessitated in the project design, and not offset by the
benefits received through low-impact forest products allowed by the Bale
REDD+ Project design (bamboo, coffee, honey and climber). Second, is the
restriction on high-impact forest products offset by ability to harvest low-
impact forest products. Third, is the OCs of restriction on expansion of
agriculture which is not offset by the benefits received through low-impact
forest products. Finally, fourth is the OCs of agriculture, offset by low-impact
forest products (Table 20).
Table 20. OCs of forest conservation per hectare assuming conversion due to high-impact forest product harvest and due to agricultural conversion, with and without low-impact forest product harvest, by location. Average opportunity costs (OCs) per hectare (US$/ha) established through market price valuation, reported by survey location with 95% confidence intervals and range where appropriate.
Opportunity Cost (US$/ha) of land
Foregone high-impact forest products only
Forgone high impact forest
products offset by low-impact forest products
Forgone agriculture
conversion only
Forgone agricultural
conversion offset by low-impact forest products
Agarfa (n=80) 47 40 402 ± 71 401
Goro (n=50) 19 19 495 ± 112 495
Delo Mena (n=98)
30 -157 384 ± 60 197
All (n=228) 28 -12 415 ± 44 334
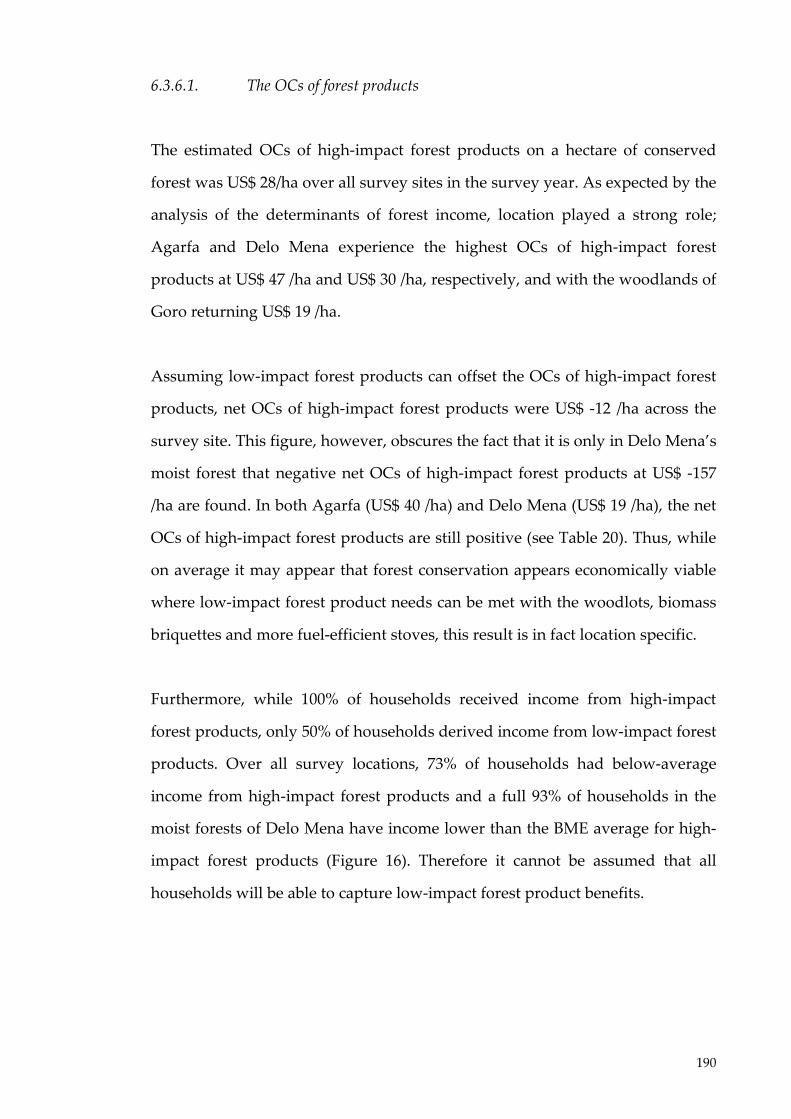
190
6.3.6.1. The OCs of forest products
The estimated OCs of high-impact forest products on a hectare of conserved
forest was US$ 28/ha over all survey sites in the survey year. As expected by the
analysis of the determinants of forest income, location played a strong role;
Agarfa and Delo Mena experience the highest OCs of high-impact forest
products at US$ 47 /ha and US$ 30 /ha, respectively, and with the woodlands of
Goro returning US$ 19 /ha.
Assuming low-impact forest products can offset the OCs of high-impact forest
products, net OCs of high-impact forest products were US$ -12 /ha across the
survey site. This figure, however, obscures the fact that it is only in Delo Mena’s
moist forest that negative net OCs of high-impact forest products at US$ -157
/ha are found. In both Agarfa (US$ 40 /ha) and Delo Mena (US$ 19 /ha), the net
OCs of high-impact forest products are still positive (see Table 20). Thus, while
on average it may appear that forest conservation appears economically viable
where low-impact forest product needs can be met with the woodlots, biomass
briquettes and more fuel-efficient stoves, this result is in fact location specific.
Furthermore, while 100% of households received income from high-impact
forest products, only 50% of households derived income from low-impact forest
products. Over all survey locations, 73% of households had below-average
income from high-impact forest products and a full 93% of households in the
moist forests of Delo Mena have income lower than the BME average for high-
impact forest products (Figure 16). Therefore it cannot be assumed that all
households will be able to capture low-impact forest product benefits.

191
Figure 16. The distribution of household income from low-impact forest production by survey location. Estimates of the household income from high-impact forest product harvesting (fuelwood and timber), in a single year as established using market price valuation and household survey (US$). The solid line represents the mean household income from high-impact forest products across all survey locations. The dotted line represents the survey location mean of high-impact forest product income.
6.3.6.2. The OCs of agriculture
A household’s foregone income from a hectare of forest land conserved was
first calculated as the yield per hectare of cultivated land. Three households
with no land or no income from their land due to crop failure were dropped.
Four additional households were dropped as agricultural income was
generated from shared land holdings and thus per hectare production could not
192
be established. Of the remaining 228 household surveys, the mean OCs of
foregone agriculture were estimated at US$417 ± 43 /ha with no significant
differences between survey locations (Table 20; Kruskall-Wallis tests: crop total
US$/ha, K=2.791, df=2, p=0.2477).
Where low-impact forest products can offset these OCs of agricultural land, the
net OCs of forgone agricultural production is estimated at US$ 375 /ha. As
would be expected given the heterogeneity in income from these products,
there is substantial variation in net OCs of agriculture across survey sites. A
hectare of forest in Delo Mena has estimated net OCs of agriculture of US$ 197
/ha, whereas both Agarfa and Goro are higher at US$ 395 and US$ 495
respectively (Table 20).
Substantial variation in households’ OCs of agriculture were found; ranging
from US$ -77 to US$ +1,785. Subtracting the fixed OCs of low-impact forest
products appropriate for each survey site, 29 households experienced net OCs
of agriculture that were negative; again implying that forest conservation is
economically attractive. However, all but one of these households was located
in the moist forest of Delo Mena where coffee is a substantial income source.
The remaining household was found in Agarfa, with negative OCs of
agriculture resulting from the households’ expenditure on crop production
exceeding the market value of the yield in the survey year.
Looking at the distribution of the OCs of agriculture, 68% of households have
crop income per hectare below the mean over all survey locations. Similarly,
67% of households had net OCs of agriculture below the mean over all survey
locations (note that this is using a fixed OC of low-impact forest products for
each survey location not for each household). By survey location, only 18% of
households in the moist forests of Delo Mena have net OCs of agriculture
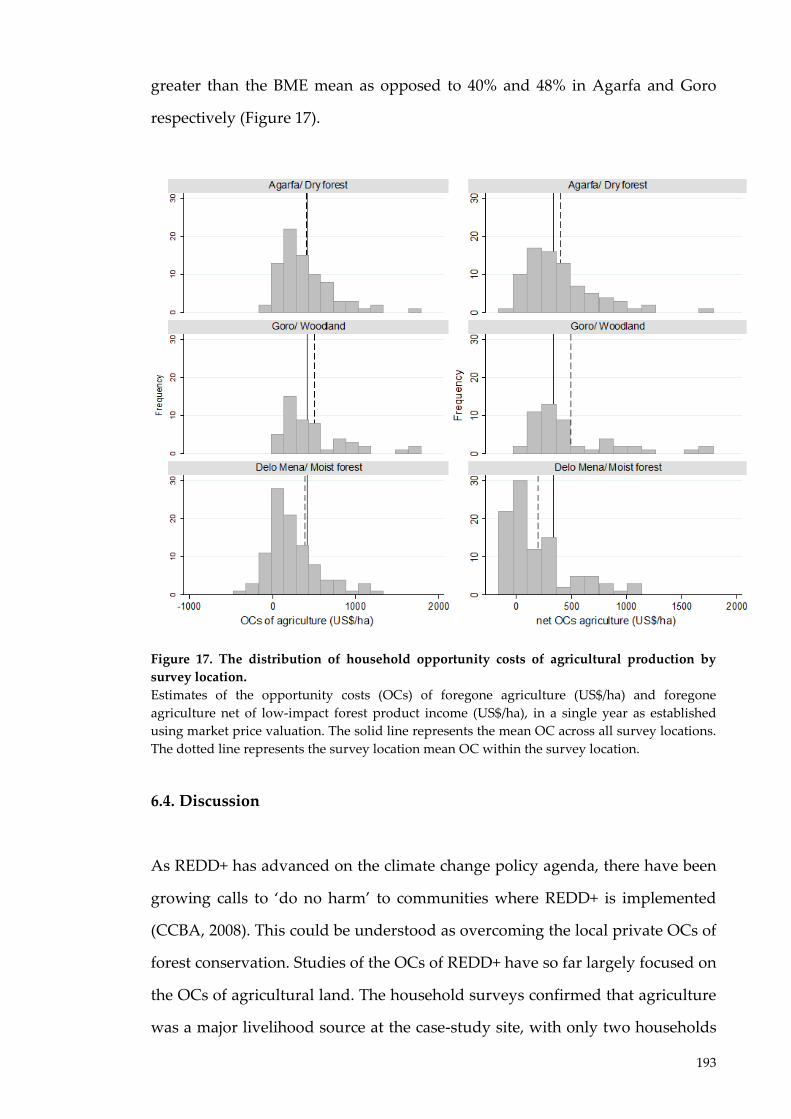
193
greater than the BME mean as opposed to 40% and 48% in Agarfa and Goro
respectively (Figure 17).
Figure 17. The distribution of household opportunity costs of agricultural production by survey location. Estimates of the opportunity costs (OCs) of foregone agriculture (US$/ha) and foregone agriculture net of low-impact forest product income (US$/ha), in a single year as established using market price valuation. The solid line represents the mean OC across all survey locations. The dotted line represents the survey location mean OC within the survey location.
6.4. Discussion
As REDD+ has advanced on the climate change policy agenda, there have been
growing calls to ‘do no harm’ to communities where REDD+ is implemented
(CCBA, 2008). This could be understood as overcoming the local private OCs of
forest conservation. Studies of the OCs of REDD+ have so far largely focused on
the OCs of agricultural land. The household surveys confirmed that agriculture
was a major livelihood source at the case-study site, with only two households

194
not cultivating land in the survey year. The income that the average household
derived from agriculture was US$907 ± 98. Under the proposed Bale REDD+
Project intervention, some household’s will forego future expansion of their
agricultural land. The average OCs of agricultural land are US$ 415/ha, but it is
possible that these OCs can be reduced by income from low-impact forest
products on the hectare of forest conserved. In locations where low-impact
forest products can be harvested the net OCs become US$334/ha.
When considering the OCs of forest conservation, however, other drivers of
forest decline should be considered, including use for energy needs (Karky and
Skutsch, 2010, Fisher et al., 2011). Household surveys in the BME show that
100% of households derived income from the forest in the survey year and
evidence shows this use is not sustainable and thus leading to deforestation
(BERSMP, 2006). Forest use at the case study site also appears to be business-as-
usual and not only a safety net in times of shocks or as a seasonal or cash flow
gap filler, as hypothesised across Eastern and Southern Africa by Arnold and
Townson (1998). High-impact forest products of fuelwood and timber appear
products required for subsistence use with the majority of these products
consumed within the home, in contrast to low-impact forest products - forest
coffee, forest honey, and bamboo – which are largely exchanged on markets.
The total income from forest products for an average household, with 6.5
members, was US$1,344. The stylised analysis of the proposed Bale REDD+
Project, via CFM, further divides forest products into low-impact and high-
impact categories, which broadly translate into those allowed and those not
allowed at the case study site. This reveals substantial heterogeneity in forest
income between villages, however, probably driven by the location specific
availability of forest products. In Agarfa and Goro, high-impact forest products
of timber and fuelwood contributed more to household forest incomes than
low-impact forest products of bamboo, climber, coffee and honey, whereas in
195
Delo Mena the converse was true. This finding is largely driven by the
possibility of coffee cultivation. Coffee comprises 60% of the foreign currency
earnings for Ethiopia and 10% of GDP, with production predominantly based
on smallholders (Teketay et al., 2010). The coffee ceremony is also part of
Ethiopia’s culture, thus coffee is consumed at home as well as sold. Of the
household survey sites, forest coffee can only be grown in the moist forest of
Delo Mena and this is reflected in forest incomes on average four times higher
than in the woodlands of Goro and just less than twice as much as that in the
dry forest of Agarfa. Forest honey is also dominantly available in the moist
forest. Bamboo, in contrast, is only collected in Agarfa where more commercial
timber species also grow; reflected in higher income from timber than in both
other survey locations.
The average OCs of high-impact forest products were estimated at US$28 /ha at
the case study site. Although much lower than agricultural OCs, the value does
not reflect that these products are necessary for livelihoods. Households are
reliant on the forest for energy needs - 99% of households gather fuelwood from
the forest – and in light of rapid population growth at 2.6%, it is clear that forest
conservation efforts in the BME will need to address the energy needs of
households if deforestation is to be reduced and not relocated. The Bale REDD+
Project implementers do have plans for woodlot establishment, promotion of
fuel efficient stoves and biomass briquettes, all of which either divert pressure
or reduce biomass needs for energy. However, these will take time to
implement and the OCs of being unable to collect high-impact forest products,
although perhaps temporary, will be experienced by households as a result of
the intervention.
It is also found that younger household heads derive more income from high-
impact forest products. This suggests that this socio-demographic group may
incur higher OCs of high-impact forest products than others under the

196
proposed Bale REDD+ Project intervention. Further anecdotal evidence
suggests that younger households also have lower access to cropland.
Supplementary mechanisms may be required to be implemented to ensure that
welfare losses are not experienced by younger household heads as a result of
the intervention. This might include the preferential access for the young to
woodlots, or access to livelihood diversification schemes and training. Where
REDD+ is implemented through CFM, the by-laws can also accommodate socio-
demographic differences; younger households might be offered greater rights
to the sustainable harvest of high-impact products than other members of the
group, for example. Such differential treatment due to circumstance has been
seen under traditional forest management systems in the BME in the past;
community members have prepared and erected bee-hives, for example, for
those that have experienced sickness or death in the family (Wakijira et al., in
press).
The OC estimates imply that households could derive more income from low-
impact forest use compared with the harvest of that hectare for high-impact
forest products, providing fuelwood demand can be met elsewhere. As noted
above, however, this ‘average’ household obscures the location-specific
differences in forest coffee availability. This suggests that village level
differentiation in the amount paid could greatly improve the efficiency of any
payments. These findings reinforce other studies in the PES literature that have
found that location specific payment differentiation is more efficient than broad
scale fixed payments (e.g. Wünscher et al., 2008). The existence of negative OCs
might also allow for redistribution of REDD+ revenues to help overcome
strongly positive OCs in other areas of the BME, or help to fund the
supplementary mechanisms noted above for particular socio-demographic
groups, such as the young.
197
At locations where low-impact forest products do generate income these
activities can be encouraged under the Bale REDD+ Project intervention that
gives the local communities more secure use rights. The Bale REDD+ Project
implementers might achieve this through outreach and educational
programmes, as education was found to increase the likelihood of household
income from low-impact forest product income in the BME. Such an impact of
education was also found by Adhikari et al. (2004). These results suggest that
knowledge increases the ability of a household to extract forest products more
sustainably and/or encourages pro-conservation behaviours. Such learning may
also occur through institutions established through the CFM groups as
evidenced by a long history of traditional forest management in the region in
the 19th Century (see Chapter 3).
While according to these results, households with availability to forest coffee
should have economic incentives to conserve the forest, it is also necessary to
reflect on the present barriers to realising such behaviour; the lack of use rights
that diminish incentive to protect valuable resources. While the additionality of
emission reductions generated by these households might be challenged on
financial grounds, there are clear policy barriers to generating emission
reductions that could justify their additionality. This poses another interesting
question for payments, as households with negative net OCs of biomass
reducing forest products may not require a payment to economically incentivise
forest conservation if these barriers can be removed and fuelwood and timber
demands met elsewhere. This could facilitate the creation of a fund from the
REDD+ revenues that will support activities across the BME, or could be used
to cover running costs of the Bale REDD+ Project.
The estimate of the OCs of forest conservation relies on a number of
assumptions that further research could relax. The study stylises land uses and
makes assumptions concerning the restrictions that households will incur under
198
the proposed intervention in the BME. More detailed stratification of land uses
into, for example, types of agriculture and local soil conditions could also
improve the OCs estimate. It is also recognised that the estimate of the OCs of
land could be an overestimate as local level-market prices are applied to
products consumed at home as well as those exchanged on the market place.
This was necessary as I was unable to establish a household’s shadow price for
each product. Furthermore, no inputs were costed for forest products as they
are assumed to be predominantly labour and not equipment. This is, therefore,
an upper bound estimate of the OCs of forest conservation. As implementation
progresses and the by-laws governing forest use are developed, it will be
possible to undertake a more detailed analysis of the income that will be
foregone by a household; for example, it is possible that some high-impact
activities will be allowed under the intervention, but within sustainable limits
such that the annual biomass increment is not exceeded by biomass removal.
In the BME, no models of land use change currently exist that can predict
whether a parcel of land will be deforested for agricultural production or as a
result of high-impact product harvesting such as fuelwood or timber. The
development of such models would aid attribution and establish whether the
true OCs of land are those of agriculture, high-impact forest products, or a
combination of both (e.g. Angelsen, 1999). Such information would be useful for
buyers of carbon emission reductions in establishing abatement costs, but also
in establishing the true total OCs of land that must be overcome.
Another major assumption is that low-impact forest products of bamboo,
climber, coffee and honey are here assumed compatible with the Bale REDD+
Project and so with forest conservation. No studies at the case study site assess
the degrading impact of coffee on the forest, but it is observed that thinning of
the forest canopy can occur during cultivation of forest coffee (Schmitt et al.,
2009). There may also be constraints on households expanding low-impact

199
forest product activities such as labour, upfront investments or the excludability
of products which may mean that income from this source may not be feasible
outside of the current production boundary. Most certainly there will be
biophysical limits too. Future research into the sustainability as well as the
potential for households to expand their low-impact forest product activities is
necessary. This can also be something addressed over time as the by-laws of the
CFM groups in the BME are flexible and will be revised as monitoring of forest
extent and quality occurs.
While it can be seen that this ex-ante exploration of the OCs of forest
conservation at the case study site can be used to guide design of any payments
for the Bale REDD+ Project, it is acknowledged that this does not provide an
estimate of the OCs that will be incurred by any one household in the BME
under the Bale REDD+ Project. Instead, the OCs established here are those for
any given hectare of land. This is because it is not possible to know which
household would have been the beneficiaries of the next hectare of agricultural
land or of the high-impact forest products harvested in the counterfactual to the
Bale REDD+ Project. Such problems of attribution of deforestation to
households or individuals is a recognised problem in the REDD+ literature
(Börner and Wunder, 2008). It would be economically unfeasible for all
households to be paid the maximum OCs of forest conservation. Even if it were
economically feasible, this would impact on the effectiveness and additionality
of emission reductions; there would be payments made without emissions
reductions generated which a buyer would be unlikely to accept. For the same
reason, the conditionality of the payment would therefore be eroded and
efficiency would be reduced such that REDD+ may no longer be a cost-effective
climate change mitigation measure.
One option that could be explored in REDD+ via CFM is whether the local level
institutions that are established will be able to attribute the costs and benefits of

200
forest conservation appropriately to households within their group. Local forest
users should have comparative advantage over government agents for
monitoring, particularly where group size is small; CBO size in the BME may
well be limited to 30 households with defined forest areas (Meinzen-Dick et al.,
2002). At CBO level, self-monitoring and social and cultural incentives and
sanctions may also improve forest management success (Ostrom, 2000).
Implementer oversight will be necessary, however, to avoid possible social
risks. This might include; the capture of benefits by elites, loss of access to land,
lack of voice, exacerbation of existing income and political power disparities
and inequitable benefit sharing (Landell-Mills and Porras, 2002, Smith and
Scherr, 2003, Griffiths, 2009, Skutsch and McCall, 2010). While CFM is proposed
to deliver more equitable benefit sharing (Agrawal and Angelsen, 2009),
experience holds mixed evidence on whether this is the case (Agrawal, 2001,
Campbell et al., 2001, Dayton-Johnson and Bardhan, 2002).
In light of the assumptions made, it is acknowledged that this is a first estimate
of OCs of REDD+ via CFM. But, with these limitations in mind, it was explored
how these OC estimates can feed into design of a local-level PES scheme such as
REDD+ via CFM. While previous suggestions for the implementation of REDD+
via CFM incentives have tended towards more input based, indirect or uniform
payments, REDD+ via CFM could still operate as a local-level PES mechanism
with improved attribution of OCs achieved through mechanisms that build on
the institutions of the CFM groups. They may well be designed by the forest
community based organisations themselves. Location-specific payments could
be made to the CBO groups who are then responsible for establishing who bore
the OCs of forest conservation and therefore differentiating payment levels
between members. In this way, REDD+ via CFM could still be efficiently
implemented with the conditionality and the efficiency that PES was initially
proposed to deliver (Simpson and Sedjo, 1996, Ferraro and Simpson, 2002,
Ferraro and Kiss, 2002).

201
Chapter 7: Scenarios of household opportunity costs of forest
conservation over time
7.1. Introduction
7.1.1. Problem statement
Conservation interventions have historically been driven by the estimated
benefits to preserving species, species populations and ecosystems. Biological
hotspots, for example, are chosen for their concentrations of endemic species
and severity of habitat loss (see Myers et al., 2000). Protected areas are
commonly based on their representation of biodiversity and ability to ensure its
persistence (Margules and Pressey, 2000). In contrast, the use of economic costs
in conservation planning is still nascent (Babcock et al., 1997, Moore et al., 2004,
Brooks et al., 2006, Wilson et al., 2006). This is in spite of an increasing body of
evidence that shows how incorporating cost information in conservation
planning leads to more effective interventions (Polasky et al., 2001, Polasky et
al., 2005, Naidoo et al., 2006, Naidoo and Iwamura, 2007, Carwardine et al.,
2008).
Cost information can allow the targeting of conservation interventions (Babcock
et al., 1997, Adams et al., 2010). This can achieve greater biodiversity
representation under fixed or limited conservation budgets (Ando et al., 1998).
Even where simple correlative relationships between costs and biological
variables do not exist, the incorporation of costs emphasises the trade-offs
inherent in conservation planning (Balmford et al., 2000, Williams et al., 2003).
The private opportunity costs (OCs) of forest conservation, in particular,
provide information on both the drivers of resource use as well as the
incentives that must be overcome by conservation interventions (Polasky et al.,
2005). The foregone benefits of an alternative investment, activity or use of a
202
resource, private OCs are limited to those people directly affected by foregone
benefits (Pirard, 2008). Information on the private OCs of land set aside for
forest conservation (referred to here as the OCs of forest conservation) aids
intervention design where drivers are understood and incentives for pro-
conservation activities are created. This is more likely to garner the support of
local communities; necessary for intervention success (Brandon and Wells,
1992). Quantitatively assessing OCs to use in intervention design can bring
greater acceptance, longevity and impact of interventions (Chomitz et al., 2005,
Adams et al., 2010).
Conservation interventions largely result from concerns about the ecological
and social sustainability of a resource system now and into the future. If private
costs of conservation cannot be overcome through time, support for the
intervention and success in meeting sustainability objectives may decline. The
future OCs of land for forest conservation will be impacted by changing income
from direct human activities such as agricultural and forest product extraction,
and affected by infrastructure development. OCs will also be impacted by the
underlying drivers of deforestation, including; demographic, economic,
technological, policy and institutional, and cultural causes (Geist and Lambin,
2002).
Of the few studies that consider the OCs of land for conservation, most report
OCs for a single year or assume OCs are constant over time subject only to
discounting (Chomitz et al., 2005, Naidoo and Adamowicz, 2006, Börner et al.,
2009). An exception is Ferraro (2002) who explores ex-ante the OCs over time
imposed by the establishment of a national park in Madagascar. Without
establishment of the park, the flow of benefits was first predicted to increase as
locals extracted resources. As resources became degraded, however, the
benefits would then decline. If the national park was established, the benefits of
exploitation were assumed zero and, in the zone surrounding the national park,
203
benefit flows would decrease more rapidly by virtue of a more limited area of
access. Over a 60 year time horizon, the average present value of costs per
household ranged from US$353 to US$1316. This demonstrates that where
resource use is currently unsustainable and complete exhaustion of the resource
base is a possibility, assumptions of constant OCs are unlikely to hold (Pearce
and Markandya, 1987).
Understanding and altering economic incentives while meeting rural livelihood
demands have increasingly become part of conservation interventions (Arnold,
2001). Forest conservation interventions have attempted to internalise positive
environmental externalities that, through market and policy failures, have
undervalued or excluded forest products and services from the income received
by stakeholders (Richards, 1999). Altering economic incentives has included
attempts to commercialise and increase the prices of forest products, to increase
the economic value of standing forest, to diversify livelihoods to reduce
pressure on forest resource systems, and to increase incomes (Brandon and
Wells, 1992). Through a PES approach, stakeholders are provided with
economic incentives that make conservation economically viable (Engel et al.,
2008, Pagiola and Platais, 2007).
Of the market mechanisms that could be used in conservation, carbon trading is
thought to have the greatest potential to capture positive externalities to the
degree required to make forest conservation economically viable (Richards,
1999). This is particularly the case as carbon is often found to be the largest of
the non-marketed environmental service values of forests (Pearce, 1997), which
include other direct, indirect and non-use values (see Pearce and Warford,
1993). Finance through a REDD+ mechanism therefore has the potential to bring
greater and more sustainable finance streams to conserve the environmental
services of forest than currently exist (Landell-Mills and Porras, 2002, Pagiola et
al., 2005a). The success of a REDD+ forest conservation intervention, however,
204
will rely on REDD+ revenues being able to overcome the OCs of forest
conservation over time.
The OCs of forest conservation over time will depend on the targets set by the
Bale REDD+ Project implementers as well as their success in meeting these
objectives. There are, however, a lack of explicit goals and quantitative
operational targets in conservation (Margules and Pressey, 2000). According to
Regan et al.’s (2002) classification of uncertainty in conservation biology, this
can be considered a form of linguistic uncertainty, as opposed to more
commonly researched epistemic uncertainties in determinate facts. This
linguistic uncertainty arises from the underspecificity, or generality, of
statements - such as conservation objectives - and/or from insufficient
consideration of project goals on the part of implementers. Both increase the
difficulty of understanding the dynamic nature of OCs. It is therefore hard to
predict how the drivers of land-use change will evolve over time. More
epistemic uncertainty is introduced where, lacking information, best-guesses
and subjective judgement are used to select parameters in OCs modelling
(Regan et al., 2002).
Scenarios can be used to model the dynamic nature of OCs that incorporates the
lack of information on on-going drivers of change and underspecificity
uncertainty in conservation objectives. Scenario modelling creates a set of
plausible narratives depicting alternative pathways to the future (Bohensky et
al., 2006). Stimulating thinking and allowing for the evaluation of future
eventualities by describing potential future states, scenario modelling is useful
to synthesise and communicate information to stakeholders and the public
(Alcamo, 2001). Scenarios have recently been applied in broad-scale analyses
such as the UK National Ecosystem Assessment, a nationwide exploration of
how ecosystems and their services will change in the future and the associated
impacts on human well-being (Haines-Young et al., 2010). Swetnam et al.(2011)
205
used participatory scenario building to consider carbon storage in the Eastern
Arc Mountains of Tanzania in 2025 under an optimistic and pessimistic
scenario. Presenting the findings on spatial land use maps visualised potential
changes for decision makers, illustrating a 41% loss in carbon storage under
business as usual compared to only a 3.8% loss under a more sustainable
scenario considering change in energy, formal economy, agriculture, forestry
and population.
The application of scenarios has been more limited in bottom-up conservation
planning. Wollenberg et al. (2000), an exception, discuss how scenarios can
encourage learning and adaptive co-management of community forests in
Indonesia and Madagascar. Their study was not quantitative in nature, but the
authors find that scenarios can help stakeholders to anticipate and adapt to
large-scale forces of land-use change. If private costs of conservation cannot be
overcome through time, support for the intervention and success in meeting
sustainability objectives may decline. Scenario modelling of OCs can lead to
more resilient conservation policies where they help stakeholders to cope with
the dynamic nature of OCs and linguistic uncertainty (Peterson et al., 2003).
7.1.2. Aims and objectives
In this Chapter I use scenarios to explore potential changes in the OCs of forest
conservation over time in the BME, Ethiopia. Scenarios take into account the
uncertainty introduced by underspecificity of conservation objectives and
paucity of data on how agricultural and forest productivity is changing. Three
scenarios are generated that explore how assumptions of improvements in
agricultural productivity, the proposed commercialisation of forest products,
and the sustainability of land use impact upon three OC measures; the annual
OCs, cumulative OCs and the total OCs of land under REDD+ via CFM in the
Bale REDD+ Project intervention, over a 20-year time horizon. The potential of

206
REDD+ revenues from the project to overcome the OCs of forest conservation is
then assessed. This study adds to a limited literature on the OCs of conservation
and the application of scenarios for conservation planning.
7.2. Methods
7.2.1. The opportunity costs of forest conservation over time
The OCs of forest conservation for the proposed REDD+ via CFM intervention
at the case study site were estimated in Chapter 6. Under the proposed Bale
REDD+ Project intervention, communities sign a forest management agreement
that prohibits high-impact forest product harvest (comprising fuelwood and
timber) and prohibits the expansion of agricultural land. Households will still
be able to harvest low-impact forest products (bamboo, climbers, coffee and
honey). The Bale REDD+ Project implementers plan to meet household
fuelwood and timber demands through woodlot establishment, fuel efficient
stove distribution and biomass briquette manufacture. It is unclear, however,
when fuelwood and biomass needs will be sufficiently met by these actions.
This Chapter, therefore, considers the OCs of forest conservation to be forgone
agricultural production, net of low-impact forest products that could be
harvested on the conserved forest area.
The mean household net OCs of agricultural production in the BME were found
to be US$334/ha in the survey year, with significant differences by forest type
(see Chapter 6). Scaling up across the three forest types gave area weighted OCs
of US$358ha. Using the weighted mean OC per hectare of forest conservation
over the BME, the annual OCs (US$/ha) were calculated as the difference
between the predicted crop (Crop) income and low-impact forest product
(Forest) income, subject to a discount rate δ at a given project year t where goes
from 0 to 19 (Equation 8). The cumulative OCs (US$/ha) for a hectare of land
taken out of production in project year t are calculated as the sum of the annual
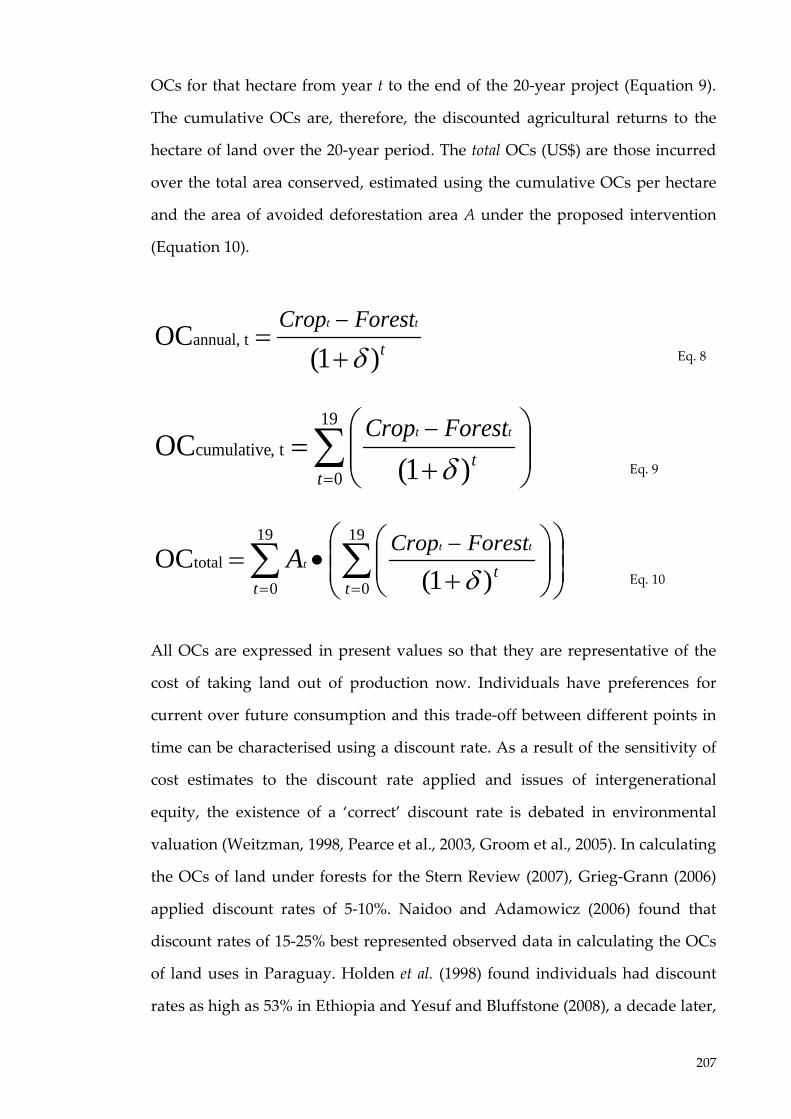
207
OCs for that hectare from year t to the end of the 20-year project (Equation 9).
The cumulative OCs are, therefore, the discounted agricultural returns to the
hectare of land over the 20-year period. The total OCs (US$) are those incurred
over the total area conserved, estimated using the cumulative OCs per hectare
and the area of avoided deforestation area A under the proposed intervention
(Equation 10).
t
tt ForestCrop
)1(OC tannual,
δ+=
− Eq. 8
∑=
+
=−19
0t,cumulative
)1(OC
tt
tt ForestCrop
δ Eq. 9
+
•= ∑∑==
−19
0
19
0total
)1(OC
tt
t
ttt
ForestCropAδ Eq. 10
All OCs are expressed in present values so that they are representative of the
cost of taking land out of production now. Individuals have preferences for
current over future consumption and this trade-off between different points in
time can be characterised using a discount rate. As a result of the sensitivity of
cost estimates to the discount rate applied and issues of intergenerational
equity, the existence of a ‘correct’ discount rate is debated in environmental
valuation (Weitzman, 1998, Pearce et al., 2003, Groom et al., 2005). In calculating
the OCs of land under forests for the Stern Review (2007), Grieg-Grann (2006)
applied discount rates of 5-10%. Naidoo and Adamowicz (2006) found that
discount rates of 15-25% best represented observed data in calculating the OCs
of land uses in Paraguay. Holden et al. (1998) found individuals had discount
rates as high as 53% in Ethiopia and Yesuf and Bluffstone (2008), a decade later,

208
found similarly high annual discount rates with a median of 43%. In
establishing OCs in this study, a discount rate of 10% is applied to optimistic
scenario A and Zero-OC scenario C, whereas a higher discount rate of 20% is
applied in Pessimistic scenario B. In all cases, non-declining discount rates are
used in the light of the short lifespan of the project (Hepburn and Koundouri,
2007).
The details of the assumptions made in order to estimate the OCs of forest
conservation at the case study site are addressed in-depth in Chapter 4. In order
to model these OCs over time, it was also assumed that all deforestation
resulted from agricultural production. This assumption was necessary as no
data on the conversion of land to agriculture versus that lost to high-impact
forest product harvesting was available. It is also assumed that deforested area
would generate the same income as existing cultivated land for a given
household and once it is converted, that land will remain under agricultural
production. It is acknowledged that not all land will be suitable for agriculture
and land that is not currently under production is more likely to be more
marginal. Similarly, it is assumed that all forest land will be suitable for low-
impact forest product harvest to the level that households derive at present. The
OCs may therefore be an overestimate. However, these scenarios represent a
best first approximation until further information becomes available.
The land area for which OCs are incurred was based on stated project goals for
deforestation to be avoided. This equates to a reduction in the existing rate of
4% deforestation annually to 3% in years 1-5, to 2% in years 6-10 and to 1%
deforestation in years 11 to 20. While it is recognised that the deforestation
counterfactual may increase over time in the absence of the intervention, the
forest lost through conversion from forest to agriculture in the absence of the
project was assumed to remain constant at 4%. This is a commonly made

209
assumption in light of the complications of establishing deforestation baselines
(see Parker et al., 2008, Böttcher et al., 2009).
The impacts of a growing rural population on the OCs of forest conservation
are not considered in these scenarios. The population of Ethiopia is growing at
2.6% annually and is approaching 74 million according to the latest census
(CSA, 2008). In Oromia, where the BME is located, this rate of growth is higher
at 2.9%; joint third of 11 regions in the country (CSA, 2008). The effect that
population growth will have on the demand for agricultural land is assumed to
be met by the deforestation that occurs even under the CFM intervention;
deforestation is not assumed to be completely halted. Insufficient data are
available to include the potential effect of the intervention on land-market
dynamics, for example on commodity prices due to changing availability of
land area (see Armsworth et al., 2006, Busch et al., 2009). The price elasticity of
demand is, therefore, assumed to be perfectly inelastic or zero; there are
negligible price feedback mechanisms from forest policy changes.
7.2.2. Scenario calibration
Scenario analysis can include indirect socio-political, economic, science and
technological, cultural and religious, and demographic drivers (Haines-Young
et al., 2010). This study focuses on the direct economic drivers of resource
consumption, with simple but credible changes in income from land uses
modelled under the proposed Bale REDD+ Project intervention. Three scenarios
were generated. Two were explorative, or probable scenarios utilising
subjective judgements about the drivers of land-use change to illustrate what
may happen under the Bale REDD+ Project intervention. The third scenario is
normative and back-casts from a goal of zero total OCs of forest conservation. In
all three scenarios productivity is considered for only two land uses in the BME;
agriculture and low-impact forest products. All scenarios take into account the
210
possibility of productivity decline due to degradation on these land uses as well
as future plans for productivity, in order to analyse the net change over time:
1. ‘Optimistic’ scenario A presents a storyline which assumes that existing
production can continue into the future and is ecologically sustainable as
well as sustaining income and material flows (Arnold, 2001). Scenario A is
also optimistic that increases in productivity can be achieved through
agricultural intensification and low-impact forest product market
development and there is, therefore, growth in income and material flows.
2. ‘Pessimistic’ scenario B presents assumes that resource use fails to become
sustainable and continues in accordance with past trends, with efforts at
agricultural intensification and forest product market development
unsuccessful.
3. ‘Zero OC’ scenario C seeks to achieve an economically viable forest situation.
It assumes that while agricultural practices might be unsustainable and
intensification of agriculture beyond the control and remit of the CFM
intervention, forest management does become sustainable under CFM and
efforts to add value to forest products, through price increases, are
successful. This success is to such a degree that the total OCs are zero; i.e.
the increasing income from forests per unit area is sufficient to completely
overcome the income of agricultural production on the same land area over
the 20-year period. Thus taking land out of agricultural production is an
economically viable option.
Following Alcamo’s (2001) criteria, the main elements of the scenarios are given
in Table 21; these are the major driving forces, a description of step-wise
changes, and a storyline. The base year is set at 2010, the year of the survey, and
the time horizon is 20 years. Scenarios are calibrated with data from peer
reviewed and grey literature, research institutions, government sources and
NGOs.

211
Table 21. Conservation scenario storylines. The major driving forces of land-use change, their direction and a description is provided for three plausible scenarios that might occur under implementation of the proposed participatory forest management (↑ indicates increasing, ↓ indicates decreasing, and → indicates no change).
Scenario A: Optimistic
Scenario B: Pessimistic
Scenario C: Zero OC
Driving force
Δ Storyline Δ Storyline Δ Storyline
Agr
icul
tura
l pro
duct
ivity
→
No land degradation occurs over the 20-year period.
↓
Land degradation causes 2.2% decline of agricultural productivity per year.
↓
Land degradation causes 2.2% decline of agricultural productivity per year.
↑
Agricultural intensification is achieved at a rate of 2.1% yield increase per year due to intervention and countrywide policy.
→
Despite intensification efforts, productivity is not increased due to the intervention or countrywide policy.
→
Despite intensification efforts, productivity is not increased due to the intervention or countrywide policy.
Fore
st p
rodu
ctiv
ity
→
No forest degradation occurs over the 20-year period.
↓
Forest degradation leads to productivity declines in low-impact forest products at a rate equivalent to area lost; 3% in years 1-5, 2% in years 6 to 10 and 1% in years 11-20.
→ No forest degradation occurs over the 20-year period.
↑
Forest income increases due to the development of low-impact forest products at 5% per year.
→
Despite efforts, low-impact forest product development has no impact on household income.
↑?
Forest income increase s through low-impact forest product development so as to add sufficient income such that the total OCs of forest conservation are zero.
Dis
coun
t Rat
e
-
A fixed ‘low’ discount rate of 10% is applied following Busch et al. (2009) and Grieg-Grann (2006,2008).
-
A fixed ‘high’ discount rate of 20% is applied following Naidoo and Adamowicz (2006).
-
A fixed ‘low’ discount rate of 10% is applied following Busch et al. (2009) and Grieg-Grann (2006,2008).

212
7.2.2.1. Agricultural productivity
Deforestation has impacts on watersheds, affecting the quantity, quality and
regularity of the flow of water. While the relationship between forest cover and
watershed forest cover is uncertain (see Calder et al., 2004, Bruijnzeel, 2004), it is
commonly accepted that soil erosion will increase as a result of forest cover loss.
The impacts of deforestation on watershed and soil quality manifest themselves
as changes in agricultural productivity. An estimate of soil erosion-induced
productivity decline in Ethiopia established by Shiferaw and Holden (2000) of
2.2% a year was used in scenarios B and C.
Agricultural intensification is not out of reach in Ethiopia. Byerlee et al. (2007)
note that success will require progress in strengthening smallholder access to
inputs, technology, information as well as incentivising their use and adoption.
Diao and Pratt (2007) generated economy-wide simulations for Ethiopia based
on agricultural and non-agricultural growth trends for 1995 to 2002. They
suggest investments could raise staple yields by 3.4% annually, of which 1.3%
would result from the expansion of crop area and 2.1% from growth in yields.
Scenario A follows this suggestion, using a 2.1% productivity increase to
simulate improvements in market infrastructure across the BME.
Scenarios B and C, however, take a more pessimistic view. This is in line with
the historical performance of agricultural intensification efforts in Ethiopia
where, despite ongoing public investment and the availability of technology for
agricultural intensification, higher or more sustainable cereal yields, reduced
food aid dependency, improved food security or lower prices for staples has
not been delivered (Byerlee et al., 2007, Spielman et al., 2010). While grain
production grew by 74% between 1989/90 and 2003/4, cultivated area increased
by 51% (Gebreselassie, 2006). Productivity gains can largely be attributed to the

213
expansion of agriculture rather than successful agricultural intensification (Diao
and Pratt, 2007, Byerlee et al., 2007).
7.2.2.2. Forest productivity
While in scenarios A and C it is assumed that forest use is sustainable as a result
of CFM implementation, scenario B challenges this assumption. No data are
available on the impact of forest degradation on household incomes from low-
impact forest products in the region and the best guess of lost profit as forests
decline is equivalent to the area lost under project goals; 3% in years 1-5, 2% in
years 6 to 10 and 1% in years 11-20 (UNIQUE, 2008). This is likely to be a
conservative estimate; biomass in moist degraded forest was found to be 31%
less than that in non-degraded moist forest which suggests that the availability
of forest products is more substantially reduced in degraded forests than
assumed in this simulation (Chapter 5).
Scenario B is similarly pessimistic about the development of markets for forest
products. In contrast, scenarios A and C allow for value to be added to forest
products. Evaluation of the indigenous plant material in the BME has identified
that organisational improvement and expansion of activities could result in
value addition at the local-level for wild coffee, bee products, and other
indigenous plant species (Wren, 2007). As such, a number of activities have
been undertaken to promote commercialisation of forest products including
Business Management Training for local actors and the construction of a
Collection and Processing Learning Centre with a bamboo workshop, honey
processing and packaging unit and retail shop. BERSMP have been actively
seeking business development partners and a Bale Wild brand has been
established.
214
The change in profitability of forest products as a result of CFM activities in the
BME is, however, difficult to predict. There are few empirical or quantitative
case studies of the outcomes of NTFP development on household incomes
(Sheil and Wunder, 2002, Gram, 2001, Neumann and Hirsch, 2000). The level of
benefits and sustainability of NTFP use are also site and species specific
(Wollenberg and Ingles, 1998). A similar CFM approach was followed in
another project in the south-west of Ethiopia. This Non-Timber Forest Product
Research and Development Project was successful in raising the price of a
kilogram of honey from 3-7 Ethiopian Birr (ETB) to 16-18 ETB, a 340% increase,
through organic certification (BERSMP, 2008). The Bale Forest Enterprise has
agreed to pay 25% above the local market price for quality coffee beans in the
BME and specialised coffee buyers have expressed interest in paying up to
US$10 per kg of forest coffee; considerably more than the US$2.20 per kg in
local markets (BERSMP, 2009).
Despite the uncertainty introduced by the qualitative project goals, which are
simply to add value to forest products in the BME, scenario A represents a best-
guess at productivity increases. The forest products included in the OCs
calculation are bamboo, climber, coffee and honey. As coffee and honey are not
ubiquitous across the forests of the BME and it is not clear that value added will
be obtained by all households, a conservative average estimate of a 5% price
increase is applied in scenario A across these forest products. Scenario C instead
assesses the level of value addition required to be added to forest products in
order to result in zero total OCs of forest conservation. Value addition raises the
price for products rather than yields and therefore would not increase pressure
on the forest resource base. Both scenarios assess net productivity gains, thus
these are gains after any additional costs of harvesting, processing, trading,
transporting and marketing products have been deducted.

215
7.2.3. Income from REDD+
Realising the value of previously non-marketed environmental services from
the forest can go some way to overcoming the OCs of forest conservation.
Carbon is considered the largest of the non-market values (Pearce, 1997) and is
included in this Chapter while other non-market values are not. These include
environmental values such as watershed protection, biodiversity protection and
landscape beauty (Pearce and Warford, 1993, Davies and Richards, 1999). The
omission of these values are common in studies of the OCs of conservation (e.g.
Naidoo and Adamowicz, 2006, Grieg-Gran, 2008), although it is acknowledged
that inclusion of other non-market values is likely to decrease the net OCs of
forest conservation (Nepstad et al., 2007, Bellassen and Gitz, 2008).
While CFM and REDD+ can both be undertaken as separate policy
interventions, in the BME these are therefore considered together: the Bale
REDD+ Project undertakes REDD+ via CFM. Thus emission reductions do not
have to be additional to that achieved through CFM, but rather are those
generated by CFM (see also Chapter 3 for a full description of the Bale REDD+
Project). Covering a total of 923,593 ha, the REDD+ project area consists of the
dry and moist tropical forest as well as the southern woodlands.
Documentation for the proposed Bale REDD+ Project states that emission
reductions will be generated only from change in the tropical dry (Agarfa) and
moist forest (Delo Mena) regions. Changes in the area of woodland (Goro) will
be set-aside to account for emissions that may be relocated rather than reduced;
termed ‘leakage’ (see Sohngen and Brown, 2004). Therefore, only emission
reductions in the 576,856 ha of dry and moist forest are assumed to generate
carbon revenues. In Chapter 5, it was determined that carbon stocks in these
dry and moist forests of the BME had an area-weighted average of 195tC/ha.
The proposed Bale REDD+ Project in the BME was found to be able to generate
180,271,808 tonnes of CO2 over the 20-year project period. In assessing whether
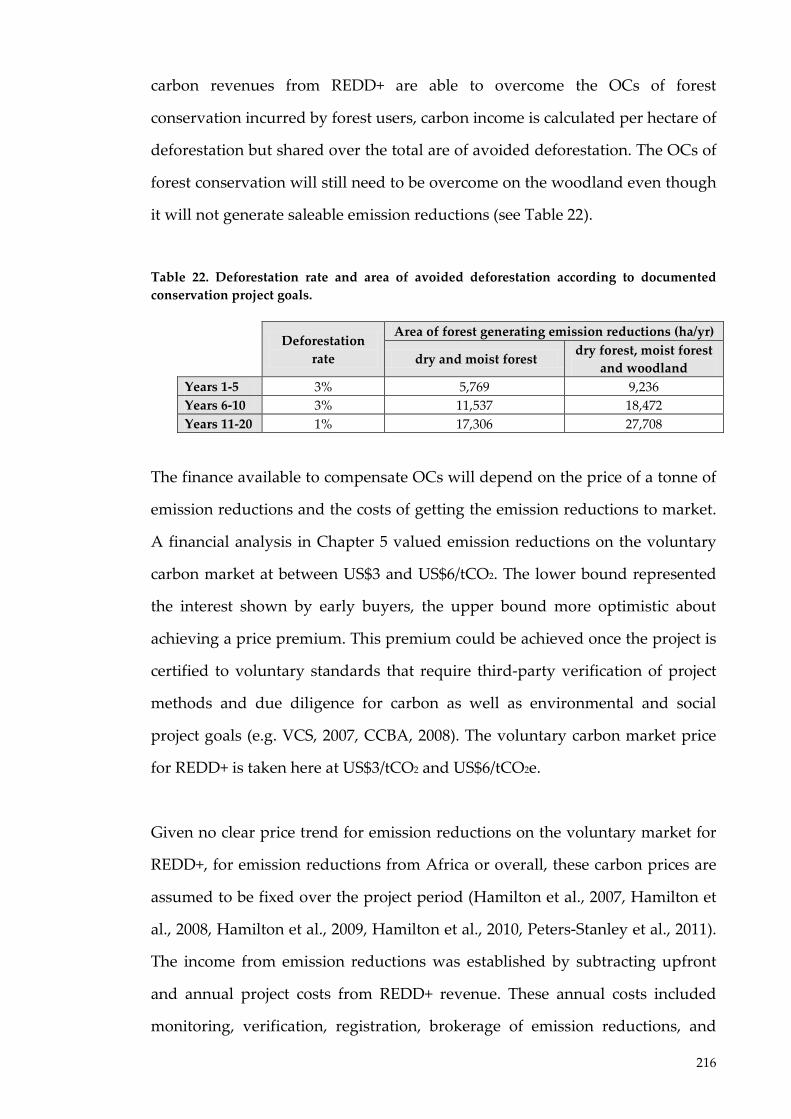
216
carbon revenues from REDD+ are able to overcome the OCs of forest
conservation incurred by forest users, carbon income is calculated per hectare of
deforestation but shared over the total are of avoided deforestation. The OCs of
forest conservation will still need to be overcome on the woodland even though
it will not generate saleable emission reductions (see Table 22).
Table 22. Deforestation rate and area of avoided deforestation according to documented conservation project goals.
Deforestation
rate
Area of forest generating emission reductions (ha/yr)
dry and moist forest dry forest, moist forest
and woodland Years 1-5 3% 5,769 9,236 Years 6-10 3% 11,537 18,472 Years 11-20 1% 17,306 27,708
The finance available to compensate OCs will depend on the price of a tonne of
emission reductions and the costs of getting the emission reductions to market.
A financial analysis in Chapter 5 valued emission reductions on the voluntary
carbon market at between US$3 and US$6/tCO2. The lower bound represented
the interest shown by early buyers, the upper bound more optimistic about
achieving a price premium. This premium could be achieved once the project is
certified to voluntary standards that require third-party verification of project
methods and due diligence for carbon as well as environmental and social
project goals (e.g. VCS, 2007, CCBA, 2008). The voluntary carbon market price
for REDD+ is taken here at US$3/tCO2 and US$6/tCO2e.
Given no clear price trend for emission reductions on the voluntary market for
REDD+, for emission reductions from Africa or overall, these carbon prices are
assumed to be fixed over the project period (Hamilton et al., 2007, Hamilton et
al., 2008, Hamilton et al., 2009, Hamilton et al., 2010, Peters-Stanley et al., 2011).
The income from emission reductions was established by subtracting upfront
and annual project costs from REDD+ revenue. These annual costs included
monitoring, verification, registration, brokerage of emission reductions, and
217
CFM operating costs. Possible leakage and non-permanence risks were
accounted for through a 65% buffer of emission reductions pre-sale (UNIQUE,
2008). Thus far, however, the incidence of these costs of the Bale REDD+ Project
is not clear. BERSMP has, for example, so far absorbed upfront project
development costs. Furthermore, with national REDD+ plans underway, risks
of leakage and non-permanence could be addressed at a national level.
Withholding a risk buffer of emission reductions may not therefore be
necessary (R-PP, 2011).
REDD+ profit is calculated net of the costs of implementation that are not likely
to be overcome through national mechanisms or via NGOs involved in the
project. These costs are outlined in Chapter 5 and include, here, project
implementation costs of CFM operation, brokerage, and monitoring, reporting
and verification of emission reductions. The resultant REDD+ revenue per
hectare, is compared with the cumulative OCs of a hectare of land. It is
assumed that carbon revenues will be received in the year in which the forest is
conserved, thus annually over the 20-year period.
7.3. Results
7.3.1. Estimates of the opportunity cost of forest conservation over time
In Optimistic scenario A, the income from both agricultural land and forest area
increases without land degradation. With incomes to cropland already greatly
exceeding income from low-impact forest products per hectare, the growth in
agricultural productivity offsets the added value to forest products, so that the
present value of annual OCs in scenario A remain positive at US$74/ha at the
end of the project period. Under this storyline, there remains an economic
incentive to convert forest to agricultural land throughout the lifespan of the
project.
218
In Pessimistic scenario B and Zero-OC scenario C, crop income declines due to
assumptions of unsustainable farming practices lowering yields combined with
failure to increase agricultural productivity. Under scenario B, the income from
forest products also declines as a result of overharvesting and the inability to
add value to forest products. Although the annual OCs in scenario B remain
positive over the 20-year lifespan, they decline to US$7/ha in project year 19
suggesting that incentives to deforest, although, positive, would be weaker than
under Scenario A.
Unlike scenario B, scenario C sees forest productivity per hectare rising over
lifespan of the intervention. The annual OC becomes negative at project year 13.
In this year, forest income is projected to be greater than agricultural income
per hectare due to the continued degradation of agricultural land reducing
yields, no agricultural intensification and successful development of markets
for forest products. At project year 19 the income from a hectare of forest is
US$99 more than the income for the equivalent area of agricultural land (Figure
18).
Looking at the cumulative OCs and total OCs of forest conservation in the three
scenarios clearly illustrates how small changes in the storyline substantially
change the outcome. The cumulative OCs per hectare, for a forest area taken
out of production in the first year of the intervention, are US$3,658/ha in
scenario A and US$1,889 in scenario B illustrating the large differences in the
incentives faced when agriculture is foregone for a 20-year period. This is not
just due to the difference in discount rate that is present between scenario A
and B. Comparing scenarios A and C with the same discount rate, the
cumulative OCs of land taken out of agricultural production in year one is the
same. However, in scenario C forest profits increase, despite agricultural land
degradation, to such an extent that cumulative OCs become negative at project
year 8. At this point, the discounted income from that hectare of land for the
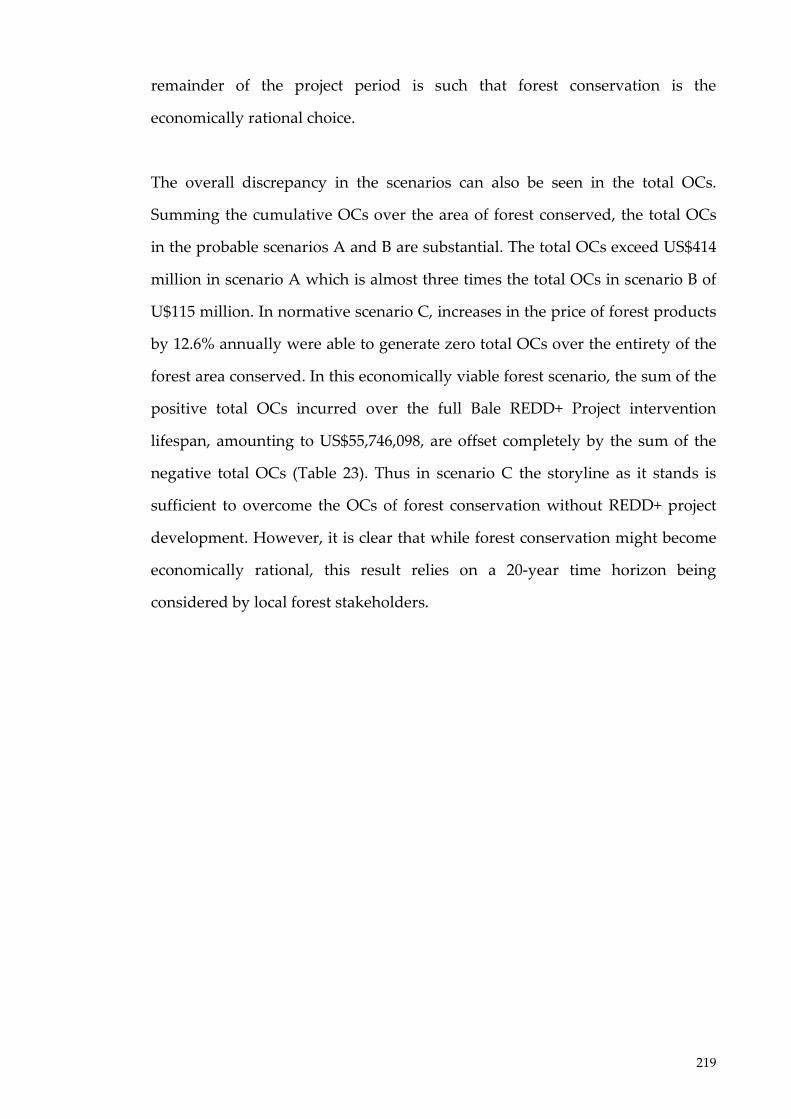
219
remainder of the project period is such that forest conservation is the
economically rational choice.
The overall discrepancy in the scenarios can also be seen in the total OCs.
Summing the cumulative OCs over the area of forest conserved, the total OCs
in the probable scenarios A and B are substantial. The total OCs exceed US$414
million in scenario A which is almost three times the total OCs in scenario B of
U$115 million. In normative scenario C, increases in the price of forest products
by 12.6% annually were able to generate zero total OCs over the entirety of the
forest area conserved. In this economically viable forest scenario, the sum of the
positive total OCs incurred over the full Bale REDD+ Project intervention
lifespan, amounting to US$55,746,098, are offset completely by the sum of the
negative total OCs (Table 23). Thus in scenario C the storyline as it stands is
sufficient to overcome the OCs of forest conservation without REDD+ project
development. However, it is clear that while forest conservation might become
economically rational, this result relies on a 20-year time horizon being
considered by local forest stakeholders.

220
Figure 18. Annual opportunity costs over time under three future scenarios. The annual opportunity costs (OCs)(US$/ha) are shown over the lifetime of the Bale REDD+ Project intervention for three future scenarios. Scenarios represent differing assumptions of sustainability of the resource base, efforts to intensify agricultural production and adding value to forest products.
-100
-50
0
50
100
150
200
250
300
350
400
0 1 2 3 4 5 6 7 8 9 10 11 12 13 14 15 16 17 18 19
Annu
al O
C U
S$/h
a
Year
Scenario A
Scenario B
Scenario C
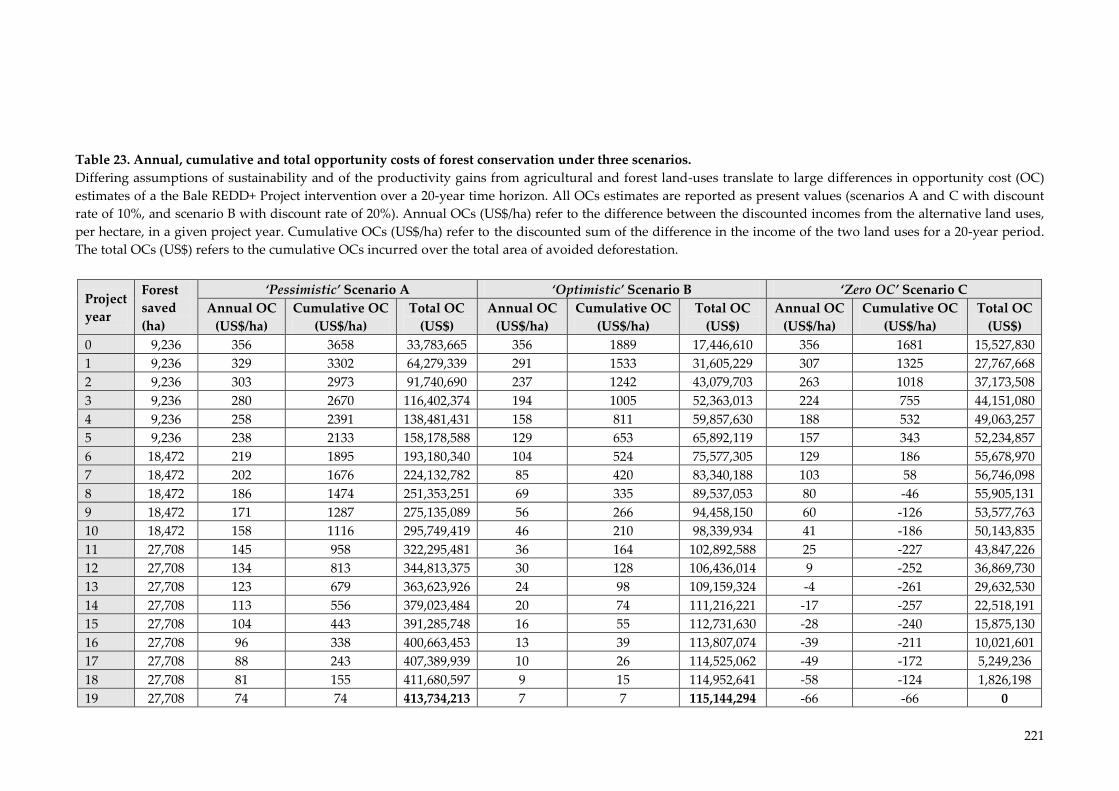
221
Table 23. Annual, cumulative and total opportunity costs of forest conservation under three scenarios. Differing assumptions of sustainability and of the productivity gains from agricultural and forest land-uses translate to large differences in opportunity cost (OC) estimates of a the Bale REDD+ Project intervention over a 20-year time horizon. All OCs estimates are reported as present values (scenarios A and C with discount rate of 10%, and scenario B with discount rate of 20%). Annual OCs (US$/ha) refer to the difference between the discounted incomes from the alternative land uses, per hectare, in a given project year. Cumulative OCs (US$/ha) refer to the discounted sum of the difference in the income of the two land uses for a 20-year period. The total OCs (US$) refers to the cumulative OCs incurred over the total area of avoided deforestation.
Project year
Forest saved (ha)
‘Pessimistic’ Scenario A ‘Optimistic’ Scenario B ‘Zero OC’ Scenario C Annual OC
(US$/ha) Cumulative OC
(US$/ha) Total OC
(US$) Annual OC
(US$/ha) Cumulative OC
(US$/ha) Total OC
(US$) Annual OC
(US$/ha) Cumulative OC
(US$/ha) Total OC
(US$) 0 9,236 356 3658 33,783,665 356 1889 17,446,610 356 1681 15,527,830 1 9,236 329 3302 64,279,339 291 1533 31,605,229 307 1325 27,767,668 2 9,236 303 2973 91,740,690 237 1242 43,079,703 263 1018 37,173,508 3 9,236 280 2670 116,402,374 194 1005 52,363,013 224 755 44,151,080 4 9,236 258 2391 138,481,431 158 811 59,857,630 188 532 49,063,257 5 9,236 238 2133 158,178,588 129 653 65,892,119 157 343 52,234,857 6 18,472 219 1895 193,180,340 104 524 75,577,305 129 186 55,678,970 7 18,472 202 1676 224,132,782 85 420 83,340,188 103 58 56,746,098 8 18,472 186 1474 251,353,251 69 335 89,537,053 80 -46 55,905,131 9 18,472 171 1287 275,135,089 56 266 94,458,150 60 -126 53,577,763 10 18,472 158 1116 295,749,419 46 210 98,339,934 41 -186 50,143,835 11 27,708 145 958 322,295,481 36 164 102,892,588 25 -227 43,847,226 12 27,708 134 813 344,813,375 30 128 106,436,014 9 -252 36,869,730 13 27,708 123 679 363,623,926 24 98 109,159,324 -4 -261 29,632,530 14 27,708 113 556 379,023,484 20 74 111,216,221 -17 -257 22,518,191 15 27,708 104 443 391,285,748 16 55 112,731,630 -28 -240 15,875,130 16 27,708 96 338 400,663,453 13 39 113,807,074 -39 -211 10,021,601 17 27,708 88 243 407,389,939 10 26 114,525,062 -49 -172 5,249,236 18 27,708 81 155 411,680,597 9 15 114,952,641 -58 -124 1,826,198 19 27,708 74 74 413,734,213 7 7 115,144,294 -66 -66 0

222
7.3.2. Carbon profit as a forest product
REDD+ project income per hectare is compared with the cumulative OCs of
forest conservation modelled under the three scenarios. Applying the lower
bound market price of emission reductions of US$3/tCO2e, net of the costs of
REDD+ implementation, REDD+ revenues added between US$1,192/ha to
US$39/ha to forest income depending on the year that the forest was conserved.
In contrast, applying a market price of US$6/tCO2e that could be realised if
third-party project standards are met, REDD+ revenues added between
US$2,499/ha to US$80/ha (Table 24).
In scenario A, at conservative carbon prices, REDD+ revenues were insufficient
to overcome the cumulative OCs of forest conservation until the final three
years of the project, with the discrepancy ranging from US$2,466 in year one to
US$69/ha in year 17 of the project. In scenario B, REDD+ revenues are initially
unable to overcome the cumulative OCs, but at project year 11 the difference is
only US$2/ha and by year 19 REDD+ revenues are able to overcome the
cumulative OCs by US$32/ha. Scenario C shows the same pattern as scenario B
but greatly advanced. REDD+ revenues are able to overcome the cumulative
OCs at project year 3 and at the end of the 20-year period exceed cumulative
OCs by US$269 (Figure 19).
Even with a more optimistic carbon market price of US$6/tCO2e, in scenario A
REDD+ revenues were insufficient to overcome the cumulative OCs of forest
conservation until project year 13, with a discrepancy of US$1,159/ha in the first
year and US$2/ha at year 12. In contrast, at this higher carbon price, REDD+
revenues are sufficient at all time periods to overcome the OCs of forest
conservation in scenario B (Figure 19). The revenues in excess of the OCs of
223
forest conservation amount to US$40,485,602 in scenario A, and US$79,276,050
in scenario B.
Table 24. REDD+ revenue for a hectare of avoided deforestation (US$/ha). The annual income per hectare over the lifetime of the Bale REDD+ Project intervention from carbon revenue established through two voluntary carbon market prices, minus costs, over the total area of avoided deforestation applying a 10% and 20% discount rate (DR).
Project year
Emission reduction price US$3/tCO2e
Emission reduction price US$6/tCO2e
10% DR 20% DR 10% DR 20% DR 0 1,192 1,192 2,499 2,499 1 1,084 994 2,271 2,082 2 985 828 2,065 1,735 3 896 690 1,877 1,446 4 814 575 1,707 1,205 5 762 493 1,573 1,018 6 693 411 1,430 849 7 630 343 1,300 707 8 573 285 1,182 589 9 521 238 1,075 491 10 478 200 981 411 11 434 167 892 343 12 395 139 811 285 13 359 116 737 238 14 326 97 670 198 15 297 80 609 165 16 270 67 554 138 17 245 56 504 115 18 223 47 458 96 19 203 39 416 80

224
Figure 19. Cumulative opportunity costs and REDD+ revenues over time. The cumulative opportunity costs (OCs) of forest conservation (US$/ha) for a hectare of land taken out of production in a given project year are presented as the bold line for the three scenarios representing differing assumptions of sustainability of the resource base, efforts to intensify agricultural production, and adding value to forest products. The potential REDD+ revenues receive for the hectare conserved (US$/ha) is presented by the dashed line, for the three future scenarios at two voluntary carbon market prices; US$3/tCO2e and US$6/tCO2e.

225
7.4. Discussion
The Bale REDD+ Project intervention objectives in the BME are not quantified
within project documents, which state only qualitative strategies to achieve
these reductions in forest losses (BERSMP, 2006). Scenario modelling of the OCs
of forest conservation illustrates that this linguistic uncertainty, combined with
a lack of information on how the productivity of land use will change over time,
leads to substantial uncertainty in annual, cumulative and total OCs of forest
conservation. This difference is most clearly seen in the optimistic scenario A
and pessimistic scenario B. The cumulative OCs per hectare of forest conserved
in the first year of the intervention – but for the 20-year period – differs by
US$1,769/ha between the scenarios, with total OCs in scenario B 28% of those in
scenario A. These differences are a result of simple changes in the assumptions
about intensification of agricultural production, the degradation that results
from land use practices, the ability to increase the value of forest products and
the discount rate applied.
The highly positive annual OCs in Optimistic scenario A can be attributed the
gains in agricultural productivity that outpace gains in forest product incomes,
with neither land uses leading to degradation of the resource base. Agricultural
intensification in Ethiopia, however, has persistently failed and this failure is
attributed to a narrow focus on technology, with factors such as access to
agricultural credit, incentive structure, institutions, governance and risk
behaviours side-lined (Gebreselassie, 2006). Tenure insecurity, weak extension
services and limited use of fertilisers, improved seeds and pesticides only
exacerbate this. While the CFM project will give a form of tenure that has the
potential to affect technology choice and utilisation within agriculture and
influence access to long-term credit (Deininger et al., 2003), it may be that the
226
implementing agency has limited influence over agricultural intensification in
the project area.
The development of forest products, in contrast, may be more within the
control of the conservation implementer. Forest product development has been
set in motion by the BERSMP and is less influenced by the political economy. It
has been successfully achieved in other regions of Ethiopia (BERSMP, 2008). In
the explorative Zero-OC scenario C, it can be seen that a 12.6% increase in the
prices of forest products per year can lead to zero total OCs of forest
conservation at the end of the 20-year implementation period providing an
economic incentive for forest conservation without carbon revenues. At year 13
the annual OCs become negative and by project year 20, income from a hectare
of forest exceeds that of crops by US$66/ha. Given that after this point standing
forest becomes a more economically viable land option, it becomes more likely
that despite the time horizon of the project coming to an end, incentives for
forest conservation should continue. It is noted, however, that this will require
consistent increase in the value of low-impact forest uses.
Efforts are already underway to increase revenues from forested land.
Improvements in harvesting, drying and packaging could make forest coffee
suitable for export and specialist marketing. Improvements in the management,
harvesting, processing, and marketing of honey is also possible. However,
consideration is necessary of whether this annual price increase is realistic, as
increasing at this rate to the end of project horizon requires a final price 11
times the current prices of forest products. While this might be possible for
forest coffee as evidenced by high international demand for premium coffees
(Wren, 2007), it may not be possible or maintainable for other forest products
such as honey which would rely largely on national product demand. This is
further complicated by the differences found in forest income per hectare by

227
village location; coffee and honey are not ubiquitous across the BME (see
Chapter 6). The production of forest coffee may also require a degree of
excludability, and therefore a clearer understanding of the potential of areas for
low-impact forest products is required. In some areas, the calculation of OCs of
agricultural land, net of low-impact forest products may therefore be
inappropriate. The Bale REDD+ Project implementers in the BME should,
therefore, consider in more detail the extent of their influence on changes in
productivity that impact on OCs of forest conservation.
The theory of PES predicts that local stakeholders, that are the environmental
service providers, will be willing to enter into a contract if the OCs of forest
conservation can be overcome (Ferraro, 2008). Thus for REDD+ to be feasible at
the case study site, REDD+ revenues should overcome the present value of
foregone agricultural production which are the cumulative OCs of forest
conservation estimated here. Under more conservative voluntary carbon
market prices of US$3/tCO2e, while REDD+ revenues go some way to
internalise the positive environmental externality of climate regulation by
forests, they are largely insufficient in both scenario A and scenario B to
overcome the cumulative OCs of forest conservation until the latter years of the
project. At a higher carbon market price of US$6/tCO2e, REDD+ revenue per
hectare is sufficient to overcome OCs at all time periods under scenario B.
Scenario C is designed such that total OCs are zero over the full 20-year lifespan
of the project. It was therefore expected that REDD+ revenues would exceed
OCs. It should be remembered, however, that in this zero-total OCs scenario C,
positive OCs are still incurred. Without a REDD+ project, the positive total OCs
incurred in the initial 8 years amount to US$57 million. With a REDD+ project
REDD+ revenues could be used to overcome these initially positive OCs.
REDD+ revenue could be used not only to overcome the positive OCs in

228
scenario C, but these revenues can also go some way to cover the upfront costs
of the REDD+ project that were not included in the financial analysis. These
costs include the development of project design documents, establishment of
CFM units and certification to third-party standards and have been estimated at
US$3,225,000 (UNIQUE, 2010).
It is important to note that this financial analysis does not consider the
mechanism by which carbon revenues could reach households. With no
emission reductions purchase agreement made, there is no benefit sharing
framework for REDD+ revenues in the BME. Therefore, it is unclear how much
of the REDD+ revenue would reach the households and how much would be
directed to other forest stakeholders such as the central or regional government.
If large portions of REDD+ revenues are captured by governments, these will be
less available to overcome the OCs to household. Furthermore, no information
exists about the payment contract that would be necessary under the
intervention which would define the timing of payments, length of contracts,
and upfront investments required (Ferraro, 2008). The timing of REDD+
payments will be particularly important for the assessment of whether carbon
revenues can overcome the OCs of forest conservation. In these scenarios the
REDD+ revenues assumed to be realised in the year of avoided deforestation.
However, it is likely that REDD+ payments would be received periodically,
rather than annually. Given that most households in the BME are subsistence
households with few saving opportunities, households may be unable or
unwilling to take such a long-term view. A better understanding of their
discount rates and the impact of risk on household land use decisions could
revise these OC estimates as risk preferences have been shown to impact
payment levels required in PES (Ferraro, 2008, Knoke et al., 2011).
229
With a focus on agricultural expansion as the primary driver of deforestation,
the overharvest of high-impact forest products (fuelwood and timber) are
omitted as a driver of deforestation. The Bale REDD+ Project intervention plans
to meet the needs of households for high-impact products – such as timber and
fuelwood – through a number of measures to produce or reduce the need for
biomass from the natural forest. Thus these costs to households were excluded
from scenario analysis. Further research to generate a model that assesses what
fraction of deforestation can be attributable to each driver could also better
estimate these costs. Grieg-Gran (2008) for example, assigns Brazilian
deforestation to nine different land uses which account for between 1% to 63%
of deforested area. With information on the changes in availability of
agricultural land, the effects of forest policy on price feedbacks could also be
included in the scenarios (see e.g. Busch et al., 2009, Fisher et al., 2011). Such
land-market dynamics are commonly ignored in conservation planning
(Armsworth et al., 2006). Here too it has been assumed that the price elasticity
of demand is zero, or perfectly inelastic. More information would be required
on area change to include an estimate of the price elasticity of demand, and to
establish if the assumption of zero elasticity over or underestimates these OC
estimates of forest conservation. This financial analysis of the OCs of forest
conservation in the BME also excludes other environmental and social non-
market values of the forest including watershed protection, biodiversity
protection, social capital, tenure security and empowerment provided by CFM.
These non-market benefits could reduce the net OCs of forest conservation. The
inclusion of other non-market values and the OCs of land for other drivers of
deforestation as they become available would also be a valuable addition to
future research and development of these scenarios.
There are trade-offs in the number of simplifying assumptions made and the
complexity of scenario modelling. Alternative methods such as general
230
equilibrium models and economic optimisation models, for example, are better
able to consider market feedbacks (e.g. Cattaneo, 2005). In these scenarios prices
are not modelled stochastically, with the assumption that prices for products
will change linearly and therefore do not capture uncertainty. However,
alternative methods are highly data and capacity intensive, thus they can be
more difficult to use as an applied conservation tool. A further limitation of
these scenarios is that their calibration did not rely on workshops or other
participatory methods such as survey or Dephi methods (Höjer et al., 2008).
Incorporating more diverse views, particularly of stakeholders and experts in
the process would broaden the perspectives included within these scenarios.
Despite their limitations, these scenarios serve to instigate discussion on how
the private OCs of forest conservation can be influenced by the Bale REDD+
Project implementers in the BME. Scenario modelling of the private OCs of
forest conservation is able to highlight the multiple sources of uncertainty that
exist, and explore the implications of these uncertainties. As a form of creative
visioning, scenarios allow stakeholders to break from established patterns of
thinking (Wollenberg et al., 2000). Wollenberg et al. (2000) also note how
scenarios allow stakeholders to overcome their tendency to overestimate the
probability of desirable events.
This analysis of REDD+ revenues challenges the speed and optimism with
which many conservation practitioners have adopted REDD+ as a tool to
finance forest conservation; REDD+ revenues on their own may not be sufficient
to incentivise forest conservation. The expectations of REDD+ in Ethiopia and
more globally have been high (Clements, 2010, R-PP, 2011). The aim of this
scenario modelling is not obtain a single or ‘right’ answer. It is to highlight the
need for further discussion of the intervention strategy and the potential impact
of its objectives. A better understanding of conservation targets, the extent to
which Bale REDD+ Project implementers are able to increase productivity of

231
land uses, and to internalise the non-market values of forests, will all help in
understanding motivations for resource use and the design of appropriate
incentives for forest conservation. Improving this scenarios analysis with more
participatory calibration and repeating this analysis as intervention
implementation progress is made, and more information becomes available,
will allow the review of the progress of the intervention over time. Scenarios
thus allow for more adaptive management. By allowing futures to be
anticipated, planned for, and adapted to, scenario modelling of the OCs of
forest conservation could lead to more effective conservation.
232
Chapter 8: Household intention to cooperate in forest conservation
8.1. Introduction
8.1.1. Problem statement
CFM establishes a common property regime where members of a well-defined
group of people determine collective regulations for resource use, membership,
monitoring, and sanctioning procedures (Arnold, 2001, Baland and Platteau,
2003). Such a shift to a common property regime from often de facto open access,
establishes rights to the use and management of forest resources. It also
establishes institutional arrangements that manage and enforce these rights
both within the members of a group and for exclusion of those that are not
members.
There are growing calls for REDD+ to be delivered via CFM (Klooster and
Masera, 2000, Murdiyarso and Skutsch, 2006, Agrawal and Angelsen, 2009,
Hayes and Persha, 2010). Both require the bundle of rights and obligations to be
recognised by a country’s legal system and enforced by its government.
However, the economic incentives that underpin REDD+ would also need to
operate in the context of the institutions and legal context established by CFM.
There would need to be clarification of carbon rights, for example, in addition
to forest use rights, and discussions around the role of the collective versus the
individual if REDD+ payments were to be made and distributed according to
the theory of REDD+, where it operates as a local-level PES mechanism
providing economic incentives for the provision of environmental services (see
Chapter 2 for other options to fund and implement REDD+).
Historically, CFM implementation has not offered communities payments.
Instead, it is assumed that the change in property rights regime leading to

233
increased empowerment and improved governance mechanisms, as well as
improved forest resource management, will shift incentives sufficiently to
deliver the resource management outcomes (Agrawal, 2003). The behavioural
theory of collective action also indicates that the cooperative management of a
common pool resource is not only influenced by the income from direct
extraction, but by the impact of reputation, trust and reciprocity on households’
payoffs, which can be considered as their costs and benefits (Ostrom, 2000,
Castillo and Saysel, 2005). There is, therefore, a divergence between dominantly
economic incentives for PES and the incentives to engage in CFM.
Few studies have noted that the OC approach to payment incentives in PES
ignores the logic of collective action (Kosoy et al., 2008, Muradian et al., 2010).
Estimates of the OCs of REDD+ commonly assume that household’s act as self-
interested profit maximisers thus acting independently of their impacts on
others. It is clear, however, that individuals are often influenced by their
adherence to social and cultural norms (Baland and Platteau, 1996). These are
their preferences for altruism, reciprocity, inequity aversion and conformity
with the wider community rather than purely their selfish motivation. This, for
example, has been demonstrated by Velez et al. (2009) for extraction from a
common pool fishery in Colombia.
The incentives for households to engage in REDD+ via CFM are not only
potential carbon payments and improvements in forest management regime,
but the devolution of use rights, the institutions and social capital established
through CFM; therefore, the empowerment to take more control over resource
management. These incentives can impact on households’ willingness to incur
costs of collective action, such as use restrictions, monitoring, patrolling and
attending community meetings, so long as others reciprocate and adhere to the
institutions put in place (Vatn, 2010).
234
As well as the omission of the logic of collective action in incentives for
cooperation in REDD+, estimates of the OCs of REDD+ have also commonly
omitted the non-market environmental values of forest conservation. These
include watershed protection, biodiversity protection and conservation of
landscape beauty (Pearce and Warford, 1993, Davies and Richards, 1999). The
omission of non-market environmental values is largely due to complexity in
their measurement and subsequent valuation, with methods varying in
theoretical validity and acceptance, data requirements and ease of application
(see OECD, 2002, Pagiola et al., 2005b). Their omission is acknowledged by
studies as having the potential to overestimate the payment to incentivise forest
conservation behaviours (e.g. Naidoo and Adamowicz, 2006, Grieg-Gran, 2008).
The omission of the logic of collective action as well as non-market
environmental values could help explain findings where local stakeholders
participate in PES where the estimated OCs are not met (Wunder, 2005, Corbera
et al., 2007b, Kosoy et al., 2007). Of course, participation despite negative OCs
could also result where stakeholders lack information on the market value of
services they supply or the experience to truly evaluate the contracts they are
offered (Peskett and Harkin, 2007, Kosoy et al., 2008). In order to opt out of PES,
stakeholders must also be free from external pressure and coercion which is not
always the case (Grieg-Gran et al., 2005, Robertson and Wunder, 2005, Pagiola
et al., 2005a, Bennett, 2008). However, the omission of economic values of
environmental goods and services provided by forest conservation, and the
logic of collective action, both existing and generated by CFM incentives and
sanctions, could lead to inappropriately designed REDD+ incentives.
The literature on participation in PES has focused on a locals stakeholder’s
ability and eligibility to enter into a scheme, rather than on their desire to

235
participate (Pagiola et al., 2005a, Zbinden and Lee, 2005, Wunder, 2008, Pascual
et al., 2010, Sommerville et al., 2010). The literature for participation, or
cooperation, on a common pool resource is more substantial. Consensus on an
enabling environment for sustained collective action is summarised by Agrawal
(2001) as small, interdependent groups that are relatively well off, with
adequate underlying technical and institutional capacity and high dependence
on forests for their livelihoods (see also Baland and Platteau, 1996). Studies have
explored determinants of CFM success with regards to forest condition
(Agrawal and Chhatre, 2006, Andersson and Agrawal, 2011); resource
appropriators access to forest (Adhikari et al., 2004, Naidu, 2011); and
participatory processes (Adhikari and Di Falco, 2009). The literature focuses on
the impact of heterogeneity in wealth, interest, and social factors, although the
outcome of these factors remain debated (see Poteete and Ostrom, 2004, Naidu,
2009).
Studies of cooperation in CFM, however, rarely consider how households’
perceive the resource system or intervention. Matta and Alavalapati (2006) is an
exception that considers participants perceptions of a CFM intervention in
India. They find that those who believe environmental problems to be of high
concern in their village and those with greater levels of education rate the
overall perceived performance of the intervention more highly; where rated on
a scale of 1 to 5 where 5 is the highest. It is noted that in this study the
perceptions of the overall performance of the CFM intervention depended on
individuals’ initial perceptions of environmental problems and what they
perceived the benefits of CFM were and so each person has a different baseline.
Therefore, overall success and sustained participation in the studied CFM
intervention will be a function of the perceptions of participants who vary in
knowledge, understanding and beliefs. As with other studies of cooperation in
CFM, however, Matta and Alavalapati (2006) is an ex-post assessment and not
236
applied for intervention design or planning. However, if the factors which
improve cooperation in an intervention are known, they could be actively
promoted (Cavalcanti et al., 2010).
The attitudes and perceptions of those local to interventions has been
recognised as important for success in the conservation literature (Zanetell and
Knuth, 2004, Davies and Hodge, 2006, Nkonya et al., 2008). Zanetell and Knuth
(2004) in their analysis of participation in community-based fishery
management, find an unwillingness of respondents to participate where
insurmountable problems were perceived, whereby villagers did not believe
that anything they could do would alleviate the decline of the fishery in
Venezuela. Communities have also been found less willing to support
community based management where they believe the capacity of community
institutions to undertake these challenges to be weak (Masozera et al., 2006). In
Uganda, a survey of attitudes to a community conservation programme seven
years after the intervention began, found communities to be critical of the
conservation intervention with largely unchanged behaviour and high level of
illegal activities (Infield and Namara, 2001).
The PES literature, more recently, has also called for more attention to be paid
to stakeholders’ attitudes and perceptions in PES schemes (Corbera et al., 2007a,
Kosoy et al., 2008, Petheram and Campbell, 2010). An understanding of a
stakeholder’s attitude towards forest management and the use of the resource
base will allow more consideration of socio-cultural factors for cooperation that
go beyond payment incentives that PES theory highlights (Ferraro, 2008,
Wünscher et al., 2008).

237
8.1.2. Aims and objectives
The Bale REDD+ Project has been proposed and initiated by the Government of
Ethiopia (Oromia Regional Government, Bureau of Agriculture and Rural
Development, and the Food Security and Disaster Prevention and Preparedness
Commission) and NGOs FARM-Africa and SOS Sahel Ethiopia: the Bale REDD+
Project implementers. The project area covers 900,000 ha including dry and
moist tropical forest which is currently being lost at 4% annually. In order to
reduce deforestation over a 20 year period, CFM will be implemented alongside
promotion of fuel-efficient stoves and biomass briquettes and plans are
underway to plant woodlots and manage fire outbreaks. Increasing agricultural
production and the value of NTFP will also occur as part of the project. While
CFM and REDD+ can both be undertaken as separate policy interventions, in
the BME these are considered together: the Bale REDD+ Project undertakes
REDD+ via CFM. Thus emission reductions do not have to be additional to that
achieved through CFM, but rather are those generated by CFM (see Chapter 3
for a full description of the Bale REDD+ Project).
Chapter 5 indicates that, while uncertain, emission reductions and positive
REDD+ revenues are feasible at the case-study site. The 20-year project could
generate 180ktCO2e, even when accounting for only above-ground tree
biomass. In Chapter 6, high positive OCs of forest conservation are found from
foregone agricultural production, net of low-impact forest product harvesting.
Average OCs of agricultural production US$334/ha in the survey year and
Chapter 7 indicated that REDD+ revenues may be insufficient to overcome
these OCs.
This Chapter investigates the local attitudes to resource management and
conservation at the case-study site in order to complement the empirical
238
estimates of households’ OCs of REDD+ via CFM. In addition, the cooperative
intention of a household is also assessed using a voluntary contribution to
secure forest resource benefits into the future through CFM. Multivariate
regression is used to investigate households’ strength of intention to cooperate
under a proposed CFM regime. I add to knowledge by considering how ex-ante
information on attitudes and perceptions can be used in intervention design to
encourage cooperation between households. I then outline the implications of
these findings for REDD+ via CFM at the case-study site.
8.2. Methods
8.2.1. The REDD+ via CFM, Bale REDD+ Project
Although the extraction fuelwood for sale and timber extraction is illegal, in the
status quo, the forest resource is a de facto open access regime. This is due to a
lack of enforcement of forest laws. Each user is capable of subtracting welfare
from other users and forest use is presently reported to be unsustainable with
deforestation rates at 4% annually (BERSMP, 2006, BMNP, 2007). In order to
tackle nationwide forest losses, Ethiopia is supporting the roll-out of CFM; the
policy and legal framework of which is driven by the 2007 proclamation for
Forest Development, Conservation and Utilisation. The state retains the rights
to land, but use rights for forests are agreed with communities.
A proposed Bale REDD+ Project in the south-east of Ethiopia will devolve
management responsibilities to communities through CFM while generating
emission reductions through avoided deforestation. It is therefore a REDD+ via
CFM project. By implementing the CFM regime, communities will not have
property rights to the land but rights of access, withdrawal, management and
exclusion of certain forest products. They legally have claim to the benefit
streams from low-impact forest products (climber, coffee, honey and bamboo),

239
and must restrict their extraction of high-impact forest products, namely,
fuelwood and timber (see Section 4.3.2.2.). The expansion of agricultural land
will also be strictly controlled. These rights will be transferred through forest
management agreements made with the Bale Forest Enterprise and CBOs,
groups of about 30 households, and will come with duties such as attending
meetings, monitoring and patrolling of a defined forest area. Thus the
establishment of CFM is not a complete transfer for rights, but a partial transfer
where the state retains the ownership of land. Although yet to be confirmed, the
Bale Forest Enterprise is likely to retain the carbon rights for emission
reductions generated and benefit-sharing mechanisms have yet to be discussed
and negotiated (see also Chapter 3, Section 3.4).
Historically in the BME, forests were under traditional management systems
and elders were responsible for the introduction locally agreed rules and norms
of resource us (Wakijira et al., in press). While these traditional forest
management systems have been eroded by central government over time, some
do exist to manage other communal resources in the region such as mineral
springs for livestock and for the harvest of forest coffee (Chiodi and Pinard,
2011). The existence of traditional councils exist can prove conduits for
organised local level forest management (Wily, 2010), which is promising for
the implementation of the Bale REDD+ Project as REDD+ via CFM.
The Bale REDD+ Project is still in a design phase, however. With the
intervention yet to be implemented in survey villages, the description of CFM
in the BME relies on predicted rules of the intervention. During implementation
forest use rules will be established by user groups including; what to extract, to
what level, and how to distribute that extraction and sanctions if rules are
broken. The exact conditions placed on households will, therefore, be
negotiated with CBOs and households through the process of CFM
240
establishment. The description as given to survey respondents was, therefore,
based on the available information on the intervention at the time. It is assumed
that high-impact forest product harvest and expansion of agricultural land will
not be allowed, while low-impact forest product harvest will be allowed under
the proposed Bale REDD+ Project. The negotiation of forest management
agreements will also clarify the transaction costs that households would need to
incur under the new forest management regime. These include negotiation,
monitoring and enforcement costs (Adhikari and Lovett, 2006). It is likely that
in reality, some households will make greater contributions to cooperative
efforts through monitoring and enforcement, or administrative duties for CBO
groups (Adhikari and Lovett, 2006; Meshack et al. 2006). However, these
transaction costs of CFM on households cannot be established at present and
these costs were not estimated for any households in this study (see Section
4.3.2.2).
8.2.2. Households’ environmental and forest management attitudes
The environmental attitudes held by individuals derive from their underlying
values and beliefs, thus qualitative study of opinions and perceptions of
conservation interventions allows unobservable values to be better understood
(Kotchen and Reiling, 2000). At the case study site, environmental attitudes to
forest management were elicited in agree/disagree statements. This included
anthropocentric motivation for resource use and non-market values, including
option value for future direct and indirect use, and non-use values that capture
the value of the forest existence and bequest for future generations (Davies and
Richards, 1999). In addition, statements explored the general context and trade-
offs households make between environmental concerns and with other
concerns of wellbeing and competing livelihood priorities (see Table 25). A
241
series of open-ended questions then explored opinions of past, present and
proposed forest management regimes in the survey villages.
A description of the Bale REDD+ Project intervention was then read out to
survey respondents. This included CFM and the potential for emission
reductions to be generated for which international payments might be available
(see Appendix 1). Following this, respondents were asked if they would take
part if the project came to their village. In agreeing to take part it is assumed
that households undertake a calculus of the costs and benefits they perceive
they will incur (Lubell, 2002). In order to assess their perceived net benefits of
the scheme, households were then asked if their welfare and their income
expectations would change in the year following the implementation of the
intervention if it was to take place. This would include an internal calculation of
the costs and benefits of restrictions on their use of land and forests in addition
to what they perceive they might receive through REDD+ payments.
While households received a description of how community cooperatives could
receive money for keeping the carbon in the trees through REDD+, no anchor of
the scale of the revenues that would be available through REDD+ was provided
as this is not yet determined by the project and there was a fear of raising
expectations by the Bale REDD+ Project implementers. This makes the
interpretation of the perceived income expectations complex, thus it is not taken
here to be a welfare measure or analysed purely on its own. Households were
also asked, however, what they would spend carbon revenues on if payments
were made. Household responses were coded for community, private or a
combination of community and private goods. Community goods are defined
as those that benefit the community at large, for example using the money for
roads, bridges, and clinics, whereas private goods are those that benefit the

242
household, for example using the money for trade, to school children, or to
purchase livestock.
Respondents were also asked if they believed other households would
participate and follow the rules as outlined in the description of the Bale
REDD+ Project. This question was intended to determine if respondents would
trust other households and to assess if they believed other households would
reciprocate in cooperating in the communally used forest area.
Table 25. Attitudinal statements towards environmental values and livelihoods. Agree/disagree statements to which households responded in the semi-structured survey and a description of the values they relate to.
Value elicited Statement Description
anthropocentric “If an area of forest is not being used by people it is not a problem if the forest area gets smaller”
The anthropocentric statement considers the instrumental nature of household environmental values
selfish “Even if my household does not use a part of the forest, I would participate in this forest management”
The selfish statement highlights whether households consider the wider community or are motivated purely by private returns
option
“I do not think about my household's use of forest in the future, it is enough to think only about my households use of the forest now”
Option value concerns goods and services that are not used at present, but have the potential to be used directly or indirectly, in the future
bequest and altruistic
“There is a responsibility for me to manage the forest well now so that my children and future generations can benefit from forest in the future”
The availability of goods and services to be used by future generations is referred to as bequest value and by current generations as altruistic value
existence “One management objective for forests in the Bale Mountains should be to support wildlife that lives there”
The satisfaction in knowledge that services merely exist is classified as existence value
trade-offs “Forests should be managed only if this does not negatively affect people's livelihoods” Trade-off and general context
statements highlight the prioritisation of forest conservation against other livelihood needs and well-being concerns
(a) general context
“People have more important things to worry about than good management to maintain the forest”
(b) general context
“People only cut down the forest because they have no other way of supplementing their livelihoods”
243
8.2.3. Households’ intention to cooperate with the Bale REDD+ Project
Cooperation in this study is defined as not only entry into the CFM scheme, but
also abiding by the intervention rules and undertaking pro-conservation
behaviours. Within a household’s cooperative intention, it is assumed that
households will consider their OCs in addition to the value that households
place on the devolution of use rights, on the institutions and social capital
established, or on empowerment provided under a new CFM regime, and any
transaction costs that CFM will impose on a household.
A proxy of the strength of a household’s intention to cooperate was elicited
with the question: ‘to secure benefits into the future, would you be willing to give up
some of your yearly income to your CFM cooperative so that they could better manage
the forest?’ and a follow-up question that elicited the voluntary contribution
amount. This question is relates to a contribution towards sustainable forest
management as defined in interviews as; maintaining the forest area and
quality so as to provide benefits and income into the future. It was elaborated
that high-impact forest products would need to be harvested without
detriment, as would any grazing of livestock in the forest, but low-impact forest
products would not be affected under the proposed sustainable forest
management regime. It was also made clear that this would entail the creation
of a community based group with full responsibility for the outcome agreed
with the authorities. As traditional forest management used to be commonplace
in the Bale Mountains (see Chapter 3), this is a management regime that the
respondents were able to relate to and understand.
The voluntary contribution is a hypothetical question, but where respondents
reported future behaviour is assumed to illustrate their preferences or values.
The hypothetical nature of the question means that no real economic
244
commitment of the individual is required and this may lead to hypothetical bias
in the response through warm glow effects (Andreoni, 1989). The voluntary
contribution is also not incentive compatible and therefore is not used to
estimate a welfare measure in this study (Champ et al., 1997). A result of the
hypothetical and ex-ante question, individuals may also lack familiarity with
the operation of the proposed community based organisations (CBOs); the
small groups of households that sign forest use agreements. In light of the Bale
REDD+ Project being implemented through CFM and the possible, but
uncertain, nature of payments to communities from REDD+, it is clear that there
respondents will be confounding a multitude of incentives. These include
potential monetary and in-kind incentives from REDD+ as well as the
aforementioned benefits from cooperation under CFM. It is therefore, not
possible to distinguish respondents attitudes towards REDD+ separately from
those towards CFM. The value is also not considered a measure of willingness-
to-accept. The question was made as real as possible, however, with a
description of the intervention and by indicating a clear form and frequency of
payment. The CFM cooperative was also described to respondents as an honest,
credible and reliable organisation with committees, rules and responsibilities
(see Appendix 1).
Acknowledging the limitations of the voluntary contributions approach, it is
assumed that a household’s responses will reflect their future behaviour. The
magnitude of the contribution elicited is assumed a quantitative indicator of
behavioural intention to cooperate in the conservation intervention. Where a
positive contribution exists, it indicates that the household is willing to move
from the status-quo to the CFM regime (as outlined in Section 8.2.1) and it
demonstrates a willingness to adhere to the rules as explained.

245
8.2.4. Econometric analysis
The determinants of cooperative intention, using a respondent’s willingness to
pay into the cooperative CFM group in order to contribute towards sustainable
forest management as a proxy, were analysed using an ordinary least squares
(OLS) regression (see Chapter 4). Explanatory variables were selected based on
a priori assumptions of their impact (Table 26). These variables include socio-
economic factors that might influence the voluntary contribution including
income from agriculture, low-impact forest products (coffee, honey, climber
and bamboo), and high-impact forest products (fuelwood and timber); and the
households income expectations under the Bale REDD+ Project intervention.
Demographic factors included were household size, years in village and the
education of the household head.
The voluntary contribution, high-impact forest product income and crop
income were log transformed. This log transformation allows for a non-linear
relationship between the dependent and independent variables. It also
normalises the residuals and reduces potential outliers with the dependent
variable more likely to be normally distributed. Two zero values for the
voluntary contribution were assigned the next smallest value of US$0.15 before
log transformation. A dummy variable was generated for the presence or
absence of low-impact forest product income, as 58 households had zero values.
No strong colinearity between and of the independent regressors was observed
(Table 27).

246
Table 26. Explanatory variables of intention to cooperate in the proposed Bale REDD+ Project intervention. Description, hypothesised impact and justifications for explanatory variables used to explore a proxy for a household’s intention to cooperate in the Bale REDD+ Project intervention through their willingness to give up a proportion of their income. Explanatory
variables Explanation
Hyp. impact
Justification
lifp_yn
Dummy variable for income from low-impact forest products (bamboo, climber, coffee and honey); 1= income greater than US$0, 0= no income in the survey year
+
It is predicted that if HH derive income from high-impact forest products, their contribution towards continuing to receive these benefits into the future will be higher (Baland and Platteau, 1999, Agrawal and Chhatre, 2006).
log_hifp
The log of the income a household derived from high-impact forest production (timber and fuelwood) in the survey year
-
It is predicted that households would be less willing to contribute towards forest conservation given that they will have to undergo restrictions in their use.
log_crop
The log of the net income a household derived from cultivated land in the survey year
-
With higher income from agriculture, an alternative source of income to forests, HH are expected to have a lower contribution.
income_expectation
The amount by which the HH thinks their income will change under the CFM intervention
+
The higher the expected income change in the first year following the intervention, the higher a household’s contribution is hypothesised to be. It is recognised that more research is required to understand the determinants of this variable, however.
HH_size The total number of people in the household
-
With more mouths to feed, it is predicted that the contribution will decline as other needs dominate use of income.
education The number of years of education of the HH head ranging from 0 to 13 years
+
Education is expected to increase pro-conservation behaviours as well as improving knowledge and skills to extract forest products more sustainably and cultivate land more intensively (Godoy and Contreras, 2001, Adhikari et al., 2004).
village_years The number of years the HH head has lived in the village
+
Experience through age and knowledge during length of residence is also expected to increase pro-conservation behaviour and thus the contribution.
Agarfa Location dummy variable; 1= Agarfa, 0= not Agarfa Dummy variables for location were included in
the model to control for village and forest fixed effects. Goro Location dummy variable; 1=
Goro, 0= not Goro
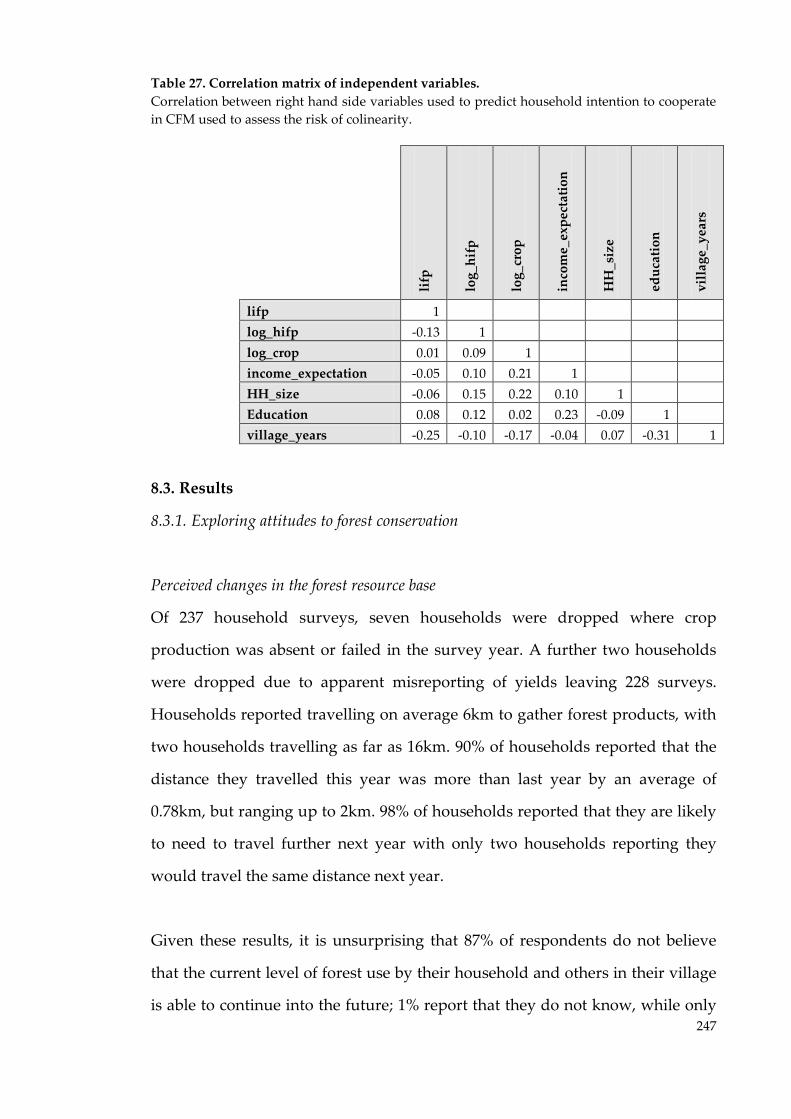
247
Table 27. Correlation matrix of independent variables. Correlation between right hand side variables used to predict household intention to cooperate in CFM used to assess the risk of colinearity.
lifp
log_
hifp
log_
crop
inco
me_
expe
ctat
ion
HH
_siz
e
educ
atio
n
villa
ge_y
ears
lifp 1 log_hifp -0.13 1 log_crop 0.01 0.09 1 income_expectation -0.05 0.10 0.21 1 HH_size -0.06 0.15 0.22 0.10 1 Education 0.08 0.12 0.02 0.23 -0.09 1 village_years -0.25 -0.10 -0.17 -0.04 0.07 -0.31 1
8.3. Results
8.3.1. Exploring attitudes to forest conservation
Perceived changes in the forest resource base
Of 237 household surveys, seven households were dropped where crop
production was absent or failed in the survey year. A further two households
were dropped due to apparent misreporting of yields leaving 228 surveys.
Households reported travelling on average 6km to gather forest products, with
two households travelling as far as 16km. 90% of households reported that the
distance they travelled this year was more than last year by an average of
0.78km, but ranging up to 2km. 98% of households reported that they are likely
to need to travel further next year with only two households reporting they
would travel the same distance next year.
Given these results, it is unsurprising that 87% of respondents do not believe
that the current level of forest use by their household and others in their village
is able to continue into the future; 1% report that they do not know, while only

248
11% believe current levels of forest use are sustainable. These changes were
attributed to the decline in the forest area as well as forest clearing without any
planning, replanting or conservation measures. Underlying causes are reported
as increasing family sizes, immigration and lack of alternatives, while the
proximate drivers of deforestation are identified by the respondents as clearing
for agricultural land, increasing fuelwood demands, an increase in grazing in
the forest and an increase in the number of landless people. It is also mentioned
that more people are gathering forest products to sell as well as to use within
their households in recent years. Box 1 presents some quotes from the
respondents when asked about the sustainability of the forest resource base.
Overall, it is clear that the forest is declining and those that do think forest use
is sustainable, largely do so on the proviso that the government intervene.
Box 1. Survey responses to the question “Do you think that the current level of forest use by your household and others in this kebele can continue into the future? Why?” Selected quotes from those who think forest use is not sustainable: − I can say forests will last for two years here after as it is badly being cut down for different
uses. − As it is extremely deforested it will not last for two years. − If this situation continues it will not pass to the next generation because the cutting of forest
is increasing. Forest conservation is not known in this area. There is even not enough forest for this generation.
− Because most people are cutting down the forest without thinking about the next generation. If the government controls the forest and teaches the community about the forest benefit the forest management will be changed for the next generation.
− Because the number of families are increasing and so the landless people increase. Even the students stop their education and start cutting down the forest for selling. For fuelwood other people are coming from other kebeles and for these reasons the forest will not pass to the next generation.
Selected quotes from those who think forest use is sustainable: − If the government control the forest from time to time, if the community get education
about using the forest sustainably and if the community gets a payment, the forest will pass to the next generation.
− If the forest conservation is continuing, there will be forest for the next generation because the forest conservation in this kebele is good at the moment.
− Because we are going to conserve the forest so that it can be passed to the next generation.

249
Attitudes to the environment and other values derived from the forest
There was very little variation observed in the attitudinal survey data, which
illustrated that respondents generally disagreed with anthropocentric
motivations of forest use and with selfish motivations for forest use.
Households also held a strong desire for forest to be available for future use
(bequest, existence and option value). The general disagreement with the trade-
offs statement implies that households are willing to accept a reduction in
private benefits in aid of forest conservation. It is also clear from the general
context statement responses that livelihood and income security were high on
the household agenda, with households believing that forests are a way of
supporting livelihoods when other livelihood generating activities are not
available (Figure 20).
Figure 20. Responses to attitudinal statements of environmental values and livelihoods. Agree/disagree and don’t know responses of survey respondents relating to underlying values (see Table 25 for a description of the statements).
anthropocentric
selfish
option
bequest
existence
trade-offs
(a) generalcontext
(b) generalcontext
agree don't know disagree

250
Opinions on past and current forest management
Many respondents reported a much stricter forest management regime under
the Derg regime (before 1991). Permission from village authorities was required
for timber for house construction and the gathering only of deadwood for
fuelwood was permitted. Most report that this strict management was ‘better’
due to a combination of government control and traditional management by
village elders. A number of respondents, for example, reported that they were
required to plant fast growing eucalyptus under the Derg regime and sale of
forest products were restricted. Elders reportedly taught people about tree
growth and how to harvesting biomass but conserving the whole tree.
However, there are also reports that restrictions were not always adhered to,
although forests were able to meet livelihood needs as, before 1991, there were
fewer forest users and fewer forest uses; deadwood was much more abundant,
young men were recruited for national military service, and livestock
ownership was more prevalent.
Responses to questions on the current forest management in the area that the
household uses reflect a decline in adherence to restrictions on use, advice from
village committee members, and a loss of forest area. It is widely acknowledged
amongst respondents that prohibitions exist for clearing forest and collecting
some forest products for sale, but many respondents report the need of use for
survival and therefore disregard of these rules. There are reports of competition
between communities as well as within communities as a result of increasing
family size, increasing number of families and increasing number of landless.
Households report that they now gather forest products for sale, rather than
predominantly for use within the household. However, a small number of
respondents reported that current forest management is improving as a result
of initiatives, by the government, to teach and implement CFM (Box 2).

251
Opinions of community forest management
Responses to an open-ended question of how forest management might change
if communities were given legal rights to use the forest and forest products,
gave overall support for the devolution of management and REDD+ via CFM. A
number of households, however, stated that forest management would improve
only if education, awareness, advice and supervision are also provided by the
authorities. Some noted that the village could provide greater control and
management as the committee and people in the village are more aware of who
is deforesting and who is not. In contrast, some respondents were less
enthusiastic about the transfer of rights, believing that handing over rights
could result in worsening forest management, particularly mentioning that
changes could not occur unless the landless and the poor who rely on the forest
are provided with alternative opportunities (Box 2).
Following a description of the CFM scenario, respondents were asked if they
and households in their village would join a CFM cooperative. The respondents
showed high support for the proposed CFM intervention with 100% of
respondents reporting that their household would join CFM. Furthermore, 79%
of respondents believed that other households in the village would also join a
CFM cooperative; the remaining 21% did not know if other members of the
village would join a CFM group. When asked how certain they were that other
members of a cooperative would follow the rules to maintain the forest area
under CFM, 83% were certain, while 10% were uncertain and less than 7% of
households did not know.
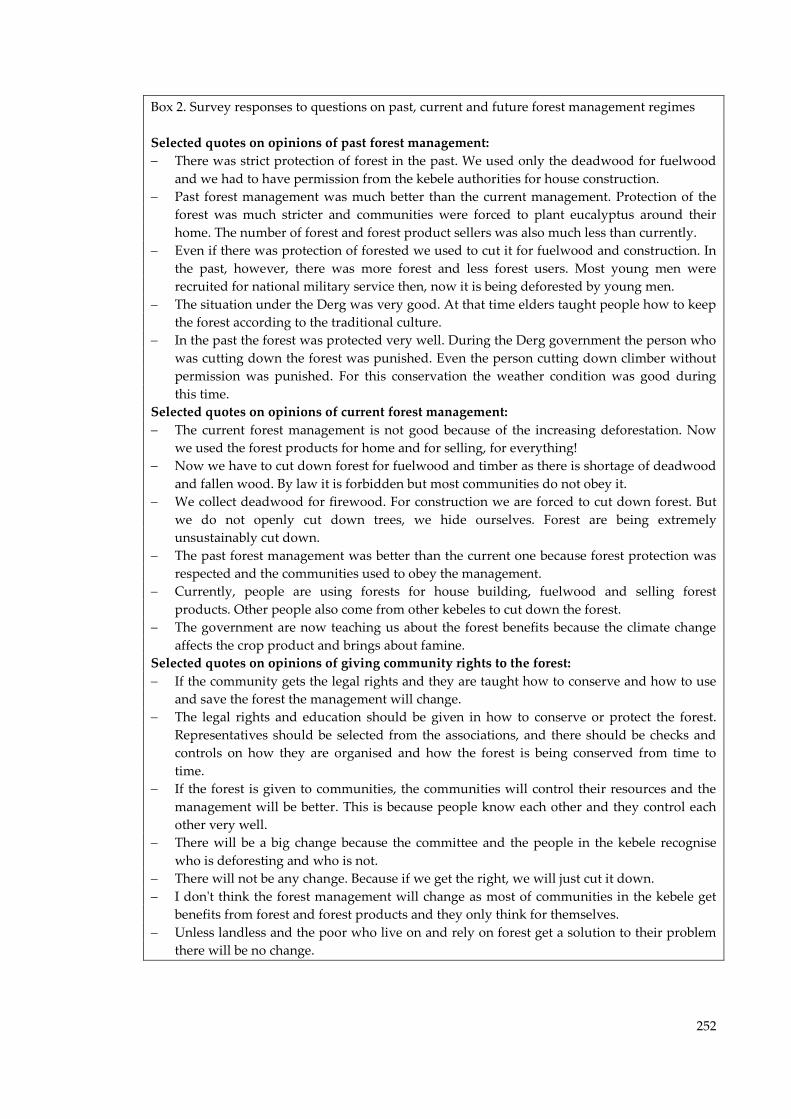
252
Box 2. Survey responses to questions on past, current and future forest management regimes Selected quotes on opinions of past forest management: − There was strict protection of forest in the past. We used only the deadwood for fuelwood
and we had to have permission from the kebele authorities for house construction. − Past forest management was much better than the current management. Protection of the
forest was much stricter and communities were forced to plant eucalyptus around their home. The number of forest and forest product sellers was also much less than currently.
− Even if there was protection of forested we used to cut it for fuelwood and construction. In the past, however, there was more forest and less forest users. Most young men were recruited for national military service then, now it is being deforested by young men.
− The situation under the Derg was very good. At that time elders taught people how to keep the forest according to the traditional culture.
− In the past the forest was protected very well. During the Derg government the person who was cutting down the forest was punished. Even the person cutting down climber without permission was punished. For this conservation the weather condition was good during this time.
Selected quotes on opinions of current forest management: − The current forest management is not good because of the increasing deforestation. Now
we used the forest products for home and for selling, for everything! − Now we have to cut down forest for fuelwood and timber as there is shortage of deadwood
and fallen wood. By law it is forbidden but most communities do not obey it. − We collect deadwood for firewood. For construction we are forced to cut down forest. But
we do not openly cut down trees, we hide ourselves. Forest are being extremely unsustainably cut down.
− The past forest management was better than the current one because forest protection was respected and the communities used to obey the management.
− Currently, people are using forests for house building, fuelwood and selling forest products. Other people also come from other kebeles to cut down the forest.
− The government are now teaching us about the forest benefits because the climate change affects the crop product and brings about famine.
Selected quotes on opinions of giving community rights to the forest: − If the community gets the legal rights and they are taught how to conserve and how to use
and save the forest the management will change. − The legal rights and education should be given in how to conserve or protect the forest.
Representatives should be selected from the associations, and there should be checks and controls on how they are organised and how the forest is being conserved from time to time.
− If the forest is given to communities, the communities will control their resources and the management will be better. This is because people know each other and they control each other very well.
− There will be a big change because the committee and the people in the kebele recognise who is deforesting and who is not.
− There will not be any change. Because if we get the right, we will just cut it down. − I don't think the forest management will change as most of communities in the kebele get
benefits from forest and forest products and they only think for themselves. − Unless landless and the poor who live on and rely on forest get a solution to their problem
there will be no change.

253
8.3.2. Perceived welfare and income expectations under CFM
84 households had to be dropped from the sample due to enumerator
misunderstanding of the perceived income change and voluntary contribution
question. This reduced the sample size, but as the enumerator was employed
over all survey villages, this did not lead to geographical bias. Nine further
households were dropped where contribution data were missing from the
enumerators’ data books. Of the remaining 135 surveys, 99% of households
reported that their welfare would increase as a result of CFM, 1% (two
households) reported a perceived decline in welfare; where welfare is defined
without time delimitation and not restricted to a household’s change in income.
The households that thought that their welfare would decline under CFM
reported that they felt that restrictions would mean they would not be allowed
to sell and use as many forest products as they needed. Only one stated that
there would be too many interests under the cooperative so that he could not
do as he pleased and would be influenced by other group members.
Households that thought their welfare would improve largely attributed this to
increasing incomes from the forest through products such as coffee and honey.
A number of survey respondents also noted that in cooperatives, members are
able to generate more income working together than they would on their own,
benefiting from cooperation as well as more experienced individuals, or indeed
any job activities that might arise through the cooperative. One household
believed that the formation of a cooperative would allow work to begin on a
road and bridge such that their well-being would be increased in the future.
Another noted that improving the forest condition will attract wild animals and
therefore tourists, to the area.

254
Improved crop production, as a result of improved local climate regulation, and
income from possible carbon payments were mentioned by respondents when
explaining improvement in welfare. This raises concerns over high expectations
under forest conservation, particularly for the return of good rainfall for crop
growth in the immediate term. However, when asked to think five years into
the future, as well as similar mentions of the climate returning to normal,
respondents talked much more broadly about the benefits from forest
conservation including; improved seedling survival, increasing forest quality
and flowering leading to improved honey yields, watershed benefits, and the
persistence of forests for the next generation to use. These speculative
expectations of the short-run benefits of forest conservation will need to be
managed from a policy intervention perspective.
Perceived income expectations of CFM were high in the period of one year after
the implementation of the Bale REDD+ Project intervention. 99% of households
perceived that their income would increase under CFM, and again two
households believed their income would decline. These findings align with the
above perceived welfare changes of households, which suggest households
consider income very important to their welfare. The average income increase
expected was US$286 ± 38. There was a large variation in the expected changes;
households income expectations ranged from a loss of US$449 to a maximum
increase of US$1,498 (Table 29).
When asked what money from payments for carbon storage could be used for
51% of respondents suggested only community goods. The most popular
community good being the construction of a mill, followed by that of a school.
29% of respondents reported only private uses with most popular response
being trading followed by livestock. 20% of respondents suggested a
combination of private and community benefits could be funded. While the

255
highest frequency response of trading appears an environmentally benign use
of payments, the second most frequently reported private use of payment is
livestock (Table 28). Where payments are designed, this indicates that
secondary issues may well emerge. 40 respondents also suggested that the
money should be reinvested in forest conservation.
Table 28. Survey respondents’ reported desired use of carbon revenues by community and private goods. The suggested uses of REDD+ revenues that could be received under the proposed REDD+ via CFM intervention, divided into community goods that benefit multiple households and private goods that benefit only the survey household, with frequency of response reported in brackets.
Community use of REDD+ revenue Private use of REDD+ revenue
Mill (water and electric)(67) School (52)
Irrigation (42) Bridge (41)
Forest Conservation (40) Track (17)
Transport (car/bus/lorry)(13) Road (13)
Waterpipe (9) Clinic (8)
Electricity (5) Industry (4)
Welfare for elderly (3) Conserve wild animals (1)
Trading (106) Livestock (cattle, oxen and
sheep)(58) Fertiliser (24)
Harvest machine (farming equipment)(19)
Family improvement (e.g. teaching children)(17)
House building (11) Seeds (6)
Plantation (4) Saving (2)
Coffee for trade (1) Farmland (1)
Modern beehive (1)
8.3.3. Households’ intention to cooperate in CFM
8.3.3.1. Descriptive statistics
In response to the question ‘to secure benefits into the future, would you be willing to
give up some of your yearly income to your CFM cooperative so that they could better
manage the forest?’, 99% of households were willing to contribute some of their
yearly income. Only two households were not willing, stating reasons of not
being able to afford it with one household stating that their income would
decrease under the intervention, thus they would need support to pay into the
scheme. The mean of the voluntary contribution into the cooperative CFM

256
group was US$11± 4/year. The distribution of the contribution is highly skewed
with median voluntary contribution of US$4.49 per year (Table 29; Figure 21). A
significant difference by location is found at the 5% level (Kruskall-Wallis,
K=8.140, df=2, p=0.0171**). The trend between survey locations followed that
found for forest incomes and was opposite to that found for households’
income expectations under the intervention: voluntary contributions were
highest in the moist forest of Delo Mena where high value coffee grows and
honey is a forest product option. The voluntary contribution was lowest in the
woodland of Goro, where neither coffee nor timber, are viable forest products
(see also Chapter 6).
Table 29. (a) Mean household income expectation under proposed CFM regime and (b) willingness to pay into the cooperative CFM group by location. (a) The mean and median household income expectations (US$) in the first year of implementation of the Bale REDD+ Project intervention reported by survey village location with 95% confidence interval as well as median and range. No significant differences were found between villages: Kruskall-Wallis, K=0.931, df=2, p=0.6279; (b) The mean and median voluntary contribution in order to contribute towards sustainable forest management, a proxy for a household’s intention to cooperation in CFM, is reported by survey village location with 95% confidence interval as well as median and range of values elicited.
Location Mean Median Min Max
(a) Income expectation under proposed CFM regime Agarfa (n=35) 280 ± 99 225 -449 1,124 Goro (n=23) 323 ± 120 225 15 1,498 Delo Mena (n=77) 278 ± 36 225 11 749 All (n=135) 286 ± 38 225 -449 1,498 (b) Voluntary contribution to the community cooperative for sustainable forest management Agarfa (n=35) 8.65 ± 3.79 7.49 0.00 52.43 Goro (n=23) 3.78 ± 1.60 2.25 0.15 14.98 Delo Mena (n=77) 14.42 ± 6.28 5.99 0.30 149.80 All (n=135) 11.11 ± 3.78 4.49 0 149.80
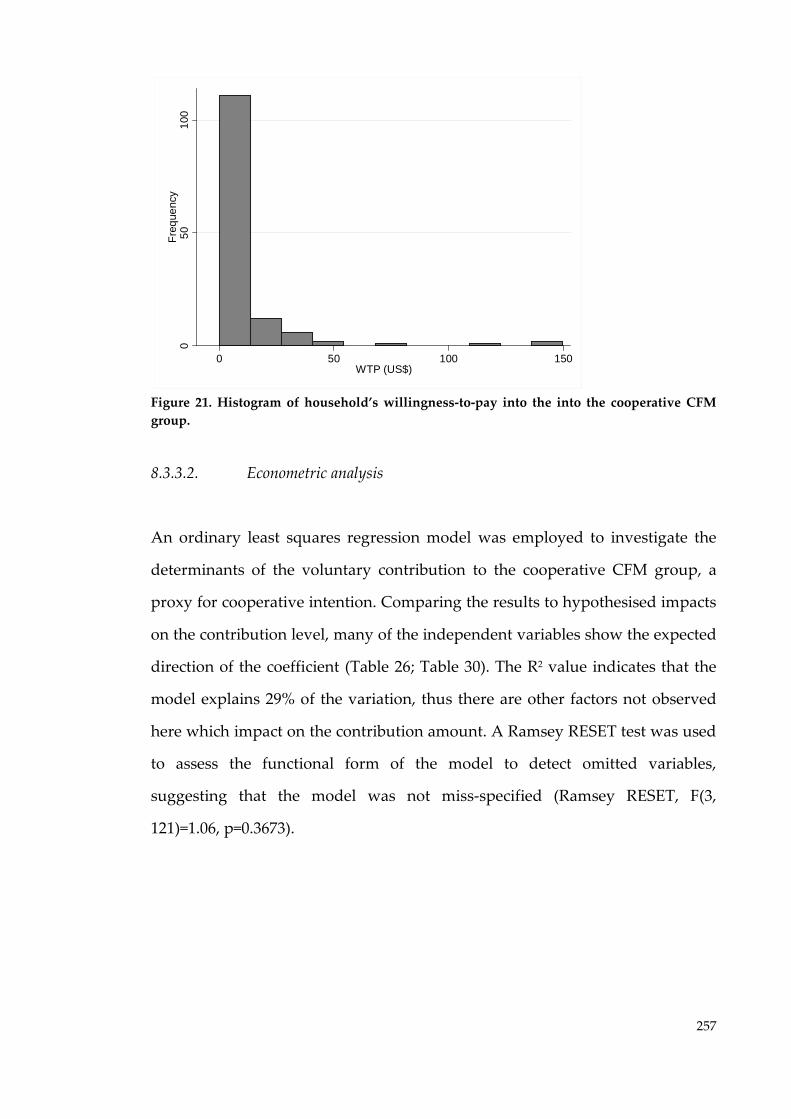
257
Figure 21. Histogram of household’s willingness-to-pay into the into the cooperative CFM group.
8.3.3.2. Econometric analysis
An ordinary least squares regression model was employed to investigate the
determinants of the voluntary contribution to the cooperative CFM group, a
proxy for cooperative intention. Comparing the results to hypothesised impacts
on the contribution level, many of the independent variables show the expected
direction of the coefficient (Table 26; Table 30). The R2 value indicates that the
model explains 29% of the variation, thus there are other factors not observed
here which impact on the contribution amount. A Ramsey RESET test was used
to assess the functional form of the model to detect omitted variables,
suggesting that the model was not miss-specified (Ramsey RESET, F(3,
121)=1.06, p=0.3673).
050
100
Freq
uenc
y
0 50 100 150WTP (US$)

258
Table 30. Determinants of household voluntary contribution into the cooperative CFM group. OLS regression results for predictors of household voluntary contribution towards sustainable forest management, a proxy for a household’s intention to cooperation in CFM. Showing beta coefficients, robust standard errors in parentheses and significance where; * p < 0.10, ** p < 0.05, *** p < 0.01.
Determinants OLS dependent variable:
log_voluntary contribution
lifp_yn 0.538*** (0.0971)
log_hifp 0.374** (0.177)
log_crop 0.278** (0.140)
income_expectation 0.00109*** (0.000367)
income_expectation2 -0.000000629*** (0.000000233)
HH_size -0.0583*** (0.0175)
education 0.00840 (0.0190)
village_years -0.00300 (0.00428)
agarfa 0.463*** (0.114)
goro -0.0840 (0.158)
constant -1.215** (0.557)
N R2
135 0.286
Forest income and crop income
Households that derive more income from the forest contributed more of their
income for sustainable use of the forest into the future. This was true for low-
impact forest products of honey and coffee, as hypothesised, as well as high-
impact forest products that will be limited under the intervention. Given that
the positive relationship between the voluntary contribution and high-impact
forest product income exists despite of the proposed limitations of the
intervention for high-impact forest product extraction, it could mean that
forests are being significantly degraded that individuals believe that forests

259
cannot continue to be used in the present way. This would agree with the
qualitative statements of many respondents. Crop income was predicted to
negatively impact the contribution amount, however, no such relationship was
found. In fact, a 10% increase in crop income predicts a 2.7% increase in the
voluntary contribution. This may be due to the small variation in agricultural
incomes found at the case study site (Chapter 6). It may also be due to higher
ability to pay due to the alternative income source. With no instrument
available, it is not possible to disentangle these effects further without further
research.
Income expectations
The income change that households expect in the first year of the Bale REDD+
Project intervention was found to be a non-linear inverse U-shape. It is first a
positive determinant of the voluntary contribution, then after a point, a
negative determinant. This relationship with cooperative intention shows a
diminishing impact of expected income on the contribution amount after a
turning point at US$833, which falls within the range of income expectations
between US$ -449 and US$1498. Interpretation of the coefficient shows that
while significant, the marginal effect of income expectations are small; a US$1
increase in income expectation increases the voluntary contribution by 0.07%. It
is interesting to observe this finding even when the village level effects are
controlled for, thus income expectations are not limited to locations where
forest returns are highest. The findings of perceived income expectations are
interpreted with caution as there are many factors that, themselves, will
influence these perceived income expectations and in the absence of a clear
instrument, this analysis is limited.
260
Demographic variables
As predicted household size is a negative determinant of the voluntary
contribution, likely due to competing demands for a large household’s income.
An additional member of the household is predicted to reduce the voluntary
contribution by close to 6%. It was predicted that the contribution amount
would increase as a result of education as well as age and experience on pro-
conservation behaviours as predicted in Chapter 6. However, no such
relationships were found.
Location
The impact of location on the voluntary contribution amount illustrates that
households in the dry forests of Agarfa have higher intention to cooperate
through the voluntary contribution proxy. This is interesting given that
descriptive statistics indicate highest contributions occur in the moist forests of
Delo Mena. However, as income from forest sources have been controlled for,
the locational differences may also capture village level differences in social
factors such as trust, reciprocity and reputation known to impact on
cooperation on a common pool resource (Ostrom, 2000, Castillo and Saysel,
2005). It may also represent different perceptions of the decline of forests in
survey locations; households in Agarfa may be willing to contribute more if
they perceive the decline of forest area to be of greater concern than at other
survey locations.
8.4. Discussion
Households in the BME hold strong pro-conservation attitudes. It is clear,
however, from general context statements that other livelihood concerns
compete with those of forest conservation, for example food security, health
and education. However, households appear willing to accept proposed Bale

261
REDD+ Project restrictions in return for improved forest management. On the
whole, households are largely aware that forest use is unsustainable and some
believe that current levels of forest use will result in complete forest loss in their
village after only two years. Travelling further each year to collect forest
products, households attribute forest losses to agricultural expansion and
fuelwood collection, the reported drivers of deforestation in the region and
country (BERSMP, 2006, R-PP, 2011). They also note that grazing in forests is
increasing and inhibiting tree re-growth. Population growth in the BME is also
seen as a clear driver of deforestation by survey respondents.
The pro-conservation attitudes and values held by households, in combination
with the observed rapid decline in forest resource, could explain the fact that
100% of households were willing to enter into the CFM scheme as it was
described to them. The overall disenchantment with the current status-quo
forest resource management may also be driving the desire for change.
Respondents reported much stricter forest management regimes in the past
under the Derg military government and a decline in adherence to rules of
forest use in the more recent past. Some respondents even noted that conflict is
arising both within and between communities as a result of declining forest
areas and breakdown of rules both traditional and otherwise. The potential for
conflict supports the calls, by respondents, that education, awareness, advice
and supervision are continuously provided by the authorities. The broad call
from respondents for good regulatory oversight is also useful for the Bale
REDD+ Project implementers. For CFM to be successful, communities need not
only values, but the institutions to put these in place which implementers will
be able to mediate and ensure persist over time (Gibson and Koontz, 1998).
The high positive response indicating that households’ would take part in the
intervention is an encouraging finding for the Bale REDD+ Project
262
implementers. Individuals have been shown to be conditionally cooperative on
the cooperation of others (Baland and Platteau, 1996, Fischbacher et al., 2001,
Castillo and Saysel, 2005). Greater cooperation may well deliver more emission
reductions. It is also promising to see that close to 80% of respondents believe
that other households will cooperate in CFM and that they will reciprocate by
following the rules of CFM. This could indicate high levels of social capital in
the BME which can increase cooperation on a common pool resource and
therefore longevity of the intervention (Ostrom, 2000, Castillo and Saysel, 2005).
These could remain from systems of traditional forest management that existed
in the Bale Mountains historically, but also representative of other cooperative
natural resource management strategies that currently exist, in mineral licks for
livestock, for example (Wakijira et al., in press). The intention of households to
take part in the CFM intervention is also based on their calculation of the costs
and benefits of doing so (Lubell, 2002). Of interest is that a high proportion of
households expected both their welfare and income to increase as a result of the
intervention.
The income expectations as a result of the intervention were high, however, and
there are dangers of such high perceived expectations from a conservation
intervention. Matta and Alvapatti (2006), exploring joint forest management in
India, find less than 50% of surveyed households perceived any benefit of the
forest conservation intervention five years after implementation and were
unclear why they joined. Such disenchantment with a conservation intervention
is likely to erode its success and longevity.
Many values are contained within a household’s perceived payoffs of
cooperating in the CFM intervention. In the BME, survey respondents
attributed perceived changes in income to increases in agricultural yields due to
improvements in the micro-climate, to increases in forest honey and coffee

263
incomes, and the ability to organise into cooperatives increasing business
opportunities and the likelihood of group led infrastructure improvements.
Carbon payments were also mentioned by a number of respondents as
contributing to increasing income. Particularly in light of the perceptions that
local climate will change so rapidly, the inability of the CFM intervention to
meet expectations in the BME could undermine its persistence. Withdrawal of
cooperation will challenge the success and functioning of the CFM, but for
REDD+ also threatens the permanence of emission reductions and may well
lead to no overall climate change mitigation benefits.
A proxy for strength of cooperative intention, a household’s voluntary
contribution to the forest management cooperative for more sustainable forest
management, was also impacted by a respondent’s perceived income benefits
from forests, greater income potential through being part of a cooperative and
carbon payments. This finding is consistent with the literature that shows that
perceived benefits of conservation interventions are important for both
participation and cooperation (Matta and Alavalapati, 2006, Sommerville et al.,
2010). The effect found here, although significant, has a small marginal effect on
the voluntary contribution. It is noted also however, that there may be an
element of circularity between households perceived benefits and their
intention to cooperate that needs to be investigated further. The household
incomes estimated from low-impact and high-impact forest products in Chapter
6, were also found to positively determine the strength of cooperative intent.
This reinforces the prediction that cooperation is driven by the salience of the
forest resource to households in the BME as found in the wider literature on
cooperation (Baland and Platteau, 1999, Lise, 2000, Agrawal and Chhatre, 2006).
Larger households have significantly lower cooperative intention, but this may
be due to the competing cash needs within the household. Education and age
264
were both found to not be significant determinants of a household’s voluntary
contribution. This is surprising compared to other literature that recognises the
positive impact of education and experience in pro-conservation behaviour
(Godoy and Contreras, 2001, Adhikari et al., 2004). It is possible the impact of
education has a more complex relationship than modelled here. For example,
Lise (2000) finds that participation in CFM is enhanced by low average family
education, but high survey respondent education. Similarly, the predicted
effects of age and experience may be obscured by the fact that younger
household heads may be more willing to adopt a new livelihood option and
older household heads are more risk averse (Ellis, 2000).
As noted in Section 8.1.1., no anchor of carbon payments was provided to
respondents. It was also not possible to determine the portion of perceived
income to carbon finance as opposed to increase forest or other incomes. The
differing perceptions between households mean that the results do need to be
interpreted with caution. This is particularly so given the early nature of carbon
finance in the Bale Mountains REDD+ project and the lack of benefit sharing
discussions and negotiations which means it is unclear if payments will reach
households or will distributed at community level. Despite this, it is interesting
that over half of the respondents suggested that carbon revenues should be
spent on common goods such as a mill and clinic. Such preferences for common
goods have been found in Mexico by Kosoy et al. (2008) where communities
received payments for biodiversity conservation and carbon on watersheds.
This, however, complicates REDD+ payments making them less conditional on
delivery of the emission reductions, largely irreversible and harder for
households to assess if the benefits of the common good will overcome the costs
of their cooperation (Gong et al., 2010, Pascual et al., 2010, Sommerville et al.,
2010).

265
Households also stated that livestock might be purchased with carbon
revenues. There is therefore a danger of reinvestment in environmentally
degrading activities, which highlights the need to include rules for livestock
grazing and to assess the impact of livestock on the forest resource base. This
could prevent secondary issues from arising after intervention at the case study
site. In Zimbabwe, for example, it was found that part of the revenues
communities of the CAMPFIRE programme derived from wildlife conservation
were invested in agricultural expansion and animal husbandry (Infield and
Namara, 2001).
Due to the sensitivity of the data, surveys were unable to elicit total household
wealth. The impact of wealth on cooperation in common pool resource
management is known although consensus on the direction of the impact does
not exist (see Poteete and Ostrom, 2004). Income from forests and agriculture,
two of the three main livelihood sources in the region were included in the
model and some wealth effects are captured within these variables. However,
further research could better account for wealth effects on the voluntary
contribution for example through household assets as proxies for wealth, or
through expenditure data. It could also be assessed if households would make
voluntary contributions in labour rather than cash given that two households
could were unable to contribute a cash portion of their income and larger
households are likely to have competing demands for cash. The household
survey elicited respondents’ thoughts on whether others would join the
intervention and if others would follow the rules in order to indicate levels of
trust and reciprocity. However, in light of low variation in responses to these
questions, they were omitted from the regression model. Further research could
go into more depth in capturing factors of social capital, including; relations of
trust; reciprocity and exchanges; common rules, norms and sanctions; and,
connectedness in networks and groups (Pretty, 2003). More attention to

266
behavioural and social aspects could improve the application of these findings
for on-the-ground policy design, and draw out village level differences beyond
hypothesised ecological forest characteristics.
The limitations of the voluntary contribution approach to households’ intention
to cooperate in the Bale REDD+ Project intervention mean that the value itself is
not interpreted here, but the determinants of the contribution are. Future
research could elicit a more incentive compatible value with more effort
dedicated to removing hypothetical and strategic biases. A further issue in
interpreting households’ intention to cooperate in the proposed intervention is
that the description of the intervention was necessarily short. A full list of the
costs and the benefits of the scheme were not provided to respondents such as
transaction costs, or allowable limits for forest product harvesting as these were
not yet available. It is possible therefore, that incomplete information results in
the high levels of willingness to take part in the intervention. As Adam’s et al.
(2003) note that the calculus of costs and benefits will be dependent on an
individual members knowledge and understanding of the collective action at
hand. Furthermore, successful collective action is also linked to perceptions of
fairness and cost sharing (Bardhan, 2000). This is, therefore, recognised as a
major limitation of this Chapter’s quantitative measure of intention to cooperate
in REDD+ via CFM.
PES is based on a payment incentive changing the behaviour of land use
managers to more conservation oriented behaviours. Chapters 6 and 7 indicated
that REDD+ revenues in the BME may be insufficient to offset the estimated
OCs of forest conservation. An integrated study of REDD+ via CFM in the BME,
this exploration of households’ attitudes and perceptions of the forest
management intervention indicate, however, that 100% of households would
enter into the proposed CFM arrangements. With clear concerns that the
267
current levels of forest use cannot continue into the future, households may
well be willing to incur a cost to move to a common property regime. This may
also reflect a history of traditionally managed forests in the Bale Mountains that
was reported to work more effectively at controlling forest product harvesting
than central or regional government has been. It may also indicate that non-
market benefits to the household are large. These non-market values could
include the value that households place on the devolution of use rights, on the
institutions and social capital established, or on empowerment provided under
the new forest management regime. In both cases this would infer that OCs
measures may overestimate the payment incentives required to generate the
desired level of forest conservation.
It is also found, however, that instead of incurring costs of the intervention as
Chapter 6 would predict, households are almost all expecting income gains as a
result of CFM implementation. Although more research is required to
disentangle the factors influencing perceived income changes and cooperative
intention at the case study site, it can be seen that qualitative attitudinal data
complements empirical cost estimates and can contribute towards intervention
design and implementation. The high expectations for REDD+ mechanisms, by
a number of forest stakeholders, have been noted elsewhere in the literature
(Clements, 2010). Ethiopia’s national REDD+ strategy clearly indicates that high
expectations for the mechanism exist in-country (R-PP, 2011). REDD+ project
development in the BME remains ‘in the pipeline’ despite four years of
discussions. Eliciting households’ perceived benefits of the proposed
intervention provides an early indicator that expectations are high and
improvements in information could ensure that these expectations are not
unreasonable.

268
Chapter 9: Discussion and conclusions
9.
9.1. Context
The potential for REDD+ to deliver climate mitigation benefits, to deliver
finance to developing countries, and to contribute to meagre forest conservation
budgets has resulted in a lot of excitement and discourse from academics,
NGOs, government organisations, and civil society. Substantial finance has
been pledged and transferred to build countries’ readiness for REDD+. This
flows despite uncertainty about the future financing mechanism for an
international REDD+ mechanism. However, successful local-level forest
management is required regardless of the financing mechanism and the scale at
which REDD+ is implemented.
REDD+ can operate as a PES scheme, which can aid the delivery of direct,
output based payments that are strongly addition to the business-as-usual
baseline and conditional on continued service provision. One way to generate
emission reductions from REDD+ is via CFM. Support for such approaches is
growing in forested countries, but there has been little consideration of how
REDD+ via CFM can be implemented on the ground if it is to operate as a PES
scheme. The literature on PES, and limited studies of REDD+ via CFM, appear
more ‘PES-like’. This results in low conditionality of payments on
environmental service delivery and uncertainties in whether carbon incentives
overcome the OCs of land for ongoing provision of climate change mitigation
services. The logic of collective action is also often ignored in PES, whereas it is
central to incentivising CFM.
The proposed Bale REDD+ Project in the Bale Mountains of Ethiopia is been
used to increase the understanding of how REDD+ can be implemented

269
through CFM as a local-level PES scheme. This chapter first presents a
discussion of the contributions to knowledge of this thesis, followed by policy
recommendations and limitations to these findings.
9.2. Contribution to knowledge
Forest carbon accounting
The uncertainty in estimates of forest carbon stocks are understudied despite
their challenge to the environmental effectiveness of a REDD+ mechanism. If
estimated emission reductions result from a choice of methodology rather than
changes in actual carbon stock, the integrity of REDD+ could be called into
question. This thesis contributes to forest carbon accounting literature by
illustrating that forest carbon stocks in the BME are insufficiently captured in
biome averaged data, often applied where data on key forest variables and
parameters, resources or capacity is scarce (Brown et al., 1989, Smith and Heath,
2001, Andersson et al., 2009). Such secondary data would underestimate forest
carbon density in the BME by as much as 63% in the moist forest and 58% in the
dry forest area.
It is recognised that numerous advances in GIS technology are being made to
improve forest area estimates, and the discourse on how to establish the BAU
baseline of deforestation from which avoided deforestation is assessed is active
(Achard et al., 2004, DeFries et al., 2007, Olander et al., 2008). Forested countries
are also undertaking reinvigorated forest inventory and accounting. The thesis
demonstrates that in the case of the Bale Mountains REDD+ project, the
financial implications of using secondary instead of primary data on forest
carbon stocks could lead to a two-fold difference in emission reductions;
equating to close to US$39 million over the 20-year project lifespan.

270
More accurate accounting of emissions reductions can ensure that REDD+
delivers real climate change mitigation benefits and countries are adequately
rewarded for the emission reductions generated. This thesis also highlights,
however, that even where more complex carbon accounting is undertaken,
forest carbon stock estimates still contain high levels of uncertainty arising from
the complexity in the ecosystems themselves and through sampling,
measurement and estimation error. The costs of increasing the precision of
forest carbon stock estimates could, therefore, be high. Despite this, this thesis
finds clear economic incentives for the investment of resources to reduce
uncertainty in forest carbon stock estimates.
The opportunity costs of REDD+ via CFM
The OCs of land are proposed to be one of the largest costs of REDD+ and can
be used to anchor the level of payment needed to achieve the desired level of
forest conservation, and so emission reductions (Pirard, 2008, Wertz-
Kanounnikoff, 2008, Pagiola and Bosquet, 2009, White and Minang, 2011). The
assessment of the OCs of REDD+ are often undertaken at a scale inappropriate
for the design of on-the-ground incentives for local-level PES, however, and
there has also been little attention paid to the OCs of REDD+ via CFM where
there are community property rights and community groups legally become
environmental service providers.
The OCs from a hectare of agricultural land in the survey year was estimated at
US$417/ha. If low-impact forest products - including bamboo, climber, coffee
and honey – offset the OCs of agricultural land, net OCs are estimated at
US$375/ha. Not all forest, however, is likely to have ended up as agricultural
land. The OCs of land from which high-impact forest products are harvested –
including timber and fuelwood – is estimated at US$28/ha. If low-impact forest
products can offset the OCs of high-impact forest products, the net OCs are

271
estimated at US$ -12/ha. In assessing the local OCs of land for a proposed
REDD+ via CFM project this thesis adds to the growing body of evidence that
shows how incorporating cost information in conservation planning can aid
interventions design (Polasky et al., 2001, Polasky et al., 2005, Naidoo et al.,
2006, Naidoo and Iwamura, 2007, Carwardine et al., 2008).
While the OCs of agriculture show the clear economic incentive to clear forest,
the headline OCs of forest products, obscure forest product use heterogeneity
across the Bale Mountains Eco-Region. The income from forest products was
found to be largely determined by survey location which dictated the
availability of forest products. In the dry forest and woodland survey locations,
forest coffee does not grow and incomes from high-impact forest products
exceed that of low-impact forest products. In the moist forest where forest
coffee and forest honey is available, income from low-impact forest products
exceeded that from high-impact forest products. The high value of forest coffee
is responsible for the finding that the net OCs of high-impact forest products,
offset by low-impact forest products for the whole Bale REDD+ Project region
appears negative. This implies that economic incentives do exist to conserve
moist forest as opposed to fuelwood and timber harvest, but it is likely that
other barriers relating to the current open access regime and lack of law
enforcement that prevent the realisation of these values leading to continued
forest decline. These research findings clearly demonstrate that a payment
incentive differentiated by location would be more efficient than one based on
the average OCs of forest products for the Bale REDD+ Project. This is further
exemplified by the fact that only 50% of the surveyed households were found to
gather low-impact forest products and therefore OCs of land would not be
offset by such forest products.
272
In addition to location, this research identified that more educated households
derive higher income from low-impact forest products and younger households
derived higher incomes from high-impact forest products. These findings
suggest that heterogeneity in OCs of land go beyond location. In the first
instance, the Bale REDD+ Project implementers could capitalise on the impact
of education through outreach and awareness programmes funded either
through core Project funds that current arise through donor support, or through
carbon revenues. Secondly, supplementary payment mechanisms could be
designed in the implementation of the REDD+ via CFM to protect the welfare of
younger households. This might be implemented following eroded traditional
forest management systems, for example, that redistributed forest coffee beans
to families unable to collect their own as a result of old age, physical disability
or illness under the pre-existing Gada systems of traditional forest management
(Wakijira et al., in press). Or, it could provide preferential access to alternative
fuel sources and fuel-efficient stoves to such households.
These findings also bring attention to the fact that all households rely on the
forest resource for fuelwood. High-impact forest products were mostly
consumed within the home whereas low-impact forest products were largely
sold by households. The Bale REDD+ Project intends to establish woodlots,
distribute fuel-efficient stoves, and to introduce systems to make biomass
briquettes to reduce the demand for fuelwood from the standing forest. These
would initially be funded or subsidised through the donors of the overall
BERSM Programme, but over time, could be supported with REDD+ revenues.
Payments to households may well even be made indirectly through fuelwood
allocation, rather than direct cash incentives.
Depending on how access to the woodlots is established under the Bale REDD+
Project, and on the success in uptake of more fuel-efficient stoves and biomass
273
briquettes, the OCs of high-impact forest products could decline over time.
Payments to overcome these OCs may therefore be considered a hurdle
payment to a more sustainable path of use after which the payment is no longer
necessary. On the other hand, if the demand for products such as fuelwood
cannot be met by woodlots - the establishment of which has been delayed –
then households might return to high-impact activities due to lack of
alternatives, thus eroding the REDD+ mechanism. Of course, both alternatives
will need to bear in mind rising demand for such forest products through
population growth.
Other studies of REDD+ via CFM have proposed more ‘PES-like’ interventions
(Nepstad et al., 2007, Peskett et al., 2008, Skutsch et al., 2011). The inability to
attribute land-change in the status quo and so service provision to a single
individual highlights the complexity of implementing PES under a common
property regime. With common property rights to many forest products,
households will have overlapping access and therefore costs and benefits on a
given unit of forest land. PES incentive payments are, therefore, hard to link to
a certain hectare of land enrolled or a given individual. Furthermore, given the
lack of land-use change models for the Bale Mountains Eco-region, it cannot be
predicted if land would be converted to agriculture or deforested through high-
impact forest product harvesting. If all households were to receive payments for
their potential OCs of land, therefore, it would impact on the effectiveness and
additionality of emission reductions and payments would be made without
emission reductions being generated. The conditionality and the efficiency that
PES was initially proposed to deliver would be challenged (Ferraro and Kiss,
2002, Ferraro and Simpson, 2002). Similarly, the conditionality of the payment
would be eroded and efficiency reduced. Possibly so much so that REDD+ no
longer becomes a cost-effective climate change mitigation option.
274
CFM approaches to REDD+, therefore, can break the pure economic models
required by PES in theory. This thesis suggests, however, that the attribution of
the OCs REDD+, particularly of agricultural production, could be improved
through benefit sharing mechanisms designed by the forest Community Based
Organisations (CBOs) themselves. In this way, REDD+ via CFM could still be
efficiently implemented with the conditionality and the efficiency that PES was
initially proposed to deliver. It is noted, however, that this thesis goes some
way in considering only one way to implement REDD+. By focussing on
REDD+ as a PES scheme, it does not consider alternative policy options that
include, for example, the imposition of private property rights, or
improvements in central government control and law-enforcement of forest
regulations, although these have so far proven ineffective in the BME. As
Ethiopia is pursuing a national REDD+ strategy it is likely that in the longer-run
a suite of measures will be employed to achieve emission reductions from
forestry activities.
In the Bale Mountains Eco-Region, CFM could build on the traditional forest
management practices than are reported to have eroded since the 20th Century.
Village elders used to be responsible for both the day-to-day jurisdiction of
forests, as well as the introduction of rules and norms of resource use (Wakijira
et al., in press). Groups of village elders still exist at kebele level and are still
called upon and respected for dispute settlement; all permissions to undertake
the surveys in this thesis, for example, went through the village elders in
addition to the local government authorities.
The implementation of REDD+ via CFM in the BME will require the
establishment of institutions to enable cooperation to occur. It is so far planned
that a subset of identifiable forest users will be formed as a CBO group which is
envisaged to be no more than 30 households. The forest group will be allocated

275
between 300 and 500 hectares and formalised in contracts signed between the
CBO and local government forest agency that will also formalise their duties
and responsibilities: including maintaining forest area, excluding those not
within the group and regulation of use from those within the group. The local
forest agency will undertake assessments of forest cover, and are expected to
enforce sanctions for non-compliance to both CBO and non-CBO members.
However, where rules are broken, individuals will first appear in front of
village elders to be sanctioned and it is likely that only repeat offenders will be
referred to the government authorities.
Given the strong history of traditional forest management within the Bale
Mountains Eco-Region, it is possible to envisage the REDD+ via CFM system
working. It is recognised, however, that new functions will be added to such
institutions. For example, more stringent monitoring and reporting of emission
reductions are likely to be required, and there may need to be greater oversight
from the local government agencies to ensure leakage does not occur from one
forest area to another and that emission reductions are permanent. The
potential revenues from carbon may also require the consideration of the
capacities of CBOs to manage finance, and the local government may act as an
intermediary to also absorb some of the risk and liability of non-permanence of
emission reductions. Additional support to develop such new functions will be
necessary, but with confidence in appropriate benefit-sharing mechanisms at
the community level and oversight from implementing agencies to avoid
possible social risks such as the capture of benefits by village elders or powerful
members of society and marginalisation of poorer social groups, local-level
knowledge could allocate payments in line with costs.

276
Scenarios of the OCs of forest conservation over time
The Bale REDD+ Project is typical of conservation interventions that lack
explicit goals and targets (Margules and Pressey, 2000). While the Bale REDD+
Project proposes the commercialisation of forest products, the promotion of
agricultural intensification, for example, there are no quantitative estimates of
impacts that can help understand how the OCs of land will change over time.
The scenario modelling of the OCs of land over the 20-year REDD+ project
period, using different assumptions, shows that small changes in the
assumptions of productivity of land uses significantly impact on the annual
OCs, cumulative OCs and the total OCs of the intervention. Although the
scenario storylines differ as a result of paucity of data on productivity trends
and degradation of land and forest, the scenarios show that the Bale REDD+
Project implementers should consider more carefully their conservation goals
and targets.
The total OCs of agriculture as a result of the Bale REDD+ Project were
estimated as the discounted revenues of agriculture, net of low-impact forest
products, for the total area of forest conserved during the 20-year project. The
three scenarios generated from small changes in assumptions, saw the OCs
range from US$121 million in an optimistic scenario to US$441 million in a
more pessimistic scenario. It is also clear from the scenarios analysis that while
the Bale REDD+ Project implementer’s sphere of influence might extend to the
proximate drivers of deforestation, such as agricultural expansion and wood
extraction, they are likely to be less influential to the underlying drivers of
deforestation such as population growth, wider market factors, demographic
trends, and/or institutions.
The consideration of economic incentives for conservation behaviours and
efforts to alter them have been established in many conservation interventions

277
(Brandon and Wells, 1992). However, quantifying these targets and assessing if
they are feasible is rare. The scenario backcasting from zero total OCs illustrates
that the prices of low-impact forest products would need to be multiplied by 11
times their current value to be sufficient to generate a situation where forest
conservation becomes an economically viable land use option. It seems
unrealistic, however, to expect the current price of bamboo, climber, coffee, and
honey to reach such highs. This appears unlikely even given the high demand
for specialist coffee in international markets (Wren, 2007); between 1993 and
2013 coffee Arabica has risen in value from just over US$1.50 per kg to over
US$4 per kg, it doesn’t match the required price rise in the scenario modelling
in the Bale Mountains Eco-Region (World Bank, 2013). Given also earlier
findings that show household incomes from forest products are highly spatially
explicit, such a price increase may not be feasible across the BME.
The scenario analysis also illustrates that REDD+ revenues may be insufficient
to overcome the OCs of agricultural land at the case study site. Of the market
mechanisms that could be used in conservation, carbon trading is thought to
have the greatest potential to capture positive externalities to the degree
required to make forest conservation economically viable (Richards, 1999).
Carbon is also often found to be the largest of the non-marketed environmental
service values of forests (Pearce, 1997). However, the scenarios illustrate that
the OCs of agriculture can be prohibitively high if carbon prices are relatively
low and efforts to increase agricultural productivity and add value to forest
products achieve little success. This depends on the scenario parameters, of
course, but may challenges the speed and optimism with which many
conservation practitioners are adopting REDD+ as a tool to finance forest
conservation, including in Ethiopia.
278
Overall, the findings demonstrate that the application of scenarios can be a
useful tool in conservation planning. Scenario modelling is not highly data
intensive and allows conservation implementers to break from established
patterns of thinking and critically evaluate their plans. The scenario modelling
undertaken does not provide a single answer for the OCs of REDD+ over time,
but highlights the need for further discussion of the intervention strategy and
the potential impact of its objectives.
Attitudes and intention to cooperate in REDD+ via CFM
This thesis also demonstrates that implementing REDD+ via CFM can defy the
purely economic logic of PES. All surveyed households stated a willingness to
take part in the proposed REDD+ via CFM intervention accepting the forest use
restrictions that this places upon them; modelled here as limitations on
expansion of agricultural land, high-impact forest product harvesting, and
duties and responsibilities resulting from the cooperative forest management
agreement. The thesis, therefore demonstrates how an understanding of local
environmental attitudes, perceptions of forest management and cooperative
intention could aid the identification of household incentives to provide
collective action beyond the analysis of the OCs of a hectare of forest
conservation.
Households in the BME were very aware of the declining forest area and
condition, as well as both the proximate and underlying drivers of deforestation
at the case study site. Their concerns about the resource base were held
alongside a general disenchantment regarding current forest management and,
overall, a preference for the traditional forest management arrangements that
had existed previously in the region. The complete willingness of survey
respondents to enter into the Bale REDD+ Project might be interpreted as the
perceived benefits of cooperation overcoming any perceived OC of foregone
279
land use and transaction costs due to time spent in meetings. This may include,
for example, the benefits of non-market values of water-shed protection,
cultural forest values, or recreational value, in addition to any value households
place on empowerment, the use rights to the forest, or the value of being part of
a cooperative.
While this research was unable to further deconstruct the perceived benefits
into their component parts, it is clear that households perceived that their
incomes would increase under the Bale REDD+ Project intervention. This
increase was attributed to higher production of low-impact forest products and
as a result of the ability to trade as a cooperative group, which may be
reasonable. However, perceptions of future incomes were also high due to
expectations of higher crop yields due to improved rainfall and local climate
regime. Additional uncertainty was added by the potential for carbon
payments, for which no anchor value was provided. Despite these limitations,
this finding highlights a possible danger of households’ high income
expectations of the Bale REDD+ Project intervention.
The need to manage expectations of the Bale REDD+ Project is particularly
acute given the uncertain nature of if, and how, carbon finance will reach the
community. The lack of an emission reductions purchase agreement and
adequate assessment of benefit-sharing mechanisms, it remains unclear how
much of carbon revenues will be absorbed by central or regional government,
and how much will reach households. This is exacerbated by uncertainty in
carbon rights and experience of handling carbon revenues from forestry in
Ethiopia. This will have impacts on the longevity of an intervention, and the
permanence of emission reductions as it may be less likely that household
expectations are met by the proposed intervention if less than the modelled
carbon revenues are available to communities. Furthermore, discussions on
280
who bears the liability for the non-permanence of emission reductions, and how
a risk buffer would be managed must be worked out by the Bale REDD+
Project. Although in Chapter 5 it is estimated that a 65% buffer for these risks is
set aside, the implications for the CBOs if emission reductions are not generated
for either natural or anthropogenic reasons must be further discussed.
This ex-ante study of attitudes and perceptions towards a conservation
intervention is rare. It demonstrates the potential importance of the logic of
collective action and how they might impact on the economic incentives
required for PES to operate in theory. It also demonstrates that ex-ante studies
can inform conservation planning and may well lead to better implementation
and longevity of the Project intervention in the BME in the longer-run.
9.3. Policy recommendations
With strong pro-conservation attitudes, the barriers to households undertaking
forest conservation measures in the BME appears to be their reliance on forest
products for subsistence use, particularly on fuelwood, and the de facto open
access regime. The additionality of emission reductions in the BME can,
therefore, be justified on the basis of clear policy barriers to more sustainable
forest management if the status-quo was to continue. The proposed
implementation of REDD+ via CFM can be considered a realistic intervention
given that resource appropriators are dependent on the forest resource for a
large portion of their livelihoods and share a common understanding of how
resource use affects others. The details of implementation of the intervention,
however, are vague and the findings of this thesis suggest three major policy
recommendations that will aid in the implementation of REDD+ via CFM at the
case study site.
281
Recommendation 1: Undertake a detailed forest inventory
The economic implications of forest carbon accounting methods were shown to
be substantial for the BME REDD+ project. The investment of resources in a
detailed forest inventory is therefore justified in the BME. This will increase the
environmental integrity of a REDD+ project but will also improve investor
confidence in the emission reductions generated. The development of land-use
and land use change models will also help to understand where deforestation is
taking place and to what forest land is converted too; agriculture, pasture or for
timber and fuelwood that can better model carbon losses and, therefore,
emission reductions, under the Bale REDD+ Project.
Recommendation 2: Develop quantitative objectives for the Bale REDD+ Project and
repeat scenario analysis
The scenario analysis highlights that the qualitative goals of the Bale REDD+
Project intervention and the lack of data on trends in land-use change result in
uncertainty over whether REDD+ revenues will overcome the OCs of forest
conservation. The Project implementers should work to quantify better their
objectives to intensify agriculture, efforts at which have persistently failed
across Ethiopia. Similarly, while adding value to low-impact forest products is
likely to be more within the influence of Project implementers, considerations of
the scale at which this can be achieved both by product and by location is
necessary.
In the BME, there is currently an adaptive management approach to the Project
intervention. For the Forest Management Agreements signed with
communities, two or three years may be required before changes in the forest
condition can really be observed. The implementers expect ex-post adjustments
of policy to be required. Repeating the scenario modelling exercise as the
intervention progresses will allow the review of the intervention in accordance
282
with this adaptive management approach. These scenarios should also be built
further through participatory approaches to incorporate more diverse views
from a variety of forest stakeholders. Breaking the mould and also undertaking
further ex-ante assessments of policy objectives at the case study site could
allow proactive steps can be taken to influence OCs of forest conservation and
to predict and plan for future eventualities.
Recommendation 3: Build and use OC information in REDD+ via CFM incentive
design
Forests are an important part of household’s livelihood strategies in the BME.
The Project intervention should be working to both minimise and overcome the
OCs of forest conservation through the options available to them and their
sphere of influence. The OCs of high-impact forest products are experienced by
all households at the case study site as modelled here. The conservation
implementers’ plans to develop woodlots and to expand the distribution of
more fuel-efficient stoves, may mean these are temporary OCs of REDD+.
However, with 99% of households gathering fuelwood and woodlot
establishment delayed, plans to meet household’s biomass needs should be
advanced rapidly if leakage of emission reductions is to be prevented and
avoided deforestation targets are to be met.
Considerations on how REDD+ revenue is to be shared also need to be made
with consideration of the project’s ability to attribute costs at fine-scales. The
Bale REDD+ Project implementers should consider the promotion of CBO and
kebele-level engagement in benefit sharing mechanism design. Regulatory
oversight, however, will be necessary to assess possible risks of elite capture
and for equity and conflict resolution. Such oversight was requested by
households in survey findings.
283
Bale REDD+ Project implementers should also consider that where payments
are made, differentiation by forest type can improve the efficiency of payments.
With lower OCs of high-impact forest products and lower net OCs of
agriculture, the redistribution of REDD+ revenues from moist forest areas to
dry forest or woodland areas may also be possible. With younger households
found to derive higher income from high-impact forest products, and anecdotal
evidence that younger households have limited access to agricultural land,
particular attention to the costs incurred by this demographic group should be
made in the intervention design. Bale REDD+ Project implementers could
consider how the intermediary organisation that will receive carbon finance,
might operate and make such allocation and redistribution decisions. In doing
so, it is clear that the expectations that households hold for the proposed Bale
REDD+ Project intervention are mediated and managed appropriately.
A caveat of these recommendations is that the use of estimates of the OCs of in
REDD+ via CFM design must be complemented with an understanding of the
attitudes and perceptions of communities local to the intervention. The logic of
collective action is commonly omitted in designing PES scheme incentives.
However, the urgency of the situation recognised by the survey respondents
and faith in restoration of traditional community forest management structures,
suggest that they will play a role in incentivising REDD+ via CFM in the BME.
These research findings also have wider implications for REDD+ via CFM:
• At present there is no standardised method to assess or communicate
uncertainty in emission reductions accounting and the principle of
conservativeness remains the dominant approach (Mollicone et al., 2007,
Grassi et al., 2008). Although this enables REDD+ to deliver real and
permanent emission reductions, adopting the principle of
284
conservativeness with zero uncertainty leaves policy makers without a
confidence interval. The implication could be lost opportunities for
climate change mitigation.
The uncertainty in forest carbon accounting should therefore be
quantified, reduced and communicated more appropriately. Tools such
as sensitivity analysis could be employed to identify which components
impact the most on total uncertainty which can then be prioritised for
further research. Decision-makers need to initiate discourse on the level
of uncertainty that is acceptable for a performance-based mechanism
such as REDD+. With many national forest inventories in developing
countries non-comprehensive and limited resources for new field
measurements, a portion of REDD+ readiness finance should be
earmarked for improving national forest inventories so that emission
reductions are credible.
• The implications of the apparent shift towards ‘PES-like’ implementation
of REDD+ via CFM needs to be considered in view of the need for
REDD+ to deliver real, permanent, and verifiable emission reductions
that are additional to the status-quo and conditional on service delivery.
Given the complexities of REDD+ via CFM with regards to attribution of
costs, more community-level benefit-sharing mechanisms might be
explored in both theory and through demonstration and pilot REDD+
activities.
A shift away from assessments of the OCs of agricultural land, towards
consideration of other OCs of land, such as subsistence forest products, is
also necessary. There are growing calls for REDD+ to ‘do no harm’ to
forest communities (CCBA, 2008, Griffiths, 2009). These are embodied in
285
the UNFCCC text safeguards that are intended to avoid negative impacts
on the poor, on biodiversity, on food security and national sovereignty.
This can be interpreted as going beyond ensuring that households’ costs
of forest conservation are to be overcome, but more consideration of how
such safeguards can be operationalised is needed.
• Moving to common property regimes, households may be willing to
incur costs of a property regime change. The logic of collective action
implies that estimates of the OC of land can overestimate the payment
incentives required to generate the desired level of forest conservation.
Opportunities for climate change mitigation may be lost if schemes are
not implemented due to apparently prohibitive OCs of REDD+. More
research is required on how collective action influences households’
incentives to cooperate in REDD+ via CFM.
9.4. Limitations and recommendations for future research
This research has emphasised the uncertainty that exists in forest carbon stock
accounting for REDD+ projects. The focus of the discussion is on uncertainty
from sampling error and in market variables. It is acknowledged, however, that
there are other sources of uncertainty arising in carbon stock estimation,
including measurement and estimation error. The complex forest carbon stock
assessment undertaken here relies on allometric equations that arise from Asian
and Latin American tree datasets. Destructive sampling to generate allometric
equations specific to Ethiopia or East Africa could be generated through further
research. Furthermore, the primary data estimate of forest carbon stock omits
other carbon pools which will also contain uncertainty in their measurement
and need to be further investigated.
286
In estimating the potential emission reductions and revenues of a REDD+
project in the BME, a fixed historical deforestation baseline of 4% is applied and
it is assumed that the conservation objective meets its stated avoided
deforestation targets. Further research into developing a BAU baseline of
deforestation could provide an improved estimate for emission reductions and,
therefore, REDD+ revenues. The emission reductions accounting also ignores
emission reductions that may be generated from reduced degradation, forest
conservation, sustainable management of forests and the enhancement of forest
carbon stocks; all included within the definition of REDD+. Avoided forest
degradation, in particular, may be relevant for CFM (e.g. Chhatre and Agrawal,
2009). Further research into the causes of degradation and consequences of
CFM on forest quality could lead to better emission reductions accounting in
the proposed BME REDD+ intervention.
As a result of the logistical and permission constraints encountered during data
collection, a major limitation of this research is that the number of survey
locations was limited. With three survey locations with three different forest
types the effects due to forest and the effects due to village characteristics
cannot be separated. Expanding this research into other survey locations could
reinforce these findings and provide a better understanding of what is driving
the differences observed between survey locations. Future household surveys
could also increase the sample size, and address the seasonality of forest
product harvesting and of market prices. The omission of female headed
households in this study is also an important area where further investigation
should be pursued. Cultural barriers in the BME prevented enumerators
approaching females within their households. Per capita income of female
headed households in Ethiopia can be as low as 60% of the per capita income of
male-headed households (Yemiru et al., 2010). This indicates that possible

287
welfare risks to female headed households as a result of REDD+ via CFM in the
BME need to be further investigated.
This thesis is predominantly a financial analysis of REDD+ via CFM with a
focus on the environmental service of climate change mitigation. A number of
other non-market values that households derive from the forest ecosystem are
not assessed. Given the focus in the international REDD+ debate on the need to
secure such co-benefits, further investigation on how these impact on costs is
necessary. Although these values are complex to calculate at a household level
and ecosystem services can be complex to quantify, methods are available that
could investigate further how non-market benefits impact on the incentives
required to generated the desired level of service provision for REDD+ (e.g.
OECD, 2002, Pagiola et al., 2005b).
The financial analysis undertaken here was also not able to consider the impact
of the intervention on household’s income from livestock. Grazing is currently
allowed and occurs both in and outside of the forest. Under the proposed
Project intervention, this may change through measures such as rotational
grazing agreements which prevent forest re-growth being destroyed by
livestock. Research in the BME is underway to assess the deforestation impact
of livestock. The development of this research could include the OCs of the
Project intervention resulting from grazing land restrictions.
In order to model OCs of REDD+ in the BME, land uses were simplified into
agriculture, low-impact forest production and high-impact forest production.
More research could develop these land categories to explore how OCs may be
affected by land characteristics such as soil fertility, altitude and/or land use
practices. The assumptions of the non-rival nature of low-impact forest
products with the intervention and the rival nature high-impact forest products
288
with the intervention require more attention. There is anecdotal evidence that
honey yields are declining in the highland regions, with flowering species
suffering from degradation. Forest coffee although a natural plant is
encouraged through thinning of the forest canopy and harvest of forest coffee
may be excludable. A better consideration of the sustainability and
excludability of these low-impact forest products, with a view to understanding
if household production can feasibly be extended outside of the current
production boundary, is necessary.
Similarly, the harvest of timber and fuelwood – both high-impact forest
products – may be allowed within sustainable limits; defined as a level of
extraction below the mean annual increment of biomass. An ex-ante study of
REDD+ via CFM in the BME, the by-laws of CBOs that will define the use and
management of forests are yet to be established. Designed through
participatory processes, early experience in the BME shows that CBOs are
limiting the harvest of fuelwood through restrictions on the number of days
that households have access to the forest. As by-laws emerge and measures to
reduce and remove the fuelwood and timber demands on natural forest areas
are put in place, the estimate of the OCs of high-impact forest products could be
adjusted appropriately.
The transaction costs that households may incur as a result of the
implementation will also become more obvious as REDD+ via CFM is rolled out
across the BME. Such information as it emerges could also be included in the
analysis of the impacts of REDD+ on households. It is noted in Chapter 4 that
transaction costs will also be incurred by household participating in the scheme
including negotiation, monitoring and enforcement costs and that these costs
may not be evenly distributed over socio-demographic groups (Meshack et al.,
2006, Adhikari and Lovett, 2006). In the BME, these transaction costs are likely
289
to entail weekly meetings and the patrolling of forest in critical harvest times.
While emerging by-laws state that all members should contribute to patrolling,
the committee members appear to be taking on this burden in the few
established groups. The time burdens that this places on households may well
influence their payoffs and therefore cooperation in the intervention. Analysis
of these costs are important, as while this thesis assumes the OCs of land to be
the highest costs incurred by households, this assumption has not been tested.
An improvement to this thesis would be to estimate the shadow prices of
products for both subsistence and sale on markets, instead of applying market
prices that are likely to have led to the overestimation of OCs of land. Rural
households will operate within market imperfections and constraints and will
have differing transaction costs to access and participate in markets (Sadoulet
and de Janvry, 1995). Utilisation of non-separable household models where
production and consumption behaviour is linked, would improve this research.
Investing resources in estimating the shadow prices of products for each
household would also give a better estimate of OCs of land. This is particularly
true as many products were consumed at home and shadow prices are
generally lower than market prices.
The scenario analysis required further assumptions to be made in order to
model the OCs of REDD+ over time. This included the assumptions that: all
deforestation results from conversion to agricultural land use; once transformed
land remains under that use; and, that households will generate income on this
land to the same level of a household’s existing income from that use. These
assumptions resulted from a lack of data on deforestation dynamics at the case
study site. NGOs in the BME are using GIS imagery to analyse land use and
trends in land-use change. As more data become available on the proportion of
deforestation from each land use, models of deforestation risk could be

290
developed. A better understanding of which households are expanding
agricultural land, where, and on what type of land this occurs could explore
whether newly converted land is more marginal, or if one-off benefits and costs
of land conversion exist. Scenarios could be improved through the inclusion of
price feedbacks from the changing availability of land (e.g. Busch et al., 2009,
Fisher et al., 2011). Data on population growth and its impact on land-use
change may also focus attention on emerging families and their access to CFM
that are largely unacknowledged in the intervention as it stands.
While Chapter 8 highlights the importance of an understanding of the attitudes
and perceptions of local stakeholders, there are clear limitations to the
quantitative measure of behavioural intention, the voluntary contribution, and
in disentangling the willingness of households to take part in the proposed
intervention. Further research could explore this further, assessing in more
detail how and why households believe their incomes will increase under the
intervention. Factors such as social capital at survey locations including:
relations of trust; reciprocity and exchanges; common rules, norms and
sanctions; and, connectedness in networks and groups can also be explored in
much greater detail as social capital is known to impact on cooperation (Pretty,
2003).
This thesis does not consider in various mechanism by which revenues could
reach households due to time restrictions on material to be covered.
Throughout, it is assumed that the revenues will be able to reach households
after the costs of implementation are met. With no Emission Reductions
Purchase Agreement for the BME REDD+ project, no agreements have been
made on the benefit-sharing mechanism or the amount of revenues that will be
absorbed by other stakeholders, such as central or regional government.
Furthermore, the impact that risk and time preferences will play in the design
291
of PES incentives and contract design are not considered here (Ferraro, 2008,
Knoke et al., 2011). While the scenario analysis indicates that forest
conservation could become an economically rational land use option, this could
only hold if a household can take a 20-year view. The subsistence households of
the BME may be unable or unwilling to take such a long term view. Time and
risk preferences factors of households in the BME warrant further research as
the REDD+ project progresses.
Finally, it is acknowledged that this thesis considers only forest stakeholders
that live locally to the forest at the case-study site. These are considered here to
be the most affected party from REDD+ development in the BME. However,
REDD+ planning and implementation will need due consideration of other
forest stakeholders including the private sector (e.g. small-scale wood
enterprises and non-wood forest enterprises), urban dwellers that are
dependent on forest products brought to markets, and local and central
governments. A variety of forest stakeholders will incur OCs of REDD+ and
should be considered in REDD+ via CFM intervention design.
9.5. Conclusion
This thesis is a rare ex-ante analysis of the incentives to deliver REDD+ via CFM
and exploration of how such a mechanism might be implemented on-the-
ground. I demonstrate that forest carbon stock accounting uncertainties are
being overlooked, but have substantial implications for the environmental
integrity of a REDD+ mechanism. I demonstrate that the focus on the OCs of
agriculture in studies of REDD+ omit important OCs of subsistence forest
products. This research highlights a drift towards more PES-like
implementation of REDD+ via CFM that at first glance can appear better fitting
with local realities. However, I suggest that the efficiency and conditionality of
292
PES can be maintained through placing more trust in community-level
institutions to attribute costs and engage in incentive design and benefit-
sharing. The application of scenarios to model the OCs of forest conservation
over time illustrates that REDD+ revenues may not be sufficient to overcome
the OCs of forest conservation if carbon prices are low and efforts to intensify
agriculture and add value to forest products are limited in their success.
Proactive measures can be undertaken by the Bale REDD+ Project
implementers, however, towards overcoming and reduce these OCs. Finally, I
show that generating an understanding of stakeholders’ attitudes towards
forest management and the use of the resource base will allow better
consideration of socio-cultural factors for cooperation in conservation that will
go beyond payment incentives that PES theory highlights. These themselves
could help tip the balance for forest conservation even if the OCs of land appear
prohibitive.

293
Literature cited
ABRAR, S., MORRISEY, O. & RAYNER, T. 2004. Aggregate Agricultural Supply
Response in Ethiopia: A Farm-Level Analysis. Journal of International Development, 16, 605-620.
ACHARD, F., EVA, H. & MAYAUX, P. 2001. Tropical forest mapping from coarse spatial resolution satellite data: production and accuracy assessment issues. International Journal of Remote Sensing, 22, 2741-2762.
ACHARD, F., EVA, H. D., MAYAUX, P., STIBIG, H. J. & BELWARD, A. 2004. Improved estimates of net carbon emissions from land cover change in the tropics for the 1990s. Global Biogeochemical Cycles, 18, B2008.
ADAMS, V. M., PRESSEY, R. L. & NAIDOO, R. 2010. Opportunity costs: Who really pays for conservation? Biological Conservation, 143, 439-448.
ADAMS, W. M., BROCKINGTON, D., DYSON, J. & VIRA, B. 2003. Managing Tragedies: Understanding Conflict over Common Pool Resources. Science, 302, 1915-1916.
ADHIKARI, B. 2005. Poverty, property rights and collective action: understanding the distributive aspects of common property resource management. Environment and Development Economics, 10, 7-31.
ADHIKARI, B. & DI FALCO, S. 2009. Social Inequality, Local Leadership and Collective Action: An Empirical Study of Forest Commons. European Journal of Development Research, 21, 179-194.
ADHIKARI, B., DI FALCO, S. & LOVETT, J. C. 2004. Household characteristics and forest dependency: evidence from common property forest management in Nepal. Ecological Economics, 48, 245-257.
ADHIKARI, B. & LOVETT, J. C. 2006. Transaction costs and community-based natural resource management in Nepal. Journal of Environmental Management, 78, 5-15.
ADHIKARI, B., WILLIAMS, F. & LOVETT, J. C. 2007. Local benefits from community forests in the middle hills of Nepal. Forest Policy and Economics, 9, 464-478.
AGRAWAL, A. 2001. Common Property Institutions and Sustainable Governance of Resources. World Development, 29, 1649-1672.
AGRAWAL, A. 2003. Sustainable Governance of Common-Pool Resources: Context, Methods, and Politics. Annual Review of Anthropology, 32, 243-262.
AGRAWAL, A. & ANGELSEN, A. 2009. Using community forest management to achieve REDD+ goals. In: ANGELSEN, A., BROCKHAUS, M., KANNINEN, M., SILLS, E. S., W.D & WERTZ-KANOUNNIKOFF, S. (eds.) Reasling REDD+ National strategy and policy options. Bogor, Indonesia: Centre for International Forestry Research.
294
AGRAWAL, A. & CHHATRE, A. 2006. Explaining success on the commons: Community forest governance in the Indian Himalaya. World Development, 34, 149-166.
AGRAWAL, A. & GIBSON, C. C. 1999. Enchantment and Disenchantment: The Role of Community in Natural Resource Conservation. World Development, 27, 629-649.
ALCAMO, J. 2001. Scenarios as tools for international environmental assessments. Copenhagen, Denmark: European Environment Agency.
ALIX-GARCIA, J., JANVRY, A., SADOULET, E. & TORRES, J. 2005. An Assessment of Mexico's Payment for Environmental Services Program. Berkley, US: University of California.
AMENTE, G. & TADESSE, T. 2004. The contributions of a participatory forest management (PFM) to good governance: the case of WAJIB approach in Ethiopia.
ANDERSSON, K. & AGRAWAL, A. 2011. Inequalities, institutions, and forest commons. Global Environmental Change, 21, 866-875.
ANDERSSON, K., EVANS, T. & RICHARDS, K. 2009. National forest carbon inventories: policy needs and assessment capacity. Climatic Change, 93, 69-101.
ANDO, A., CAMM, J., POLASKY, S. & SOLOW, A. 1998. Species distributions, land values, and efficient conservation. Science, 279, 2126-2128.
ANDREONI, J. 1989. Giving with Impure Altruism: Applications to Charity and Ricardian Equivalence. Journal of Political Economy, 97, 1447-1458.
ANGELSEN, A. 1999. Agricultural expansion and deforestation: modelling the impact of population, market forces and property rights. Journal of Development Economics, 58, 185-218.
ANGELSEN, A. 2008. Moving Ahead with REDD: Issues, Options and Implications. Bogor, Indonesia: CIFOR.
ANGELSEN, A. & KAIMOWITZ, D. 1999. Rethinking the Causes of Deforestation: Lessons from Economic Models. The World Bank Research Observer, 14, 73-98.
ANGELSEN, A., LARSEN, H. O., LUND, J. F., SMITH-HALL & WUNDER, S. (eds.) 2011. Measuring livelihoods and environmental dependence: methods for research and fieldwork: Earthscan.
ANGELSEN, A. & WUNDER, S. 2003. Exploring the Forest-Poverty Link: Key Concepts, Issues and Research Implications. Bogor, Indonesia: Centre for International Forestry Research.
ANTINORI, C. & SATHAYE, J. 2007. Assessing Transaction Costs of Project-based Greenhouse Gas Emissions Trading. Berkeley: Lawrence Berkeley National Laboratory, Formal Report LBNL-57315.
ARMSWORTH, P. R., DAILY, G. C., KAREIVA, P. & SANCHIRICO, J. N. 2006. Land market feedbacks can undermine biodiversity conservation. Proceedings of the National Academy of Sciences, 103, 5403-5408.
295
ARMSWORTH, P. R., GASTON, K. J., HANLEY, N. D. & RUFFELL, R. J. 2009. Contrasting approaches to statistical regression in ecology and economics. Journal of Applied Ecology, 46, 265-268.
ARNOLD, J. E. M. 2001. Forests and People: 25 years of Community Forestry. Rome, Italy: FAO.
ARNOLD, M. & TOWNSON, I. 1998. Assessing the potential of forest product activities to contribute to rural incomes in Africa. London, UK: Overseas Development Institute.
ARROW, K. J., SOLOW, R., PORTNEY, P., LEAMER, E., RADNER, R. & SCHUMAN, H. 1993. Report of the NOAA Panel of Contingent Valuation. Washington, DC: Resources for the Future.
ASQUITH, N. M., VARGAS, M. T. & WUNDER, S. 2008. Selling two environmental services: In-kind payments for bird habitat and watershed protection in Los Negros, Bolivia. Ecological Economics, 65, 675-684.
ASQUITH, N. M., VARGAS RIOS, M. T. & SMITH, J. 2002. Can forest carbon projects improve rural livelihoods?: analysis of the Noel Kempff Mercado Climate Action Project, Bolivia. analysis of the Noel Kempff Mercado Climate Action Project, Bolivia.
AUKLAND, L., MOURA COSTA, P. & BROWN, S. 2002. A Conceptual Framework and Its Application for Addressing Leakage: The Case of Avoided Deforestation. Climate Policy, 94, 1-15.
BABCOCK, B. A., LAKSHMINARAYAN, P. G., WU, J. & ZILBERMAN, D. 1997. Targeting Tools for the Purchase of Environmental Amenities. Land Economics, 73, 325-339.
BABULO, B., MUYS, B., NEGA, F., TOLLENS, E., NYSSEN, J., DECKERS, J. & MATHIJS, E. 2009. The economic contribution of forest resource use to rural livelihoods in Tigray, Northern Ethiopia. Forest Policy and Economics, 11, 109-117.
BACCINI, A., LARPORTE, N., GOETZ, S., SUN, M. & DONG, H. 2008. A first map of tropical Africa's above-ground biomass derived from satellite imagery. Environmental Research Letters, 3, 045011.
BAKER, D. J., RICHARDS, G., GRAINGER, A., GONZALEZ, P., BROWN, S., DEFRIES, R., HELD, A., KELLNDORFER, J., NDUNDA, P., OJIMA, D., SKROVSETH, P.-E., SOUZA JR, C. & STOLLE, F. 2010. Achieving forest carbon information with higher certainty: A five-part plan. Environmental Science & Policy, 13, 249-260.
BALAND, J. M. & PLATTEAU, J. P. (eds.) 1996. Halting Degradation of Natural Resources: Is There a Role for Rural Communities?, Oxford: Clarendon Press.
BALAND, J. M. & PLATTEAU, J. P. 1999. The Ambiguous Impact of Inequality on Local Resource Management. World Development, 27, 773-788.
BALAND, J. M. & PLATTEAU, J. P. 2003. Chapter 4 Economics of common property management regimes. In: KARL-GÖRAN, M. & JEFFREY, R. V. (eds.) Handbook of Environmental Economics. Elsevier.
296
BALMFORD, A., GASTON, K. J., BLYTH, S., JAMES, A. & KAPOS, V. 2003. Global variation in terrestrial conservation costs, conservation benefits, and unmet conservation needs. Proceedings of the National Academy of Sciences of the United States of America, 100, 1046-1050.
BALMFORD, A., GASTON, K. J., RODRIGUES, A. S. L. & JAMES, A. 2000. Integrating costs of conservation into international priority setting. Conservation Biology, 14, 597-605.
BARDHAN, P. 1993. Symposium on Management of Local Commons. The Journal of Economic Perspectives, 7, 87-92.
BARDHAN, P. 2000. Irrigation and Cooperation: An Empirical Analysis of 48 Irrigation Communities in South India. Economic Development and Cultural Change, 48, 847-865.
BELL, W. F. (ed.) 1997. Foundations of futures studies, History, Purpose and Knowledge of Futures Studies - Human Science for a New Era: Transaction Publishers.
BELLASSEN, V. & GITZ, V. 2008. Reducing Emissions from Deforestation and Degradation in Cameroon: Assessing costs and benefits. Ecological Economics, 68, 336-344.
BENHAM, A. & BENHAM, L. 2000. Measuiring the Transaction Costs. In: MENARD, C. (ed.) Institutions, Contracts and Organisations: Perspectives from New Institutional Economics. Cheltenham, UK: Edward Elgar Publishing.
BENNETT, M. 2008. China's sloping land conversion program: Institutional innovation or business as usual? Ecological Economics, 65, 699-711.
BERSMP 2006. Bale Eco-Region Sustainable Management Programme Project Document. Addis Ababa, Ethiopia: FARM-Africa/SOS Sahel.
BERSMP 2008. Annual Report 2008. Addis Ababa, Ethiopia: Bale Eco-Region Sustainable Management Programme (BERSMP).
BERSMP 2009. Six Months Report - First Semester 2009. Addis Ababa, Ethiopia: Bale Eco-Region Sustainable Management Programme (BERSMP).
BISHOP, J. T. 1999. Valuing Forests: A Review of Methods and Applications in Developing Countries. London, UK: International Institute for Environment and Development.
BISHOP, P., HINES, A. & COLLINS, T. 2007. The current state of scenario development: an overview of techniques. Foresight - The journal of future studies, strategic thinking and policy, 9, 5-25.
BLOMLEY, T., PFLIEGNER, K., ISANGO, J., ZAHABU, E., AHRENDS, A. & BURGESS, N. 2008. Seeing the wood for the trees: an assessment of the impact of participatory forest management on forest condition in Tanzania. Oryx, 42, 380-391.
BLOMLEY, T. & RAMADHANI, H. 2006. Going to scale with Participatory Forest Management: early lessons from Tanzania. International Forestry Review, 8, 93-100.

297
BMDC 2003. Sociology and Anthropology in the BMNP and Mena-Angetu National Forest Priority Area. Addis Ababa, Ethiopia: DGIS-WWF Ethiopia Project Report.
BMNP 2007. Bale Mountains National Park: General Management Plan 2007-2017. Addis Ababa, Ethiopia: BMNP with Frankfurt Zoological Society.
BOHENSKY, E. L., REYERS, B. & VAN JAARSVELD, A. S. 2006. Future ecosystem services in a Southern African river basin: a scenario planning approach to uncertainty. Conservation Biology, 20, 1051-1061.
BONAN, G. B. 2008. Forests and Climate Change: Forcings, Feedbacks, and the Climate Benefits of Forests. Science, 320, 1444-1449.
BOND, I., GRIEG-GRAN, M., WERTZ-KANOUNNIKOFF, S., HAZLEWOOD, P., WUNDER, S. & ANGELSEN, A. 2009. Incentives to sustain forest ecosystem services: A review and lessons for REDD. Natural Resource Issues No. 16. International Institute for Environment and Development, London, UK, with CIFOR, Bogor, Indonesia, and World Resources Institute, Washington D.C., USA.
BÖRJESON, L., HÖJER, M., DREBORG, K. H., EKVALL, T. & FINNVEDEN, G. 2006. Scenario types and techniques: Towards a user's guide. Futures, 38, 723-739.
BÖRNER, J., MBURU, J., GUTHIGA, P. & WAMBUA, S. 2009. Assessing opportunity costs of conservation: Ingredients for protected area management in the Kakamega Forest, Western Kenya. Forest Policy and Economics, 11, 459-467.
BÖRNER, J. & WUNDER, S. 2008. Paying for avoided deforestation in the Brazilian Amazon: From cost assessment to scheme design. International Forestry Review, 10, 496-511.
BÖTTCHER, H., EISBRENNER, K., FRITZ, S., KINDERMANN, G., KRAXNER, F., MCCALLUM, I. & OBERSTEINER, M. 2009. An assessment of monitoring requirements and costs of Reduced Emissions from Deforestation and Degradation. Carbon Balance and Management, 4, doi:10.1186/1750-0680-4-7.
BOUCHER, D. 2008. What REDD Can Do: The Economics and Development of Reducing Emissions from Deforestation and Forest Degradation. Washington DC, USA: Tropical Forest and Climate Initiative, Union of Concerned Scientists.
BRADFORD, J. B., WEISHAMPEL, P., SMITH, M.-L., KOLKA, R., BIRDSEY, R. A., OLLINGER, S. V. & RYAN, M. G. 2010. Carbon pools and fluxes in small temperate forest landscapes: Variability and implications for sampling design. Forest Ecology and Management, 259, 1245-1254.
BRANDON, K. E. & WELLS, M. 1992. Planning for People and Parks: Design Dilemmas. World Development, 20, 557-570.
BROMLEY, D. (ed.) 1992. Making the Commons Work: Theory, Practice, and Policy, San Francisco, California: ICS Press.
298
BROOKS, T. M., MITTERMEIER, R. A., DA FONSECA, G. A. B., GERLACH, J., HOFFMANN, M., LAMOREUX, J. F., MITTERMEIER, C. G., PILGRIM, J. D. & RODRIGUES, A. S. L. 2006. Global Biodiversity Conservation Priorities. Science, 313, 58-61.
BROWN, S. 1997. Estimating biomass and biomass change of tropical forests: a primer. FAO Forestry Paper 134. Rome: FAO.
BROWN, S. 2002. Measuring, Monitoring, and Verification of Carbon Benefits for Forest-Based Projects. Philosophical Transactions: Mathematical, Physical and Engineering Sciences, 360, 1669-1683.
BROWN, S. & GASTON, G. 1995. Use of forest inventories and geographic information systems to estimate biomass density of tropical forests: Application to tropical Africa. Environmental Monitoring and Assessment, 38, 157-168.
BROWN, S., GILLESPIE, A. J. R. & LUGO, A. E. 1989. Biomass Estimation Methods for Tropical Forests with Applications to Forest Inventory Data. Forest Science, 35, 881-902.
BROWN, S., HALL, M., ANDRASKO, K., RUIZ, F., MARZOLI, W., GUERRERO, G., MASERA, O., DUSHKU, A., DEJONG, B. & CORNELL, J. 2007. Baselines for land-use change in the tropics: application to avoided deforestation projects. Mitigation and Adaptation Strategies for Global Change, 12, 1001-1026.
BROWN, S. & LUGO, A. E. 1992. Aboveground biomass estimates for tropical moist forests of the Brazilian Amazon. lntereieneia, 17, 8-18.
BRUIJNZEEL, L. A. 2004. Hydrological functions of tropical forests: not seeing the soil for the trees? Agriculture, Ecosystems & Environment, 104, 185-228.
BUCKI, M., CUYPERS, D., MAYAUX, P., ACHARD, F., ESTREGUIL, C. & GRASSI, G. 2012. Assessing REDD+ performance of countries with low monitoring capacities: the maxtrix approach. Environmental Research Letters, 7, 014031.
BUSCH, J., STRASSBURG, B., CATTANEO, A., LUBOWSKI, R., BRUNER, A., RICE, R., CREED, A., ASHTON, R. & BOLTZ, F. 2009. Comparing climate and cost impacts of reference levels for reducing emissions from deforestation. Environmental Research Letters, 4, doi:10.1088/1748-9326/4/4/044006.
BYERLEE, D., SPIELMAN, D. J., ALEMU, D. & GAUTAM, M. 2007. Policies to Promote Cereal Intensification in Ethiopia: A Review of Evidence and Experience. Washington DC: International Food Policy Research Institute.
BYRON, N. & ARNOLD, M. 1999. What Futures for the People of the Tropical Forests? World Development, 27, 789-805.
CACHO, O. J., MARSHALL, G. R. & MILNE, M. 2005. Transaction and abatement costs of carbon-sink project in developing countries. Environment and Development Economics, 10, 597-614.
299
CALDER, I., AMEZAGA, J., AYLWARD, B., BOSCH, J., FULLER, L., GALLOP, K., GOSAIN, A., HOPE, R., JEWITT, G., MIRANDA, M., PORRAS, I. & WILSON, V. 2004. Forest and Water Policies: The need to reconcile public and science perceptions. Geologica Acta, 2, 157-166.
CAMPBELL, B., MANDANDO, A., NEMARUNDWE, N., JONG, W., LUCKRET, M. & MATOSE, F. 2001. Challenges to proponents of common property resource systems: despairing voices from the social forests of Zimbabwe. World Development, 29, 589-600.
CAMPBELL, B. M. 2009. Beyond Copenhagen: REDD+, agriculture, adaptation strategies and poverty. Global Environmental Change, 19, 397-399.
CAPLOW, S., JAGGER, P., LAWLOR, K. & SILLS, E. 2011. Evaluating land use and livelihood impacts of early forest carbon projects: Lessons for learning about REDD+. Environmental Science & Policy, 14, 152-167.
CAPOOR, K. & AMBROSI, P. 2008. State and Trends of the Carbon Market 2008. Washington DC, US: IETA and World Bank.
CARPENTER, S. R., BENNETT, E. M. & PETERSON, G. D. 2006. Scenarios for Ecosystem Services: An Overview. Ecology and Society, 11, 29.
CARTER-HILL, R. C., GRIFFITHS, W. E. & LIM, G. C. 2007. Principles of econometrics, Wiley.
CARWARDINE, J., KERRIE, A. W., HAJKOCWICZ, S. A., SMITH, R. J., KLEIN, C. J., WATTS, M. & POSSINGHAM, H. P. 2010. Conservation Planning when Costs are Uncertain. Conservation Biology, 24, 1529-1537.
CARWARDINE, J., WILSON, K. A., WATTS, M., ETTER, A., KLEIN, C. J. & POSSINGHAM, H. P. 2008. Avoiding costly conservation mistakes: The importance of defining actions and costs in spatial priority settings. PLoS ONE, 3.
CASTILLO, D. & SAYSEL, A. K. 2005. Simulation of common pool resource field experiments: a behavioral model of collective action. Ecological Economics, 55, 420-436.
CATTANEO, A. 2005. Inter-regional innovation in Brazilian agriculture and deforestation in the Amazon: income and environment in the balance. Environment and Development Economics, 10, 485-511.
CAVALCANTI, C., SCHLÄPFER, F. & SCHMID, B. 2010. Public participation and willingness to cooperate in common-pool resource management: A field experiment with fishing communities in Brazil. Ecological Economics, 69, 613-622.
CAVENDISH, W. 2000. Empirical Regularities in the Poverty-Environment Relationship of Rural Households: Evidence from Zimbabwe. World Development, 28, 1979-2003.
CCBA 2008. Climate, Community and Biodiversity Project Design Standards Second Edition. Arlington, VA: Climate, Community and Biodiversity Alliance (CCBA).

300
CHAMP, P. A., BISHOP, R. C., BROWN, T. C. & MCCOLLUM, D. W. 1997. Using Donation Mechanisms to Value Nonuse Benefits from Public Goods. Journal of Environmental Economics and Management, 33, 151-162.
CHAVE, J., ANDALO, C., BROWN, S., CAIRNS, M. A., CHAMBERS, J. Q., EAMUS, D., FOLSTER, H., FROMARD, F., HIGUCHI, N., KIRA, T., LESCURE, J. P., NELSON, B. W., OGAWA, H., PUIG, H., RIERA, B. & YAMAKURA, T. 2005. Tree allometry and improved estimation of carbon stocks and balance in tropical forests. Oecologia, 145, 87-99.
CHAVE, J., CONDIT, R., SALOMON, A., HERNANDEZ, A., LAO, S. & PEREZ, R. 2004. Error Propagation and Scaling for Tropical Forest Biomass Estimates. Philosophical Transactions: Biological Sciences, 359, 409-420.
CHHATRE, A. & AGRAWAL, A. 2009. Trade-offs and synergies between carbon storage and livelihood benefits from forest commons. Proceedings of the National Academy of Sciences, 106, 17667-17670.
CHIODI, G. & PINARD, M. 2011. Characteristics and origins of glades in the Harenna Forest, Ethiopia. Walia Journal of the Ethiopian Wildlife and Natural History Society, 131-145.
CHOMITZ, K. M. 2007. At loggerheads?: agricultural expansion, poverty reduction, and environment in the tropical forests. Washington DC: World Bank.
CHOMITZ, K. M., ALGER, K., THOMAS, T. S., ORLANDO, H. & NOVA, P. V. 2005. Opportunity costs of conservation in a biodiversity hotspot: The case of southern Bahia. Environment and Development Economics, 10, 293-312.
CHRISTIE, M., FAZEY, I., COOPER, R., HYDE, T., DERI, A., HUGHES, L., BUSH, G., BRANDER, L., NAHMAN, A., DE LANGE, W. & REYERS, B. 2008. An Evaluation of Economic and Non-economic Techniques to Assess the Importance of Biodiversity to People in Developing Countries. London, UK: Department for Food and Rural Affairs (DEFRA).
CLARK, D. B. & CLARK, D. A. 2000. Landscape-scale variation in forest structure and biomass in a tropical rain forest. Forest Ecology and Management, 137, 185-198.
CLEMENTS, T. 2010. Reduced Expectations: the political and institutional challenges of REDD+. Oryx, 44, 309-310.
CLEMENTS, T., JOHN, A., NIELSEN, K., AN, D., TAN, S. & MILNER-GULLAND, E. J. 2010. Payments for biodiversity conservation in the context of weak institutions: Comparison of three programs from Cambodia. Ecological Economics, 69, 1283-1291.
CLIMATE FUNDS UPDATE. 2011. Available: http://www.climatefundsupdate.org/ [Accessed 16th November 2011].
COASE, R. 1960. The Problem of Social Cost. The Journal of Law and Economics, 3, 1-44.
301
CONSERVATION INTERNATIONAL. 2012. Eastern Afro Montane Hotspots [Online]. Available: http://www.conservation.org/where/priority_areas/hotspots/africa/Eastern-Afromontane/Pages/default.aspx [Accessed Accessed on 27th December 2012.
COOMES, O. T., BARHAM, B. L. & TAKASAKI, Y. 2004. Targeting conservation–development initiatives in tropical forests: insights from analyses of rain forest use and economic reliance among Amazonian peasants. Ecological Economics, 51, 47-64.
CORBERA, E. & BROWN, K. 2008. Building Institutions to Trade Ecosystem Services: Marketing Forest Carbon in Mexico. World Development, 36, 1956-1979.
CORBERA, E., BROWN, K. & ADGER, W. N. 2007a. The Equity and Legitimacy of Markets for Ecosystem Services. Development and Change, 38, 587-613.
CORBERA, E., KOSOY, N. & MARTÍNEZ TUNA, M. 2007b. Equity implications of marketing ecosystem services in protected areas and rural communities: Case studies from Meso-America. Global Environmental Change, 17, 365-380.
CORBERA, E., SOBERANIS, C. G. & BROWN, K. 2009. Institutional dimensions of Payments for Ecosystem Services: An analysis of Mexico's carbon forestry programme. Ecological Economics, 68, 743-761.
COSTENBADER, J. 2011. REDD+ Benefit Sharing: A comparative assessment of three national policy approaches. UN-REDD Programme and Forest Carbon Partnership Facility.
CSA 2008. Summary and Statistical Report of the 2007 Population and Housing Census. Addis Ababa, Ethiopia: Central Statistics Agency (CSA) Federal Democratic Republic of Ethiopia Population Census Commission.
DANIELSEN, F., SKUTSCH, M., BURGESS, N. D., JENSEN, P. M. & ET AL 2011. At the heart of REDD+: a role for local people in monitoring forests? Conservation Letters 158-167.
DAVIES, B. B. & HODGE, I. D. 2006. Farmers’ Preferences for New Environmental Policy Instruments: Determining the Acceptability of Cross Compliance for Biodiversity Benefits. Journal of Agricultural Economics, 57, 393-414.
DAVIES, J. & RICHARDS, M. 1999. The use of economics to assess stakeholder incentives in participatory forest management: A review. European Union Tropical Forest Paper 5. London, UK: Overseas Development Institute.
DAYTON-JOHNSON, J. 2000. Determinants of collective action on the local commons: a model with evidence from Mexico. Journal of Development Economics, 62, 181-208.
DAYTON-JOHNSON, J. & BARDHAN, P. 2002. Inequality and conservation on the local commons: A theoretical exercise. The Economic Journal, 112, 577-602.
302
DE VAUS, D. A. (ed.) 2002. Surveys in social research, Crow’s Nest, Australia: Allen & Unwin.
DEFRA. undated. Looking back at looking forwards: Next steps for Horizon Scanning and Futures. Available: http://horizonscanning.defra.gov.uk/ViewDocument_Image.aspx?Doc_ID=192 [Accessed November 2011].
DEFRIES, R., ACHARD, F., BROWN, S., HEROLD, M., MURDIYARSO, D., SCHLAMADINGER, B. & DE SOUZA JR, C. 2007. Earth observations for estimating greenhouse gas emissions from deforestation in developing countries. Environmental Science & Policy, 10, 385-394.
DEFRIES, R., ACHARD, F., BROWN, S., HEROLD, M., MURDIYARSO, D., SCHLAMADINGER, B. & DESOUZA, C. 2006. Reducing greenhouse gas emissions from deforestation in developing countries: Considerations for monitoring and measuring. Report of the Global Terrestrial Observing System (GTOS) number 46, GOFC-GOLD.
DEININGER, K., JIN, S., ADENEW, B., GEBRE-SELASSIE, S. & NEGA, B. 2003. Tenure security and landrelated investment: Evidence from Ethiopia. World Bank Policy Research Working Paper 2991. Washington DC, USA: World Bank.
DERCON, S. 1998. Wealth, risk and activity choice: cattle in Western Tanzania. Journal of Development Economics, 55, 1-42.
DIAO, X. & PRATT, A. N. 2007. Growth options and poverty reduction in Ethiopia - An economy-wide model analysis. Food Policy, 32, 205-228.
DIAZ, D., HAMILTON, K. & JOHNSON, E. 2011. Sate of the Forest Carbon Market: From Canopy to Currency. Ecosystem Marketplace.
DJOMO, A. N., IBRAHIMA, A., SABOROWSKI, J. & GRAVENHORST, G. 2010. Allometric equations for biomass estimations in Cameroon and pan moist tropical equations including biomass data from Africa. Forest Ecology and Management, 260, 1873-1885.
DOVIE, D., WITKOWSKI, E. & SHACKLETON, C. 2005. Monetary valuation of livelihoods for understanding the composition and complexity of rural households. Agriculture and Human Values, 22, 87-103.
DUPUY, J. 2009. RE: GIS analyst. Bale Eco-Region Sustainable Management Programme.
EFRON, B. 1979. Bootstrap Methods: Another Look at the Jackknife. The Annals of Statistics, 7, 1-26.
EIU 2010. EIU Country Profiles: Ethiopia. Dartford, UK: Economist Intelligence Unit (EIU).
ELIASCH, J. 2008. Climate Change: Financing Global Forests-The Eliasch Review. London, UK: Office of Climate Change.
ELLIS, F. 2000. The Determinants of Rural Livelihood Diversification in Developing Countries. Journal of Agricultural Economics, 51, 289-302.
303
ELSTON, D. A. 1992. Sensitivity analysis in the presence of correlated parameter estimates. Ecological Modelling, 64, 11-22.
ENGEL, S., PAGIOLA, S. & WUNDER, S. 2008. Designing payments for environmental services in theory and practice: An overview of the issues. Ecological Economics, 65, 663-674.
ENGEL, S. & PALMER, C. 2008. Payments for environmental services as an alternative to logging under weak property rights: The case of Indonesia. Ecological Economics, 65, 799-809.
ESTRADA, M. 2011. Standards and methods available for estimating project level REDD+ carbon benefits: reference guide for project developers. Bogor, Indonesia: CIFOR.
ESTRADA, M. & JOSEPH, S. 2012. Baselines and monitoring in local REDD+ projects. In: ANGELSEN, A., BROCKHAUS, M., SUNDERLIN, W. & VERCHOT, L. (eds.) Analysing REDD+: Challenges and choices. Bogor, Indonesia: CIFOR.
FAO 2000. Global Forest Resources Assessment 2000. FAO Forestry Paper, Report number: 140. Rome: FAO.
FAO 2003. Wood Volume and Woody Biomass: Review of FRA 2000 Estimates. FAO Forestry Resources Assessment Programme, Working paper: 68. Rome: FAO.
FAO 2006. Global Forest Resources Assessment 2005. FAO Forestry Paper, Report number: 147. Rome, Italy: FAO.
FAO 2009. State of the world’s forests 2009. Rome, Italy: FAO (Food and Agriculture Organization).
FCPF. 2011. Available: http://www.forestcarbonpartnership.org/fcp/ [Accessed 16th November 2011].
FDRE 2005. Sustainable Development of the Protected Area System of Ethiopia (SDPASE). UNDP/GEF Project Document. Addis Ababa, Ethiopia: Federal Democratic Republic of Ethiopia
FDRE 2008. Summary and statistical report of the 2007 population and housing census. In: COMISSION, P. C. (ed.). Addis Ababa, Ethiopia: Federal Democratic Republic of Ethiopia, Central Statistics Agency.
FERRARO, P. & SIMPSON, R. 2002. The Cost-Effectiveness of Conservation Payments. Land Economics, 78, 339-353.
FERRARO, P. J. 2002. The local costs of establishing protected areas in low-income nations: Ranomafana National Park, Madagascar. Ecological Economics, 43, 261-275.
FERRARO, P. J. 2008. Asymmetric information and contract design for payments for environmental services. Ecological Economics, 65, 810-821.
FERRARO, P. J. & KISS, A. 2002. Direct Payments to Conserve Biodiversity. Science, 298, 1718-1719.

304
FISCHBACHER, U., GÄCHTER, S. & FEHR, E. 2001. Are people conditionally cooperative? Evidence from a public goods experiment. Economics Letters, 71, 397-404.
FISHER, B. 2010. African exception to drivers of deforestation. Nature Geosci., 3, 375-376.
FISHER, B., KULINDWA, K., MWANYOKA, I., TURNER, R. K. & BURGESS, N. D. 2010. Common pool resource management and PES: Lessons and constraints for water PES in Tanzania. Ecological Economics, 69, 1253-1261.
FISHER, B., LEWIS, S. L., BURGESS, N. D., MALIMBWI, R. E., MUNISHI, P. K., SWETNAM, R. D., KERRY TURNER, R., WILLCOCK, S. & BALMFORD, A. 2011. Implementation and opportunity costs of reducing deforestation and forest degradation in Tanzania. Nature Clim. Change, 1, 161-164.
FISHER, M. 2004. Household welfare and forest dependence in Southern Malawi. Environment and Development Economics, 9, 135-154.
FOGEL, C. 2005. Biotic Carbon Sequestration and the Kyoto Protocol: The Construction of Global Knowledge by the Intergovernmental Panel on Climate Change. International Environmental Agreements, 5, 191-210.
FOREST CARBON PORTAL. 2012. Forest Carbon Portal project list [Online]. Available: http://www.forestcarbonportal.com/projects.
FORSYTH, T., LEACH, M. & SCOONES, I. 1998. Poverty and Environment: Priorities for Research and Policy. Brighton, UK: UNDP.
FPAN 2010. Protecting and Restoring forest carbon in tropical Africa: A Guide for Donors and Funders. Forests Philanthropy Action Network.
FRAZEE, S. R., COWLING, R. M., PRESSEY, R. L., TURPIE, J. K. & LINDENBERG, N. 2003. Estimating the costs of conserving a biodiversity hotspot: A case-study of the Cape Floristic Region, South Africa. Biological Conservation, 112, 275-290.
FREEMAN, A. M. 2003. The measurement of Environmental and Resource Values: Theory and Methods. Washington, DC: Resources for the future.
FRITZEN, S. 2007. Can the Design of Community-Driven Development Reduce the Risk of Elite Capture? Evidence from Indonesia. World Development, 35, 1359-1375.
GARDNER, A. A., DE MARCO, J. & ASANGA, C. A. 2001. A Conservation Partnership: Community Forestry at Kilum-Ijim, Cameroon. Rural Development Forestry Network Paper. London, UK: ODI.
GEBRESELASSIE, S. 2006. Intensification of Smallholder Agriculture in Ethiopia: Options and Scenarios. Future Agricultures.
GEIST, H. J. & LAMBIN, E. F. 2001. What Drives Tropical Deforestation? A meta-analysis of proximate and underlying causes of deforestation based on subnational case study evidence. Louvain-la-Neuve, Belgium: Land Use and Land Cover Change Project International Project Office.
GEIST, H. J. & LAMBIN, E. F. 2002. Proximate causes and underlying driving forces of tropical deforestation. Bioscience, 52, 143-150.
305
GETAHUN, A., GEBRE-MARIAM, A. & HAWKES, M. 2007. Final Evaluation of FARM-Africa/SOS Sahel Ethiopia Participatory Sustainable Forest Management: Innovations in Policy and Practice in East Africa. Penicuik, UK: LTS International.
GIBBS, H. K., BROWN, S., NILES, J. O. & FOLEY, J. A. 2007. Monitoring and estimating tropical forest carbon stocks: making REDD a reality. 2, 045023.
GIBSON, C. C. & KOONTZ, T. 1998. When "Community" Is Not Enough: Institutions and Values in Community-Based Forest Management in Southern Indiana. Human Ecology, 26, 621-647.
GLENDAY, J. 2006. Carbon storage and emissions offset potential in an East African tropical rainforest. Forest Ecology and Management, 235, 72-83.
GOBEZE, T., BEKELE, M., LEMENIH, H. & KASSA, H. 2009. Participatory forest management and its impacts on livelihoods and forest status: the case of Bonga forest in Ethiopia.
GODOY, R. & CONTRERAS, M. 2001. A Comparative Study of Education and Tropical Deforestation among Lowland Bolivian Amerindians: Forest Values, Environmental Externality, and School Subsidies. Economic Development and Cultural Change, 49, 555-574.
GODOY, R. & LUBOWSKI, R. 1992. Guidelines for the Economic Valuation of Nontimber Tropical-Forest Products. Current Anthropology, 33, 423-433.
GODOY, R., O'NEILL, K., GROFF, S., KOSTISHACK, P., CUBAS, A., DEMMER, J., MCSWEENEY, K., OVERMAN, J., WILKIE, D., BROKAW, N. & MARTÍNEZ, M. 1997. Household determinants of deforestation by amerindians in honduras. World Development, 25, 977-987.
GOETZ, S., BACCINI, A., LAPORTE, N., JOHNS, T., WALKER, W., KELLNDORFER, J., HOUGHTON, R. A. & SUN, M. 2009. Mapping and monitoring carbon stocks with satellite observations: a comparison of methods. Carbon Balance and Management, 4, doi:10.1186/1750-0680r-r4-2.
GOFC-GOLD 2008. Reducing greenhouse gas emissions from deforestation and degradation in developing countries: a sourcebook of methods and procedures for monitoring, measuring and reporting. GOFC-GOLD Report version COP13-2. Alberta, Canada: GOFC-GOLD Project Office, Natural Resources Canada.
GOLDMAN-BENNER, R. L., BENITEZ, S., BOUCHER, T., CALVACHE, A., DAILY, G., KAREIVA, P., KROEGER, T. & RAMOS, A. 2012. Water funds and payments for ecosystem services: practice learns from theory and theory can learn from practice. Oryx, 46, 55-63.
GONG, Y., BULL, G. & BAYLIS, K. 2010. Participation in the world's first clean development mechanism forest project: The role of property rights, social capital and contractual rules. Ecological Economics, 69, 1292-1302.
GONZALEZ, P., ASNER, G. P., BATTLES, J. J., LEFSKY, M. A., WARING, K. M. & PALACE, M. 2010. Forest carbon densitites and uncertainties from
306
Lidar, Quickbird, and field measurements in California. Remote Sensing of Environment, 114, 1561-1575.
GORDON, T. J. 1992. The Methods of Futures Research. Annals of the American Academy of Political and Social Science, 522, 25-35.
GRAINGER, A. 2008. Difficulties in tracking the long-term global trend in tropical forest area. Proceedings of the National Academy of Sciences, 105, 818-823.
GRAM, S. 2001. Economic valuation of special forest products: an assessment of methodological shortcomings. Ecological Economics, 36, 109-117.
GRASSI, G., MONNI, S., FEDERICI, S., ACHARD, F. & MOLLICONE, D. 2008. Applying the conservativeness principle to REDD to deal with the uncertainties of the estimates. Environmental Research Letters, 3, 035005.
GREENHALGH, S., DAVIET, F. & WENINGER, E. 2006. The Land Use, Land-Use Change, and Forestry Guidance for GHG Project Accounting. World Resources Institute.
GREGERSEN, H., EL LAKANY, H., KARSENTY, A. & WHITE, A. 2010. Does the Opportunity Cost Approach Indicate the Real Cost of REDD+? Rights and Realities of Paying for REDD+. Washington, DC, USA: Rights and Resources Initiative.
GRIEG-GRAN, M. 2006. The Cost of Avoiding Deforestation. London, UK: International Institute for Environment and Development.
GRIEG-GRAN, M. 2008. The Cost of Avoiding Deforestation: Update of the Report Prepared for the Stern Review of the Economics of Climate Change. London, UK: International Institute for Environment and Development.
GRIEG-GRAN, M., PORRAS, I. & WUNDER, S. 2005. How can market mechanisms for forest environmental services help the poor? Preliminary lessons from Latin America. World Development, 33, 1511-1527.
GRIFFITHS, T. 2007. Seeing RED? Avoided deforestation and the rights of Indigenous Peoples and local communities. Forest People's Programme.
GRIFFITHS, T. 2009. Seeing RED? Forests, climate change mitigation and the rights of indigenous peoples and local communities (updated version). Forest People's Programme.
GRISCOM, B., SHOCH, D., STANLEY, B., CORTEZ, R. & VIRGILIO, N. 2009. Sensitivity of amounts and distribution of tropical forest carbon credits depending on baseline rules. Environmental Science & Policy, 12, 897-911.
GROOM, B., HEPBURN, C., KOUNDOURI, P. & PEARCE, D. 2005. Declining Discount Rates: The Long and the Short of it. Environmental and Resource Economics, 32, 445-493.
GROSS-CAMP, N. D., MARTIN, A., MCGUIRE, S., KEBEDE, B. & MUNYARUKAZA, J. 2012. Payments for ecosystem services in an African protected area: exploring issues of legitimacy, fairness, equity and effectiveness. Oryx, 46, 24-33.
307
GROTE, R., KIESE, R., GRÜNWALD, T., OURCIVAL, J.-M. & GRANIER, A. 2011. Modelling forest carbon balances considering tree mortality and removal. Agricultural and Forest Meteorology, 151, 179-190.
GUAN, W. 2003. From the help desk: Bootstrapped standard errors. Stata Journal, 3, 71-80.
HAINES-YOUNG, R., POTSCHIN, M., PATERSON, J., MOORE, K. & SILFWERBRAND, G. 2010. The Development of Scenarios for the UK National Ecosystem Assessment: Interim Report. Nottingham, UK: Centre for Environmental Management, University of Nottingham.
HAIRIAH, K., SITOMPUL, S. M., VAN NOORDWIJK, M. & PALM, C. 2001. Methods for Sampling Carbon Stocks Above and Below Ground. ASB Lecture Series Note 4B. Bogor, Indonesia: International Center for Research in Agroforestry (ICRAF).
HAMILTON, K., BAYON, R., TURNER, G. & HIGGINS, D. 2007. Picking up Steam: State of the Voluntary Carbon Market 2007. London: Ecosystem Marketplace and New Carbon Finance.
HAMILTON, K., SJARDIN, M., MARCELLO, T. & XU, G. 2008. Forging a Frontier: State of the Voluntary Carbon Markets 2008. London: Ecosystem Marketplace and New Carbon Finance.
HAMILTON, K., SJARDIN, M., PETERS-STANLEY, M. & MARCELLO, T. 2010. Building Bridges: State of the Voluntary Carbon Markets 2010. London: Ecosystem Marketplace and Bloomberg New Energy Finance.
HAMILTON, K., SJARDIN, M., SHAPIRO, A. & MARCELLO, T. 2009. Fortifying the Foundation: State of the Voluntary Carbon Markets 2009. London: Ecosystem Marketplace and New Carbon Finance.
HANLEY, N., SHOGREN, J. & WHITE, B. (eds.) 2006. Environmental Economics: In Theory and Practice: Palgrave Macmillan.
HARDIN, G. 1968. The Tragedy of the Commons. Science, 162, 1243-48. HAYES, T. & PERSHA, L. 2010. Nesting local forestry initiatives: Revisiting
community forest management in a REDD+ world. Forest Policy and Economics, 12, 545-553.
HEATH, L. S. & SMITH, J. E. 2000. An assessment of uncertainty in forest carbon budget projections. Environmental Science & Policy, 3, 73-82.
HECKATHORN, D. D. 1993. Collective Action and Group Heterogeneity: Voluntary Provision Versus Selective Incentives. American Sociological Review, 58, 329-350.
HELMER, O. 1977. Problems in futures research: Delphi and causal cross-impact analysis. Futures, 9, 17-31.
HENRY, M., PICARD, N., TROTTA, C., R, M., VALENTINI, R., BERNOUX, M. & SAINT-ANDRÉ, L. 2011. Estimating tree biomass of sub-Saharan African forests: a review of available allometric equations. Silva Fennica, 45, 477-569.
308
HEPBURN, C. J. & KOUNDOURI, P. 2007. Recent advances in discounting: Implications for forest economics. Journal of Forest Economics, 13, 169-189.
HILLMAN, J. C. 1986. Bale Mountains National Park Management Plan. Addis Ababa, Ethiopia: Ethiopian Wildlife Conservation Organisation.
HOANG, M. H., DO, T. H., PHAM, M. T., VAN NOORDWIJK, M. & MINANG, P. A. 2013. Benefit distribution across scales to reduce emissions from deforestation and forest degradation (REDD+) in Vietnam. Land Use Policy, 31, 48-60.
HOARE, A., LEGGE, T., NUSSBAUM, R. & SAUNDERS, J. 2008. Estimating the cost of building capacity in rainforest nations to allow them to participate in a global REDD mechanism. London, UK: Chatham House, ProForest, Overseas Development Institute (ODI), EcoSecurities.
HÖJER, M., AHLROTH, S., DREBORG, K.-H., EKVALL, T., FINNVEDEN, G., HJELM, O., HOCHSCHORNER, E., NILSSON, M. & PALM, V. 2008. Scenarios in selected tools for environmental systems analysis. Journal of Cleaner Production, 16, 1958-1970.
HOLDEN, S., SHIFERAW, B. & WIK, M. 1998. Poverty, Market Imperfections, and Time Preferences: Of Relevance for Environmental Policy? Environment and Development Economics, 3, 105-130.
HOUGHTON, R. A. 2005. Aboveground forest biomass and the global carbon balance. 11, 945.
HOUGHTON, R. A. & ET AL. 2001. The spatial distribution of forest biomass in the Brazilian Amazon: a comparison of estimates. 7, 731.
HOWE, C., MEDZHIDOV, R. & MILNER-GULLAND, E. J. 2011. Evaluating the relative effectiveness of alternative conservation interventions in influencing stated behavioural intentions: the saiga antelope in Kalmykia (Russia). Environmental Conservation, 38, 37-44.
HUETTNER, M., LEEMANS, R., KOK, K. & EBELING, J. 2009. A comparison of baseline methodologies for ‘Reducing Emissions from Deforestation and Degradation’. Carbon Balance and Management, 4, doi:10.1186/1750-0680-4-4.
HUSS, W. R. & HONTON, E. J. 1987. Scenario planning—What style should you use? Long Range Planning, 20, 21-29.
INFIELD, M. & NAMARA, A. 2001. Community attitudes and behaviour towards conservation: an assessment of a community conservation programme around Lake Mburo National Park, Uganda. Oryx, 35, 48-60.
INTERNATIONAL MONETARY FUND 2007. The Federal Democratic Republic of Ethiopia: Statistical Appendix. IMF, Country Report. Number: 07/245.
IPCC 2003. Good practice guidance for land use, land-use change and forestry. IPCC 2006. Guidelines for National Greenhouse Gas Inventories. Japan:
National Greenhouse Gas Inventories Programme, IGES.

309
IRWIN, B. 2009. RE: Technical Manager Bale Eco-Region Sustainable Management Programme.
KAIVO-OJA, J. Y., KATKO, T. S. & SEPPÄLÄ, O. T. 2004. Seeking convergence between history and futures research. Futures, 36, 527-547.
KARJALAINEN, T., PUSSINEN, A., KELLOMÄKI, S. & MÄKIPÄÄ, R. 1999. Scenarios for the carbon balance of Finnish forests and wood products. Environmental Science & Policy, 2, 165-175.
KARKY, B. S. & SKUTSCH, M. 2010. The cost of carbon abatement through community forest management in Nepal Himalaya. Ecological Economics, 69, 666-672.
KASSA, H., CAMPBELL, B., SANDEWALL, M., KEBEDE, M., TESFAYE, Y., DESSIE, G., SEIFU, A., TADESSE, M., GAREDEW, E. & SANDEWALL, K. 2009. Building future scenarios and uncovering persisting challenges of participatory forest management in Chilimo Forest, Central Ethiopia. Journal of Environmental Management, 90, 1004-1013.
KELLER, M., PALACE, M. & HURTT, G. 2001. Biomass estimation in the Tapajos National Forest, Brazil - Examination of sampling and allometric uncertainties. Forest Ecology and Management, 154, 371-382.
KERR, S., HENDY, J., SHUGUANG, L. & PFAFF, A. S. P. 2004. Tropical Forest Protection, Uncertainty, and the Environmental Integrity of Carbon Mitigation Policies. Wellington, New Zealand: Motu Economic and Public Policy Research, Motu Working Paper 04-03.
KETTERINGS, Q. M., COE, R., VAN NOORDWIJK, M., AMBAGAU, Y. & PALM, C. A. 2001. Reducing uncertainty in the use of allometric biomass equations for predicting above-ground tree biomass in mixed secondary forests. Forest Ecology and Management, 146, 199-209.
KINDERMANN, G., OBERSTEINER, M., SOHNGEN, B., SATHAYE, J., ANDRASKO, K., RAMETSTEINER, E., SCHLAMADINGER, B., WUNDER, S. & BEACH, R. 2008. Global cost estimates of reducing carbon emissions through avoided deforestation. Proceedings of the National Academy of Sciences, 105, 10302-10307.
KLOOSTER, D. & MASERA, O. 2000. Community forest management in Mexico: carbon mitigation and biodiversity conservation through rural development. Global Environmental Change, 10, 259-272.
KNOKE, T., STEINBEIS, O.-E., BÖSCH, M., ROMÁN-CUESTA, R. M. & BURKHARDT, T. 2011. Cost-effective compensation to avoid carbon emissions from forest loss: An approach to consider price-quantity effects and risk-aversion. Ecological Economics, 70, 1139-1153.
KÖHLIN, G. 2001. Contingent valuation in project planning and evaluation: the case of social forestry in Orissa, India. Environment and Development Economics, 6, 237-258.
KOLSTAD, C. (ed.) 2000. Environmental Economics, US: OUP.

310
KOSOY, N., CORBERA, E. & BROWN, K. 2008. Participation in payments for ecosystem services: Case studies from the Lacandon rainforest, Mexico. Geoforum, 39, 2073-2083.
KOSOY, N., MARTINEZ-TUNA, M., MURADIAN, R. & MARTINEZ-ALIER, J. 2007. Payments for environmental services in watersheds: Insights from a comparative study of three cases in Central America. Ecological Economics, 61, 446-455.
KOTCHEN, M. J. & REILING, S. D. 2000. Environmental attitudes, motivations, and contingent valuation of nonuse values: a case study involving endangered species. Ecological Economics, 32, 93-107.
KUBSA, A. & TADESSE, T. Granting exclusive user rights to the forest dwellers in the state owned forest: The WAJIB approach in Ethiopia. The second international workshop on participatory forestry in Africa from 18-22 February 2002, 2002 Arusha, Tanzania. FAO, Rome, Italy.
LAMPIETTI, J. A. & DIXON, J. A. 1995. To See the Forest for the Trees: A Guide to Nontimber Forest Benefits. Environment Department Paper 013. Washington, DC World Bank.
LANDELL-MILLS, N. 2002. Developing Markets for Forest Environmental Services: An Opportunity for Promoting Equity While Securing Efficiency? Philosophical Transactions: Mathematical, Physical and Engineering Sciences, 360, 1817-1825.
LANDELL-MILLS, N. & PORRAS, I. 2002. Silver Bullet or Fools' Gold? A global review of markets for forest enviromental services and their impact on the poor. London, UK: International Institute for Environment and Development.
LAROCQUE, G. R., BHATTI, J. S., BOUTIN, R. & CHERTOV, O. 2008. Uncertainty analysis in carbon cycle models of forest ecosystems: Research needs and development of a theoretical framework to estimate error propagation. Ecological Modelling, 219, 400-412.
LE TOAN, T., QUEGAN, S., DAVIDSON, M. W. J., BALZTER, H., PAILLOU, P., PAPATHANASSIOU, K., PLUMMER, S., ROCCA, F., SAATCHI, S., SHUGART, H. & ULANDER, L. 2011. The BIOMASS mission: Mapping global forest biomass to better understand the terrestrial carbon cycle. Remote Sensing of Environment, 115, 2850-2860.
LEE, E. & MAHANTY, S. 2009. Payments for Environmental Services: Risks and Opportunities. Bangkok, Thailand: The Center for People and Forests (RECOFTC).
LEWIS, S. L. 2009. Increasing carbon storage in intact African tropical forests. Nature, 457, 1003-1006.
LIM, B., BROWN, S. & SCHLAMADINGER, B. 1999. Carbon accounting for forest harvesting and wood products: review and evaluation of different approaches. Environmental Science & Policy, 2, 207-216.

311
LISE, W. 2000. Factors influencing people’s participation in forest management in India. Ecological Economics, 34, 379-392.
LUBELL, M. 2002. Environmental Activism as Collective Action. Environment and Behavior, 34, 431-454.
LUND, J. F. & TREUE, T. 2008. Are We Getting There? Evidence of Decentralized Forest Management from the Tanzanian Miombo Woodlands. World Development, 36, 2780-2800.
MA 2005. Millennium Ecosystem Assessment Ecosystems and human well-being: scenarios. Washington DC, US: Millenium Ecosystem Assessment (MA).
MACDICKEN, K. 1997. A guide to monitoring carbon storage in forestry and agroforestry projects. Arlington, USA: Winrock International.
MACQUEEN, D. 2008. Making forest enterprise work for sustainable forest management and community development in Ethiopia. Addis Ababa: Bale Eco-Region Sustainable Management Programme (BERSMP).
MAMO, G., SJAASTAD, E. & VEDELD, P. 2007. Economic dependence on forest resources: A case from Dendi District, Ethiopia. Forest Policy and Economics, 9, 916-927.
MARGULES, C. R. & PRESSEY, R. L. 2000. Systematic conservation planning. Nature, 405, 243-253.
MARIEN, M. 2002. Futures studies in the 21st Century: a reality-based view. Futures, 34, 261-281.
MARLAND, G., FRUIT, K. & SEDJO, R. 2001. Accounting for sequestered carbon: the question of permanence. Environmental Science and Policy, 4, 259-268.
MARSHALL, A. R., WILLCOCK, S., PLATTS, P. J., LOVETT, J. C., BALMFORD, A., BURGESS, N. D., LATHAM, J. E., MUNISHI, P. K. T., SALTER, R., SHIRIMA, D. D. & LEWIS, S. L. 2012. Measuring and modelling above-ground carbon and tree allometry along a tropical elevation gradient. Biological Conservation.
MASOZERA, M. K., ALAVALAPATI, J. R. R., JACOBSON, S. K. & SHRESTHA, R. K. 2006. Assessing the suitability of community-based management for the Nyungwe Forest Reserve, Rwanda. Forest Policy and Economics, 8, 206-216.
MATTA, J. R. & ALAVALAPATI, J. R. R. 2006. Perceptions of collective action and its success in community based natural resource management: An empirical analysis. Forest Policy and Economics, 9, 274-284.
MAYAUX, P., HOLMGREN, P., ACHARD, F., EVA, H., STIBIG, H.-J. & BRANTHOMME, A. 2005. Tropical forest cover change in the 1990s and options for future monitoring. Philosophical Transactions of the Royal Society B: Biological Sciences, 360, 373-384.
MCCARL, B. A. & SCHNEIDER, U. A. 2001. Greenhouse Gas Mitigation in US Agriculture and Forestry Science, 294, 2481.
312
MEINZEN-DICK, R., RAJU, K. V. & GULATI, A. 2002. What Affects Organization and Collective Action for Managing Resources? Evidence from Canal Irrigation Systems in India. World Development, 30, 649-666.
MEKONNEN, A. 2000. Valuation of community forestry in Ethiopia: a contingent valuation study of rural households. Environment and Development Economics, 5, 289-308.
MERIDIAN INSTITUTE 2009. Reducing Emissions from Deforestation and Forest Degradation (REDD): An Options Assessment Report. Prepared for the Government of Norway, by Arild Angelsen, Sandra Brown, Cyril Loisel, Leo Peskett, Charlotte Streck, and Daniel Zarin.
MERRY, F. D., HILDEBRAND, P. E., PATTIE, P. & CARTER, D. R. 2002. An analysis of land conversion from sustainable forestry to pasture: a case study in the Bolivian Lowlands. Land Use Policy, 19, 207-215.
MESHACK, C. K., AHDIKARI, B., DOGGART, N. & LOVETT, J. C. 2006. Transaction costs of community-based forest management: empirical evidence from Tanzania. African Journal of Ecology, 44, 468-477.
MILNER-GULLAND, E. J. & ROWCLIFFE, J. M. (eds.) 2007. Conservation and sustainable use: a handbook of techniques, Oxford, UK: Oxford University Press.
MINANG, P. A., MEADU, V., DEWI, S. & SWALLOW, B. 2008. The Opportunity Costs of Avoiding Deforestation from Deforestation. ASB Policy Brief 10. Nairobi, Kenya: ASB Partnership for the Tropical Forest Margins.
MIRANDA, M., PORRAS, I. T. & MORENO, M. L. 2003. The social impacts of payments for environmental services in Costa Rica: A quantitative field survey and analysis of the Virilla watershed. London, UK: International Institute for Environment and Development.
MITCHELL, R. C. & CARSON, R. T. 1989. Using Surveys to Value Public Goods. Washington, DC: Resources for the Future.
MOGES, Y., ESHETU, Z. & NUNE, S. 2010. Ethiopian Forest Resources: Current status and future management options in view to access carbon finances. Addis Ababa, Ethiopia: Prepared for the Ethiopian Climate Research Network and the United Nations Development Programme.
MOLLICONE, D., FREIBAUER, A., SCHULZE, E. D., BRAATZ, S., GRASSI, G. & FEDERICI, S. 2007. Elements for the expected mechanisms on reduced emissions from deforestation and degradation (REDD) under UNFCCC. 2, 045024.
MONNI, S., PELTONIEMI, M., PALOSUO, T., LEHTONEN, A., MÄKIPÄÄ, R. & SAVOLAINEN, I. 2007. Uncertainty of forest carbon stock changes-implications to the total uncertainty of GHG inventory of Finland. 81, 391.

313
MOORE, J., BALMFORD, A., ALLNUTT, T. & BURGESS, N. 2004. Integrating costs into conservation planning across Africa. Biological Conservation, 117, 343-350.
MUNISHI, P. K., MRINGI, S., SHIRIMA, D. D. & LINDA, S. K. 2010. The role of the Miombo Woodlands of the Southern Highlands of Tanzania as carbon sinks. Journal of Ecology and the Natural Environment, 2, 261-269.
MURADIAN, R., CORBERA, E., PASCUAL, U., KOSOY, N. & MAY, P. H. 2010. Reconciling theory and practice: An alternative conceptual framework for understanding payments for environmental services. Ecological Economics, 69, 1202-1208.
MURDIYARSO, D. & SKUTSCH, M. 2006. Community Forest Managment as a Carbon Mitigation Option: Case Studies. Bogor, Indonesia: Centre for International Forestry Research.
MUSTALAHTI, I., BOLIN, A., BOYD, E. & PAAVOLA, J. 2012. Can REDD+ Reconcile Local Priorities and Needs with Global Mitigation Benefits? Lessons from Angai Forest, Tanzania. Ecology and Society, 17.
MYERS, N., MITTERMEIER, R. A., MITTERMEIER, C. G., DA FONSECA, G. A. B. & KENT, J. 2000. Biodiversity hotspots for conservation priorities. Nature, 403, 853-858.
NABUURS, G. J., MASERA, O., ANDRASKO, K., BENITEZ-PONCE, P., BOER, R., DUTSCHKE, M., ELSIDDIG, E., FORD-ROBERTSON, J., FRUMHOFF, P., KARJALAINEN, T., KRANKINA, O., KURZ, W. A., MATSUMOTO, M., OYHANTCABAL, W., RAVINDRANATH, N. H., SANZ SANCHEZ, M. J. & ZHANG, X. 2007. Forestry Mitigation. Contribution of Working Group III to the Fourth Assessment Report of the Intergovernmental Panel on Climate Change. In: METZ, B., DAVIDSON, O. R., BOSCH, P. R., DAVE, R. & MEYER, L. A. (eds.) Climate Change. Cambridge, United Kingdom and New York, NY, USA: Cambridge University Press.
NAIDOO, R. & ADAMOWICZ, W. L. 2006. Modeling opportunity costs of conservation in transitional landscapes. Conservation Biology, 20, 490-500.
NAIDOO, R., BALMFORD, A., FERRARO, P. J., POLASKY, S., RICKETTS, T. H. & ROUGET, M. 2006. Integrating economic costs into conservation planning. Trends in Ecology and Evolution, 21, 681-687.
NAIDOO, R. & IWAMURA, T. 2007. Global-scale mapping of economic benefits from agricultural lands: Implications for conservation priorities. Biological Conservation, 140, 40-49.
NAIDOO, R. & RICKETTS, T. H. 2006. Mapping the Economic Costs and Benefits of Conservation. PLoS Biol, 4, e360.
NAIDU, S. C. 2009. Heterogeneity and Collective Management: Evidence from Common Forests in Himachal Pradesh, India. World Development, 37, 676-686.
314
NAIDU, S. C. 2011. Access to benefits from forest commons in the Western Himalayas. Ecological Economics, 71, 202-210.
NAKICENOVIC, N., ALCAMO, J., DAVIS, G., DE VRIES, B., FENHANN, J., GAFFIN, S., GREGORY, K., GRUBLER, A., JUNG, T. Y., KRAM, T., LA ROVERE, E. L., MICHAELIS, L., MORI, S., MORITA, T., PEPPER, W., PITCHER, H. M., PRICE, L., RIAHI, K., ROEHRL, A., ROGNER, H.-H., SANKOVSKI, A., SCHLESINGER, M., SHUKLA, P., SMITH, S. J., SWART, R., VAN ROOIJEN, S., VICTOR, N. & DADI, Z. 2000. Special Report on Emissions Scenarios : a special report of Working Group III of the Intergovernmental Panel on Climate Change.
NEEF, T., VON LUEPKE, H. & SCHOENE, D. 2006. Choosing a forest definition for the Clean Development Mechanism. Forests and Climate Change Working Paper 4, FAO.
NEPSTAD, D., SOARES-FILHO, B., MERRY, F., MOUTINHO, P., RODRIGUES, H. O., BOWMAN, M., SCHWARTZMAN, S., ALMEIDA, O. & RIVERO, S. 2007. The Costs and Benefits of Reducing Carbon Emissions from Deforestation and Forest Degradation in the Brazilian Amazon. Falmouth, US: The Woods Hole Research Centre.
NEUMANN, R. P. & HIRSCH, E. 2000. Commercialisation of Non-Timber Forest Products: Review and Analysis of Research. Bogor, Indonesia: CIFOR.
NIELSEN, M. R. & TREUE, T. 2012. Hunting for the Benefits of Joint Forest Management in the Eastern Afromontane Biodiversity Hotspot: Effects on Bushmeat Hunters and Wildlife in the Udzungwa Mountains. World Development, 40, 1224-1239.
NKONYA, E., PENDER, J. & KATO, E. 2008. Who knows, who cares? The determinants of enactment, awareness, and compliance with community Natural Resource Management regulations in Uganda. Environment and Development Economics, 13, 79-101.
NORTH, D. C. 1990. Institutions, Institutional Change and Economic Perfomance, Cambridge, Cambridge University Press.
NORTON-GRIFFITHS, M. & SOUTHEY, C. 1995. The opportunity costs of biodiversity conservation in Kenya. Ecological Economics, 12, 125-139.
OECD 2002. A Handbook of Biodiversity Valuation: A Guide for Policy Makers. Paris, France: Organisation for Economic Cooperation and Development (OECD).
OLANDER, L. P. 2011. Nested Approaches to REDD+ An Overview of Issues and Options. Climate Focus and Forest Trends.
OLANDER, L. P., GIBBS, H. K., STEININGER, M., SWENSON, J. & MURRAY, B. C. 2008. Reference scenarios for deforestation and forest degradation in support of REDD: a review of data and methods. 3, 025011.
OSTROM, E. (ed.) 1990. Governing the commons: the evolution of institutions for collective action, New York: Cambridge University Press.
315
OSTROM, E. 2000. Collective Action and the Evolution of Social Norms. The Journal of Economic Perspectives, 14, 137-158.
OSVALDO, E. S., CHAPIN, F. S., ARMESTO, J. J., BERLOW, E., BLOOMFIELD, J., DIRZO, R., HUBER-SANWALD, E., HUENNEKE, L. F., JACKSON, R. B., KINZIG, A., LEEMANS, R., LODGE, D. M., MOONEY, H. A., OESTERHELD, M., POFF, N. L., SYKES, M. T., WALKER, B. H., WALKER, M. & WALL, D. H. 2000. Global Biodiversity Scenarios for the Year 2100. Science, 287, 1770-1774.
PAGIOLA, S., ARCENAS, A. & PLATAIS, G. 2005a. Can Payments for Environmental Services Help Reduce Poverty? An Exploration of the Issues and the Evidence to Date from Latin America. World Development, 33, 237-253.
PAGIOLA, S. & BOSQUET, B. 2009. Estimating the Costs of REDD at the Country Level. Washington, DC, USA: Forest Carbon Partnership Facility, World Bank.
PAGIOLA, S. & PLATAIS, G. 2007. Payments for Environmental Services: From Theory to Practice. Washington: World Bank.
PAGIOLA, S., VON RITTER, K. & BISHOP, J. 2005b. Assessing the economic value of ecosystem conservation. Environment Department Paper. Number: 101. . Washington, DC: World Bank and IUCN.
PALMER, C. & MACGREGOR, J. 2009. Fuelwood scarcity, energy substitution, and rural livelihoods in Namibia. Environment and Development Economics, 14, 693-715.
PALMER FRY, B. 2011. Community forest monitoring in REDD+: the ‘M’ in MRV? Environmental Science & Policy, 14, 181-187.
PARKER, C., MITCHELL, A., TRIVEDI, M. & MARDAS, N. 2008. The Little REDD Book: A Guide to Governmental and Non-governmental Proposals to Reducing Emissions from Deforestation and Degradation. Oxford, UK: Global Canopy Programme.
PASCUAL, U., MURADIAN, R., RODRÍGUEZ, L. C. & DURAIAPPAH, A. 2010. Exploring the links between equity and efficiency in payments for environmental services: A conceptual approach. Ecological Economics, 69, 1237-1244.
PEARCE, D. & MARKANDYA, A. 1987. Marginal Opportunity Costs as a Planning Concept in Natural Resource Management. The Annals of Regional Science, 21, 18-32.
PEARCE, D. W. 1997. Can non-market values save the tropical forests? East Anglia, UK: CSERGE.
PEARCE, D. W., GROOM, B., HEPBURN, C. & KOUNDOURI, P. 2003. Valuing the future: recent advances in social discounting. World Economics, 4, 121-141.
PEARCE, D. W. & WARFORD, J. W. 1993. World Without End: Economics, Environment and Sustainable Development, Oxford, UK, OUP.

316
PEARSON, T., WALKER, S. & BROWN, S. 2005. Sourcebook for Land Use, Land-Use Change and Forestry Projects. Winrock International and the Bio Carbon Fund of the World Bank.
PELLETIER, J., KIRBY, K. R. & POTVIN, C. 2010. Significance of carbon stock uncertainties on emission reductions from deforestation and forest degradation in developing countries. Forest Policy and Economics.
PELTONIEMI, M., PALOSUO, T., MONNI, S. & MÄKIPÄÄ, R. 2006. Factors affecting the uncertainty of sinks and stocks of carbon in Finnish forests soils and vegetation. Forest Ecology and Management, 232, 75-85.
PEN-CIFOR. 2011. Available: http://www.cifor.cgiar.org/pen/_ref/tools/index.htm [Accessed 16th November 2011].
PERSHA, L. & BLOMLEY, T. O. M. 2009. Management Decentralization and Montane Forest Conditions in Tanzania
Descentralización del Manejo y Condiciones del Bosque Montano en Tanzania. Conservation Biology, 23, 1485-1496.
PESKETT, L. 2011. Benefit Sharing in REDD+: Exploring the implications for poor and vulnerable people. London, UK: REDDnet and World Bank.
PESKETT, L. & HARKIN, Z. 2007. Risk and responsibility in Reduced Emissions from Deforestation and Degradation. London, UK: Overseas Development Institute.
PESKETT, L., HUBERMAN, D., BOWEN-JONES, E., EDWARDS, G. & BROWN, J. 2008. Making REDD Work for the Poor. London, UK: Overseas Development Institute and International Union for Conservation of Nature.
PETERS-STANLEY, M. & HAMILTON, K. 2012. Developing Dimensions: State of the Voluntary Carbon Markets 2012. Ecosystem Marketplace Bloomberg New Energy Finance.
PETERS-STANLEY, M., HAMILTON, K., MARCELLO, T. & SJARDIN, M. 2011. Back to the Future: State of the Voluntary Carbon Markets 2011. London, UK: Ecosystem Marketplace adn Bloomberg New Energy Finance.
PETERSEN, L. & SANDHÖVEL, A. 2001. Forestry policy reform and the role of incentives in Tanzania. Forest Policy and Economics, 2, 39-55.
PETERSON, G. D., CUMMING, G. S. & CARPENTER, S. R. 2003. Scenario Planning: a Tool for Conservation in an Uncertain World. Conservation Biology, 17, 358-366.
PETHERAM, L. & CAMPBELL, B. M. 2010. Listening to locals on payments for environmental services. Journal of Environmental Management, 91, 1139-1149.
PHILLIPS, O. L., MALHI, Y., HIGUCHI, N., LAURANCE, W. F., NÚÑEZ, P. V., VÁSQUEZ, R. M., LAURANCE, S. G., FERREIRA, L. V., STERN, M., BROWN, S. & GRACE, J. 1998. Changes in the Carbon Balance of Tropical Forests: Evidence from Long-Term Plots. Science, 282, 439-442.

317
PIRARD, R. 2008. Estimating Opportunity Costs of Avoided Deforestation (REDD): Application of a Flexible Stepwise Approach to the Indonesian Pulp Sector. International Forestry Review, 10, 512-522.
PLATTEAU, J.-P. 2004. Monitoring Elite Capture in Community-Driven Development. Development and Change, 35, 223-246.
POLASKY, S., CAMM, J. D. & GARBER-YONTS, B. 2001. Selecting Biological Reserves Cost-Effectively: An Application to Terrestrial Vertebrate Conservation in Oregon. Land Economics, 77, 68-78.
POLASKY, S., CARPENTER, S. R., FOLKE, C. & KEELER, B. 2011. Decision-making under great uncertainty: environmental management in an era of global change. Trends in Ecology & Evolution, 26, 398-404.
POLASKY, S., NELSON, E., LONSDORF, E., FACKLER, P. & STARFIELD, A. 2005. Conserving species in a working landscape: Land use with biological and economic objectives. Ecological Applications, 15, 1387-1401.
POTEETE, A. R. & OSTROM, E. 2004. In pursuit of comparable concepts and data about collective action. Agricultural Systems, 82, 215-232.
PREECE, N. D., CROWLEY, G. M., LAWES, M. J. & VAN OOSTERZEE, P. 2012. Comparing above-ground biomass among forest types in the Wet Tropics: Small stems and plantation types matter in carbon accounting. Forest Ecology and Management, 264, 228-237.
PRETTY, J. 2003. Social Capital and the Collective Management of Resources. Science, 302, 1912-1914.
R-PP 2011. Readiness Preparation Proposal (R-PP) of the Federal Democratic Republic of Ethiopia. Addis Ababa, Ethiopia: REDD Technical Working Group.
RAMANKUTTY, N., GIBBS, H. K., ACHARD, F., DEFRIES, R., FOLEY, J. A. & HOUGHTON, R. A. 2007. Challenges to estimating carbon emissions from tropical deforestation. Global Change Biology, 13, 51-66.
REGAN, H. M., COLYVAN, M. & BURGMAN, M. A. 2002. A Taxonomy and Treatment of Uncertainty for Ecology and Conservation Biology. Ecological Applications, 12, 618-628.
RICHARDS, M. 1999. Internalising the externalities of tropical forestry: a review of innovative financing and incentive mechanisms. London, UK: Overseas Development Institute.
RICHARDS, M. 2008. REDD: Last hope for tropical forests? Bristol, UK: The IDL Group.
RICHARDS, M., KANEL, K., MAHARJAN, M. & DAVIES, J. 1999. Towards Participatory Economic Analysis by Forest User Groups in Nepal. London, UK: Overseas Development Institute (ODI).
ROBERTSON, N. & WUNDER, S. 2005. Fresh Tracks in the Forest: Assessing Incipient Payments for Environmental Service Initiatives in Bolivia. Bogor, Indonesia: CIFOR.
318
RODRÍGUEZ ZÚÑIGA, J. M. 2003. Paying for forest environmental services: the Costa Rican experience. Unasylva, 54, 31-33.
ROJAS, M. & AYLWARD, B. 2003. What are we learning from experiences with markets for environmental services in Costa Rica? A review and critique of the literature. Markets for Environmental Services. London, UK: International Institute for Environment and Development (IIED).
ROMIJN, E., HEROLD, M., KOOISTRA, L., MURDIYARSO, D. & VERCHOT, L. 2012. Assessing capacities of non-Annex I countries for national forest monitoring in the context of REDD+. Environmental Science & Policy, 19–20, 33-48.
ROSELL, S. 2011. Regional perspective on rainfall change and variability in the central highlands of Ethiopia, 1978-2007. Applied Geography, 31, 329-338.
ROWLAND, M. & GATWARD, R. 2003. Annual Technical Report: 2001/2002. London, UK: Department for Work and Pensions, London Office of National Statistics.
RUDEL, T. K., COOMES, O. T., MORAN, E., ACHARD, F., ANGELSEN, A., XU, J. & LAMBIN, E. 2005. Forest transitions: towards a global understanding of land use change. Global Environmental Change, 15, 23-31.
SAATCHI, S. S., HARRIS, N. L., BROWN, S., LEFSKY, M., MITCHARD, E. T. A., SALAS, W., ZUTTA, B. R., BUERMANN, W., LEWIS, S. L., HAGEN, S., PETROVA, S., WHITE, L., SILMAN, M. & MOREL, A. 2011. Benchmark map of forest carbon stocks in tropical regions across three continents. Proceedings of the National Academy of Sciences, 108, 9899-9904.
SADOULET, E. & DE JANVRY, A. 1995. Quantitative Development Policy Analysis, John Hopkins Press.
SANTILLI, M., MOUTINHO, P., SCHWARTZMAN, S., NEPSTAD, D., CURRAN, L. & NOBRE, C. 2005. Tropical Deforestation and the Kyoto Protocol. Climatic Change, 71, 267-276.
SCHMITT, C. B., SENBETA, F., DENICH, M., PREISINGER, H. & BOEHMER, H. J. 2009. Wild coffee management and plant diversity in the montane rainforest of southwestern Ethiopia. African Journal of Ecology, 48, 78-86.
SEABRIGHT, P. 1993. Managing Local Commons: Theoretical Issues in Incentive Design. The Journal of Economic Perspectives, 7, 113-134.
SEDJO, R. & MARLAND, G. 2003. Inter-trading permanent emissions credits and rented temporary carbon emissions offsets: some issues and alternatives. Climate Policy, 3, 435-444.
SHACKLETON, C. M. & SCHOLES, R. J. 2011. Above ground woody community attributes, biomass and carbon stocks along a rainfall gradient in the savannas of the central lowveld, South Africa. South African Journal of Botany, 77, 184-192.
SHACKLETON, S. & CAMPBELL, B. M. 2001. Devolution in natural resource management: institutional arrangements and power shifts: a synthesis of case studies from southern Africa, Bogor, Indonesia, CIFOR.
319
SHEIL, D. & WUNDER, S. 2002. The Value of Tropical Forest to Local Communities: Complications, Caveats, and Cautions. Conservation Ecology, 6, 9.
SHIFERAW, B. & HOLDEN, S. 1999. Soil Erosion and Smallholders' Conservation Decisions in the Highlands of Ethiopia. World Development, 27, 739-752.
SHIFERAW, B. & HOLDEN, S. T. 2000. Policy instruments for sustainable land management: the case of highland smallholders in Ethiopia. Agricultural Economics, 22, 217-232.
SHIRIMA, D. D., MUNISHI, P. K. T., LEWIS, S. L., BURGESS, N. D., MARSHALL, A. R., BALMFORD, A., SWETNAM, R. D. & ZAHABU, E. M. 2011. Carbon storage, structure and composition of miombo woodlands in Tanzania’s Eastern Arc Mountains. African Journal of Ecology, 49, 332-342.
SHOCH, D., EATON, J. & SETTELMYER, S. 2011. Project developer’s guidebook to VCS REDD methodologies. Version 1.0. Conservation International.
SHYAMSUNDAR, P. & KRAMER, R. A. 1996. Tropical forest protection: an empirical analysis of the costs borne by local people. Journal of Environmental Economics and Management, 31, 129-144.
SIMPSON, R. D. & SEDJO, R. A. 1996. Paying for the conservation of endangered ecosystems: a comparison of direct and indirect approaches. Environment and Development Economics, 1, 241-257.
SKUTSCH, M. 2000. Conflict management and participation in community forestry. Agroforestry Systems, 48, 189-206.
SKUTSCH, M. & BA, L. 2010. Crediting carbon in dry forests: The potential for community forest management in West Africa. Forest Policy and Economics, 12, 264-270.
SKUTSCH, M. & MCCALL, M. 2010. Reassessing REDD: governance, markets and the hype cycle. Climatic Change, 100, 395-402.
SKUTSCH, M., VICKERS, B., GEORGIADOU, Y. & MCCALL, M. 2011. Alternative models for carbon payments to communities under REDD+: A comparison using the Polis model of actor inducements. Environmental Science & Policy, 14, 140-151.
SMITH, J. & SCHERR, S. J. 2003. Capturing the Value of Forest Carbon for Local Livelihoods. World Development, 31, 2143-2160.
SMITH, J. E. & HEATH, L. S. 2001. Identifying Influences on Model Uncertainty: An Application Using a Forest Carbon Budget Model. Environmental Management, 27, 253-267.
SMITH, P. P. 2003. A reconnaissance survey of the vegetation of Mutinondo Wilderness Area. Kew, UK: Report for Mutinondo Wilderness Ltd.
320
SOHNGEN, B. & BROWN, S. 2004. Measuring Leakage from Carbon Projects in Open Economies: A Stop Timber Harvesting Project in Bolivia as a Case Study. Canadian Journal of Forestry Research, 34, 669-674.
SOHNGEN, B. & MENDELSOHN, R. 2003. An optimal control model of forest carbon sequestration. American Journal of Agricultural Economics, 85, 448-457.
SOMANATHAN, E., PRABHAKAR, R. & MEHTA, B. S. 2009. Decentralization for cost-effective conservation. Proceedings of the National Academy of Sciences, 106, 4143-4147.
SOMMERVILLE, M., JONES, J. P. G., RAHAJAHARISON, M. & MILNER-GULLAND, E. J. 2010. The role of fairness and benefit distribution in community-based Payment for Environmental Services interventions: A case study from Menabe, Madagascar. Ecological Economics, 69, 1262-1271.
SOMMERVILLE, M. M., JONES, J. P. G. & MILNER-GULLAND, E. J. 2009. A revised conceptual framework for payments for environmental services. Ecology and Society, 14, 34.
SOUTHGATE, D., HAAB, T., LUNDINE, J. & RODRIGUEZ, F. 2009. Payments for environmental services and rural livelihood strategies in Ecuador and Guatemala. Environment and Development Economics, 15, 21-37.
SPIELMAN, D. J., BYERLEE, D., ALEMU, D. & KELEMEWORK, D. 2010. Policies to promote cereal intensification in Ethiopia: The search for appropriate public and private roles. Food Policy, 35, 185-194.
SPLASH, C. L. & VATN, A. 2006. Transferring environmental value estimates: Issues and alternatives. Ecological Economics, 60, 379-388.
SSLFM 2010. Strengthening Sustainable Livelihoods and Forest Management in Ethiopia (SSLFM): Annual Report 2010. Addis Ababa, Ethiopia: FARM Africa and SOS Sahel Ethiopia.
STERN, N. 2007. The Economics of Climate Change: The Stern Review, Cambridge, UK, Cambridge University Press.
STRASSBURG, B., TURNER, R. K., FISHER, B., SCHAEFFER, R. & LOVETT, A. 2009. Reducing emissions from deforestation: the `combined incentives' mechanism and empirical simulations. Global Environmental Change, 19, 265-278.
STRASSBURG, B. B. N., RODRIGUES, A. S. L., GUSTI, M., BALMFORD, A., FRITZ, S., OBERSTEINER, M., TURNER, K. R. & BROOKS, T. M. 2012. Impacts of incentives to reduce emissions from deforestation on global species extinctions. Nature Clim. Change, 2, 350-355.
SUN-DODOLA 2005. Guidelines for Implementation of the WAJIB Approach in Ethiopia. Addis Ababa, Ethiopia: Program on Sustainable Utilization of Natural Resources for Food Security (GTZ-SUN).
SWETNAM, R. D., FISHER, B., MBILINYI, B. P., MUNISHI, P. K. T., WILLCOCK, S., RICKETTS, T., MWAKALILA, S., BALMFORD, A., BURGESS, N. D., MARSHALL, A. R. & LEWIS, S. L. 2011. Mapping

321
socio-economic scenarios of land cover change: A GIS method to enable ecosystem service modelling. Journal of Environmental Management, 92, 563-574.
TEKETAY, D., LEMENIH, M., BEKELE, T., YEMSHAW, Y., FELEKE, S., TADESSE, W., MOGES, Y., HUNDE, T. & NIGUSSIE, D. 2010. Forest Resources and Challenges of Sustainable Forest Management and Conservation in Ethiopia. In: BONGERS, F. & TENNIGKEIT, T. (eds.) Degraded forests in Eastern Africa: management and restoration. London, UK: Earthscan.
TESFAYE, Y., ROOS, A., CAMPBELL, B. M. & BOHLIN, F. 2011. Livelihood strategies and the role of forest income in participatory-managed forests of Dodola area in the bale highlands, southern Ethiopia. Forest Policy and Economics, 13, 258-265.
TESHOME, E., RANDALL, D. & KINAHAN, A. A. 2011. The Changing Face of the Bale Mountains National Park over 32 years: A study on land cover change. Walia Journal of the Ethiopian Wildlife and Natural History Society, 118-130.
TIETENBERG, T. & LEWIS, L. (eds.) 2009. Environmental Economics and Policy: Pearson Education.
TOL, R. S. J. 2008. The Social Cost of Carbon: Trends, Outliers and Catastrophes. Economics: The Open-Access, Open-Assessment E-Jounal, 2, 1-24.
TOMICH, T. P., CATTANEO, A., CHATER, S., GEIST, H. J., GOCKOWSKI, J., KAIMOWITZ, D., LAMBIN, E. F., LEWIS, J., NDOYE, O., PALM, C., STOLLE, F., SUNDERLIN, W. D., VALENTIM, J. F., VAN NOORDWIJK, M. & VOSTI, S. A. 2005. Balancing agricultural development and environmental objectives: assessing tradeoffs in the humid tropics. In: PALM, C. A., VOSTI, S. A., SANCHEZ, P. A. & ERICKSEN, P. J. (eds.) Slash-and-Burn Agriculture: The Search for Alternatives. New York, NY, USA: Columbia University Press.
UNDP 2009. Forestry Carbon Accounting, Overview and Principles. Addis Ababa, Ethiopia: UNDP-UNEP CDM Capacity Development Project for Eastern & Southern Africa.
UNEP 1998. Environmental Valuation: A worldwide compendium of case studies. Environmental Economics Series. Number: 26. United Nations Environment Programme.
UNFCCC 2002. Report of the conference of the parties on its seventh session, held at Marrakesh from 29 October to 10 November 2001. Addendum. Part two: action taken by the conference of the parties, FCCC/CP/2001/13. Bonn: UNFCCC Secretariat.
UNFCCC 2009. Cost of implementing methodologies and monitoring systems relating to estimates of emissions from deforestation and forest degradation, the assessment of carbon stocks and greenhouse gas
322
emissions from changes in forest cover, and the enhancement of forest carbon stocks. Technical Paper FCCC/TP/2009/1.
UNFCCC. 2011. COP 17 decisions [Online]. Available: http://unfccc.int/2860.php [Accessed December 2011].
UNIQUE 2008. Sustainable Financing Mechanisms for the BESMP. Part II: Carbon Finance Opportunities. Freiburg, Germany: UNIQUE Forestry Consultants.
UNIQUE 2010. Bale Mountain REDD Project: Protecting Highland Forests in Ethiopia. Project marketing document. Freiburg, Germany: UNIQUE Forestry Consultants.
URAMA, K. C. & HODGE, I. D. 2006. Are stated preferences convergent with revealed preferences? Empirical evidence from Nigeria. Ecological Economics, 59, 24-37.
VAN BREUGEL, M., RANSIJN, J., CRAVEN, D., BONGERS, F. & HALL, J. S. 2011. Estimating carbon stock in secondary forests: Decisions and uncertainties associated with allometric biomass models. Forest Ecology and Management, 262, 1648-1657.
VAN NOORDWIJK, M., CHANDLER, F. & TOMICH, T. P. 2004. An introduction to the conceptual basis of RUPES. Rewarding Upland Poor for Environmental Services. Bogor, Indonesia: World Agroforestry Centre.
VARUGHESE, G. & OSTROM, E. 2001. The Contested Role of Heterogeneity in Collective Action: Some Evidence from Community Forestry in Nepal. World Development, 29, 747-765.
VATN, A. 2010. An institutional analysis of payments for environmental services. Ecological Economics, 69, 1245-1252.
VCS 2007. Guidance for Agriculture, Forestry and other land Use Projects. Washington DC: VCS Association.
VEDELD, P., ANGELSEN, A., SJAASTAD, E. & BERG, G. K. 2004. Counting on the environment: Forest incomes and the rural poor. Washington, DC: World Bank.
VELEZ, M. A., STRANLUND, J. K. & MURPHY, J. J. 2009. What motivates common pool resource users? Experimental evidence from the field. Journal of Economic Behavior & Organization, 70, 485-497.
VERBEEK, M. 2004. A guide to modern econometrics, John Wiley & Sons. VERCHOT, L., ANITHA, K., ROMIJN, E., HEROLD, M. & HERGOUALC'H, K.
2012. Emissions Factors: converting land use change to CO2 estimates. In: ANGELSEN, A., BROCKHAUS, M., SUNDERLIN, W. & VERCHOT, L. (eds.) Analysing REDD+: Challenges and choices. Bogor, Indonesia: CIFOR.
VICARY, S. 2011. Public Goods and the Commons: A Common Framework. Journal of Public Economic Theory, 13, 47-69.
WACK, P. 1985. Scenarios: unchartered waters ahead. Harv. Bus. Rev., 63, 73.

323
WAGGONER, P. E. 2009. Forest Inventories: Discrepancies and Uncertainties. Washington DC: Resources for the Future Discussion Paper 09-29.
WAKIJIRA, D., FISCHER, A. & PINARD, M. in press. Governance change and institutional adaptation: a case study from Harenna forest, Ethiopia. Environmental Management.
WATSON, C. 2012. Defining climate-related forest activities, finance and expenditure in national budgetary systems. London, UK: ODI.
WATSON, C. & NAKHOODA, S. 2012. Financing Readiness: Insights from the Amazon Fund and Congo Basin Forest Fund’s efforts to reduce emissions from deforestation and degradation. London, UK: ODI and HBF.
WBISPP 2005. A national strategy plan for the biomass sector. Addis Ababa, Ethiopia: Woody Biomass Inventory and Strategic Planning Project.
WCS 2009. REDD Project Development Guide. Wildlife Conservation Society. WDI. 2011. World Development Indicators (WDI) [Online]. Washington, DC:
World Bank. Available: http://data.worldbank.org/data-catalog [Accessed November 2011].
WEBSTER, M. D., BABIKER, M., MAYER, M., REILLY, J. M., HARNISCH, J., HYMAN, R., SAROFIM, M. C. & WANG, C. 2002. Uncertainty in emissions projections for climate models. Atmospheric Environment, 36, 3659-3670.
WEITZMAN, M. 1998. Why the far distant future should be discounted at its lowest possible rate. Journal of Environmental Economics and Management, 36, 201–208.
WERTZ-KANOUNNIKOFF, S. 2008. Estimating the costs of reducing forest emissions: A review of methods. Working Paper No. 42. Bogor, Indonesia: CIFOR.
WESTLAKE, D. F. 1966. The biomass and productivity of glyceria maxima: I. Seasonal changes in biomass. Journal of Ecology, 54, 745-753.
WGI. 2010. Worldwide Governance Indicators (WGI) for Ethiopia 2010 [Online]. Washington, DC: World Bank. Available: www.govindicators.org [Accessed December 2011].
WHITE, A. & MINANG, P. A. 2011. Estimating the Opportunity Costs of REDD+: A training manual. Washington DC: World Bank.
WHITTINGTON, D. 1998. Administering contingent valuation surveys in developing countries. World Development, 26, 21-30.
WILDLIFE WORKS. 2012. Kasigua Corridor REDD Project Information [Online]. Available: http://www.wildlifeworks.com/redd/resources.php.
WILLIAMS, P. H., MOORE, J. L., KAMDEN TOHAM, A., BROOKS, T. M., STRAND, H., D'AMICO, J., WISZ, M., BURGESS, N. D., BALMFORD, A. & RAHBEK, C. 2003. Integrating biodiversity priorities with conflicting socio-economic values in the Guinean-Congolian forest region. Biodiversity and Conservation, 12, 1297-1320.
324
WILSON, K. A., MCBRIDE, M. F., BODE, M. & POSSINGHAM, H. P. 2006. Prioritizing global conservation efforts. Nature, 440, 337-340.
WILY, L. A. 2000. Forest law in Eastern and Southern Africa: Moving towards a community-based forest future? . Unasylva, 51, 19-26.
WILY, L. A. 2010. Participatory forest management in Africa: an overview of progress and issues. Second International Workshop on Participatory Forestry in Africa. Defining the way foreward: Sustainable livelihoods and sustainable forest management through participatory forestry.
WINJUM, J. K., BROWN, S. & SCHLAMADINGER, B. 1998. Forest Harvests and Wood Products: Sources and Sinks of Atmospheric Carbon Dioxide. Forest Science, 44, 272-284.
WOLLENBERG, E., EDMUNDS, D. & BUCK, L. 2000. Using scenarios to make decisions about the future: anticipatory learning for the adaptive co-management of community forests. Landscape and Urban Planning, 47, 65-77.
WOLLENBERG, E. & INGLES, A. 1998. Incomes from the forest: methods for the development and conservation of forest products for local communities, Bogor, Indonesia, CIFOR.
WORLD BANK 2007. Measuring the Economic Impact of Climate Change on Ethiopian Agriculture: Ricardian Approach. Washington DC: World Bank.
WORLD BANK 2011. State and Trends of the Carbon Market 2011. Washington DC: World Bank.
WORLD BANK. 2013. The World Bank Datasource, Global Economic Monitor (GEM) commodities [Online]. World Bank. Available: http://databank.worldbank.org [Accessed May 2013].
WREN, S. 2007. Natural Resource Products Opportunities and Potentials Study, Bale Mountains, Ethiopia. Addis Ababa, Ethiopia: BERSMP.
WUNDER, S. 2005. Payments for Environmental Services: some nuts and bolts. Bogor, Indonesia: Centre for International Forestry Research.
WUNDER, S. 2007. The Efficiency of Payments for Environmental Services in Tropical Conservation La Eficiencia de los Pagos por Servicios Ambientales en la Conservación Trópicos. Conservation Biology, 21, 48-58.
WUNDER, S. 2008. Payments for environmental services and the poor: concepts and preliminary evidence. Environment and Development Economics, 13, 279-297.
WUNDER, S. 2012. Of PES and other animals. Oryx, 46, 1-2. WÜNSCHER, T., ENGEL, S. & WUNDER, S. 2008. Spatial targeting of
payments for environmental services: A tool for boosting conservation benefits. Ecological Economics, 65, 822-833.
YALDEN, D. W. & LARGEN, M. J. 1992. The endemic mammals of Ethiopia. Mammal Review, 22, 115-150.

325
YEMIRU, T., ROOS, A., CAMPBELL, B. M. & BOHLIN, F. 2010. Forest Incomes and Poverty Alleviation Under Participatory Forest Management in the Bale Highlands, Southern Ethiopia. International Forestry Review, 12, 66-77.
YESUF, M. & BLUFFSTONE, R. 2008. Wealth and Time Preference in Rural Ethiopia. Environment for Development Discussion Paper Series. Resources for the Future.
YIMER, F., LEDIN, S. & ABDELKADIR, A. 2006. Soil organic carbon and total nitrogen stocks as affected by topographic aspect and vegetation in the Bale Mountains, Ethiopia. Geoderma, 135, 335-344.
ZANETELL, A. B. & KNUTH, B. A. 2004. Participation Rhetoric or Community-Based Management Reality? Influences on Willingness to Participate in a Venezuelan Freshwater Fishery. World Development, 32, 793-807.
ZBINDEN, S. & LEE, D. R. 2005. Paying for Environmental Services: An Analysis of Participation in Costa Rica’s PSA Program. World Development, 33, 255-272.
ZOMER, R., TRABUCCO, A., VERCHOT, L. & MUYS, B. 2008. Land Area Eligible for Afforestation and Reforestation within the Clean Development Mechanism: A Global Analysis of the Impact of Forest Definition. Mitigation and Adaptation Strategies for Global Change, 13, 219-239.

326
Appendix 1: Household survey
[Record: enumerator initials, date and location]
[Read out] “My name is (name of enumerator). I am here on behalf of Charlene
Watson who is collecting information for her PhD studies in London,
England.
We are collecting information on the income that forests and cultivated land
provide to your household and other households in the Bale area. This
income includes products sold and consumed at home. This information will
allow a better understanding of the land use in your kebele and the role that
forests and forest products have in people’s lives. The information and
comments you provide in this questionnaire will also contribute to
investigations into the opportunities and possibilities for future forest
management in the Bale area. In particular, a scheme for communities to
manage forest called participatory forest management which is supported by
the government and by Farm Africa-SOS Sahel.
If you chose to take part in this questionnaire, your answers will not be
shared with other members of the community or the authorities. Would you
like to continue with the questions, it will take about 60 minutes?”
[If no, move on to the next household]
[If yes, write down time interview started]
Part 1 – Your thoughts about the forest management around your kebele

327
1. What did you think about the management of the forests that your
household used in the past under the Derg regime (before 1991)?
………………………………………………………………………………………
………………………………………………………………….………………
2. What do you think about the current management of the forests that your
household uses?
………………………………………………………………………………………
………………………………………………………………….………………
3.
a. Do you think that the current level of forest use by your household and
others in this kebele can continue into the future?
yes/ no/ don’t know
b. Why?
………………………………………………………………………………………
………………………………………………………………….………………
4. How might forest management change if communities were given legal
rights to use the forest and forest products?
………………………………………………………………………………………
……………………………………………………………….…………………
5. We will read a statement out to you and would like you to decide if you
agree, don’t know, or disagree.
a. If an area of forest is not being used by people it is not a problem if the
forest area gets smaller.
b. Even if my household does not use a part of the forest, I would
participate in this forests management.
c. I do not think about my household’s use of forest in the future, it is
enough to think only about my household’s use of the forest now.
d. There is a responsibility for me to manage the forest well now so that my
children and future generations can benefit from the forest in the future.

328
e. One management objective for forests in the Bale Mountains should be to
support wildlife that lives there.
f. Forests should be managed only if this does not negatively affect
people’s livelihoods.
g. People have more important things to worry about than good
management to maintain the forest.
h. People only cut down the forest because they have no other ways of
supplementing their livelihoods.
Part 2 – Forest use and land cultivated by your household
The next few questions help us compare the income that you get from forests
and cultivated land. This includes forest products and crops that your
household collected, used at home and sold. If you cannot recall for the last
year (or 12 months), please give answers for a period of time that you can
remember.
6. Which of the following products did your household collect?
Product
Amount collected last
year
(units)
Maximum time travelled from
your house (hours)
Amount sold
(units)
Timber
Fuelwood
Bamboo
Honey
Coffee
Other.......
7.

329
a. On average, is the time you travel from your house to collect these forest
products more/ the same/ less than the year before this?
b. On average, how much more or less than the year before this?
............hours
c. Why do you think the time to collect changing?
………………………………………………………………………………………
……………………………………………………………….…………………
d. Do you think the time you travel to collect forest products will change
next year?
more/ the same / less
8.
a. Please list the crops that your household harvested last year (or 12
months).
Crop type Yield from first crop
(Qt)
Yield from second
crop (Qt)
Total amount sold
each year (Qt)
b. Estimate your costs of inputs to crop production in one year?
Item Cost (Ethiopian Birr)
Fertiliser
Seed
Equipment
Paid Labour
Other .....
9.
a. What area of land did your household cultivate last year?
……….hectares
b. Is this more/ the same/ less than the year before this?
330
c. How much more or less the year before this? ........ hectares
d. For what reason?
………………………………………………………………………………………
………………………………………………………………….………………
e. Will you cultivate more/ the same/ less land next year?
10. I would like you to take these 100 beans and to share them between the
sources of income that your household receives. For example, if you receive
no income from that source put zero beans on it. If you receive half of your
income from crops, put 50 of your beans on it.
Forest Products Crops Livestock Trading Paid
Labour
Money from
Overseas Other
Part 3 – A community based Participatory Forest Management system
Recent research in the Bale Mountains has shown that the forest area is
decreasing very quickly. Forest is being cut down to make space for settlements,
agriculture, grazing of livestock and to use the timber and fuelwood. If nothing
is done the forest area will continue to get smaller. This means the benefits that
forests provide to households over time will decrease.
One way to maintain the benefits that forests in Bale provide is to ensure that
the forest is used sustainably. This means maintaining the forest area and
quality through community-based forest management and by diversifying the
ways that households can earn an income. This is similar to what is being
proposed by FARM Africa-SOS Sahel. This has been carried out successfully in
other areas of Ethiopia and it is called Participatory Forest Management.
331
Under Participatory Forest Management your household would become a
member of a community cooperative. It would be an honest, credible and
reliable organisation with committees, rules and responsibilities. The
cooperative would have a legal agreement with the Oromia Forest and Wildlife
Enterprise. It gives your cooperative the rights to use the forest and to use and
sell forest products. Under this agreement, your cooperative is responsible to
manage the forest according to a forest management plan agreed with the
Oromia Regional State Forest Enterprise.
Under Participatory Forest Management, in order to meet household needs for
fuelwood and timber your cooperative will have to sustainably manage the
harvest from the forest and utilise woodlots. Livestock grazing will have to be
managed so that it does not degrade the forest. The collection of forest products
such as honey, climbers, coffee, and medicinal plants would not be affected as
the tree cover is maintained and forest destruction is minimised.
It is possible that community cooperatives might also be able to receive
payments if they are able to protect the forest from being cut down and
maintain the area for 20 years. This is because trees store carbon and when they
are cut down this is released into the atmosphere and the global climate
changes. Governments, companies and households in places like England, are
willing-to-pay to keep the carbon in the trees to slow down climate change. It is
possible that payments could be made for carbon each year, only where the
forest area has been maintained. The cooperative could then choose what the
money is spent on. A community group that cut down forest would not receive
any payment for carbon.

332
11. Do you understand Participatory Forest Management that was explained to
you? yes, all of it/ some of it/ no, none of
it
[Explain again if they understand none of it]
12. Do you understand why your cooperative might be paid money to keep
carbon in the trees? yes, all of it/ some of it/ no, none of
it
[Explain again if they understand none of it]
13. Do you have any comments about the forest management just described to
you, its advantages and disadvantages to your household and community if
it were to be organised within your kebele?
………………………………………………………………………………………
…………………………………………………………….……………………
14. Do you think the Participatory Forest Management will affect some people
or social groups in your kebele more than others? In what way and why?
………………………………………………………………………………………
……………………………………………………………..……………………
15. Do you think that the households in your kebele would join a Participatory
Forest Management Cooperative? yes/ don’t know/ no
16. Would your household be willing to join a Participatory Forest Management
cooperative (remember that this is not a binding agreement to join)?
yes/ don’t know/ no
17. How certain are you that other members of a cooperative would follow the
rules to maintain the forest area under Participatory Forest Management?
certain/ don’t know/
uncertain
18. If your cooperative received payments from carbon, how should the money
be used?

333
……………………………………………………………………………………………
…………………………………………………………….…………………………
19.
a. Under the rules of the Participatory Forest Management described to you
do you think your household would be better off / just as well off as you are
now / worse off?
b. Why?
……………………………………………………………………………………………
…………………………………………………………….…………………………
20. Do you think that the rules of the Participatory Forest Management
described to you would lead to a change in the income that your household
gets from forest products next year (this includes products used at home as
well as sold)? increase/decrease/no change
[If they say ‘no’, move to section 4]
[If they say ‘yes’ or ‘don’t know’ continue with this section]
21. If Participatory Forest Management were to be carried out in your kebele,
what change in amount of income would your household experience if it
had to follow the rules of Participatory Forest Management? Before you
answer, please think carefully about the impact of the scheme for your
household.
……………………….. Ethiopian Birr
22. If the respondent was not willing to give an amount of money, why was
this?
……………………………………………………………………………………………
…………………………………………………………….…………………………
23.
334
a. Under Participatory Forest Management the forests will be sustainably
managed so that they will provide benefits and income into the future.
These benefits include climate regulation and the protection of the
watershed. It also means that forests will be available for future
generations to use. To secure these benefits, would you be willing to give
up some of your yearly income to your Participatory Forest Management
Cooperative so that they could better manage the forest?
yes/ no
b. If yes, how much money each year would you be willing to give to the
cooperative so that forest use will continue into the future?
...............………… Ethiopian Birr
24. If the respondent was not willing to give an amount of money, why was
this?
………………………………………………………………………………………
………………………………………………………………….………………
25. You stated that the income your household gets from forests next year might
change under Participatory Forest Management. Thinking five years into the
future, how do you think that Participatory Forest Management might affect
this income?
………………………………………………………………………………………
………………………………………………………………….………………
[Read out] “Please remember at this point that carbon payments are not
definitely going to be made to cooperatives under Participatory Forest
Management and if it was, it may not be organised as described above.”
Part 4 – Household Information
335
This is the last few questions which are about the people in your household.
Please remember, information will not be shared with the authorities.
26.
a. Are you the head of the household? yes/
no
b. What is your level of education? ......... grade
27. How many years has your household lived in this kebele? ......... years
28.
a. Is this household polygamous? yes/ no
b. When you answered questions on forest products and crops, how many
houses did you report for? ..….. houses
c. How many people live in this household? ......... people
[Read out] “Thank you for giving your time to complete this questionnaire.
Your answers will help use compare the value that forests and cultivated land
provide to the households in the Bale area. They will also contribute to
investigations into the opportunities and possibilities for future forest
management in the Bale area. Charlene will report the overall results of this
questionnaire when she next returns to the Bale Mountains”.
[Write down time of completion]

336
Appendix 2: Market price survey
Product Unit
Average price across six market
survey sites (ETB/unit)
Product Unit
Average price
across six market survey sites
(ETB/unit) Bamboo Donkey 49 Carrot Quintile 158
Climber Donkey 13 Sweet
Potato Quintile 198 Fence 1 piece 9 Mango 1 piece 1 Firewood Donkey 26 Avocado 1 piece 1 Grass Sack 8 Banana kg 7 Timber 1 piece 40 Beetroot Quintile 129 Honey Kg 31 Pepper kg 35 Oils Kg 21 Chat bundle 23 Sorghum Quintile 341 Coffee kg 30 Barley Quintile 284 Pineapple kg 7 Bean Quintile 526 Butter kg 77 Peas Quintile 724 Ginger kg 5
Maize
Quintile
379
Absuda (black cumin) Quintile 2454
Teff Quintile 632 Abish Quintile 1475 Wheat Quintile 444 Dinblata Quintile 525 Lentil kg 15 Shimbura Quintile 533 Oats Quintile 304 Salt kg 3 Onion kg 6 Gayyo Quintile 435 Spring Onion
Quintile 180
Lemon 1 piece 1
Potato Quintile
176 Green
pepper kg 15 Garlic (White onion)
Quintile
617
Orange 1 piece 2 Cabbage (round)
Quintile 108
Dog tooth Quintile 422
Top Related