

![When and how to start ARV treatment. HIV... · Total available resources for AIDS 1986-2008 [i] 1996-2005 data: Extracted from 2006 Report on the Global AIDS Epidemic (UNAIDS, 2006);](https://static.fdocuments.us/doc/165x107/5c7521d709d3f2ba1a8c58a1/when-and-how-to-start-arv-treatment-hiv-total-available-resources-for-aids.jpg)


Languages
Pages
Legal


Forecasted demand for Current and New ARV medicines in low and
middle income countries, 2015-2025
Forecasted demand for Current and New ARV medicines in low and
middle income countries, 2015-2025
WHO/MPP forecast excerpts from the Joint WHO/UNAIDS Meeting with Manufacturers and Partners on Global ARV Demand ForecastMarch 8-9, 2016Medicines Patent PoolWorld Health Organization

• New drugs in the pipeline – some approved, some expected soon
• Licences for these drugs will stimulate generic manufacturing, appropriate formulations such as FDCs, increased availability and affordable prices
• However, for full and early benefit, all public health actors need to be informed, prepared and aligned
• Generics manufacturers need to understand volumes required and when
• Policy makers need to understand when generics would be available and in what formulations
• Procurement agents need to understand pricing and timing
• SRA and country level registration need to be expedited to accelerate access in the countries
• Forecasts are a key element to start and prioritise the process of putting a new drug on the market as well as answering some of the questions above
BackgroundBackground

• Date of generic availability
• Price differential between new and similar existing drugs
• WHO guidelines
• What may be on the guidelines
• Which line of treatment may each drug be recommended in
• When may this recommendation happen
• Availability of data in special populations (TB, pregnancy)
• National guidelines
Key Variables ConsideredKey Variables Considered

FORECAST FOR ADULT / ADOLESCENT USEFORECAST FOR ADULT / ADOLESCENT USE

• Date of introduction in market:
• DTG 50mg: Q4-2017
• DTG FDCs: Q3-2018
• TAF FDCs: Q1-2019
• Price:
• At launch, DTG & TAF priced at par with EFV & TDF respectively
• Future pricing based on historical price erosion trends
• Positive study results for DTG and TAF in special populations
• Including drug-drug interaction of TAF with rifampicin
• WHO guidelines recommend new products first as alternate and then as preferred regimens
• New products placed on national guidelines within one year from WHO guidelines
High Level AssumptionsHigh Level Assumptions

Millions of Adults Treated in WHO/MPP* forecastsMillions of Adults Treated in WHO/MPP* forecasts
*WHO/MPP assumes total PLHIV treated per UNAIDS fast track report
0.0
5.0
10.0
15.0
20.0
25.0
30.0
2015 2016 2017 2018 2019 2020 2021 2022 2023 2024 2025
WHO‐MPP Total WHO‐MPP 1L WHO‐MPP 2L

Percent of adults on first line treatment taking TAF, TDF and AZT
Percent of adults on first line treatment taking TAF, TDF and AZT
22%16%
9% 7% 4% 3% 3% 2% 1% 1% 1%
76%81%
88% 90% 93% 92% 90%85%
81%71%
65%
0% 2% 4%10% 15%
25%31%
0%
10%
20%
30%
40%
50%
60%
70%
80%
90%
100%
2015 2016 2017 2018 2019 2020 2021 2022 2023 2024 2025
AZT TDF TAF
• TDF is the clear market leader currently and continues to be so in the near future
• At launch, TAF price is assumed to be at par with TDF, however, our model assumes a conservative uptake due to lack of clinical data and its potential interaction with rifampicin
• The TAF uptake picks up in later years, once such information is available, reaching 31% patients in first‐line
• We assume AZT usage follows WHO Guidelines and continues to fall to negligible share by 2019 and tenofovir in both its forms takes over the market for first line nuceosides

Percent of adults on first line treatment taking DTG, EFV and NVP
Percent of adults on first line treatment taking DTG, EFV and NVP
26%18%
10% 6% 2%
73%81%
87%89%
82%78% 73%
62%56%
50%42%
0% 2% 4%15%
21% 26%38%
44%50%
57%
0%
10%
20%
30%
40%
50%
60%
70%
80%
90%
100%
2015 2016 2017 2018 2019 2020 2021 2022 2023 2024 2025
NVP EFV DTG
• With the WHO Guidelines recommendation of EFV as a preferred regimen, the market share of NVP declines to reach zero by 2020
• EFV gains 100% of the market share from NVP decline till the introduction of DTG
• DTG, when introduced, is assumed to be priced at par with EFV
• We assume DTG rapidly takes market share of first‐line treatment from both NVP as well as EFV
• The uptake is slower in the initial years due to non‐availability of FDCs, however, from 2019 onwards, the uptake increases substantially, reaching 57% of total first‐line market

Percent of adults on second line treatment taking DTG, TAF, TDF and AZT
Percent of adults on second line treatment taking DTG, TAF, TDF and AZT
31%40% 43% 45%
51%59%
73% 68% 64% 61% 57%
61%55% 49% 44% 35% 21%
1%1%
0%2%
4%6%
8%8%
8%
0% 3% 6% 9% 13% 16% 20% 23% 26% 30%
0%
10%
20%
30%
40%
50%
60%
70%
80%
90%
100%
2015 2016 2017 2018 2019 2020 2021 2022 2023 2024 2025
AZT TDF TAF DTG
• We assume a higher uptake of AZT in second‐line treatment, since most patients are assumed to be using tenofovir in first line
• We also assume that TAF would be taking some market share from TDF, but the total market of tenofovir is small
• DTG
• Is not recommended in the current WHO guidelines in second line
• However, the assumption for uptake is that patients who have not used DTG in first line would be able to do so in second line
• The uptake is much more conservative than for first‐line use, and reaches 30% patients by 2025
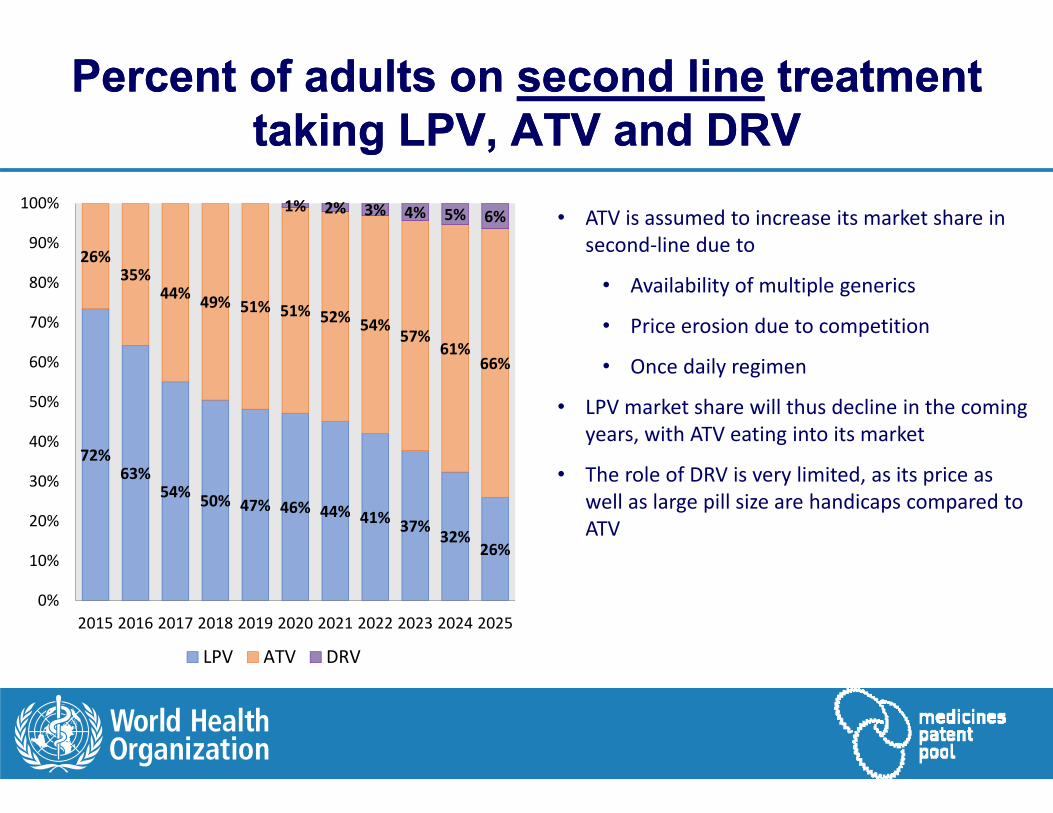
Percent of adults on second line treatment taking LPV, ATV and DRV
Percent of adults on second line treatment taking LPV, ATV and DRV
72%63%
54% 50% 47% 46% 44% 41% 37% 32%26%
26%35%
44% 49% 51% 51% 52% 54%57%
61%66%
1% 2% 3% 4% 5% 6%
0%
10%
20%
30%
40%
50%
60%
70%
80%
90%
100%
2015 2016 2017 2018 2019 2020 2021 2022 2023 2024 2025
LPV ATV DRV
• ATV is assumed to increase its market share in second‐line due to
• Availability of multiple generics
• Price erosion due to competition
• Once daily regimen
• LPV market share will thus decline in the coming years, with ATV eating into its market
• The role of DRV is very limited, as its price as well as large pill size are handicaps compared to ATV

Salvage treatment in adultsSalvage treatment in adults
DRV
RAL
ETV
Others
Usage in Resistant Patients: 2015N = 26,000
DRV
RAL
DTG
ETV
Others
Usage in Resistant Patients: 2025N = 500,000
• The main change between 2015 and 2025 in salvage treatment is the number of patients, which increase from 26,000 currently to 0.5 million in 2025
• The mix of ARVs used does not change much except DTG will take market share from RAL, which is the other integrase inhibitor
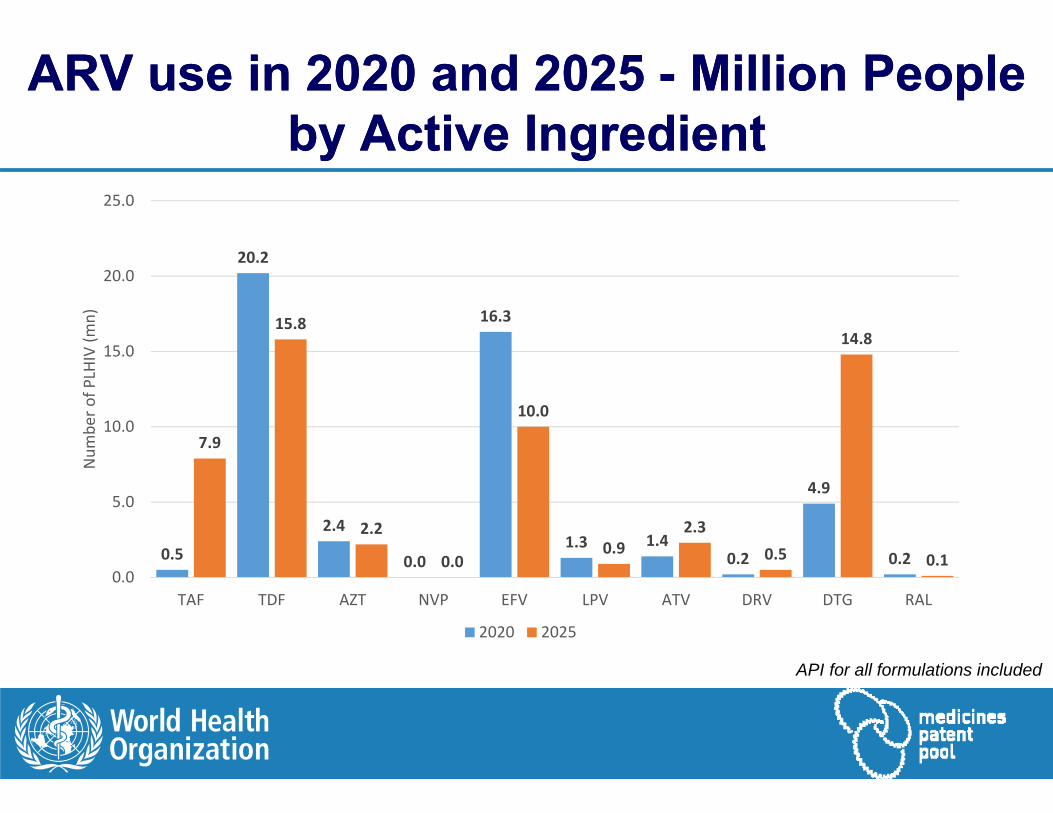
ARV use in 2020 and 2025 - Million People by Active Ingredient
ARV use in 2020 and 2025 - Million People by Active Ingredient
API for all formulations included
0.5
20.2
2.4
0.0
16.3
1.3 1.40.2
4.9
0.2
7.9
15.8
2.2
0.0
10.0
0.92.3
0.5
14.8
0.10.0
5.0
10.0
15.0
20.0
25.0
TAF TDF AZT NVP EFV LPV ATV DRV DTG RAL
Num
ber o
f PLH
IV (m
n)
2020 2025
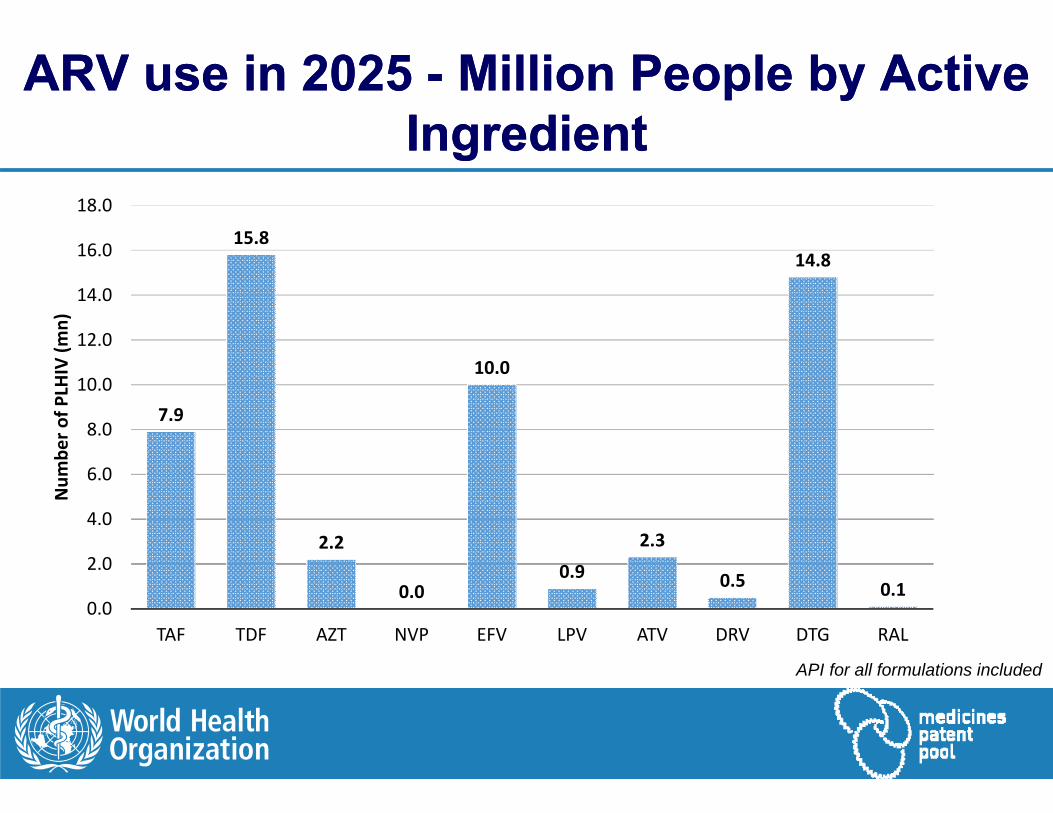
ARV use in 2025 - Million People by Active Ingredient
ARV use in 2025 - Million People by Active Ingredient
7.9
15.8
2.2
0.0
10.0
0.9
2.3
0.5
14.8
0.10.0
2.0
4.0
6.0
8.0
10.0
12.0
14.0
16.0
18.0
TAF TDF AZT NVP EFV LPV ATV DRV DTG RAL
Num
ber o
f PLH
IV (m
n)
API for all formulations included

FORECAST FOR PAEDIATRIC USEFORECAST FOR PAEDIATRIC USE

• Date of introduction in market (either originator or generic):
• DTG 50mg and FDCs: 2018
• TAF FDCs: 2020
• Price:
• At launch, DTG & TAF priced at par with EFV & TDF respectively
• Future pricing based on historical price erosion trends
• Positive study results for DTG and TAF in children
• WHO guidelines recommend new products first as alternate and then as preferred regimens
• New products placed on national guidelines within one year from WHO guidelines
High Level AssumptionsHigh Level Assumptions

Millions of Children Treated in WHO/MPP* forecastsMillions of Children Treated in WHO/MPP* forecasts
*WHO/MPP assumes total PLHIV treated per UNAIDS fast track report
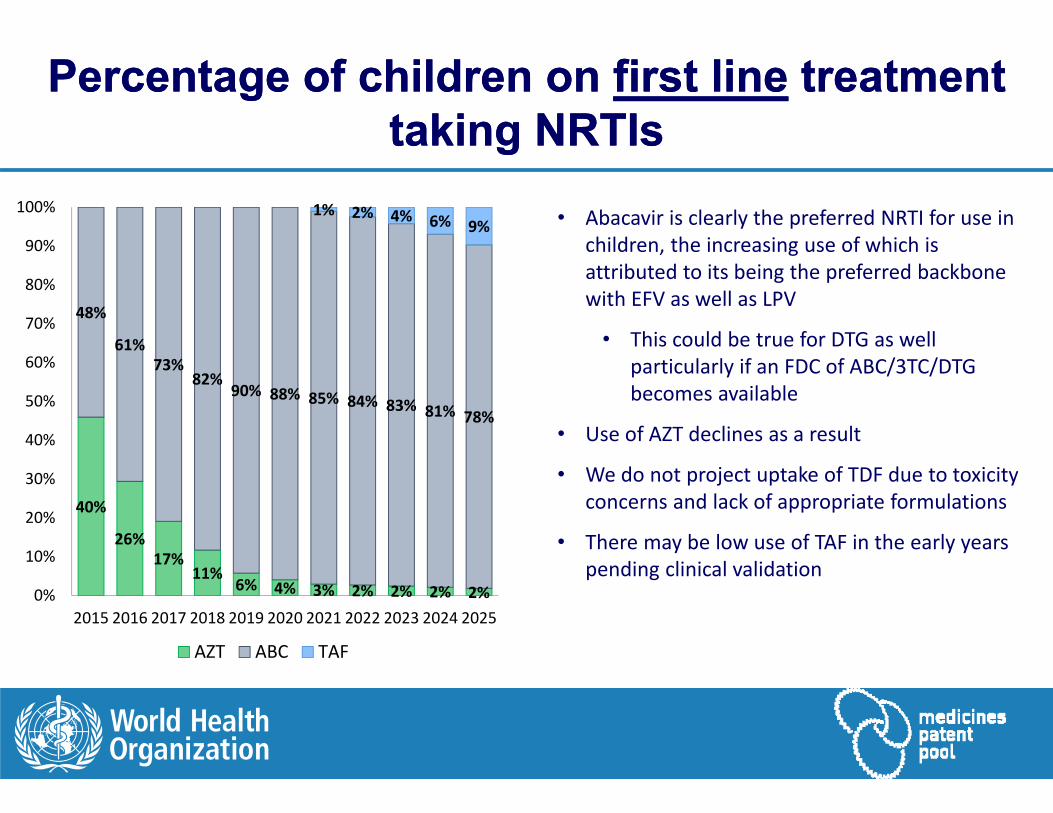
Percentage of children on first line treatment taking NRTIs
Percentage of children on first line treatment taking NRTIs
40%
26%17%
11%6% 4% 3% 2% 2% 2% 2%
48%
61%73%
82%90% 88% 85% 84% 83% 81% 78%
1% 2% 4% 6% 9%
0%
10%
20%
30%
40%
50%
60%
70%
80%
90%
100%
2015 2016 2017 2018 2019 2020 2021 2022 2023 2024 2025
AZT ABC TAF
• Abacavir is clearly the preferred NRTI for use in children, the increasing use of which is attributed to its being the preferred backbone with EFV as well as LPV
• This could be true for DTG as well particularly if an FDC of ABC/3TC/DTG becomes available
• Use of AZT declines as a result
• We do not project uptake of TDF due to toxicity concerns and lack of appropriate formulations
• There may be low use of TAF in the early years pending clinical validation
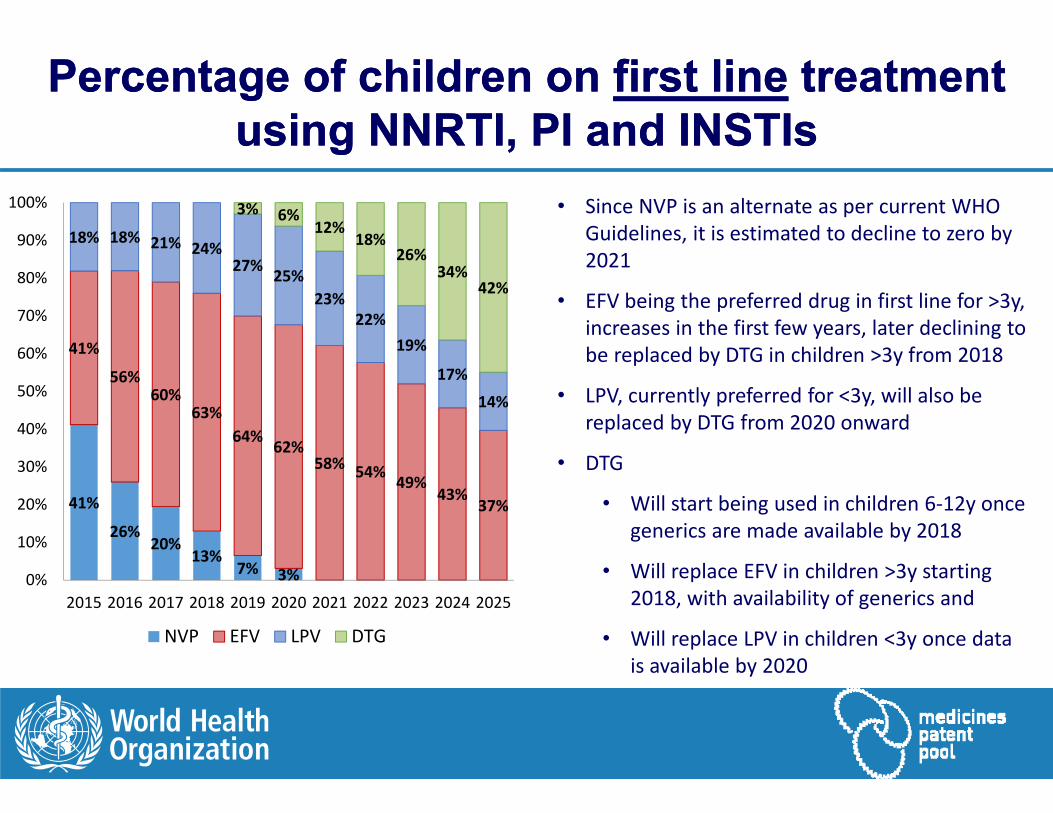
Percentage of children on first line treatment using NNRTI, PI and INSTIs
Percentage of children on first line treatment using NNRTI, PI and INSTIs
41%
26%20%
13%7% 3%
41%
56%60%
63%64% 62%
58% 54% 49%43%
37%
18% 18% 21% 24%27% 25%
23%22%
19%
17%
14%
3% 6%12%
18%26%
34%42%
0%
10%
20%
30%
40%
50%
60%
70%
80%
90%
100%
2015 2016 2017 2018 2019 2020 2021 2022 2023 2024 2025
NVP EFV LPV DTG
• Since NVP is an alternate as per current WHO Guidelines, it is estimated to decline to zero by 2021
• EFV being the preferred drug in first line for >3y, increases in the first few years, later declining to be replaced by DTG in children >3y from 2018
• LPV, currently preferred for <3y, will also be replaced by DTG from 2020 onward
• DTG
• Will start being used in children 6‐12y once generics are made available by 2018
• Will replace EFV in children >3y starting 2018, with availability of generics and
• Will replace LPV in children <3y once data is available by 2020

Percentage of children on second line treatment using NRTIs
Percentage of children on second line treatment using NRTIs
40%
52%58%
67% 64% 60% 57% 55% 53% 51% 48%
51%
38%30%
23% 23% 23%22% 23% 24% 23% 24%
15%7% 8% 10% 11% 11% 14% 14% 15% 16% 16%
1% 1% 2% 3%
0%
10%
20%
30%
40%
50%
60%
70%
80%
90%
100%
2015 2016 2017 2018 2019 2020 2021 2022 2023 2024 2025
AZT ABC TDF TAF
• In second‐line treatment, we assume an increased use of AZT, since most children would be using ABC in first line
• However, once ABC is available as an FDC with DTG, there will be a stability in its market share as is seen from 2020 onwards
• For TDF, we already see it being used in 27% patients in the last ARV Use Survey. This trend would be likely to continue, though at a stable rate
• We assume a very limited role of TAF in second line for children due to non availability of data

Percentage of children on second line treatment using NNRTI, PI and INSTI
Percentage of children on second line treatment using NNRTI, PI and INSTI
4% 4% 3% 2% 1%
82%
74% 71%68%
63% 59% 52% 49%44% 38% 33%
4%
4% 4%8%
7%7%
6%5%
5%4%
4%
3% 6%10% 15%
21%26%
31%
14% 17% 19% 22% 22% 22% 22% 22% 22% 22%
0%
10%
20%
30%
40%
50%
60%
70%
80%
90%
100%
2015 2016 2017 2018 2019 2020 2021 2022 2023 2024 2025
EFV LPV ATV DTG RAL
• Limited use of EFV, which is assumed to decline to zero by 2020
• All children failing NRTIs in first line would move to PI in second line. We have assumed most of these children would move to LPV and some to ATV
• Children failing LPV in first line would move mainly to RAL, but those which are now >3y could also move to DTG
• One thing to note here is that as in case of WHO guidelines for adults, we assume DTG would not be recommended in 2nd line for children. However, in the future some patients failing LPV when older than 3 years may move to DTG instead of RAL

ARV use in 2020 and 2025 - Million Children by Active Ingredient
ARV use in 2020 and 2025 - Million Children by Active Ingredient
API for all formulations included
‐ 0.0
0.2
1.1
0.0
0.7
0.4
‐ ‐0.1
‐0.0
0.0
0.2 0.3
‐
0.2 0.1
‐ 0.0
0.2
0.0 ‐
0.2
0.4
0.6
0.8
1.0
1.2
TAF TDF AZT ABC NVP EFV LPV ATV DRV DTG RAL
Num
nner of C
LHIV (m
n)
2020 2025

ConclusionConclusion
Our forecasts include a mix of judgement and data
Areas of convergence are useful to inform action
New ARVs represent potential business opportunities for manufacturers
Meanwhile, manufacture of existing products such as TDF and EFV would need to be ramped up to meet the growing demand due to higher number of patients forecasted to be on treatment
AcknowledgementsAcknowledgements
Marco Vitoria, World Health Organization
Martina Penazzato, World Health Organization
Vincent Habiyambere , World Health Organization
Boniface Dongmo, World Health Organization
Sandeep Juneja, Medicines Patent Pool
Fernando Pascual, Medicines Patent Pool
Peter Ghys, UNAIDS
Carlos Passarelli, UNAIDS
John Stover, Avenir Health
Top Related