


Languages
Pages
Legal


Follow-up Study on a Susceptibility Locus forSchizophrenia on Chromosome 6q
Maria Martinez,1* Lynn R. Goldin,2 Quihe Cao,2 Jing Zhang,2 Alan R. Sanders,2Derek J. Nancarrow,3,4 Jennifer M. Taylor,3 Douglas F. Levinson,5 Andrew Kirby,5Raymond R. Crowe,6 Nancy C. Andreasen,6 Donald W. Black,6 Jeremy M. Silverman,7David P. Lennon,4 Deborah A. Nertney,4 Donna M. Brown,8 Bryan J. Mowry,4 Elliot S. Gershon,2and Pablo V. Gejman2
1Genetique des Maladies Humaines, Institut National de la Recherche et de la Sante Medicale, Paris, France2Clinical Neurogenetics Branch, National Institute of Mental Health, Bethesda, Maryland3Queensland Institute of Medical Research, Brisbane, Australia4Department of Psychiatry, University of Queensland, and Queensland Centre for Schizophrenia Research, WolstonPark Hospital, Brisbane, Australia
5Department of Psychiatry, Allegheny University of the Health Sciences, Philadelphia, Pennsylvania6Mental Health Clinical Research Center and Department of Psychiatry, The University of Iowa College of Medicine,Iowa City, Iowa
7Department of Psychiatry, Mt. Sinai School of Medicine, New York, New York8Research Genetics, Inc., Huntsville, Alabama
Evidence for suggestive linkage to schizo-phrenia with chromosome 6q markers waspreviously reported from a two-stage ap-proach. Using nonparametric affected sibpairs (ASP) methods, nominal p-values of0.00018 and 0.00095 were obtained in thescreening (81 ASPs; 63 independent) and thereplication (109 ASPs; 87 independent) datasets, respectively. Here, we report a follow-up study of this 50cM 6q region using 12 mi-crosatellite markers to test for linkage toschizophrenia. We increased the replicationsample size by adding an independentsample of 43 multiplex pedigrees (66 ASPs;54 independent). Pairwise and multipointnonparametric linkage analyses conductedin this third data set showed evidence con-sistent with excess sharing in this 6q region,though the statistical level is weaker(p=0.013). When combining both replicationdata sets (total of 141 independent ASPs),an overall nominal p-value=0.000014(LOD=3.82) was obtained. The sibling recur-rence risk (ls) attributed to this putative 6qsusceptibility locus is estimated to be 1.92.The linkage region could not be narroweddown since LOD score values greater thanthree were observed within a 13cM region.The length of this region was only slightly
reduced (12cM) when using the total sampleof independent ASPs (204) obtained from allthree data sets. This suggests that very largesample sizes may be needed to narrow downthis region by ASP linkage methods. Studyof the etiological candidate genes in this re-gion is ongoing. Am. J. Med. Genet. (Neuro-psychiatr. Genet.) 88:337–343, 1999.© 1999 Wiley-Liss, Inc.
KEY WORDS: schizophrenia; linkage; ge-nome scan
INTRODUCTION
We have previously reported evidence for suggestivelinkage of chromosome 6q markers to schizophrenia intwo independent family samples: the sample of 81 af-fected-sib-pairs (ASPs) in 53 multiplex families fromthe NIMH IntraMural sample (NIMH-IM) and in theNIMH Schizophrenia Genetics Initiative sample(NIMH-GI) of 109 ASPs in 69 families [Cao et al.,1997]. In that study we screened 41 markers coveringall of chromosome 6 in the NIMH-IM data set. Usingpairwise and multipoint ASP statistics, we found thestrongest evidence for linkage within a 14-cM region ofthe 6q area (from D6S301 to D6S303, highestLOD43.06 at D6S454/423, p40.00018). In the NIMH-GI dataset, we genotyped 13 markers from this region,and evidence for suggestive linkage was also obtained(highest LOD42.35 at D6S424/434, p40.00095).
Although evidence for linkage to markers on chromo-some 6q is not definitive, our results are of sufficientinterest to merit further investigation. To increase the
*Correspondence to: Dr. M. Martinez, INSERM, U.358, HopitalSt-Louis, 1 Avenue Claude Vellefaux, 75 010 Paris, France.E-mail: [email protected]
Received 7 April 1998; Accepted 9 October 1998
American Journal of Medical Genetics (Neuropsychiatric Genetics) 88:337–343 (1999)
© 1999 Wiley-Liss, Inc.

replication sample size, we added an independentsample of 66 ASPs in 40 schizophrenia pedigrees (43nuclear families) collected in the United States andAustralia [Levinson et al., 1998]. This design is part ofa previously agreed upon collaboration between ourNIMH group and the US/Australia group to examineareas according to criteria of follow-up utilized in ei-ther center. For NIMH-IM we follow up linkage resultswith pairwise nominal p-values less than 0.01. We ap-plied the same overall methodology for genotyping andlinkage analysis as in our previous publication [Cao etal., 1997]. We now report the results of 12 markersspanning a region of 50cM in 6q; from D6S455 (position83.7cM) to D6S472 (position 135.7cM). We genotypedmore markers at the extremes and also increased mapdensity in specific areas: at 110.9cM in both NIMH-IMand NIMH-GI data sets and at 91.2cM in NIMH-GIdata set. We found additional evidence for linkage inthis region in the US/Australia data set (nominal p-value40.013).
MATERIALS AND METHODSFamilies: Ascertainment and SCZ Definition
Genome scanning data set: NIMH-IM. This dataset has been previously described in Cao et al. [1997]. Atotal of 53 families with two participating siblings af-fected with either schizophrenia (SCZ) or schizoaffec-tive disorder (SA) were studied. This study was ap-proved by the NIMH Institutional Review Board, andall participants gave written informed consent. Diag-nostic resources included a semistructured diagnosticinterview [Schedule for Affective Disorders and Schizo-phrenia -Lifetime version (SADS-L)] [Endicott andSpitzer, 1978], systematic review of medical records,and family history interviews [Gershon et al., 1988].The predominant ethnic composition per family was:Caucasian 84.1%, African-American 3.5%, others12.4%. Of all the possible affected sib-pair combina-tions, the ASP types were: SCZ-SCZ 43.7%, SCZ-SA,bipolar type 31%; SCZ-SA, depressive type 10.3%; SA,depressive type-SA, depressive type 4.6%; SA, bipolartype-SA, depressive type 3.4%; SA, bipolar type-SA, bi-polar type 6.9%.
First replication data set: NIMH-GI. Sixty-ninefamilies with an affected sib pair with SCZ or SA wereobtained from the NIMH-GI collection. Data collectionincluded a structured interview with the diagnostic in-terview for genetic studies [Nurnberger et al, 1994],and family history data were collected by using thefamily instrument for genetic studies and diagnosis byDiagnotic and Statistical Manual of Mental Disorders(DSM-III R) [American Psychiatric Association, 1987].The ethnic composition of the subset of families used byus for chromosome 6 linkage mapping is 51% Cauca-sian, 35% African-American, and 14% of other ethnicorigins. Of all the possible ASP combinations, the ASPtypes were SCZ-SCZ 73%; SCZ-SA, depressive type25%; and SA, depressive type-SA, depressive type 2%.
Second replication data set: US/Australia Sam-ple. The 43 pedigrees were ascertained in Australia(18), Philadelphia (14), Iowa (8), and New York (3).Ethnic backgrounds were European-Caucasian (72%),
African-American (21%), and other (Caribbean-Hispanic, Aboriginal/Micronesian, and Asian, 9%).Modified SADS [Endicott and Spitzer, 1978] or compre-hensive assessment of symptoms and history (CASH)[Andreasen et al., 1992] diagnostic interviews werecompleted with probands and available relatives. Pedi-grees were included if there was a proband withchronic schizophrenia and either a sibling with schizo-phrenia or two relatives with any nonaffective psycho-sis (see below) by consensus best estimate diagnosisusing DSM-III R criteria, with affected individuals con-nected by first- or second-degree relationships. Writteninformed consent was obtained from all subjects.
Diagnostic reliability and differences acrosssamples. For the NIMH-IM and NIMH-GI samples,only subjects with consensus diagnoses of SCZ or SAwere included as described above. For the US/Australiasample, previous linkage analyses had been based on amodel that included other nonaffective psychoses, andthe diagnosis of schizophrenia was assigned conserva-tively. To determine the best common model for thisstudy, a diagnostic reliability exercise was conductedfor the NIMH-IM and US/Australia samples. Each re-search group used its usual consensus procedure to di-agnose 15 cases from the other site, for a total of 30cases. Cohen’s kappa was 0.84 for the category of non-affective psychosis (including schizophrenia, schizoaf-fective, delusional, and nonaffective atypical psychosis)and 0.73 for a narrow category including schizophreniaand schizoaffective disorder. Most disagreements werecases given a narrow diagnosis by NIMH diagnosti-cians and a broader diagnosis by US/Australia diagnos-ticians. Based on these results it was decided to includeall nonaffective psychosis cases in the US/Australiasample because the narrower model appeared to havebeen applied in a more restrictive fashion in thissample. It was not possible to conduct a similar studywith NIMH-GI cases because only the consensus diag-nosis is made publicly available. However, reported in-ter-rater reliability results across multiple academicsites were quite high for schizophrenia [Nurnberger etal., 1994], and while lower for schizoaffective disorder,reliability was quite high for the category of ‘‘schizo-phrenia or schizoaffective disorder’’ [Faraone et al.,1996], as has been reported by others [Roy et al., 1997].
Genotyping
The genotyping of the NIMH-IM data set was per-formed by radioactive methods or fluorescence-basedgenotyping depending on the marker [Cao et al., 1997;Gejman et al., 1993]. Genotyping of the US/Australiasample was performed by semiautomated methods us-ing fluorescinated markers at Research Genetics, Inc.,as previously described [Levinson et al., 1998], or bymanual methods using radioactive markers at Queen-sland Institute of Biomedical Research as previouslydescribed [Mowry et al., 1995], depending on themarker. For each marker, all subjects were typed at thesame laboratory.
Statistical Analysis
Marker allele frequencies were set to their maximumlikelihood values estimated in each data set with the
338 Martinez et al.

computer program ILINK from the Linkage package[Lathrop and Lalouel, 1984].
Pairwise affected sib-pair analysis was conductedwith the SIBPAIR program [Terwilliger, 1996], whichprovides a likelihood-based test statistic for linkagethat is equivalent to the LOD score calculated underthe assumption of a simple recessive disease modelwith phase-unknown matings [Knapp et al., 1994]. Totest for linkage, the likelihoods over all families aremaximized as a function of the sharing rate (y) and thelikelihood ratio test statistic is calculated against thenull hypothesis of y40.5. The statistic follows a chi-square distribution with one degree of freedom (df) andcan thus be expressed as a LOD score.
Multipoint nonparametric linkage analysis, whichuses information from all markers simultaneously, wasperformed by using two statistical methods. First, weused the program sib_phase from the ASPEX package[version 1.12, Hinds and Risch, 1996] to estimate rateof identity by descent (IBD) sharing in ASPs. The maxi-mized LOD score, at any chromosomal location, is ob-tained as a function of y, where y is the maximumlikelihood estimate of the rate of IBD sharing. The in-dependent sharing model (or linear model) is definedby: z24y2, z142y(1−y) and z04(1−y)2, where z2, z1, andz0 are the probabilities for an affected sib-pair of IBDstatus 2, 1, and 0, respectively. The maximized LODscores follow a x2 distribution with 1 df. An evaluationof the sibling recurrence risk (ls) attributed to a locuscan be calculated as 0.25/z0 [Risch, 1990]. To check thesensitivity of our results to marker allele frequencymisspecification we also used the program sib_ibd fromthe ASPEX package, which restricts linkage analysis toASPs with unambiguous IBD status. For families withmore than two (r>2) affected sibs, ASPEX programscan use either all possible pairs (r[r−1]/2) or only ther−1 independent sib pairs obtained from a sibship bypairing all other sibs with the first sib. Since creatingall pairs from larger sibships may underestimate the pvalues in the far tail of the statistic distribution [Davisand Weeks, 1997; Ebers et al., 1996], we computedmultipoint LOD score values using only the indepen-dent sib-pairs.
Multipoint linkage analysis was also undertakenwith the GENEHUNTER-PLUS program [Kong and
Cox, 1997; Kruglyak et al., 1996,] which allows non-parametric linkage (NPL) analysis of moderately sizedpedigrees. The Z-all statistic compares the observedIBD sharing among all affected family members withthat expected under the null hypothesis of no linkage.We chose also to apply the NPL method because it al-lows for all 43 US/Australia multiplex pedigrees to beused and for non-sib affected relatives in the other datasets to be included. The Z score statistic is assumed toasymptotically follow a standard normal distribution.However, when data are not fully informative, the re-ported p-values overestimate true significance levels[Kruglyak et al., 1996]. A less conservative method hasbeen implemented into the GENEHUNTER-PLUS pro-gram [Kong and Cox, 1997]. It calculates a likelihoodratio-based statistic as a function of the IBD sharingamong all affected relatives (Zlr ).
Multipoint analysis in combined data sets was car-ried out preserving the specific marker allele frequen-cies, i.e., using the allele frequencies estimated in eachdata set separately. For instance, when combining bothreplication data sets, each marker, k, was assumed tohave a total number of alleles equal to nk+mk, wherenk and mk are the total number of marker alleles infirst and second replication data sets, respectively.Then, for each marker, k, observed genotypes in thesecond data set were modified so that new marker al-lele numbers were set equal to the observed allele num-ber +nk.
RESULTS
The characteristics of the family data sets are givenin Table I. The 53 families of the screening data set(NIMH-IM) have a total sample of 81 ASPs (63 inde-pendent), and about 70% of ASPs have both parentsgenotyped (78%4 63/81; 71% 4 45/63). The first rep-lication data set (NIMH-GI) is larger—69 families with109 ASPs (87 independent)—but the proportion ofASPs with available parental marker data is muchlower; both parents are genotyped in about 20% ofASPs (18%4 10/109; 22%419/87). In this data set, themajority of ASPs have only one parent genotyped(63%4 69/109; 59%4 51/87). The US/Australia dataset is the smallest family sample: 66 ASPs (54 indepen-
TABLE I. Description of Nuclear Families With ASPs Obtained From NIMH-IM, NIMH-GI,and US/Australia SZ Multiplex Pedigrees
Panel NIMH-IM NIMH-GI US/Australia
Number ofMultiplex pedigrees 55 63 43Pedigrees with ù 1 ASP 53 63 40Nuclear families with ù 1 ASP 53 69 43# Parents with DNA available 2 1 0 Total 2 1 0 Total 2 1 0 TotalNumber of affected sibs, r:r 4 2 30 17 1 48 17 26 11 54 20 5 8 33r 4 3 2 — — 2 1 9 3 13 3 6 — 9r 4 4 2 — — 2 — 1 — 1 1 — — 1r 4 5 — — — — — 1 — 1 — — — —r 4 6 1 — — 1 — — — — — — — —Total nuclear families 35 17 1 53 18 37 14 69 24 11 8 43Total affected sib-pairs 63 17 1 81 20 69 20 109 35 23 8 66Total independent ASPs 45 17 1 63 19 51 17 87 29 17 8 54
Schizophrenia and the 6q22 Region 339
dent) obtained from 43 nuclear families (40 multiplexfamilies). The proportion of ASPs with both parentsgenotyped is intermediate (53%435/66; 54%429/54).The size of the combined replication data set (NIMH-GIplus US/Australia: 112 families; 141 independentASPs) is about twice that of the NIMH-IM data set, butthe rate of ASPs with complete parental marker data isabout twofold lower (34%).
The results of the single point analyses are given inTable II. The NIMH-IM and NIMH-GI data sets havealready been presented [Cao et al., 1997]. We haveadded additional markers in these samples: D6S1021in NIMH-IM (p>0.10) and D6S445 (p>0.10), D6S1021(p40.0009), and D6S472 (p40.09) in the NIMH-GIsample. The genomewide scan of the US/Australia dataset has been recently presented [Levinson et al., 1998],including two (D6S1021 and D6S474) markers fromour 6q map. Here, we have thus typed 10 new markers,resulting in a denser map with much higher informa-tion content. In the US/Australia data set, there is ex-cess allele sharing for several markers but onlyD6S424 is nominally ‘‘significant,’’ (LOD40.89,p40.022).
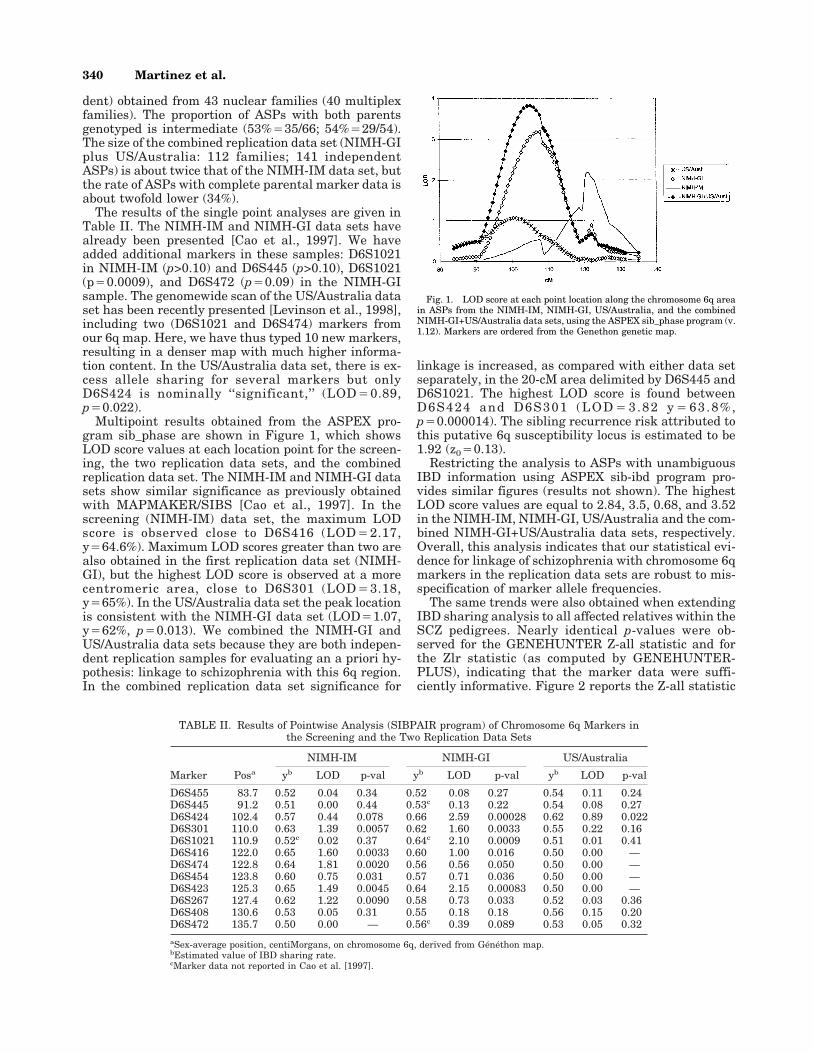
Multipoint results obtained from the ASPEX pro-gram sib_phase are shown in Figure 1, which showsLOD score values at each location point for the screen-ing, the two replication data sets, and the combinedreplication data set. The NIMH-IM and NIMH-GI datasets show similar significance as previously obtainedwith MAPMAKER/SIBS [Cao et al., 1997]. In thescreening (NIMH-IM) data set, the maximum LODscore is observed close to D6S416 (LOD42.17,y464.6%). Maximum LOD scores greater than two arealso obtained in the first replication data set (NIMH-GI), but the highest LOD score is observed at a morecentromeric area, close to D6S301 (LOD43.18,y465%). In the US/Australia data set the peak locationis consistent with the NIMH-GI data set (LOD41.07,y462%, p40.013). We combined the NIMH-GI andUS/Australia data sets because they are both indepen-dent replication samples for evaluating an a priori hy-pothesis: linkage to schizophrenia with this 6q region.In the combined replication data set significance for
linkage is increased, as compared with either data setseparately, in the 20-cM area delimited by D6S445 andD6S1021. The highest LOD score is found betweenD6S424 and D6S301 (LOD43.82 y463.8%,p40.000014). The sibling recurrence risk attributed tothis putative 6q susceptibility locus is estimated to be1.92 (z040.13).
Restricting the analysis to ASPs with unambiguousIBD information using ASPEX sib-ibd program pro-vides similar figures (results not shown). The highestLOD score values are equal to 2.84, 3.5, 0.68, and 3.52in the NIMH-IM, NIMH-GI, US/Australia and the com-bined NIMH-GI+US/Australia data sets, respectively.Overall, this analysis indicates that our statistical evi-dence for linkage of schizophrenia with chromosome 6qmarkers in the replication data sets are robust to mis-specification of marker allele frequencies.
The same trends were also obtained when extendingIBD sharing analysis to all affected relatives within theSCZ pedigrees. Nearly identical p-values were ob-served for the GENEHUNTER Z-all statistic and forthe Zlr statistic (as computed by GENEHUNTER-PLUS), indicating that the marker data were suffi-ciently informative. Figure 2 reports the Z-all statistic
TABLE II. Results of Pointwise Analysis (SIBPAIR program) of Chromosome 6q Markers inthe Screening and the Two Replication Data Sets
Marker Posa
NIMH-IM NIMH-GI US/Australia
yb LOD p-val yb LOD p-val yb LOD p-val
D6S455 83.7 0.52 0.04 0.34 0.52 0.08 0.27 0.54 0.11 0.24D6S445 91.2 0.51 0.00 0.44 0.53c 0.13 0.22 0.54 0.08 0.27D6S424 102.4 0.57 0.44 0.078 0.66 2.59 0.00028 0.62 0.89 0.022D6S301 110.0 0.63 1.39 0.0057 0.62 1.60 0.0033 0.55 0.22 0.16D6S1021 110.9 0.52c 0.02 0.37 0.64c 2.10 0.0009 0.51 0.01 0.41D6S416 122.0 0.65 1.60 0.0033 0.60 1.00 0.016 0.50 0.00 —D6S474 122.8 0.64 1.81 0.0020 0.56 0.56 0.050 0.50 0.00 —D6S454 123.8 0.60 0.75 0.031 0.57 0.71 0.036 0.50 0.00 —D6S423 125.3 0.65 1.49 0.0045 0.64 2.15 0.00083 0.50 0.00 —D6S267 127.4 0.62 1.22 0.0090 0.58 0.73 0.033 0.52 0.03 0.36D6S408 130.6 0.53 0.05 0.31 0.55 0.18 0.18 0.56 0.15 0.20D6S472 135.7 0.50 0.00 — 0.56c 0.39 0.089 0.53 0.05 0.32
aSex-average position, centiMorgans, on chromosome 6q, derived from Généthon map.bEstimated value of IBD sharing rate.cMarker data not reported in Cao et al. [1997].
Fig. 1. LOD score at each point location along the chromosome 6q areain ASPs from the NIMH-IM, NIMH-GI, US/Australia, and the combinedNIMH-GI+US/Australia data sets, using the ASPEX sib_phase program (v.1.12). Markers are ordered from the Genethon genetic map.
340 Martinez et al.

or NPL score. As before, the highest evidence for link-age in the replication data sets is located in a morecentromeric area than that observed in the screeningdata set. In the NIMH-IM sample the highest statisticvalue is located at 124 cM (Z-all43.38/Zlr43.78). Inthe NIMH-GI and the US/Australia samples, the high-est values are located at 110 cM (Z-all43.09/Zlr43.06)and 103 cM (Z-all41.90/Zlr41.97), respectively. In theoverall replication data set, the highest evidence forlinkage is located at 110 cM (Z-all43.7/Zlr43.6,p40.00014).
All three samples reported here have a heteroge-neous ethnic background. Most families are Caucasianin the NIMH-IM and US/Australia samples. TheNIMH-GI sample has the highest percentage (35%) offamilies of African-American descent. Because the GIgroup has conducted its analyses separately for Euro-pean-American and African-American subsets of fami-lies, and has presented differing results for the twosubsets in some regions [Faraone et al., 1997], we alsoseparated the NIMH-GI pedigrees into these two sub-groups to determine whether the evidence favoringlinkage on chromosome 6q differed by racial subgroup.Table III shows for several of the markers genotyped inthe NIMH-GI data set the results of the SIBPAIR pro-gram for the Caucasian and African-Americans sub-samples. For these calculations, we computed allelefrequencies separately in each group. As is evident
from Table III, there is excess sharing in both sub-samples, with the significance levels being proportionalto the sample size. Thus, we conclude that the putativesusceptibility locus for schizophrenia is not specific toone population. The NIMH-IM and US/Australia datasets do not have enough African-American families toallow a test for differences.
DISCUSSION
The major finding in this study is that an additionalindependent sample of schizophrenia families hasshown evidence consistent with excess sharing in thisregion of 6q but the statistical evidence is weaker(y462%, p40.013) than in the other two data sets.Because family data sets may not have comparablepower (they differ in terms of sample size, marker datainformation rate of ASPs with missing parental geno-types, etc.), we have evaluated, through computersimulations, the power of each replication data set(given the observed family structures, observed geno-types for parents and unaffected sibs of affected off-spring) to detect an excess of marker alleles IBD shar-ing (y) of 57, 60, or 64%. These are the values estimatedunder the pairwise affected sib-pair method (SIBPAIRprogram), in the NIMH-IM data set with the chromo-some 6q markers D6S424, D6S454, and D6S474. Thesey values correspond to locus specific ls41.4, 1.6, or 1.9,respectively. Table IV presents power estimates of thetwo replication data sets (rate of replicates out of 2,000exceeding a maximum LOD score value of 1, 1.5, 2, 2.5,or 3), for the three ls values.
The two replication data sets do not have similarpower. The power of NIMH-GI is almost twice that ofthe US/Australia data set. As expected, both data setshave good power to find LOD scores greater than 1.0when y 4 64%.
To our knowledge, linkage for schizophrenia to this6q area has been partially tested by one group [Strauband Kendler, see Nurnberger and Foroud, 1998] butnegative linkage results were reported in this fourthfamilial data set.
The issue of what constitutes a statistically signifi-cant finding and replication is a challenging problemfor the genetic analyses of complex traits and raisescontroversial debate. Lander and Krugylak [1995] haveproposed thresholds derived from genomewide signifi-cance thresholds. Following these guidelines, none ofour analyzed samples (initial and replication ones) in-
Fig. 2. Multipoint Z-all scores at each point location along the chromo-some 6q in the NIMH-IM, NIMH-GI, US/Australia, and the combinedNIMH-GI + US/Australia family data sets using the GENEHUNTER-PLUS program (v. 1.1).
TABLE III. SIBPAIR Results in the NIMH-GI Data Set by Ethnic Background
Marker
African-Americans Caucasian
SharedNot
Shared ya p SharedNot
Shared ya p
D6S474 26.2 23.1 0.55 0.22 46.3 38.2 0.56 0.14D6S454 24.2 18.4 0.59 0.11 40.4 37.0 0.54 0.21D6S423 30.9 22.8 0.59 0.054 43.1 23.9 0.66 0.004D6S416 27.1 19.0 0.60 0.056 31.7 26.3 0.56 0.14D6S408 23.1 25.4 — — 29.0 23.2 0.58 0.11D6S301 29.5 21.2 0.59 0.07 45.4 27.1 0.63 0.011D6S267 28.4 19.7 0.60 0.056 38.5 33.5 0.54 0.19
aEstimated value of IBD sharing rate.
Schizophrenia and the 6q22 Region 341
dependently provided evidence for significant linkage(i.e., p-values lower than the threshold of 2.210−5).Note, however, that in our combined replication dataset the nominal p-value (1.410−5) exceeds this thresh-old. For linkage analyses of multifactorial traits, theuse of such guidelines, instead of nominal p-values, re-mains controversial [Curtis, 1996; Witte et al., 1996].Several criticisms have been raised about the accuracyof these guidelines because, for instance, they do notaccount for the power of the analyzed samples. Fur-thermore, whether one should apply the same criteriafor significance to localize a gene and to replicate itslocalization is another controversial issue. It has beenargued that in a replication study, the nominal p-valuerequired is lower than that required in the initial study[Lander and Krugylak, 1995; Lernmark and Ott, 1998].
In the US/Australia data set the peak location, closeto D6S424, is consistent with the NIMH-GI data set(close to D6S301). In the total replication data set theoverall peak location is still located between these twomarkers (at 104 cM, LOD43.82, p40.000014), whichis about 17 cM centromeric to the peak obtained in theNIMH-IM data set (D6S416). One could questionwhether this is a consistent replication. However, ithas been shown by simulation that the location of thetrue peak can vary substantially, especially for a locus-specific ls < 2.0 [Hauser and Boehnke, 1997]. Unfortu-nately, this additional US/Australia replication samplehas not allowed us to narrow down this linkage region.In the total replication data set, LOD score valuesgreater than three are obtained within a 13-cM area
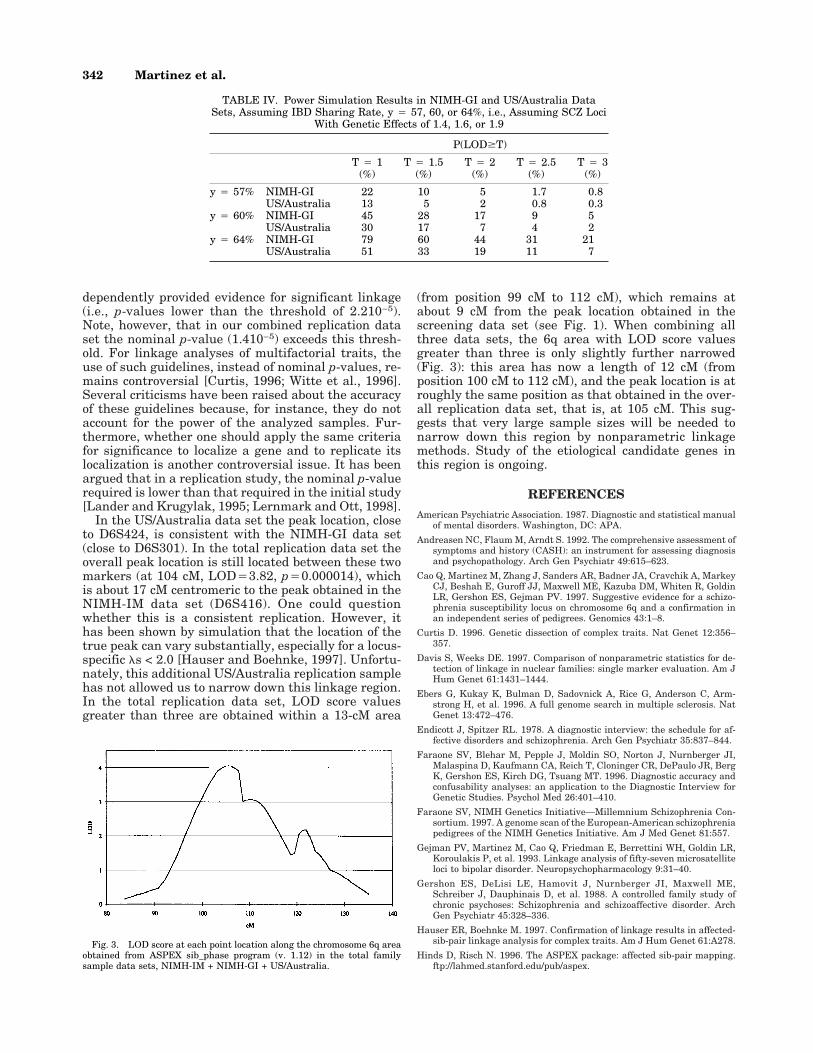
(from position 99 cM to 112 cM), which remains atabout 9 cM from the peak location obtained in thescreening data set (see Fig. 1). When combining allthree data sets, the 6q area with LOD score valuesgreater than three is only slightly further narrowed(Fig. 3): this area has now a length of 12 cM (fromposition 100 cM to 112 cM), and the peak location is atroughly the same position as that obtained in the over-all replication data set, that is, at 105 cM. This sug-gests that very large sample sizes will be needed tonarrow down this region by nonparametric linkagemethods. Study of the etiological candidate genes inthis region is ongoing.
REFERENCESAmerican Psychiatric Association. 1987. Diagnostic and statistical manual
of mental disorders. Washington, DC: APA.
Andreasen NC, Flaum M, Arndt S. 1992. The comprehensive assessment ofsymptoms and history (CASH): an instrument for assessing diagnosisand psychopathology. Arch Gen Psychiatr 49:615–623.
Cao Q, Martinez M, Zhang J, Sanders AR, Badner JA, Cravchik A, MarkeyCJ, Beshah E, Guroff JJ, Maxwell ME, Kazuba DM, Whiten R, GoldinLR, Gershon ES, Gejman PV. 1997. Suggestive evidence for a schizo-phrenia susceptibility locus on chromosome 6q and a confirmation inan independent series of pedigrees. Genomics 43:1–8.
Curtis D. 1996. Genetic dissection of complex traits. Nat Genet 12:356–357.
Davis S, Weeks DE. 1997. Comparison of nonparametric statistics for de-tection of linkage in nuclear families: single marker evaluation. Am JHum Genet 61:1431–1444.
Ebers G, Kukay K, Bulman D, Sadovnick A, Rice G, Anderson C, Arm-strong H, et al. 1996. A full genome search in multiple sclerosis. NatGenet 13:472–476.
Endicott J, Spitzer RL. 1978. A diagnostic interview: the schedule for af-fective disorders and schizophrenia. Arch Gen Psychiatr 35:837–844.
Faraone SV, Blehar M, Pepple J, Moldin SO, Norton J, Nurnberger JI,Malaspina D, Kaufmann CA, Reich T, Cloninger CR, DePaulo JR, BergK, Gershon ES, Kirch DG, Tsuang MT. 1996. Diagnostic accuracy andconfusability analyses: an application to the Diagnostic Interview forGenetic Studies. Psychol Med 26:401–410.
Faraone SV, NIMH Genetics Initiative—Millemnium Schizophrenia Con-sortium. 1997. A genome scan of the European-American schizophreniapedigrees of the NIMH Genetics Initiative. Am J Med Genet 81:557.
Gejman PV, Martinez M, Cao Q, Friedman E, Berrettini WH, Goldin LR,Koroulakis P, et al. 1993. Linkage analysis of fifty-seven microsatelliteloci to bipolar disorder. Neuropsychopharmacology 9:31–40.
Gershon ES, DeLisi LE, Hamovit J, Nurnberger JI, Maxwell ME,Schreiber J, Dauphinais D, et al. 1988. A controlled family study ofchronic psychoses: Schizophrenia and schizoaffective disorder. ArchGen Psychiatr 45:328–336.
Hauser ER, Boehnke M. 1997. Confirmation of linkage results in affected-sib-pair linkage analysis for complex traits. Am J Hum Genet 61:A278.
Hinds D, Risch N. 1996. The ASPEX package: affected sib-pair mapping.ftp://lahmed.stanford.edu/pub/aspex.
Fig. 3. LOD score at each point location along the chromosome 6q areaobtained from ASPEX sib_phase program (v. 1.12) in the total familysample data sets, NIMH-IM + NIMH-GI + US/Australia.
TABLE IV. Power Simulation Results in NIMH-GI and US/Australia DataSets, Assuming IBD Sharing Rate, y 4 57, 60, or 64%, i.e., Assuming SCZ Loci
With Genetic Effects of 1.4, 1.6, or 1.9
P(LOD$T)
T 4 1(%)
T 4 1.5(%)
T 4 2(%)
T 4 2.5(%)
T 4 3(%)
y 4 57% NIMH-GI 22 10 5 1.7 0.8US/Australia 13 5 2 0.8 0.3
y 4 60% NIMH-GI 45 28 17 9 5US/Australia 30 17 7 4 2
y 4 64% NIMH-GI 79 60 44 31 21US/Australia 51 33 19 11 7
342 Martinez et al.

Knapp M, Seuchter S, Baur M. 1994. Linkage analysis in nuclear families.II. Relationship between affected sib-pair tests and lod score analysis.Hum Hered 44:44–51.
Kong A, Cox N J. 1997. Allele sharing models: LOD scores and accuratelinkage tests. Am J Hum Genet 61:1179–1188.
Kruglyak L, Daly MJ, Reeve-Daly MP, Lander ES. 1996. Parametric andnonparametric linkage analysis: a unified multipoint approach. Am JHum Genet 58:1347–1363.
Lander E, Krugylak L. 1995. Genetic dissection of complex traits: Guide-lines for interpreting and reporting linkage results. Nat Genet 11:241–247.
Lathrop GM, Lalouel JM. 1984. Easy calculations of LOD scores and ge-netic risks on small computers. Am J Hum Genet 36:460–465.
Lermark A, Ott J. 1998. Sometime it’s hot, sometimes it’s not. Nat Genet3:213–214.
Levinson DF, Mahtani MM, Nancarrow DJ, Brown DM, Kruglyak L, KirbyA, Hayward NK, Crowe RR, Andreasen NC, Black DW, Silverman JM,Endicott J, Sharpe L, Mohs RC, Siever LJ, Walters MK, Lennon DP,Jones HL, Nertney DA, Daly MJ, Mowry BJ. 1998. A genome scan ofschizophrenia. Am J Psychiatr 6:741–750.
Mowry BJ, Nancarrow DJ, Lennon DP, Sandkuijl LA, Crowe RR, Silver-
man JM, Mohs RC, Siever LJ, Endicott J, Sharpe L, Walters MK,Hayward NK, Levinson DF. 1995. Schizophrenia susceptibility andchromosome 6p24-22. Nat Genet 11:233–234.
Nurnberger J, Blehar MC, Kaufmann CA, York-Cooler C, Simpson SG,Harkavy-Friedman J, Severe JB et al. 1994. Diagnostic interview forgenetic studies. Rationale unique features, and training. NIMH Genet-ics Initiative. Arch Gen Psychiatr 51:849–859.
Nurnberger JI, Forout T. 1998. Chromosome 6 workshop. Psychiatr Genet8:79–83.
Risch N. 1990. Linkage strategies for genetically complex traits. I. Multi-locus models. Am J Hum Genet 46:222–228.
Roy MA, Lanctot G, Merette C, Cliche D, Fournier JP, Boutin P, RodrigueC, Charron L, Turgeon M, Hamel M, Montgrain N, Nicole L, Pires A,Wallot H, Ponton AM, Garneau Y, Dion C, Lavallee JC, Potvin A,Szatmari P, Maziade M. 1997. Clinical and methodological factors re-lated to reliability of the best-estimate diagnostic procedure. Am JPsychiatr 154:1726–1733.
Terwilliger J. 1996. Program SIBPAIR: sibpair analysis on nuclear fami-lies. ftp://linkage.cpmc.columbia.edu.
Witte JS, Elton RC, Schork NJ. 1996. Genetic dissection of complex traits.Nat Genet 12:355–356.
Schizophrenia and the 6q22 Region 343
Top Related