


Languages
Pages
Legal


Flood risk in Europe: analysis of exposure in 13 Countries
Nicola Lugeri, Elisabetta Genovese, Carlo Lavalle, Ad De Roo
Institute for Environment and Sustainability 2006
EUR 22525 EN

Flood risk in Europe: analysis of exposure in 13 Countries
Nicola Lugeri, Elisabetta Genovese, Carlo Lavalle, Ad De Roo
Institute for Environment and Sustainability 2006
EUR 22525 EN
The mission of the Institute for Environment and Sustainability is to provide scientific and technical support to the European Union's policies for protecting the environment and the EU Strategy for Sustainable Development. European Commission Directorate-General Joint Research Centre Institute for Environment and Sustainability, Land Management and Natural Hazard Unit, Floods and other weather driven natural hazards Contact information Address: TP 261, Via E. Fermi 1, I-21020 Ispra (VA), Italy E-mail: [email protected] Tel.: +39 0332 78 5187 Fax: +39 0332 78 9085 http://ies.jrc.ec.europa.eu/ http://www.jrc.ec.europa.eu/ Legal Notice Neither the European Commission nor any person acting on behalf of the Commission is responsible for the use which might be made of this publication. A great deal of additional information on the European Union is available on the Internet. It can be accessed through the Europa server http://europa.eu Background photo in cover image composition: Flooding in Prague 2002. ANSA (from www.corriere.it) EUR 22525 EN ISSN 1018-5593 Luxembourg: Office for Official Publications of the European Communities © European Communities, 2006 Reproduction is authorised provided the source is acknowledged Printed in Italy
Table of contents
Introduction 1
1. Indicators and methodology 3
1.1. Hazard map 3
1.2. Land Cover map 5
1.3 Methodology 6
2. Results and discussion 9
2.1 General results 9
2.2 Detailed results 11
Conclusions and future work 16
Appendix 1: Corine Land Cover Legend 18
Nomenclature definitions 19
Appendix 2: Charts 20
Charts by Nation 20 Charts by Corine Land Cover code 26 References 30 Related web sites 31
List of Figures
Chapter 1:
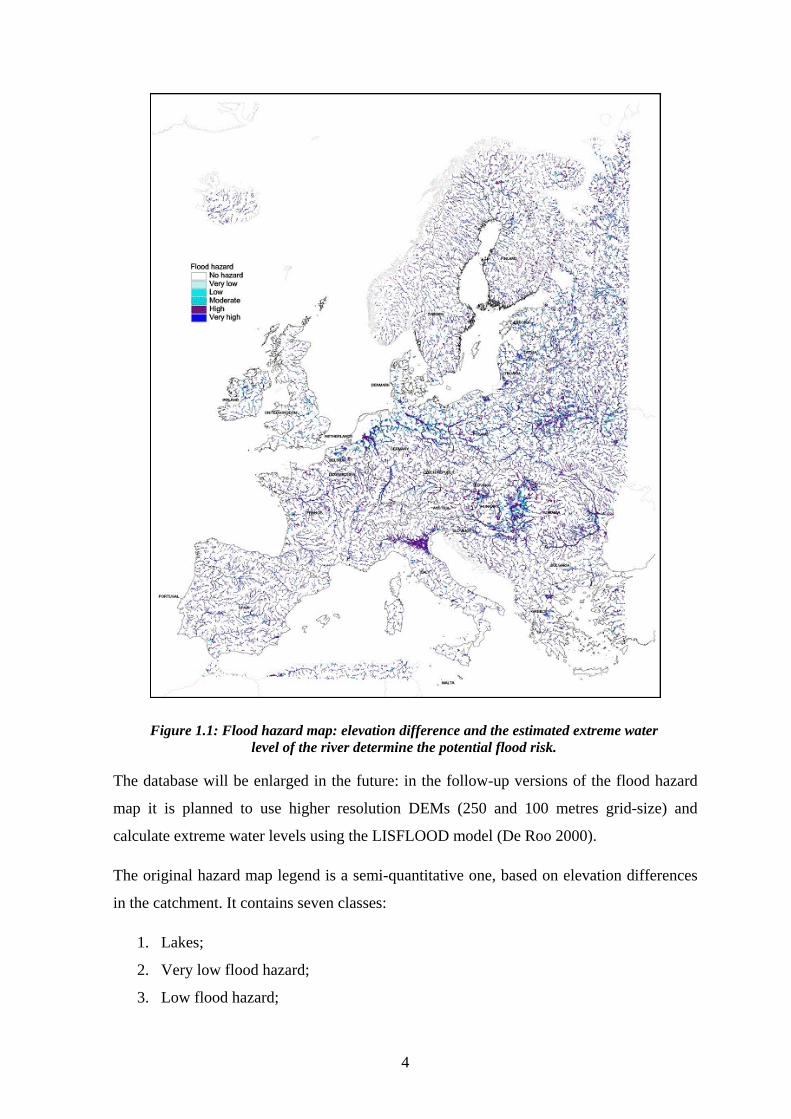
Figure 1.1: Flood hazard map: elevation difference and the estimated extreme water level of the river determine the potential flood risk. 4
Chapter 2:
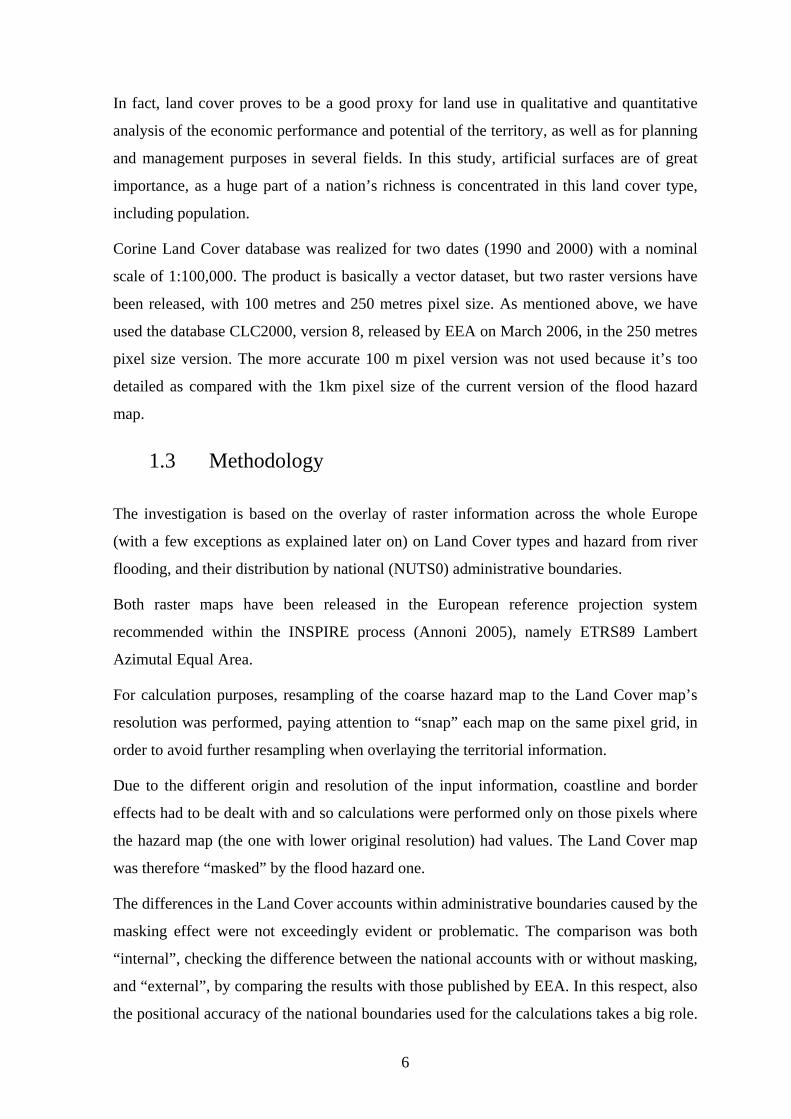
Figure 2.1: Overlay of Corine Land Cover 2000 and the European flood hazard map. For this study only 13 countries are analysed. 12
1
Introduction
In recent years, dramatic river flooding has occurred in several regions of Europe causing
numerous casualties and the damage reached unprecedented proportions.
There are two basic reasons for this: a) the increased frequency of extreme weather events,
likely due to modifications of the climate regime, b) built-up areas (e.g. urbanisation and
infrastructures) continue to grow mainly in flood prone areas. The combination of these
two elements is particularly worrying since changes in land use associated with urban
development affect flooding in many ways. Urbanisation generally increases the size and
frequency of floods and may expose communities to increasing flood hazards (Konrad
2003). Altogether, these trends contribute to an unsustainable development pattern, with an
increasing exposure to natural hazards in large regions of Europe .
The protection of human and capital assets from natural hazards is high in the agenda of
the European policies and is directly addressed in the European Regional Development
Fund for the programming period 2007-2013. The prevention of risks is indeed a priority
for investments in the actions linked to the three major objectives for structural funds
interventions (namely: convergence, competitiveness and cooperation).
This technical note describes a contribution to the evaluation of exposures to flood risk in
13 out of the 15 Countries that can receive support from Structural Funds under the
Convergence objective. The work is part of a wider frame of research activities carried out
at the Weather Driven Natural Hazard action of the Institute for Environment and
Sustainability of JRC.
The first step towards the definition of a strategy for the prevention of natural disaster is
the evaluation of the risk (Barredo 2004). Three components determine the “risk”,
according to the definition proposed by Kron (2002): hazard, vulnerability and exposure.
Based on this definition, the risk may be decreased by reducing the size of any one or more
of the three contributing variables - the hazard, the elements exposed and/or their
vulnerability. The reduction of any one of the three factors to zero would consequently
eliminate the risk.

2
It is therefore possible to configure potential risk-scenarios by modifying the hazard (e.g.
as consequence of climate change), the exposure (e.g. as result of regional development
policies) and/or the vulnerability (e.g. as outcome of adaptation measures) (Barredo 2005a,
Genovese 2006).
The study subject of this technical note aims at analysing the state of the exposure to flood
risk for Spain, Greece, Portugal, Hungary, Poland, Slovenia, Czech Republic, Slovakia,
Estonia, Latvia, Lithuania, Romania and Bulgaria and is based on the combination of the
European database Corine Land Cover 2000 and the hydrological hazard map. The
analysis focuses on the exposure of those land-use classes with high physical and capital
assets, i.e. areas assigned to residential, industrial and commercial functions. This allows
performing the accounting of specific national conditions and the cross-comparison
between countries, highlighting peculiarities and critical situations.
The next phases of work will include the evaluation of population exposure and the
analysis of trends by means of the Corine Land Cover 1990.
3
1. Indicators and methodology
1.1 Hazard map
When one has to deal with risk or damage assessment from flood hazard, the “ideal
protocol” would require very detailed quantitative information about local morphology and
assets of the territory. Although the nature of the hazard is non-deterministic, local
communities require that the knowledge on the potential losses (or the real ones) deriving
from a flooding event should be as detailed as possible. This, in turn, necessitates a huge
amount of reliable data on the river catchment properties and an accurate quantification of
the accumulated value of the land involved (Büchele 2006, FLOODsite 2006). When one
wants to enlarge the view on European scale, the idea to treat the problem by the same
scheme of local catchments seems to be unrealistic.
The main data component in this respect is the Digital Terrain Model (DTM), which could
in principle permit to understand what will be the water depth in each location occurring
from a given flood extent. In a Europe-wide perspective, it is mandatory to work with
consistent data sources, which means that, although certain nations are already provided
with high or very-high resolution DTM’s and river network information systems, the
resolution of the analysis will be dictated by that of the data source which is consistent and
validated throughout the whole continent. To put it into figures, we are dealing with a
spatial resolution (grid cell) of 1 km.
Given such a limitation, the approach itself must be arranged in a “scale-consistent” way
which might meet as much as possible the information requirements coming from the
policy maker at EU level. The approach is therefore founded on a qualitative analysis
based on the definition of risk indicators and on a marked use of basic spatial statistics.
The hazard map (figure 1.1) used in this analysis is obtained using a 1 km grid DTM and
the 1 km European flow network developed by the Weather Driven Natural Hazard Action
at the Joint Research Centre. An algorithm has been developed to find the height difference
between a specific grid-cell and its closest neighbouring grid-cell containing a river, while
respecting the catchment tree-structure. For the moment extreme water levels have been
estimated using a simple function based on upstream catchment size (Barredo 2005b).
4
Figure 1.1: Flood hazard map: elevation difference and the estimated extreme water level of the river determine the potential flood risk.
The database will be enlarged in the future: in the follow-up versions of the flood hazard
map it is planned to use higher resolution DEMs (250 and 100 metres grid-size) and
calculate extreme water levels using the LISFLOOD model (De Roo 2000).
The original hazard map legend is a semi-quantitative one, based on elevation differences
in the catchment. It contains seven classes:
1. Lakes;
2. Very low flood hazard;
3. Low flood hazard;

5
4. Moderate flood hazard;
5. High flood hazard;
6. Very high flood hazard;
7. Coastal flood hazard.
The first class, describing the extent of main natural and artificial lakes, does not represent
a true hazard zone and it’s not considered in this study. The 7th hazard class (coastal
hazard) was also neglected, since the current focus is on inland river flood events.
1.2 Land Cover map
The Corine (Coordinated Information on the European Environment) Land Cover project
was launched by the European Commission, managed and maintained by the the European
Environmental Agency - EEA (1995, 2000, 2002), in order to provide support for the
Commission in its efforts to use and develop advanced data-compilation and management
techniques in carrying out its policies.
Corine Land Cover (CLC) is a map of the European natural and artificial landscape based
on interpretation of satellite images. It is intended to provide consistent localized
geographical information on the land use of the Member States of the European
Community. This is useful for environmental analysis and comparisons as well as for
policy making and assessment. No other land cover information programme in the world
embraces such a wide geographical area in such detail.
This EU-wide programme examines land cover using a standard methodology and
nomenclature. The purpose of this study was to provide a baseline to examine future land
cover changes and as an important research tool for a whole variety of environmental
studies. The Corine Land Cover data is based on a minimum mapping size of 25 hectares
CORINE coding is a hierarchical, three-level code, with five 1st level classes, fifteen 2nd
level ones and forty-four 3rd level ones, according to the legend published by EEA (1995)
and here reported in appendix 1.
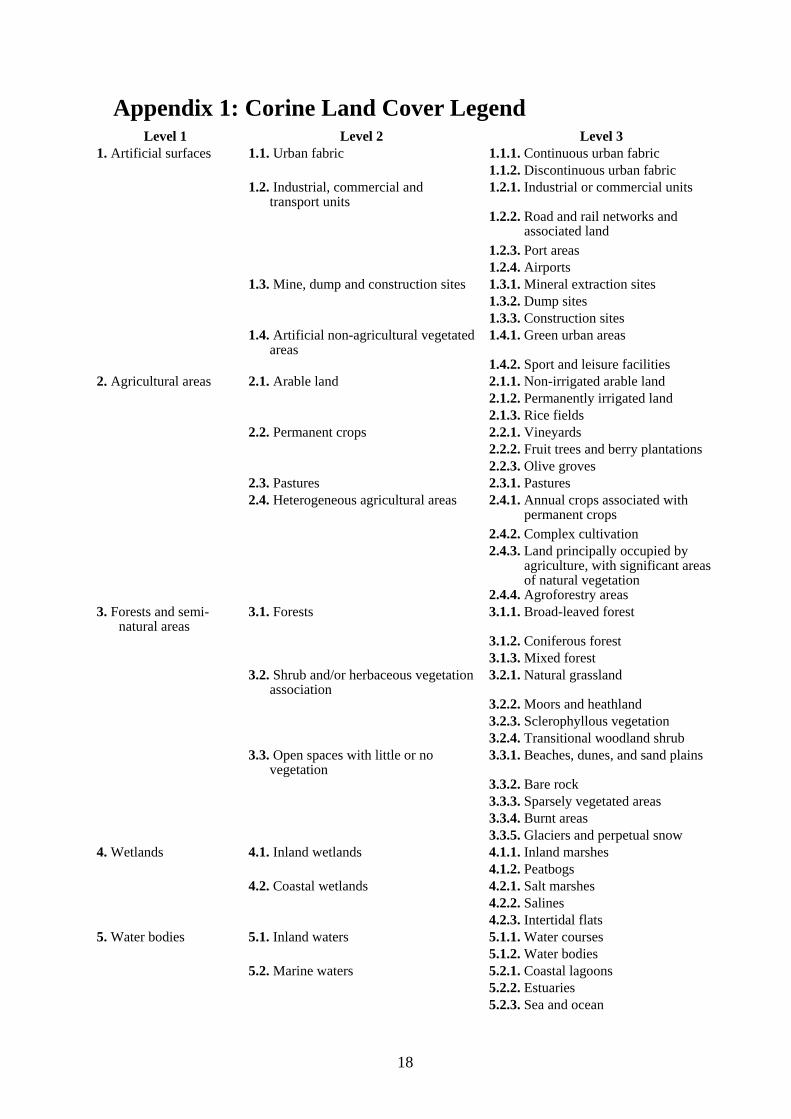
Here, the analysis has been focused only on the 11 classes belonging to the 1st level class
“1”, namely, “Artificial Surfaces”.
6
In fact, land cover proves to be a good proxy for land use in qualitative and quantitative
analysis of the economic performance and potential of the territory, as well as for planning
and management purposes in several fields. In this study, artificial surfaces are of great
importance, as a huge part of a nation’s richness is concentrated in this land cover type,
including population.
Corine Land Cover database was realized for two dates (1990 and 2000) with a nominal
scale of 1:100,000. The product is basically a vector dataset, but two raster versions have
been released, with 100 metres and 250 metres pixel size. As mentioned above, we have
used the database CLC2000, version 8, released by EEA on March 2006, in the 250 metres
pixel size version. The more accurate 100 m pixel version was not used because it’s too
detailed as compared with the 1km pixel size of the current version of the flood hazard
map.
1.3 Methodology
The investigation is based on the overlay of raster information across the whole Europe
(with a few exceptions as explained later on) on Land Cover types and hazard from river
flooding, and their distribution by national (NUTS0) administrative boundaries.
Both raster maps have been released in the European reference projection system
recommended within the INSPIRE process (Annoni 2005), namely ETRS89 Lambert
Azimutal Equal Area.
For calculation purposes, resampling of the coarse hazard map to the Land Cover map’s
resolution was performed, paying attention to “snap” each map on the same pixel grid, in
order to avoid further resampling when overlaying the territorial information.
Due to the different origin and resolution of the input information, coastline and border
effects had to be dealt with and so calculations were performed only on those pixels where
the hazard map (the one with lower original resolution) had values. The Land Cover map
was therefore “masked” by the flood hazard one.
The differences in the Land Cover accounts within administrative boundaries caused by the
masking effect were not exceedingly evident or problematic. The comparison was both
“internal”, checking the difference between the national accounts with or without masking,
and “external”, by comparing the results with those published by EEA. In this respect, also
the positional accuracy of the national boundaries used for the calculations takes a big role.
7
We have used version 9 of the GISCO geographical database, released by Eurostat, based
on Eurogeographics© database for national boundaries. The data, originally distributed in
Geographical Coordinates, were projected onto the above described reference system by
ESRI ArcMap© built-in transformation algorithm. Possible difference in georeferencing of
the GISCO data as well as the different degree of resolution of the basic CLC2000 data
used in such calculations (EEA used the 100m pixel version) account for the small
discrepancies found.
As mentioned already, an overlay of the CLC2000 and Flood hazard raster maps was
performed; the result is the combination of each map’s information, peculiarly coded as
explained above. For the present investigation purposes, the 44th CLC class -Sea and
Oceans- was, of course, neglected.
The result of the two maps’ combination is therefore a new raster, with potentially
43*6=258 different values. 253 independent values were obtained, as some combination
did not occur (as expectable, for the class accounting for glaciers and perpetual snow, as
they are clearly placed pretty much upstream). In addition to this, several combination
were scarcely relevant, occurring only on a small number of “pixels” across Europe, for
example, 15 combinations below 150 ha, 27 below 300 ha. Nevertheless, the number of
values, even when limiting to artificial surfaces alone (66), was quite high for analysis
purposes.
We therefore performed a reclassification of the hazard values into two classes and it was
decided to group three values into one hazard class, leaving only the two lower ones in the
other, namely:
– Value 2 (very low) and 3 (low) grouped into hazard class “LOW”;
– Value 4 (moderate), 5 (high) and 6 (very high) grouped into hazard class
“HIGH”.
This choice was made in order to enhance the “protectionist” view of the analysis, and
better draw the attention of policy makers when dealing with such a delicate matter.
The basic database, for future analyses, is of course storing all of the information resulting
from the procedure described above, as well as the more detailed statistics of CLC/hazard
distribution within the administrative boundaries with a breakdown to NUTS 3 level, as
obtained by the “Tabulate Area” function in ArcGIS©.
8
In the following, after a brief analysis of the resulting national accounts regarding the
artificial surfaces in Europe, the distribution of such land cover types with respect to flood
hazard areas, subdivided as explained above, is presented for 13 nations. They are the 10
“newly accessed” countries and the 2 candidates Bulgaria and Romania, with the addition
of Spain, Portugal and Greece. Malta and Cyprus, originally inserted in this group of 15,
are not included in the graphs because of the lack of hazard data (Cyprus is not covered by
the hazard map, while Malta only shows coastal hazard). The latter two countries were,
instead, included in the basic analysis of general Land Cover national accounts.
The final total surface considered in the analysis is more than 180.000.000 hectares wide,
of which about nearly 6.000.000 are artificial surfaces, of which 1.300.000 hectares are in
flood hazard areas (1.100.000 high and 200.000 low).
9
2 Results and discussion
2.1 General results
The national accounts for artificial surfaces have been tabulated, along with their thematic
distribution within each hierarchical CORINE legend level. Average values were also
calculated in three different groups of nations: “EU 27” collects values on all EU member
states, plus Bulgaria and Romania; “EU15” groups the so-called “old member states”;
“ST15” represents the group of nations where this study is focused. As mentioned before,
Cyprus and Malta were taken out only from the analysis of the combined CLC-hazard data,
but they were left in the basic calculations on artificial surface distribution.
The first observation is on the “weight” of artificial areas on each nation’s surface. This is
usually small, well below a two-digit percent value, with the exception of Belgium (20.4%)
and The Netherlands (12.1%); Malta shows, indeed, the highest share (28.9%), but, for its
small extension (100 times smaller than BE or NL), it is right to treat it separately.
The average value is very similar in EU27 and EU15, 4.13% and 4%, respectively. It’s a
bit smaller in the ST15, with a value of 3.43%. The minimum share of artificial surfaces is
found, not unexpectedly, in Sweden (1.29%). Among the newly accessed countries, apart
the small Cyprus (7.47%), the highest share is shown by the Czech Republic (6.09%)
which is slightly surpassed by Romania (6.25%) if we include the two candidate Eastern
countries. Latvia (1.32%) is the less artificial surface covered country among those here
studied.
It should also be noticed the low shares of Spain (1.56%), Greece (2.09%) and Portugal
(2.65%), the only “EU 15 countries” included in the group of 15 here analysed.
Spain also shows a peculiar behaviour when looking at the distribution of continuous vs.
discontinuous urban fabric within the country (codes 111 and 112, which constitute the
higher level code 11 “Urban Fabric”). Urban fabric is quite important within the whole
artificial surfaces, as it usually accounts for the largest part of them (EU27 average is
75.5%).
The balance of continuous and discontinuous fabric is usually by far in favour of the latter
(EU27 avg. 95.8% vs 4.2%). Only in Spain, this balance is almost even, with 48.2% of
10
continuous vs. 51.8% of discontinuous urban fabric, which, in turn, represent 31.8% and
34.1% of all artificial surfaces, respectively. The latter figures should be compared to the
EU27 average of 3.2% and 72.3%.
Conversely, from the CLC 2000 survey, no continuous urban fabric exists in Finland and
the Netherlands, where the only urban land cover is the discontinuous one.
Among all other nations, only Italy shows a two-digit value for the share of continuous
urban fabric on artificial surfaces (10.1%), while the distribution of such share in the
countries here considered is rather flat, especially for the newly accessed and candidate
countries (below 1%), while Greece, Portugal are close to 6% and Malta around 3%.
Discontinuous fabric is always above 60% in the 15 studied countries, with the only
exception of Estonia (55.2%), up to top value from Romania, with 86.4%.
The second “best performance” in artificial land cover types is almost always represented
by code 121, Industrial or Commercial Units (EU27 avg. 11%), only exceptions being
Denmark, Ireland and UK with two-digit artificial surface shares for the code 142, Sports
and Leisure facilities. All this, makes the first three land cover types (111, 112 and 121)
account for more than 85% of EU territory. Only Latvia shows a peculiarly high share in
code 141, Green Urban Areas, with 9.5%, far above each group’s averages, placed around
1.5%.
The readout of the shares of artificial surfaces among European nations presented above,
was also leading the following analysis, per nation and per land cover type, of the
distribution of the artificial surfaces of different kind within the areas under river flood
hazard.
The national details are displayed for the thirteen chosen nations, along with European
averages as a reference.
Before going through the national analyses, a few comments on the general results are
given below.
At continental level, we find that 77.9% of the territory is not exposed to flood hazard; the
remaining part (about 4Mha out of 17.6Mha of artificial surfaces) is subdivided as 18.7%
into High and 3.4% into Low hazard class.
11
The story does not change much if we look at the smaller groups already defined: “old
EU15” has 17.9% in High hazard areas and 3.3% in low, the newly accessed countries
show 20.7 vs. 3.8 and the countries in this study 18.8 vs. 3.3.
The above mentioned decision to include three out of the five original flood hazard classes
into the “high” group is not the only factor to explain the huge unbalance between hi and lo
hazard exposure of artificial surfaces in Europe. In fact, the class called “moderate flood
hazard”, if passed from High to Low class would only account for a minimum shift in this
unbalance. Rather, this is the confirmation that, in the past, human settlements were very
often built up in floodplains, which are of course more likely to be exposed to flood events.
Moving forward in the analysis of the overall artificial surfaces vs. hazard distributions, we
should notice that the “best performances” are obtained by nations either not very rich in
artificial surfaces or where the main settlements are placed along the coast (so influenced
by the neglect of coastal hazard), like Denmark, the Netherlands, United Kingdom, and,
more interestingly in this study, Portugal, Greece and Spain.
In the general view, the highest share of artificial surfaces under threat from flood hazard is
in Slovenia (35.3%) and the lowest in Denmark (5.3%) then in Portugal (6.1%). If we
focus on High hazard areas, Slovenia is slightly surpassed by Luxembourg (31.3% vs.
32.2%, respectively), while the same positions are kept by the above mentioned “best
performers”: Denmark with 4% and Portugal with 5.5%.
It is obvious that the extension of the country somehow influences the readout of the
overall results above described. This is even truer if we look at the territorial shares of each
individual land cover types in relation to the hazard areas, which will be shortly performed.
2.2 Detailed results
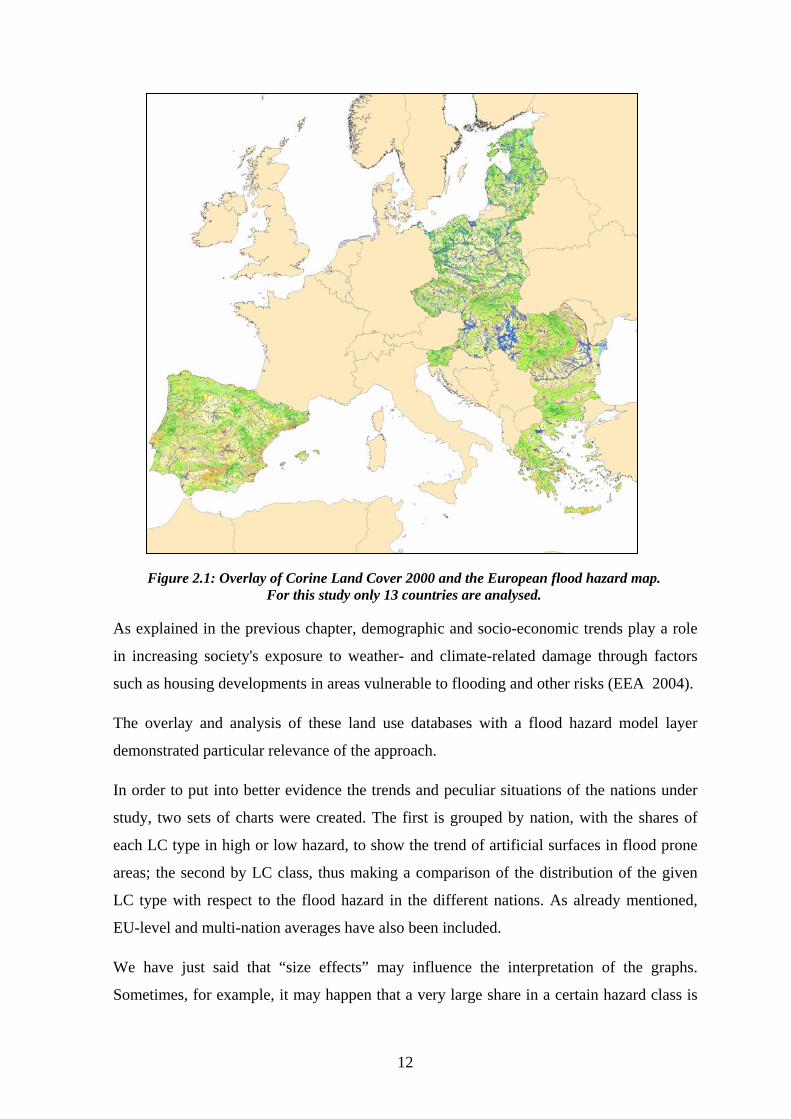
Figure 2.1 sketches the studied countries showing the superposition of the LC and flood
hazard maps. Due to the low resolution, this image is of course not suitable for visual
interpretation.
12
Figure 2.1: Overlay of Corine Land Cover 2000 and the European flood hazard map. For this study only 13 countries are analysed.
As explained in the previous chapter, demographic and socio-economic trends play a role
in increasing society's exposure to weather- and climate-related damage through factors
such as housing developments in areas vulnerable to flooding and other risks (EEA 2004).
The overlay and analysis of these land use databases with a flood hazard model layer
demonstrated particular relevance of the approach.
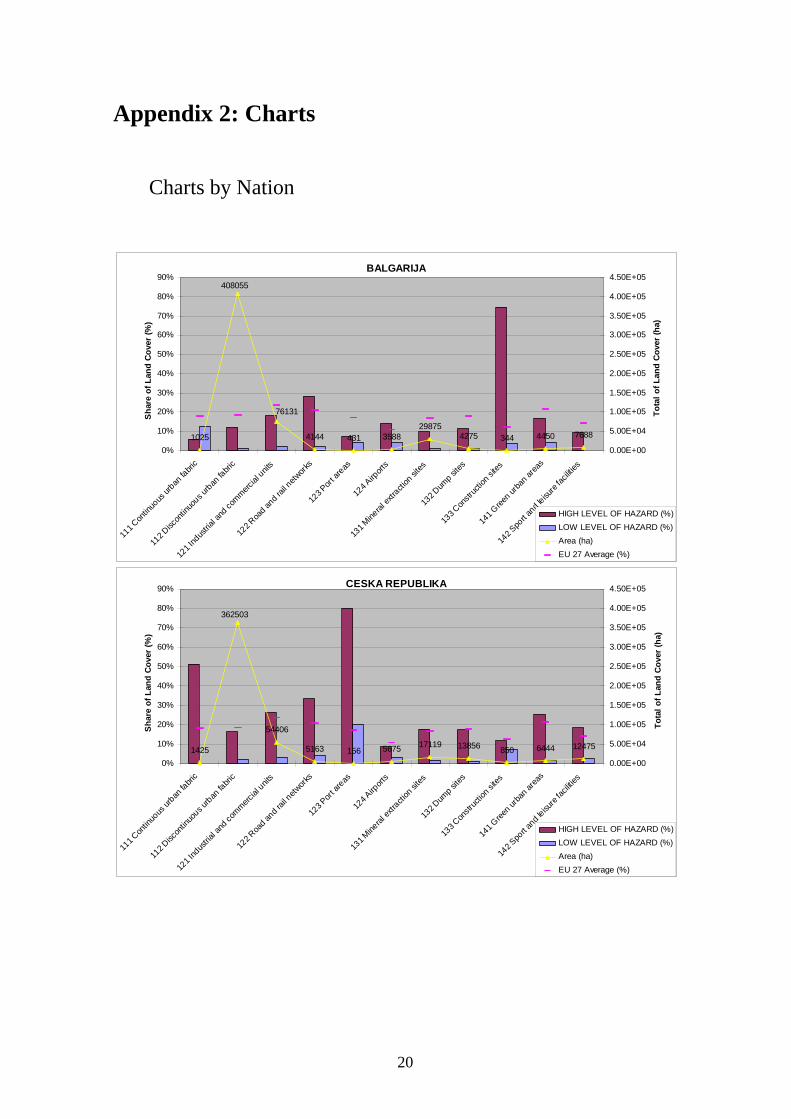
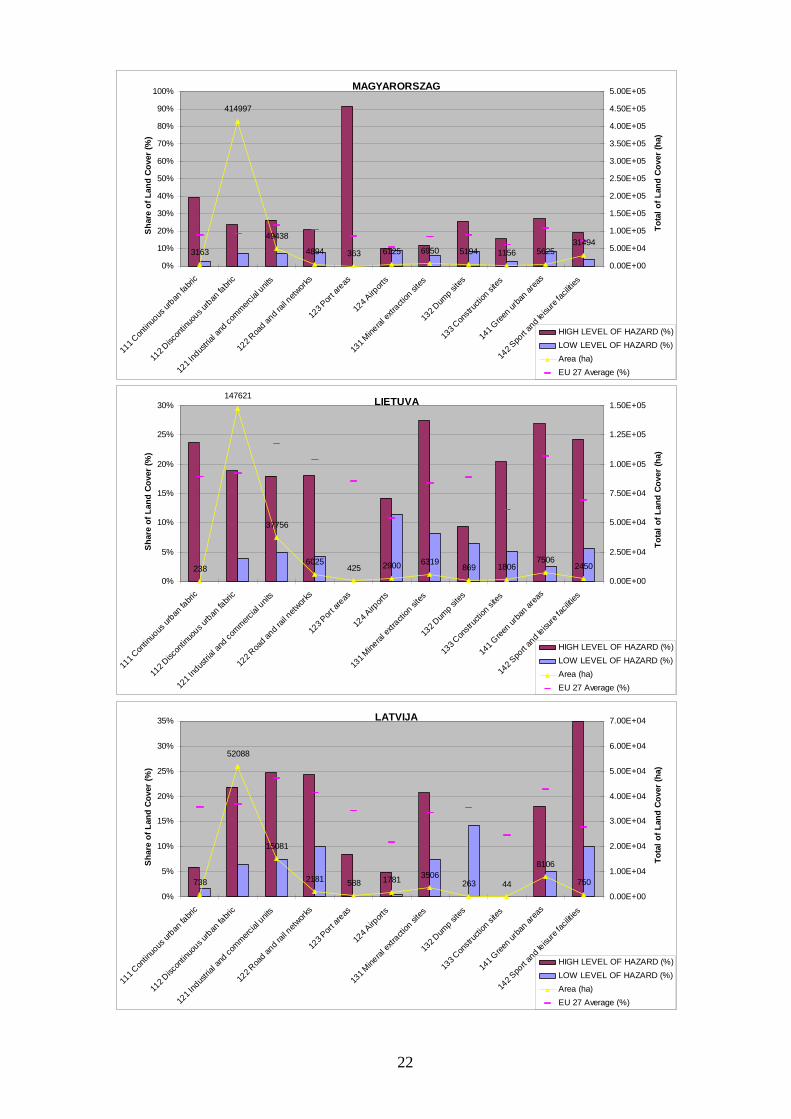
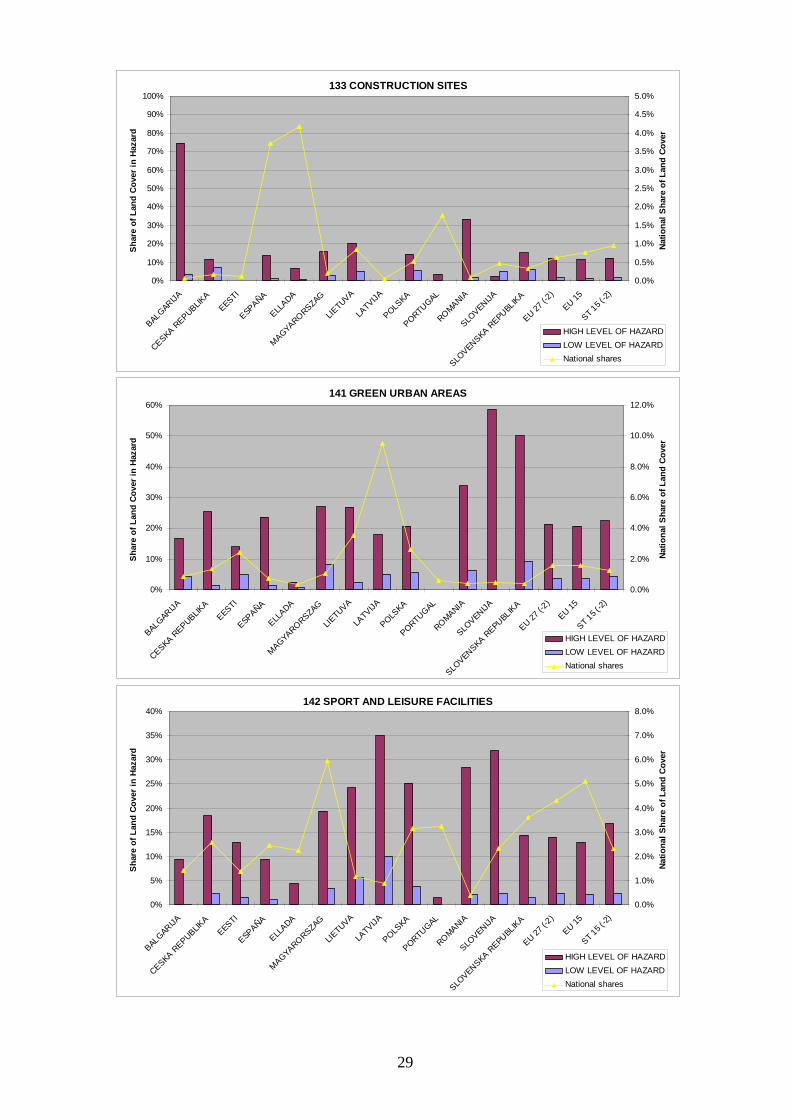
In order to put into better evidence the trends and peculiar situations of the nations under
study, two sets of charts were created. The first is grouped by nation, with the shares of
each LC type in high or low hazard, to show the trend of artificial surfaces in flood prone
areas; the second by LC class, thus making a comparison of the distribution of the given
LC type with respect to the flood hazard in the different nations. As already mentioned,
EU-level and multi-nation averages have also been included.
We have just said that “size effects” may influence the interpretation of the graphs.
Sometimes, for example, it may happen that a very large share in a certain hazard class is
13
actually involving only a small territorial extension. Nevertheless, it is not within the tasks
of this research to decide whether such a situation is significant or not.
That’s why we have tried to provide a means of interpretation by putting into the same
graph both the class shares within a nation and the absolute value of its extension. The
shares are represented by a bar chart, while the absolute values are indicated by points
linked by a line for better perception of the relative territorial importance of the LC classes.
In addition to that, the EU27 average value for each CLC class in high hazard is indicated
in the chart by a dark pink horizontal bar. The charts containing the EU27, as well as the
other multi-nation, averages are included at the bottom of the first group of charts. As
expressed in the legend, the shares values are to be read on the left-hand Y-axis, while the
absolute areas, in hectares, are on the right-hand one. Detailed absolute values are also
indicated above each point for better information, especially for the lowest values. It’s to
be noticed that the vertical scales for both, the shares and absolute CLC accounts, are
different throughout the national charts, in order to optimize each cart’s dynamics.
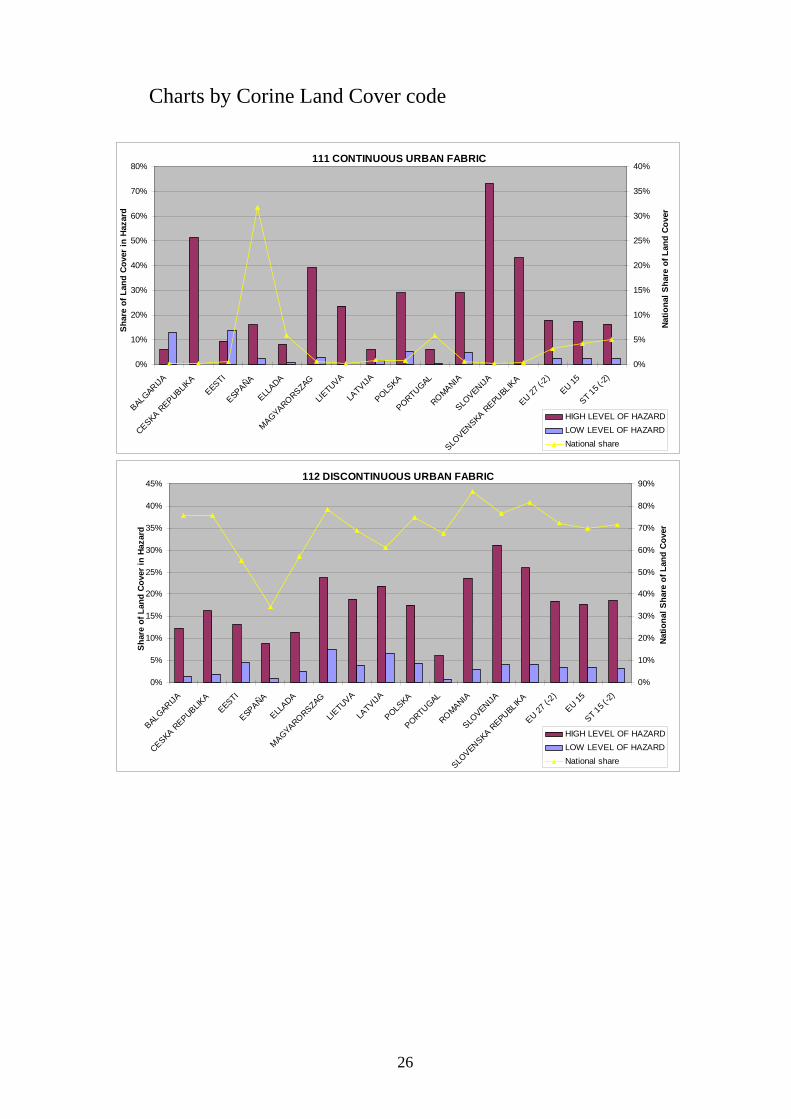
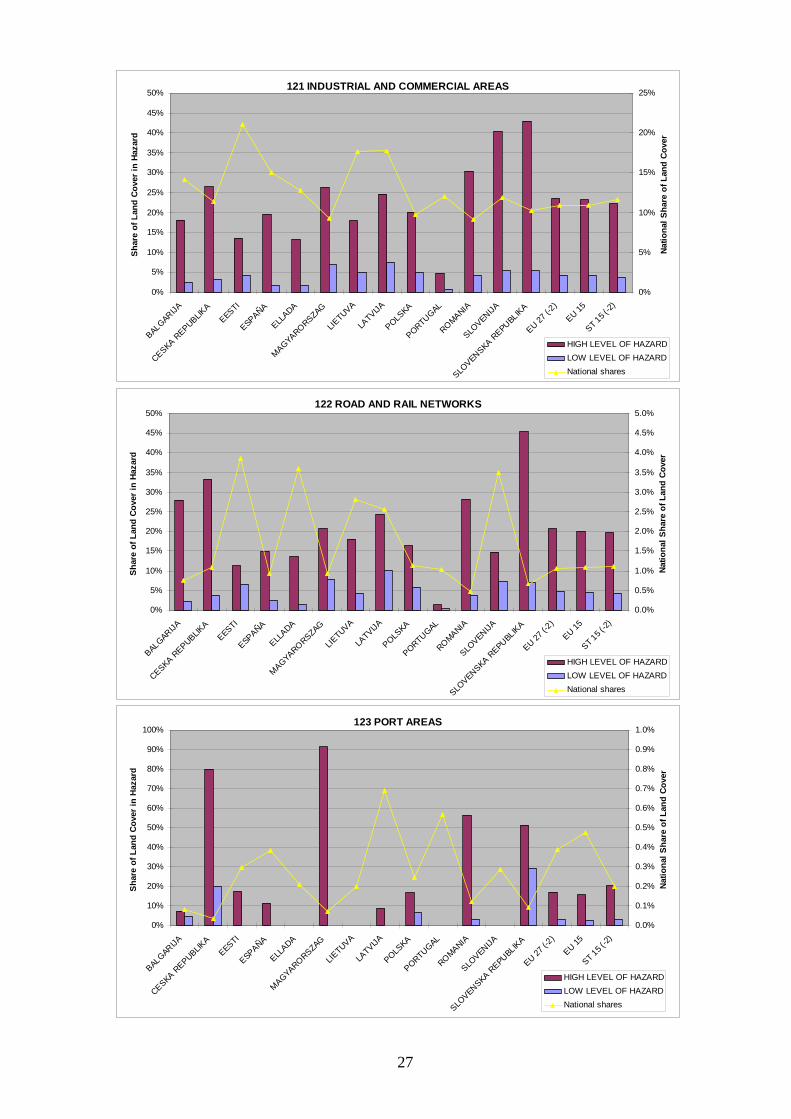
In turn, when each LC class is compared throughout the nations here investigated, the
superimposed graph represent the national share of each LC type, in order to take into
account the different national sizes while keeping the view on the relative importance of
that LC type. The product of the two percentage values read on the corresponding Y-axis
(left-hand side for CLC/hazard, right-hand one for national only-CLC shares) provides the
overall share of land of the given CLC class in high or low hazard, with respect to the
whole national extent. Again, Y-axes dynamics vary across the different charts.
The two sets of charts so created are shown in appendix 2. We hereby present some
considerations which can be made by looking at the results of the method, as summarised
in the charts.
The results for the three “EU 15 countries” considered, Spain, Portugal and Greece show
that, on the average, artificial areas are not exposed to floods to a noticeable extent. In
Spain the highest share of hazard areas are reached by Green urban areas (class 141) with
about 23% and by Industrial and commercial areas (class 121) with 20%; nevertheless, the
latter is much more relevant in extent, as this LC type is about 120,000 ha wide (therefore,
about 24,000 ha are in high hazard areas) vs. less of 6,000 ha of class 141 in all Spain
(1330 ha in high hazard). In Greece 16% of airport areas (class 124) is the top hazard share
in the country (about 1,660 ha out of 9,000), while the top extension is that of class 112,

14
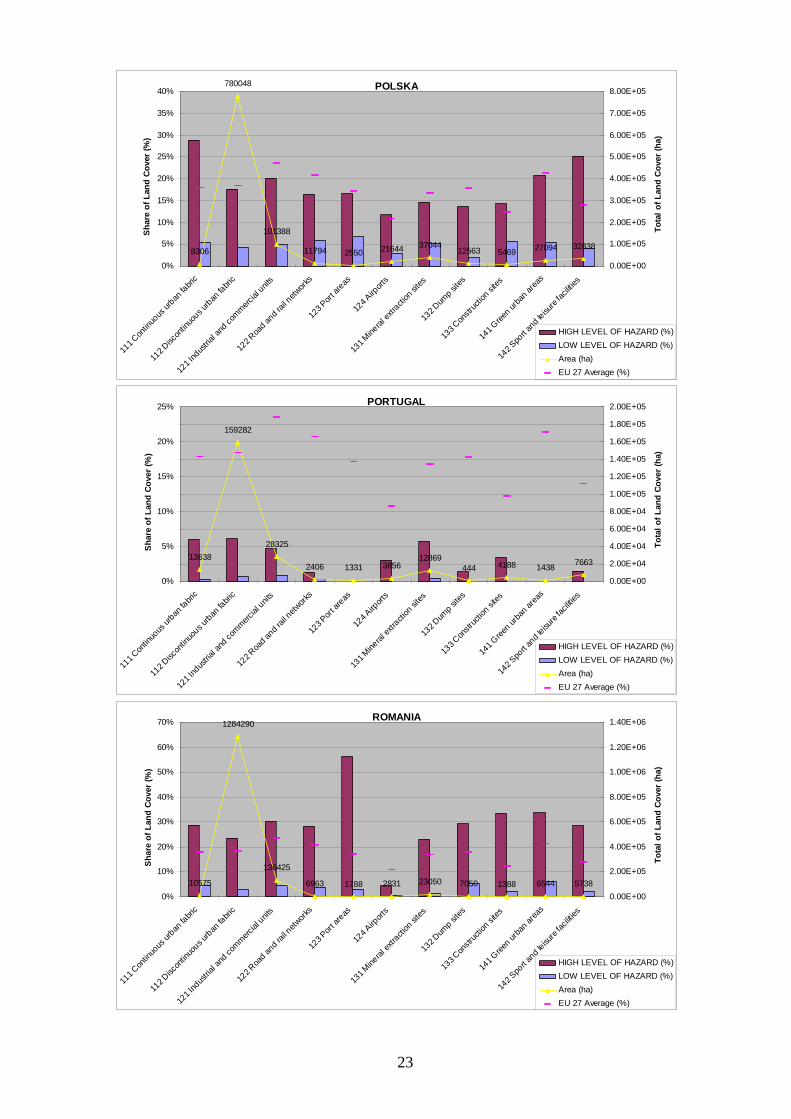
Discontinuous urban fabric, with around 17,000 ha (about 11% of the class). In Portugal
the hazard areas seem not much relevant, reaching only 6% in both class 111 and 112
(corresponding to 800ha and 10,000 ha, respectively). In general, as one could expect, the
behaviour of those countries is in line with or below the EU average.
A similar kind of results are reached for some of the newly accessed Countries, in
particular Estonia, Bulgaria and Poland, where only two, three and four classes are above
EU 27 average of high hazard shares, respectively.
In Bulgaria the exception is represented by the construction sites, which share in high
hazard areas is 70% of that land cover class in the all country. This result has to be
monitored because represents that new artificial areas are growing in territories highly
exposed to floods and has to be taken into account by the local planners. In Estonia, the
degree of exceeding the EU averages is less marked and involves ports and dump sites.
One of the values exceeding EU average in Poland is represented by continuous urban
fabric (about 30%), which is, of course, an important indication for mitigation needs.
The remaining newly accessed countries and Romania show a larger number of artificial
land classes with exposure to high flood hazard in excess of EU averages, varying from
five (Latvia) to ten (Romania and Slovak Republic) out of the eleven LC types. Also from
the comparison shown in the charts grouped by LC class, very high peaks of flood hazard
areas are found in some of them: Slovak Republic and Slovenia have the highest shares of
urban fabric built in flood prone areas (in Slovenia the share of continuous urban areas in
high hazard is more than 70%), and also Romania and Czech Republic reach shares that
have to be monitored.
In Slovak Republic also industrial and commercial areas, road and rail networks and
airport areas reach shares around 40% on the average. Slovenia has half of the dump sites
of the Country in high hazard zones: although their extension in absolute terms is not very
wide (around 200ha under hazard), this result is a clear indication of potential pollution or
contamination problems in case of flood.
A result which in a first check could appear “strange” is represented by the port areas.
High hazard shares in this land cover type are reached in countries which are not by the
sea. As explained before, coastal hazard is not included in the analysis and in the case of
Czech Republic, Hungary, Romania and Slovakia, port areas are clearly located on
15
navigable rivers, therefore lying in areas which are recognized of high hazard by the flood
hazard mapping model. This means that although the percentages are found between 50%
and 90%, this might not be of great concern to local planners because port facilities usually
include defences and protection works that are neglected in the hazard map.
16
Conclusions and future work
The approach based on the combination of land use and flood hazard maps proves to be
very effective for the assessment of potential flood impact. Indeed, although the approach
is not conceived to perform accurate risk and hazard analysis at local scale, it provides a
coherent and complete view of the exposure at continental and national level.
Furthermore, even if the work described in this report does not directly include the analysis
of future evolution of artificial land exposure to floods, the indicators hereby proposed
allow to draw a first set of considerations that could be useful to planners and policy-
makers at national and trans-national level.
It has been shown that useful information can be extracted from the data in different ways
and correspondingly presented for direct interpretation with standard visualisation
techniques.
In particular, the analysis performed on the 13 nations chosen according to an important
EU policy mainstream, such as the ERDF 2007-13, could in principle contribute to assess
whether the foreseen actions and investments, along with their allotment correctly address
the issue of protection from natural hazards, in this case, flood hazard.
It is indeed possible to highlight situations of particular interest or concern by comparing
the results between nations and with respect to the average European behaviour.
In general, areas under high flood hazard are significantly much wider than those under
low hazard (about 6 times, on the average). The following conclusions are therefore drawn
on the high hazard shares only.
If grouped together, the overall average of the share of artificial surfaces in high hazard
zones in the nations under study is almost the same as the EU27 (less Malta and Cyprus),
namely 18.8% vs. 18.7%. National values ranges from 5.5% in Portugal to 31.3% in
Slovenia. But, if we take Greece, Portugal and Spain out from the group, there is a
remarkable increase of this average, to 20.7%, which means that newly accessed and
candidate countries have 15.7% more artificial (non-agricultural) territory under high flood
hazard than EU15. Slovenia, Slovak Republic and Hungary have their shares above 30%.
17
In particular, in Slovenia it is found the highest share of urban fabric built in flood prone
areas (more than 70%), and also Romania and Czech Republic reach shares that has to be
monitored. Romania and the Slovak Republic show 10 out of the 11 artificial land classes
above the EU27 average high hazard share.
From the above results, one can read that artificial areas of various kinds grew probably
without much attention to the potential exposure to floods and this seems to be more
evident in the Eastern Europe countries. It is therefore straightforward that a thorough
policy of adaptation and mitigation to flood risk is advisable, especially when new
settlements and commercial sites are to be planned.
Based on the methodology described in this report, the work will continue its evolution by
refining the available tools and further improving the accuracy of products.
As mentioned in the method’s description, the database stores all the information with all
possible CLC/hazard class combinations, tabulated at NUTS 3 levels for the two CLC
datasets of 1990 and 2000, with the differences calculated for the available nations.
Information extraction and presentation is therefore an important technical issue and in this
overall framework, two main developments are currently ongoing: first, the design of a
user-friendly interface to perform the query of the database in order to select and highlight
the territory and particular Land Cover of interest, also with different aggregation choices;
second, the implementation of this procedure in a GIS, with standard mapping facility.
Moreover, the structure so created would be extended to include other weather-driven
types of hazard, like droughts, forest fires and heat waves.
The improvement of the quality of the indicators is also a research target. A way to relate
in more quantitative terms exposure (direct and –when possible– indirect potential losses in
monetary terms) and land cover distribution, will be explored, as well as the possibility to
evaluate the flood hazard by standard return periods or probabilities of a given flood event
also with better territorial resolution, in order to better explore the flood risk patterns
throughout Europe.
18
Appendix 1: Corine Land Cover Legend Level 1 Level 2 Level 3
1. Artificial surfaces 1.1. Urban fabric 1.1.1. Continuous urban fabric 1.1.2. Discontinuous urban fabric 1.2. Industrial, commercial and
transport units 1.2.1. Industrial or commercial units
1.2.2. Road and rail networks and associated land
1.2.3. Port areas 1.2.4. Airports 1.3. Mine, dump and construction sites 1.3.1. Mineral extraction sites 1.3.2. Dump sites 1.3.3. Construction sites 1.4. Artificial non-agricultural vegetated
areas 1.4.1. Green urban areas
1.4.2. Sport and leisure facilities 2. Agricultural areas 2.1. Arable land 2.1.1. Non-irrigated arable land 2.1.2. Permanently irrigated land 2.1.3. Rice fields 2.2. Permanent crops 2.2.1. Vineyards 2.2.2. Fruit trees and berry plantations 2.2.3. Olive groves 2.3. Pastures 2.3.1. Pastures 2.4. Heterogeneous agricultural areas 2.4.1. Annual crops associated with
permanent crops 2.4.2. Complex cultivation 2.4.3. Land principally occupied by
agriculture, with significant areas of natural vegetation
2.4.4. Agroforestry areas 3. Forests and semi-
natural areas 3.1. Forests 3.1.1. Broad-leaved forest
3.1.2. Coniferous forest 3.1.3. Mixed forest 3.2. Shrub and/or herbaceous vegetation
association 3.2.1. Natural grassland
3.2.2. Moors and heathland 3.2.3. Sclerophyllous vegetation 3.2.4. Transitional woodland shrub 3.3. Open spaces with little or no
vegetation 3.3.1. Beaches, dunes, and sand plains
3.3.2. Bare rock 3.3.3. Sparsely vegetated areas 3.3.4. Burnt areas 3.3.5. Glaciers and perpetual snow 4. Wetlands 4.1. Inland wetlands 4.1.1. Inland marshes 4.1.2. Peatbogs 4.2. Coastal wetlands 4.2.1. Salt marshes 4.2.2. Salines 4.2.3. Intertidal flats 5. Water bodies 5.1. Inland waters 5.1.1. Water courses 5.1.2. Water bodies 5.2. Marine waters 5.2.1. Coastal lagoons 5.2.2. Estuaries 5.2.3. Sea and ocean

19
Nomenclature definitions
1.1.1. Continuous urban fabric Most of the land is covered by structures and the transport network. Buildings, roads and artificially surfaced areas cover more than 80% of the total surface. Non-linear areas of vegetation and bare soil are exceptional.
1.1.2. Discontinuous urban fabric Most of the land is covered by structures. Buildings, roads and artificially surfaced areas associated with vegetated areas and bare soil, which occupy discontinuous but significant surfaces.
1.2.1. Industrial or commercial units Artificially surfaced areas (with concrete, asphalt, tamacadam, or stabilised, e.g. beaten earth) devoid of vegetation, occupy most of the area in question, which also contains buildings and/or vegetated areas.
1.2.2. Road and rail networks and associated land Motorways, railways, including associated installations (stations, platforms, embankments). Minimum width to include: 100 m.
1.2.3. Port areas Infrastructure of port areas, including quays, dockyards and marinas.
1.2.4. Airports Airport installations: runways, buildings and associated land.
1.3.1. Mineral extraction sites Areas with open-pit extraction of industrial minerals (sandpits, quarries) or other minerals (opencast mines). Includes flooded gravel pits, except for river-bed extraction.
1.3.2. Dump sites Landfill or mine dump sites, industrial or public.
1.3.3. Construction sites Spaces under construction development, soil or bedrock excavations, earthworks.
1.4.1. Green urban areas Areas with vegetation within urban fabric. Includes parks and cemeteries with vegetation.
1.4.2. Sport and leisure facilities Camping grounds, sports grounds, leisure parks, golf courses, racecourses, etc. Includes formal parks not surrounded by urban zones.
20
Appendix 2: Charts
Charts by Nation
BALGARIJA
4144 431 358829875
4275 344 4450 7688
76131
1025
408055
0%
10%
20%
30%
40%
50%
60%
70%
80%
90%
111 C
ontin
uous
urban
fabri
c
112 D
iscon
tinuo
us urban
fabri
c
121 I
ndus
trial a
nd co
mmercial
units
122 R
oad an
d rail
network
s
123 P
ort ar
eas
124 A
irport
s
131 M
ineral
extra
ction
sites
132 D
ump s
ites
133 C
onstr
uctio
n site
s
141 G
reen ur
ban ar
eas
142 S
port a
nd leisu
re fac
ilities
Sha
re o
f Lan
d C
over
(%)
0.00E+00
5.00E+04
1.00E+05
1.50E+05
2.00E+05
2.50E+05
3.00E+05
3.50E+05
4.00E+05
4.50E+05
Tota
l of L
and
Cov
er (h
a)
HIGH LEVEL OF HAZARD (%)LOW LEVEL OF HAZARD (%)Area (ha)EU 27 Average (%)
CESKA REPUBLIKA
1425
54406
5163 156 5675 17119 13856 850 6444 12475
362503
0%
10%
20%
30%
40%
50%
60%
70%
80%
90%
111 C
ontin
uous
urban
fabri
c
112 D
iscon
tinuo
us urban
fabri
c
121 I
ndus
trial a
nd co
mmercial
units
122 R
oad an
d rail
network
s
123 P
ort ar
eas
124 A
irport
s
131 M
ineral
extra
ction
sites
132 D
ump s
ites
133 C
onstr
uctio
n site
s
141 G
reen ur
ban ar
eas
142 S
port a
nd leisu
re fac
ilities
Sha
re o
f Lan
d C
over
(%)
0.00E+00
5.00E+04
1.00E+05
1.50E+05
2.00E+05
2.50E+05
3.00E+05
3.50E+05
4.00E+05
4.50E+05
Tota
l of L
and
Cov
er (h
a)
HIGH LEVEL OF HAZARD (%)LOW LEVEL OF HAZARD (%)Area (ha)EU 27 Average (%)

21
EESTI
400
17875
3269250
2369
68563581
1002069 1156
46725
0%
5%
10%
15%
20%
25%
30%
35%
40%
45%
50%
111 C
ontin
uous
urban
fabri
c
112 D
iscon
tinuo
us urban
fabri
c
121 I
ndus
trial a
nd co
mmercial
units
122 R
oad an
d rail
network
s
123 P
ort ar
eas
124 A
irport
s
131 M
ineral
extra
ction
sites
132 D
ump s
ites
133 C
onstr
uctio
n site
s
141 G
reen ur
ban ar
eas
142 S
port a
nd leisu
re fac
ilities
Sha
re o
f Lan
d C
over
(%)
0.00E+00
5.00E+03
1.00E+04
1.50E+04
2.00E+04
2.50E+04
3.00E+04
3.50E+04
4.00E+04
4.50E+04
5.00E+04
Tota
l of L
and
Cov
er (h
a)
HIGH LEVEL OF HAZARD (%)LOW LEVEL OF HAZARD (%)Area (ha)EU 27 Average (%)
ESPAÑA
246784264781
116763
7244 298814000
63394
689428944
576919256
0%
5%
10%
15%
20%
25%
30%
111 C
ontin
uous
urban
fabri
c
112 D
iscon
tinuo
us urban
fabri
c
121 I
ndus
trial a
nd co
mmercial
units
122 R
oad an
d rail
network
s
123 P
ort ar
eas
124 A
irport
s
131 M
ineral
extra
ction
sites
132 D
ump s
ites
133 C
onstr
uctio
n site
s
141 G
reen ur
ban ar
eas
142 S
port a
nd leisu
re fac
ilities
Sha
re o
f Lan
d Co
ver (
%)
0.00E+00
5.00E+04
1.00E+05
1.50E+05
2.00E+05
2.50E+05
3.00E+05
Tota
l of L
and
Cove
r (ha
)HIGH LEVEL OF HAZARD (%)LOW LEVEL OF HAZARD (%)Area (ha)EU 27 Average (%)
ELLADA
15982
153594
34550
9669569
9019
26731
50011213
950 6119
0%
5%
10%
15%
20%
25%
111 C
ontin
uous
urban
fabri
c
112 D
iscon
tinuo
us urban
fabri
c
121 I
ndus
trial a
nd co
mmercial
units
122 R
oad an
d rail
network
s
123 P
ort ar
eas
124 A
irport
s
131 M
ineral
extra
ction
sites
132 D
ump s
ites
133 C
onstr
uctio
n site
s
141 G
reen ur
ban ar
eas
142 S
port a
nd leisu
re fac
ilities
Sha
re o
f Lan
d C
over
(%)
0.00E+00
2.00E+04
4.00E+04
6.00E+04
8.00E+04
1.00E+05
1.20E+05
1.40E+05
1.60E+05
1.80E+05
Tota
l of L
and
Cov
er (h
a)
HIGH LEVEL OF HAZARD (%)LOW LEVEL OF HAZARD (%)Area (ha)EU 27 Average (%)
22
MAGYARORSZAG
3163
414997
49438
4894 363 6125 6950 5194 1156 562531494
0%
10%
20%
30%
40%
50%
60%
70%
80%
90%
100%
111 C
ontin
uous
urban
fabri
c
112 D
iscon
tinuo
us urban
fabri
c
121 I
ndus
trial a
nd co
mmercial
units
122 R
oad an
d rail
network
s
123 P
ort ar
eas
124 A
irport
s
131 M
ineral
extra
ction
sites
132 D
ump s
ites
133 C
onstr
uctio
n site
s
141 G
reen ur
ban ar
eas
142 S
port a
nd leisu
re fac
ilities
Sha
re o
f Lan
d C
over
(%)
0.00E+00
5.00E+04
1.00E+05
1.50E+05
2.00E+05
2.50E+05
3.00E+05
3.50E+05
4.00E+05
4.50E+05
5.00E+05
Tota
l of L
and
Cov
er (h
a)
HIGH LEVEL OF HAZARD (%)LOW LEVEL OF HAZARD (%)Area (ha)EU 27 Average (%)
LIETUVA
238
147621
37756
6025425 2900 6319
869 18067506
2450
0%
5%
10%
15%
20%
25%
30%
111 C
ontin
uous
urban
fabri
c
112 D
iscon
tinuo
us urban
fabri
c
121 I
ndus
trial a
nd co
mmercial
units
122 R
oad an
d rail
network
s
123 P
ort ar
eas
124 A
irport
s
131 M
ineral
extra
ction
sites
132 D
ump s
ites
133 C
onstr
uctio
n site
s
141 G
reen ur
ban ar
eas
142 S
port a
nd leisu
re fac
ilities
Sha
re o
f Lan
d Co
ver (
%)
0.00E+00
2.50E+04
5.00E+04
7.50E+04
1.00E+05
1.25E+05
1.50E+05
Tota
l of L
and
Cove
r (ha
)HIGH LEVEL OF HAZARD (%)LOW LEVEL OF HAZARD (%)Area (ha)EU 27 Average (%)
LATVIJA
738
52088
15081
2181 588 1781 3506263 44
8106
750
0%
5%
10%
15%
20%
25%
30%
35%
111 C
ontin
uous
urban
fabri
c
112 D
iscon
tinuo
us urban
fabri
c
121 I
ndus
trial a
nd co
mmercial
units
122 R
oad an
d rail
network
s
123 P
ort ar
eas
124 A
irport
s
131 M
ineral
extra
ction
sites
132 D
ump s
ites
133 C
onstr
uctio
n site
s
141 G
reen ur
ban ar
eas
142 S
port a
nd leisu
re fac
ilities
Sha
re o
f Lan
d C
over
(%)
0.00E+00
1.00E+04
2.00E+04
3.00E+04
4.00E+04
5.00E+04
6.00E+04
7.00E+04
Tota
l of L
and
Cov
er (h
a)
HIGH LEVEL OF HAZARD (%)LOW LEVEL OF HAZARD (%)Area (ha)EU 27 Average (%)
23
POLSKA
8306
780048
101388
11794 2550 21644 3704412563 5469 27094 32838
0%
5%
10%
15%
20%
25%
30%
35%
40%
111 C
ontin
uous
urban
fabri
c
112 D
iscon
tinuo
us urban
fabri
c
121 I
ndus
trial a
nd co
mmercial
units
122 R
oad an
d rail
network
s
123 P
ort ar
eas
124 A
irport
s
131 M
ineral
extra
ction
sites
132 D
ump s
ites
133 C
onstr
uctio
n site
s
141 G
reen ur
ban ar
eas
142 S
port a
nd leisu
re fac
ilities
Sha
re o
f Lan
d C
over
(%)
0.00E+00
1.00E+05
2.00E+05
3.00E+05
4.00E+05
5.00E+05
6.00E+05
7.00E+05
8.00E+05
Tota
l of L
and
Cov
er (h
a)
HIGH LEVEL OF HAZARD (%)LOW LEVEL OF HAZARD (%)Area (ha)EU 27 Average (%)
PORTUGAL
13638
159282
28325
2406 1331 385612869
444 4188 1438 7663
0%
5%
10%
15%
20%
25%
111 C
ontin
uous
urban
fabri
c
112 D
iscon
tinuo
us urban
fabri
c
121 I
ndus
trial a
nd co
mmercial
units
122 R
oad an
d rail
network
s
123 P
ort ar
eas
124 A
irport
s
131 M
ineral
extra
ction
sites
132 D
ump s
ites
133 C
onstr
uctio
n site
s
141 G
reen ur
ban ar
eas
142 S
port a
nd leisu
re fac
ilities
Sha
re o
f Lan
d Co
ver (
%)
0.00E+00
2.00E+04
4.00E+04
6.00E+04
8.00E+04
1.00E+05
1.20E+05
1.40E+05
1.60E+05
1.80E+05
2.00E+05
Tota
l of L
and
Cove
r (ha
)HIGH LEVEL OF HAZARD (%)LOW LEVEL OF HAZARD (%)Area (ha)EU 27 Average (%)
ROMANIA
10575
1284290
136425
6963 1788 2831 23050 7050 1388 6544 57380%
10%
20%
30%
40%
50%
60%
70%
111 C
ontin
uous
urban
fabri
c
112 D
iscon
tinuo
us urban
fabri
c
121 I
ndus
trial a
nd co
mmercial
units
122 R
oad an
d rail
network
s
123 P
ort ar
eas
124 A
irport
s
131 M
ineral
extra
ction
sites
132 D
ump s
ites
133 C
onstr
uctio
n site
s
141 G
reen ur
ban ar
eas
142 S
port a
nd leisu
re fac
ilities
Sha
re o
f Lan
d C
over
(%)
0.00E+00
2.00E+05
4.00E+05
6.00E+05
8.00E+05
1.00E+06
1.20E+06
1.40E+06
Tota
l of L
and
Cov
er (h
a)
HIGH LEVEL OF HAZARD (%)LOW LEVEL OF HAZARD (%)Area (ha)EU 27 Average (%)

24
SLOVENIJA
163
41676
6450
1900156 694 1256 338 256 256 1275
0%
10%
20%
30%
40%
50%
60%
70%
80%
90%
111 C
ontin
uous
urban
fabri
c
112 D
iscon
tinuo
us urban
fabri
c
121 I
ndus
trial a
nd co
mmercial
units
122 R
oad an
d rail
network
s
123 P
ort ar
eas
124 A
irport
s
131 M
ineral
extra
ction
sites
132 D
ump s
ites
133 C
onstr
uctio
n site
s
141 G
reen ur
ban ar
eas
142 S
port a
nd leisu
re fac
ilities
Sha
re o
f Lan
d C
over
(%)
0.00E+00
5.00E+03
1.00E+04
1.50E+04
2.00E+04
2.50E+04
3.00E+04
3.50E+04
4.00E+04
4.50E+04
Tota
l of L
and
Cov
er (h
a)
HIGH LEVEL OF HAZARD (%)LOW LEVEL OF HAZARD (%)Area (ha)EU 27 Average (%)
SLOVENSKA REPUBLIKA
988
225888
28181
1819 256 2331 3406 1488 919 1100 10069
0%
10%
20%
30%
40%
50%
60%
111 C
ontin
uous
urban
fabri
c
112 D
iscon
tinuo
us urban
fabri
c
121 I
ndus
trial a
nd co
mmercial
units
122 R
oad an
d rail
network
s
123 P
ort ar
eas
124 A
irport
s
131 M
ineral
extra
ction
sites
132 D
ump s
ites
133 C
onstr
uctio
n site
s
141 G
reen ur
ban ar
eas
142 S
port a
nd leisu
re fac
ilities
Sha
re o
f Lan
d Co
ver (
%)
0.00E+00
5.00E+04
1.00E+05
1.50E+05
2.00E+05
2.50E+05
3.00E+05
Tota
l of L
and
Cov
er (h
a)HIGH LEVEL OF HAZARD (%)LOW LEVEL OF HAZARD (%)Area (ha)EU 27 Average (%)
ST 15 (-2)
304247
4391403
715121
67775 12181 79719241650
57619 58519 78569 142975
0.00%
5.00%
10.00%
15.00%
20.00%
25.00%
111 C
ontin
uous
urban
fabri
c
112 D
iscon
tinuo
us urban
fabri
c
121 I
ndus
trial a
nd co
mmercial
units
122 R
oad an
d rail
network
s
123 P
ort ar
eas
124 A
irport
s
131 M
ineral
extra
ction
sites
132 D
ump s
ites
133 C
onstr
uctio
n site
s
141 G
reen ur
ban ar
eas
142 S
port a
nd leisu
re fac
ilities
Sha
re o
f Lan
d C
over
0.00E+00
1.00E+06
2.00E+06
3.00E+06
4.00E+06
5.00E+06
Tota
l of L
and
Cov
er (h
a)
HIGH LEVEL OF HAZARDLOW LEVEL OF HAZARDArea (ha)

25
EU 27 (-2)
568654
12814250
1947471
189106 68250 281406 594519 104325 111506 279125 767606
0.00%
5.00%
10.00%
15.00%
20.00%
25.00%
30.00%
111 C
ontin
uous
urban
fabri
c
112 D
iscon
tinuo
us urban
fabri
c
121 I
ndus
trial a
nd co
mmercial
units
122 R
oad an
d rail
network
s
123 P
ort ar
eas
124 A
irport
s
131 M
ineral
extra
ction
sites
132 D
ump s
ites
133 C
onstr
uctio
n site
s
141 G
reen ur
ban ar
eas
142 S
port a
nd leisu
re fac
ilities
Sha
re o
f Lan
d C
over
0.00E+00
2.50E+06
5.00E+06
7.50E+06
1.00E+07
1.25E+07
1.50E+07
Tota
l of L
and
Cov
er (h
a)
HIGH LEVEL OF HAZARDLOW LEVEL OF HAZARDArea (ha)
EU 15
540810
9000504
1411989
140650 60956 228563 45586354544 97331 208713
657669
0.00%
5.00%
10.00%
15.00%
20.00%
25.00%
111 C
ontin
uous
urban
fabri
c
112 D
iscon
tinuo
us urban
fabri
c
121 I
ndus
trial a
nd co
mmercial
units
122 R
oad an
d rail
network
s
123 P
ort ar
eas
124 A
irport
s
131 M
ineral
extra
ction
sites
132 D
ump s
ites
133 C
onstr
uctio
n site
s
141 G
reen ur
ban ar
eas
142 S
port a
nd leisu
re fac
ilities
Sha
re o
f Lan
d Co
ver
0.00E+00
2.00E+06
4.00E+06
6.00E+06
8.00E+06
1.00E+07
Tota
l of L
and
Cov
er (h
a)HIGH LEVEL OF HAZARDLOW LEVEL OF HAZARDArea (ha)
26
Charts by Corine Land Cover code
111 CONTINUOUS URBAN FABRIC
0%
10%
20%
30%
40%
50%
60%
70%
80%
BALGARIJA
CESKA REPUBLIK
A
EESTI
ESPAÑA
ELLADA
MAGYARORSZAG
LIETUVA
LATVIJA
POLSKA
PORTUGAL
ROMANIA
SLOVENIJA
SLOVENSKA R
EPUBLIKA
EU 27 (-2
)
EU 15
ST 15 (-2)
Shar
e of
Lan
d C
over
in H
azar
d
0%
5%
10%
15%
20%
25%
30%
35%
40%
Natio
nal S
hare
of L
and
Cove
r
HIGH LEVEL OF HAZARDLOW LEVEL OF HAZARDNational share
112 DISCONTINUOUS URBAN FABRIC
0%
5%
10%
15%
20%
25%
30%
35%
40%
45%
BALGARIJA
CESKA REPUBLIK
A
EESTI
ESPAÑA
ELLADA
MAGYARORSZAG
LIETUVA
LATVIJA
POLSKA
PORTUGAL
ROMANIA
SLOVENIJA
SLOVENSKA R
EPUBLIKA
EU 27 (-2
)
EU 15
ST 15 (-2)
Sha
re o
f Lan
d Co
ver i
n Ha
zard
0%
10%
20%
30%
40%
50%
60%
70%
80%
90%
Natio
nal S
hare
of L
and
Cov
er
HIGH LEVEL OF HAZARDLOW LEVEL OF HAZARDNational share
27
121 INDUSTRIAL AND COMMERCIAL AREAS
0%
5%
10%
15%
20%
25%
30%
35%
40%
45%
50%
BALGARIJA
CESKA REPUBLIK
A
EESTI
ESPAÑA
ELLADA
MAGYARORSZAG
LIETUVA
LATVIJA
POLSKA
PORTUGAL
ROMANIA
SLOVENIJA
SLOVENSKA R
EPUBLIKA
EU 27 (-2
)
EU 15
ST 15 (-2)
Sha
re o
f Lan
d Co
ver i
n Ha
zard
0%
5%
10%
15%
20%
25%
Natio
nal S
hare
of L
and
Cov
er
HIGH LEVEL OF HAZARDLOW LEVEL OF HAZARDNational shares
122 ROAD AND RAIL NETWORKS
0%
5%
10%
15%
20%
25%
30%
35%
40%
45%
50%
BALGARIJA
CESKA REPUBLIK
A
EESTI
ESPAÑA
ELLADA
MAGYARORSZAG
LIETUVA
LATVIJA
POLSKA
PORTUGAL
ROMANIA
SLOVENIJA
SLOVENSKA R
EPUBLIKA
EU 27 (-2
)
EU 15
ST 15 (-2)
Shar
e of
Lan
d Co
ver i
n Ha
zard
0.0%
0.5%
1.0%
1.5%
2.0%
2.5%
3.0%
3.5%
4.0%
4.5%
5.0%
Nat
iona
l Sha
re o
f Lan
d C
over
HIGH LEVEL OF HAZARDLOW LEVEL OF HAZARDNational shares
123 PORT AREAS
0%
10%
20%
30%
40%
50%
60%
70%
80%
90%
100%
BALGARIJA
CESKA REPUBLIK
A
EESTI
ESPAÑA
ELLADA
MAGYARORSZAG
LIETUVA
LATVIJA
POLSKA
PORTUGAL
ROMANIA
SLOVENIJA
SLOVENSKA R
EPUBLIKA
EU 27 (-2
)
EU 15
ST 15 (-2)
Shar
e of
Lan
d C
over
in H
azar
d
0.0%
0.1%
0.2%
0.3%
0.4%
0.5%
0.6%
0.7%
0.8%
0.9%
1.0%
Nat
iona
l Sha
re o
f Lan
d Co
ver
HIGH LEVEL OF HAZARDLOW LEVEL OF HAZARDNational shares

28
124 AIRPORTS
0%
5%
10%
15%
20%
25%
30%
35%
40%
BALGARIJA
CESKA REPUBLIK
A
EESTI
ESPAÑA
ELLADA
MAGYARORSZAG
LIETUVA
LATVIJA
POLSKA
PORTUGAL
ROMANIA
SLOVENIJA
SLOVENSKA R
EPUBLIKA
EU 27 (-2
)
EU 15
ST 15 (-2)
Sha
re o
f Lan
d Co
ver i
n Ha
zard
0.0%
0.5%
1.0%
1.5%
2.0%
2.5%
3.0%
3.5%
4.0%
Natio
nal S
hare
of L
and
Cov
er
HIGH LEVEL OF HAZARDLOW LEVEL OF HAZARDNational shares
131 EXTRACTION SITES
0%
5%
10%
15%
20%
25%
30%
BALGARIJA
CESKA REPUBLIK
A
EESTI
ESPAÑA
ELLADA
MAGYARORSZAG
LIETUVA
LATVIJA
POLSKA
PORTUGAL
ROMANIA
SLOVENIJA
SLOVENSKA R
EPUBLIKA
EU 27 (-2
)
EU 15
ST 15 (-2)
Shar
e of
Lan
d C
over
in H
azar
d
0%
2%
4%
6%
8%
10%
12%
Natio
nal S
hare
of L
and
Cov
er
HIGH LEVEL OF HAZARDLOW LEVEL OF HAZARDNational shares
132 DUMP SITES
0%
5%
10%
15%
20%
25%
30%
35%
40%
45%
50%
BALGARIJA
CESKA REPUBLIK
A
EESTI
ESPAÑA
ELLADA
MAGYARORSZAG
LIETUVA
LATVIJA
POLSKA
PORTUGAL
ROMANIA
SLOVENIJA
SLOVENSKA R
EPUBLIKA
EU 27 (-2
)
EU 15
ST 15 (-2)
Sha
re o
f Lan
d Co
ver i
n H
azar
d
0.0%
0.5%
1.0%
1.5%
2.0%
2.5%
3.0%
3.5%
4.0%
4.5%
5.0%
Natio
nal S
hare
of L
and
Cove
r
HIGH LEVEL OF HAZARDLOW LEVEL OF HAZARDNational shares
29
133 CONSTRUCTION SITES
0%
10%
20%
30%
40%
50%
60%
70%
80%
90%
100%
BALGARIJA
CESKA REPUBLIK
A
EESTI
ESPAÑA
ELLADA
MAGYARORSZAG
LIETUVA
LATVIJA
POLSKA
PORTUGAL
ROMANIA
SLOVENIJA
SLOVENSKA R
EPUBLIKA
EU 27 (-2
)
EU 15
ST 15 (-2)
Shar
e of
Lan
d C
over
in H
azar
d
0.0%
0.5%
1.0%
1.5%
2.0%
2.5%
3.0%
3.5%
4.0%
4.5%
5.0%
Nat
iona
l Sha
re o
f Lan
d Co
ver
HIGH LEVEL OF HAZARDLOW LEVEL OF HAZARDNational shares
141 GREEN URBAN AREAS
0%
10%
20%
30%
40%
50%
60%
BALGARIJA
CESKA REPUBLIK
A
EESTI
ESPAÑA
ELLADA
MAGYARORSZAG
LIETUVA
LATVIJA
POLSKA
PORTUGAL
ROMANIA
SLOVENIJA
SLOVENSKA R
EPUBLIKA
EU 27 (-2
)
EU 15
ST 15 (-2)
Sha
re o
f Lan
d Co
ver i
n H
azar
d
0.0%
2.0%
4.0%
6.0%
8.0%
10.0%
12.0%
Natio
nal S
hare
of L
and
Cove
r
HIGH LEVEL OF HAZARDLOW LEVEL OF HAZARDNational shares
142 SPORT AND LEISURE FACILITIES
0%
5%
10%
15%
20%
25%
30%
35%
40%
BALGARIJA
CESKA REPUBLIK
A
EESTI
ESPAÑA
ELLADA
MAGYARORSZAG
LIETUVA
LATVIJA
POLSKA
PORTUGAL
ROMANIA
SLOVENIJA
SLOVENSKA R
EPUBLIKA
EU 27 (-2
)
EU 15
ST 15 (-2)
Sha
re o
f Lan
d Co
ver i
n Ha
zard
0.0%
1.0%
2.0%
3.0%
4.0%
5.0%
6.0%
7.0%
8.0%
Natio
nal S
hare
of L
and
Cov
er
HIGH LEVEL OF HAZARDLOW LEVEL OF HAZARDNational shares
30
References
− Annoni, A. (Editor), (2005). European Reference Grids, Proposal for a European Grid Coding System. GI&GIS Workshop - Ispra 27-29 oct. 2003 Proceedings and Recommendations. DG-JRC, Ispra, EUR 21494 EN.
− Barredo J.I., Lavalle C., Sagris V., Kasanko M. (2004), “Climate change impacts on floods in Europe. Towards a set of risk indicators for adaptation”, DG-JRC, Ispra, EUR 21472 EN.
− Barredo J.I., Petrov L., Sagris V., Lavalle C., Genovese E. (2005a), “Towards an integrated scenario approach for spatial planning and natural hazard mitigation”, European Communities, DG-JRC, Ispra, EUR 21900 EN.
− Barredo J. I., Lavalle C., De Roo A.P.J. (2005b), “European flood risk mapping”, EC DG JRC, 2005 S.P.I.05.151.EN.
− Büchele B., Kreibich H., Kron A., Thieken A., Ihringer J., Oberle P., Merz B., and Nestmann F. (2006), Flood-risk mapping: contributions towards an enhanced assessment of extreme events and associated risks, Nat. Hazards Earth Syst. Sci., 6, 485–503.
− De Roo A.P.J., Wesseling, C.G., Van Deurzen, W.P.A. (2000), Physically-based river basin modelling within a GIS: the LISFLOOD model. Hydrological Processes, 14, 1981-1992.
− EEA - European Environmental Agency (1995), CORINE Land Cover full Report, published on-line: http://reports.eea.europa.eu/COR0-landcover/en/land_cover.pdf
− EEA (2000), CORINE land cover technical guide - Addendum, Tech. rep. 40: http://reports.eea.europa.eu/tech40add/en/tech40add.pdf
− EEA (2002), Corine land cover update 2000: Technical guidelines, Tech. rep. No.89: http://reports.eea.europa.eu/technical_report_2002_89/en/techrep89
− EEA (2004), Signals 2004, “A European Environment Agency update on selected issues”, Office for Official Publications of the European Communities, Luxembourg.
− FLOODsite 6th FP Integrated Project (www.floodsite.net) Report Number T9-06-01 2006: Guidelines for Socio-economic Flood Damage Evaluation.
− Genovese E., (2006), “A metodological approach to land use-based flood damage assessment in urban areas: Prague case study”, European Communities, DG-JRC, Ispra, EUR 22497 EN.
− Konrad C. P. (2003), “Effects of Urban Development on Flood”, U.S. Department of the Interior, U.S. Geological Survey, USGS Fact Sheet FS-076-03.
− Kron W. (2002), “Flood risk = hazard x exposure x vulnerability”. In: Wu M. et al., (ed.), Flood Defence, Science Press, New York, 82-97.
− Lavalle C., De Roo A.P.J., Barredo J., Niemeyer S., San-Miguel-Ayanz J., Hiederer R., Genovese E. (2005), “Towards an European integrated map of risk from weather driven events: a contribution to the evaluation of territorial cohesion in Europe”, Technical EUR Reports, EUR 22116 EN.
31
Related web sites
− http://www.eea.europa.eu
− http://ec.europa.eu/environment/climat/home_en.htm
− http://ies.jrc.cec.eu.int/European_Flood_Alert_System.98.0.html
− http://moland.jrc.it/
− http://natural-hazards.jrc.it
− http://nedies.jrc.it
− http://reports.eea.europa.eu
− http://dataservice.eea.europa.eu/dataservice/metadetails.asp?id=823
− http://www.aquadeltaforum.com/
− http://www.unisdr.org/eng/library/isdr-publication/flood-guidelines/isdr-publication-
floods.htm
− http://inspire.jrc.it

European Commission EUR 22525EN – DG Joint Research Centre, Institute for Environment and Sustainability Title: Flood risk in Europe: analysis of exposure in 13 Countries Authors: Nicola Lugeri, Elisabetta Genovese, Carlo Lavalle, Ad De Roo Luxembourg: Office for Official Publications of the European Communities 2006 – 35 pp. EUR - Scientific and Technical Research series; ISSN 1018-5593 Abstract In the last decades, dramatic river flooding has occurred in several regions of Europe and the damage reached unprecedented proportions. There are two basic reasons for this: the increased frequency of extreme weather events and built-up areas which continue to grow mainly in flood prone areas, affect flooding in many ways. The protection of human and capital assets from natural hazards is high in the agenda of the European policies and is directly addressed in the European Regional Development Fund for the programming period 2007-2013. This technical note describes a contribution to the evaluation of exposures to flood risk in 13 out of the 15 Countries that can receive support from Structural Funds under the Convergence objective: Spain, Greece, Portugal, Hungary, Poland, Slovenia, Czech Republic, Slovakia, Estonia, Latvia, Lithuania, Romania and Bulgaria. The study is based on the combination of the European database Corine Land Cover 2000 and the hydrological hazard map and is focused on the exposure of those land-use classes with high physical and capital assets, i.e. areas assigned to residential, industrial and commercial functions. This allows performing the accounting of specific national conditions and the cross-comparison between countries, highlighting peculiarities and critical situations. The results for Spain, Portugal and Greece show that, on the average, artificial areas are not exposed to floods to a noticeable extent. In general, the behaviour of those countries is in line with or below the EU average. A similar kind of results are reached for some of the newly accessed Countries, in particular Estonia, Bulgaria and Poland, where only two, three and four classes are above EU 27 average of high hazard shares, respectively. The remaining newly accessed Countries and Romania show a larger number of artificial land classes with exposure to high flood hazard in excess of EU averages. Slovak Republic and Slovenia have the highest shares of urban fabric built in flood prone areas and also Romania and Czech Republic reach shares that have to be monitored. From the above results, one can read that artificial areas of various kinds grew probably without much attention to the potential exposure to floods. It is therefore straightforward that a thorough policy of adaptation and mitigation to flood risk is advisable, especially when new settlements and commercial sites are to be planned.
The mission of the JRC is to provide customer-driven scientific and technical support for the conception, development, implementation and monitoring of EU policies. As a service of the European Commission, the JRC functions as a reference centre of science and technology for the Union. Close to the policy-making process, it serves the common interest of the Member States, while being independent of special interests, whether private or national.
Top Related