


Languages
Pages
Legal


Fiscalini Farms Biomass Energy Project Final Report 2011
Subcontract to Fiscalini Farms LP for work under the Assistance Agreement DE-EE0001895 “Measurement and Evaluation of a Dairy Anaerobic Digestion/Power Generation System” from
the United States Department of Energy National Energy Technology Laboratory
William Stringfellow Mary Kay Camarillo
Jeremy Hanlon Michael Jue
Chelsea Spier
October 2011
Ecological Engineering Research Program School of Engineering & Computer Science
3601 Pacific Avenue John T. Chambers Technology Center
University of the Pacific Stockton, CA 95211

DISCLAIMER
This report was prepared as an account of work sponsored by an agency of the United States Government. Neither the United States Government nor any agency thereof, nor any of their employees, makes any warranty, express or implied, or assumes any legal liability or responsibility for the accuracy, completeness, or usefulness of any information, apparatus, product, or process disclosed, or represents that its use would not infringe privately owned rights. Reference herein to any specific commercial product, process, or service by trade name, trademark, manufacturer, or otherwise does not necessarily constitute or imply its endorsement, recommendation, or favoring by the United States Government or any agency thereof. The views and opinions of authors expressed herein do not necessarily state or reflect those of the United States Government or any agency thereof.

Final Report Page 2 of 172
Table of Contents
Executive Summary 3
Project Objectives 4
Background 5
Methods 6
Site and Facility Description 6
Collection and Analysis of Solid, Liquid, and Gas Samples 8
Measurement and Calculation of Flows and Mass Loadings 9
Completion of work scope 10
TTask 1 – Project management and planning 10
Task 2 – Installation of anaerobic digester equipment 10
Task 3 – Start up and operation 10
Task 4 – Sample collection and analysis of biogas and digester water 11
Task 5 – Sustainability analysis 12 Sustainability of power plant operations 12 Environmental sustainability 14 Economic analysis 20
Conclusions & Recommendations 21
References 23
Appendix A 51
Appendix B 126
Appendix C 140
Appendix D 163

Final Report Page 3 of 172
Executive Summary In this final report describes and documents research that was conducted by the Ecological Engineering Research Program (EERP) at the University of the Pacific (Stockton, CA) under subcontract to Fiscalini Farms LP for work under the Assistance Agreement DE-EE0001895 “Measurement and Evaluation of a Dairy Anaerobic Digestion/Power Generation System” from the United States Department of Energy, National Energy Technology Laboratory. Fiscalini Farms is operating a 710 kW biomass-energy power plant that uses bio-methane, generated from plant biomass, cheese whey, and cattle manure via mesophilic anaerobic digestion, to produce electricity using an internal combustion engine. The primary objectives of the project were to document baseline conditions for the anaerobic digester and the combined heat and power (CHP) system used for the dairy-based biomass-energy production. The baseline condition of the plant was evaluated in the context of regulatory and economic constraints. In this final report, the operation of the plant between start-up in 2009 and operation in 2010 are documented and an interpretation of the technical data is provided. An economic analysis of the biomass energy system was previously completed (Appendix A) and the results from that study are discussed briefly in this report. Results from the start-up and first year of operation indicate that mesophilic anaerobic digestion of agricultural biomass, combined with an internal combustion engine, is a reliable source of alternative electrical production. A major advantage of biomass energy facilities located on dairy farms appears to be their inherent stability and ability to produce a consistent, 24 hour supply of electricity. However, technical analysis indicated that the Fiscalini Farms system was operating below capacity and that economic sustainability would be improved by increasing loading of feedstocks to the digester. Additional operational modifications, such as increased utilization of waste heat and better documentation of potential of carbon credits, would also improve the economic outlook. Analysis of baseline operational conditions indicated that a reduction in methane emissions and other greenhouse gas savings resulted from implementation of the project. Specific project benefits include:
Electricity production. An average of 218,000 ft3/d of biogas was produced and, on average, 97.1% of this biogas was used for electricity production, resulting in production of 9,754 kWh/d of electricity.
Waste heat utilization. Sufficient waste heat was recovered and utilized to reduce prior propane usage by approximately 30%.
Generation of revenues and cost savings. Annual revenue of approximately $390,000 was realized as a result of electricity sales. Annual cost savings of approximately $32,000 resulted from on-site use of waste heat.
Reduced greenhouse gas emissions. Preliminary calculations indicate that the reduction in greenhouse gas emissions from capture and utilization of methane gas is approximately 5,460 metric tons of carbon dioxide equivalents per year.
Waste stabilization. The anaerobic digesters treated approximately 14 million gallons of waste per year. Anaerobic digestion of waste streams resulted in a 42% reduction in volatile solids content.

Final Report Page 4 of 172
Production of digester by-products. Approximately 59,000 lbs/d of stabilized solids were produced by the digesters that were used in the dairy as bedding material. Approximately 32,000 gal/d of stabilized liquid was also produced by the digesters and used on-site as a fertilizer.
The project results indicate that using anaerobic digestion to produce bio-methane from agricultural biomass is a promising source of electricity, but that significant challenges need to be addressed before dairy-based biomass energy production can be fully integrated into an alternative energy economy. The biomass energy facility was found to be operating under-capacity. Economic analysis indicated a positive economic sustainability, even at the reduced power production levels demonstrated during the baseline period. However, increasing methane generation capacity (via the importation of biomass codigestate) will be critical for increasing electricity output and improving the long-term economic sustainability of the operation. Dairy-based biomass energy plants are operating under strict environmental regulations applicable to both power-production and confined animal facilities and novel approached are being applied to maintain minimal environmental impacts. The use of selective catalytic reduction (SCR) for nitrous oxide control and a biological hydrogen sulfide control system were tested at this facility. Results from this study suggest that biomass energy systems can be compliant with reasonable scientifically based air and water pollution control regulations. The most significant challenge for the development of biomass energy as a viable component of power production on a regional scale is likely to be the availability of energy-rich organic feedstocks. Additionally, there needs to be further development of regional expertise in digester and power plant operations. At the Fiscalini facility, power production was limited by the availability of biomass for methane generation, not the designed system capacity. During the baseline study period, feedstocks included manure, sudan grass silage, and refused-feed. The ability of the dairy to produce silage in excess of on-site feed requirements limited power production. The availability of biomass energy crops and alternative feedstocks, such as agricultural and food wastes, will be a major determinant to the economic and environmental sustainability of biomass based electricity production. Project Objectives The objectives for the Fiscalini Farms project under the Department of Energy, National Energy Technology Laboratory grant contract (USDOE-NETL AA DE-EE0001895) were:
1) Complete construction of an anaerobic digester and power generation system, including installation of measuring devices for continuous monitoring of critical biological and environmental parameters;
2) Measure quality and quantity of captured gas and flow produced from alternative feedstock (biomass fuels), including cow manure and energy crops;
3) Complete a sustainability analysis, including a cost benefit analysis of the renewable electricity and recovered heat to the historic fossil fuel based electricity and heat;
4) Measure and quantify the environmental attributes of the system; and 5) Verify this design of a renewable energy power generation and heat recovery system will
meet or exceed environmental regulatory requirements for California.

Final Report Page 5 of 172
EERP provided scientific assistance to Fiscalini Farms by measuring air and water quality constituents, analyzing data sets generated from operation of the facility, completing a sustainability and cost-benefit analysis, and quantifying the environmental attributes of the system in the context of environmental regulatory requirements for California.
The purpose of this final report is to document the activities conducted by the Ecological Engineering Research Program of the University of the Pacific, School of Engineering and Computer Sciences from the inception of the project in July 2009. This final report contains the data and conclusion resulting from the two year study. Background The U.S. EPA estimates that there is potential for 863 MW of biogas-derived electricity generation from 2,645 candidate dairy farms in the U.S, providing the additional potential benefits of odor control, water quality protection, greenhouse gas reduction, energy use and sales, valuable by-products, and energy credits (U.S. EPA, 2010). Given that there were over 1,800 dairies and 1.8 million dairy cows in California in 2009 producing 20.9% of the nation’s milk and resulting in $4.54 billion in sales of milk and cream (California Department of Food and Agriculture 2011), it is no surprise that dairy farms in California have the potential to produce 35% of the nation’s total dairy-based biogas, reducing methane emissions by 341,000 tons/yr and producing 271 MW of energy on 889 candidate farms (U.S. EPA, 2010). In April 2011, the U.S. EPA estimated that there were 167 anaerobic digestion systems being used at livestock farms in the U.S. and that 146 of these produce electricity or thermal energy (U.S. EPA, 2011). The U.S. EPA database for anaerobic digestion does not include complete information on the production and use of electricity, such as whether electricity is sold wholesale to a power company, exclusively used on-site, or is managed as part of a net-metering agreement, however, off-site sales of electricity from dairy-based biomass energy systems appear common. In a study of biomass energy systems located on dairies in New York, 12 of the 14 operational systems sold electricity to the local utility. Although the number of biomass energy projects located on dairy farms in the U.S. is increasing, the economic sustainability of dairy located biomass energy plants is uncertain and further investigation of fully-operational systems is needed, particularly in California where the environmental regulations are stringent and strict (Lusk 1998; Kramer 2004; Anders 2007; Scott, Pronto et al. 2010). The focus of this project is on a CHP system operating exclusively on fuel generated by a dairy digester; however, results from this study are applicable to other biogas systems with reciprocating engines, including landfills, wastewater digesters and food waste digesters. CHP systems can produce electricity and thermal energy to replace current natural gas and fossil fuel electricity use in California.

Final Report Page 6 of 172
Methods
Site and Facility Description Fiscalini Farms is located in Stanislaus County at 4848 Jackson Road in Modesto, CA and has been in operation as a dairy since 1912. The facility also includes a cheese factory that has been in operation since 2000. There are approximately 1,200 milking cows and 300 dry cows maintained at the facility. The dairy has the capacity for up to 3,000 cows. Dairy operations and the cheese factory occupy approximately 38 acres, and an additional 480 acres, divided into six fields, which are used for crop production. The entire 480 acres is triple cropped with corn, winter wheat forage, and sudan grass. The dairy facilities include a milking parlor (the dairy barn), wash pens, three free stall barns, feed lanes, open corrals, a heifer holding facility, two slope screen solid separators, and two wastewater storage lagoons. Manure from the dairy barns is removed using a recycled-water flush system. The cows are fed two times a day resulting in the cows spending approximately 85% of their time in concrete lanes, which are approximately 8 foot wide. The manure is present in these concrete lanes is flushed six times per day. Approximately 1.2 million gallons a day are flushed through the three barn; the flush-water consists of 1 million gallons of recycled flush-water and approximately 200,000 gal/d of new water added daily as a result of washing down the dairy barn. The cheese factory generates up to 4,000 gal/d of whey wastewater; this waste stream is discharged into the flush-water collection system. Fiscalini Farms uses anaerobic digesters to generate methane from organic waste streams that are generated on-site, including: manure, cheese whey, waste feed (feed that is not appropriate for the cattle or that was rejected), and excess plant biomass grown on-site (predominantly sudan grass silage). During the course of this study, the anaerobic digesters were not supplied with any co-digestate biomass from off-site of the dairy. Traditionally, sudan grass was grown on-site as a groundwater nitrogen management tool and it has proven to be extremely beneficial as a feedstock to the anaerobic digester to improve biogas production. The anaerobic digestion process is a biological system that relies on microorganisms to metabolize the organic materials in the absence of oxygen and produce biogas with a high methane content. The anaerobic digesters are designed to be operated within the mesophilic range of approximately 85-100 °F, a range frequently used in anaerobic digesters treating domestic waste (Tchobanoglous, Burton et al. 2003). The Fiscalini Farms biomass energy system consists of two anaerobic digesters and a combined heat and power (CHP) system that uses an internal combustion engine and generator to produce electricity (Table 1). The anaerobic digesters and associated equipment were provided by Biogas Energy, Inc. (Kensington, CA), a company that has been installing biomass energy systems since 1998 worldwide. The complete-mix anaerobic digesters contain an intermittently operated recirculation mixing system that was designed to accommodate multiple feedstocks. There are two above ground concrete anaerobic digester tanks, each having a diameter of 82-feet and a height of 24-feet, with a combined capacity of approximately 1.9 million gallons. The anaerobic digesters are kept at the mesophilic temperature of approximately 100 °F using a system of hot water pipes embedded in the 14-inch thick digester walls. The roofing system on the anaerobic digester tanks consists of a double membrane roof; an inner membrane that serves as gas storage

Final Report Page 7 of 172
and an outer membrane that protects against the weather and is pressurized using an air compressor. This type of roofing system provides flexibility in the operation of the CHP system; a limited amount (approximately 10 hrs.) of biogas can accumulate in the digesters (e.g., when the CHP system is out of service for maintenance) instead of being flared, wasting the biogas. The CHP system was manufactured by Guascor (St. Rose, LA), a company with 601 systems and a combined capacity of 784 MW worldwide. The CHP system consists of a 1057 BHP internal combustion engine with a rated capacity of 750 kW using natural gas and 710 kW using biogas and operates with a continuous, synchronous generator (Guascor Model SFGLD 560). The CHP engine was designed by the manufacturer to operate using natural gas. Martin Machinery (Latham, MO) completed the conversations necessary to allow the engine to operate properly using the dairy biogas. As designed, this engine is operated in a “lean burn” condition that minimizes the quantity of fuel (e.g. biogas) added during combustion, thus improving the engine efficiency while minimizing the nitrous oxide (NOx) output in the exhaust. Biogas from the anaerobic digesters is conveyed to the CHP system via a 1,700-foot buried gas pipeline. Excess biogas that is not used in the CHP unit (e.g., because the unit is out of service for maintenance) and cannot be stored in the digester tanks is diverted to an open flare where it is burned prior to emission (Muche Kläranlagenbau GmbH, Lemgo, Germany). Quantities of biogas used by the CHP for electricity production and biogas flared are both measured using velocity meters to measure biogas volume (Proline Prowirl 72, Endress + Hauser, Inc., Greenwood, IN). Biogas is primarily composed of methane and carbon dioxide (e.g. Martin 2004), although there are other gases present such as ammonia (NH3) and hydrogen sulfide (H2S). Hydrogen sulfide is undesirable in biogas because it converts to sulfuric acid, which is very corrosive and detrimental to engine components and other mechanical systems. Additionally, hydrogen sulfide contributes to the production of sulfur oxides (SOx) in CHP emissions. There are ambient air quality standards in California for hydrogen sulfide, sulfate (SO4
2-), and sulfur dioxide (SO2) (ARB, 2009). At this facility, hydrogen sulfide concentrations for biogas entering the CHP unit are regulated, as a surrogate for SOx emissions. Hydrogen sulfide can be removed chemically or biologically (Syed, Soreanu et al. 2006). A biological treatment system, manufactured by Biogas Energy, Inc. (Kensington, CA), is used to reduce the presence of H2S in the biogas at Fiscalini Farms. The biological treatment method consists of netting located in the biogas headspace of the anaerobic digesters, and is intended to support a microbiological community that oxidizes sulfide (S2-), originating from H2S, to elemental sulfur (S). Small amounts of ambient air are injected into the headspace to accommodate growth of the appropriate bacteria on the netting. The Biogas Energy, Inc. biological H2S removal system is intended to reduce H2S levels to approximately 250 ppm. In contrast, hydrogen sulfide concentrations of 1930 ppm and 3100 ppm in biogas have been reported for plug flow anaerobic digesters without hydrogen sulfide removal systems (Martin 2004; Martin 2005). A compact selective catalytic reduction (SCR) emission control system manufactured by Engine, Fuel and Emissions Engineering, Inc. (Rancho Cordova, CA) is used to control stack emissions, primarily nitrogen oxides (NOx). Although some components of NOx are greenhouse gasses, nitrogen oxides are regulated in California because that contribute to ground-level ozone and particulate matter formation, resulting in numerous health effects (U.S. EPA, 2011). Nitrogen oxides are therefore undesirable and are regulated in stack emissions. The SCR catalyst

Final Report Page 8 of 172
functions by reacting the NOx with ammonia (NH3), added in the form of urea [(NH2)2CO] (Forzatti 2001). The reaction results in conversion of NOx and NH3 to nitrogen gas (N2) and water (H2O). To prevent any ammonia “slip” (leftover ammonia) from escaping, a narrow layer of finely-dispersed platinum catalyst is placed at the end of the SCR modules to burn any remaining ammonia to nitrogen and water. The SCR reactions require an exhaust temperature of at least 200 oC. The SCR is equipped with monitors and ancillary equipment that adjusts the urea flow to match the rate of NOx emissions from the engine. The biomass energy system was integrated into the previously established dairy operations (Figure 1). The flush-water from the free-stall barn is screened using a slope-screen separator and then sent to the thickening vault (thickener), where the flush-water is further clarified before being returned to the flush-water storage tanks at the head of each free-stall barn, where it is reused for lane flushing. The slurry from the bottom of the thickener is pumped into the anaerobic digester tanks via a computer-controlled pump. Screened manure solids, sudan grass and waste silage are collected and fed into the anaerobic digesters via the solids feed hopper. Effluent slurry from the anaerobic digesters is conveyed to a screwpress for solids and liquid separation. The separated solids from the screwpress are used as a bedding material at the dairy and the clarified effluent is sent to the storage lagoons where it will be used for irrigating crops. Water is added to the system from dairy and cheese manufacturing facility. Excess flush-water is pumped from the return vault to the storage lagoons using a sump pumping system. The two storage lagoons are in series and have a combined storage volume of 41.8 million gallons. The lagoons are used to stabilize the excess flush-water before subsequent land application (following blending with irrigation water) on surrounding fields that are used to grow the livestock feed and bioenergy crops. Assumptions and criteria that were used to design the biomass energy system are shown in Table 1. It was designed that the anaerobic digester feedstocks would consist of 40,000 gal/d of thickened solids from the sedimentation basin, 20,000 lb/d of solids from the slope screen separator, and 60,000 lb/d of sudan grass. Based on the intended influent feedstock loadings, it was assumed the anaerobic digester effluent would consist of 48,000 gal/d of slurry. The residence time in the digesters was intended to be 24 to 30 days. The design was based on a facility that has 3,000 head of dairy cattle that produce 18.623 gal/head/day of manure. Construction of the biomass energy system commenced in the fall of 2007 and was complete in the spring of 2009. Following start-up of the facilities, sale of electricity commenced in August 2009.
Collection and Analysis of Solid, Liquid, and Gas Samples Operational data collected from August 2009 to November 2010 for the biomass energy system were used to perform this economic analysis. Prior to this time period the system was not fully operational and start-up activities were still underway. Data from December 2010 were not available as the result of a computer malfunction. In addition, starting in February 2011 Anaerobic Digester Tank 2 was taken out of service for an extended period for mixer replacement and removal of accumulated solids. The originally installed mechanical mixing

Final Report Page 9 of 172
equipment was replaced with a recirculation hydraulic system that mixes the digester contents using pumps. Data collected included flows and mass loading rates, and constituents in the solid, liquid, and gas process streams. Data collected continuously using on-line meters included volume of thickened flush-water added to the digesters, total weight of solids added (manure solids, sudan grass, and waste silage), digester depth, digester temperature, total biogas volume, biogas content (CH4, O2, H2S), quantity of biogas used for power production, quantity of biogas flared, and power production (Figure 1). Additionally, weather data was collected from a nearby weather station in Modesto, CA. Weather data consisted of rainfall, temperature, average wind speed, solar radiation, and soil temperature. As part of this study, EERP collected monthly influent and effluent samples from the anaerobic digester from July 2009 to July 2010. Location of grab sample collections are shown in Figure 2 and described in Table 2. Protocols used in the collection of samples and other field work conducted at Fiscalini Farms are documented in Appendix B. Samples were transported to the EERP laboratory in Stockton, CA and analyzed for total ammonia nitrogen (TAN), total nitrogen (N), phosphorus (P), potassium (K), boron (B), chlorine (Cl), electrical conductivity (EC), pH, total dissolved solids (TDS), biological oxygen demand (BOD), chemical oxygen demand (COD), dissolved organic carbon (DOC), total solids (TS), and volatile solids (VS). A complete description of analytical methods and associated QA/QC was previously submitted as the Quality Assurance Project Plan (QAPP). Additionally, monthly measurements of biogas samples for H2S, CO2, and CH4 were made using a hand-held device (GFM 416 Biogas analyzer). These analyses supplement and confirm measurements made with continuous monitoring instrumentation. Solid samples were collected for analysis of total N, carbon (C), and sulfur (S).
Measurement and Calculation of Flows and Mass Loadings Critical flows and loadings for the biomass energy system were measured during the observation period. The digester influent slurry flow rate from the sedimentation basin was measured using a flow meter. The total mass of solids was measured using a scale connected to the feed hopper (FC20, PTM S.R.L., Visano, Italy). The relative contributions of manure solids, feed residue, and sudan grass silage were determined from records kept by Fiscalini Farms. Values of 50%, 46%, and 4% are assigned to the contributions from manure solids, silage, and feed residue, respectively. The digester effluent flowrate and thickened digestate mass were calculated using a mass balance approach. The mass of the anaerobic digester effluent was calculated by subtracting the biogas mass from the mass of the anaerobic digester inputs. The anaerobic digester effluent flowrate was then calculated using the measured density. The volume of liquid from the screwpress thickener and the weight of thickened solids were both calculated using separate mass balances on the total wet mass and on the mass of dry total solids (TS). To calculate the hydraulic retention time (HRT) in the anaerobic digesters, the average of the influent and effluent flowrates was divided by the average operating volume. The biogas volume was measured continuously using an in-line velocity meter, and the biogas weight was calculated by assigning values to the biogas temperature and pressure. The biogas temperature in the anaerobic digesters was assumed to be equivalent to the temperature of the

Final Report Page 10 of 172
anaerobic digester contents (approximately 100 °F). However, it was assumed that the biogas temperature was lowered as a result of conveyance in an underground gas pipeline that extends 1,700 feet from the anaerobic digesters to the CHP system. Since the biogas temperature was not continuously monitored, it was assumed that the biogas temperature at the CHP unit was equivalent to the soil temperature. Based on measurements taken during site visits, the biogas pressure was assigned a value of 80 mBar. The biogas was monitored continuously for CH4, O2, and H2S content on a volume basis. It was assumed that CO2 occupies the remaining portion of the biogas volume. Completion of work scope
Task 1 – Project management and planning The subcontract between the University of the Pacific and Fiscalini Farms was executed on October 9, 2009. The Ecological Engineering Research Program (EERP) was designated the lead scientific unit for the contract. Quarterly invoicing and activity reports were delivered as part of Task 1. EERP scientists and technical personnel attended administrative, planning, and technical meetings as part of the project. In those meetings, activities to meet project task objectives were organized. Meeting activities related to Task 2 (Installation of anaerobic digester equipment) included specifying equipment for the continuous measurement of gas and liquid concentration and flow; and evaluation of digester mixing equipment (pumps and agitators). Meeting activities related to Task 3 (Start-up and operation) included evaluation and recommendations on thickener operations, discussion of overall digester operations, discussion of regulatory issues related to air emissions, and planning for maintenance of the anaerobic digesters and power plant. Meeting activities related to Task 4 (Sample collection and analysis of biogas and digester water) included scheduling of sample activities, evaluation of challenges to sampling, planning for data sharing between cooperating organizations (including regulatory agencies), and presentation of results to Fiscalini Farms personnel and cooperating organizations. Meeting activities related to Task 5 (Cost benefit analysis of the project) included discussion of data sharing between collaborators, requests for economic data, and discussion of regulatory barriers to development of a biomass energy economy in California.
Task 2 – Installation of anaerobic digester equipment EERP served in an advisory capacity to Fiscalini Farms as part of Task 2. Fiscalini Farms, in cooperation with industrial partners, installed and operated a biomass energy power plant located at 4848 Jackson Rd, Modesto, CA. A description of the biomass energy system is contained in the Methods section of this report.
Task 3 – Start up and operation Construction of the anaerobic digester tanks started in Fall 2007 and was completed after receipt of the Guascor engine in August of 2008. The anaerobic digesters were completed and filled with manure in October 2008. The CHP and SCR were installed and tested in December 2008.

Final Report Page 11 of 172
Final construction and modification of the biomass energy plant was completed in the Spring 2009 and delivery of electricity to the Modesto Irrigation District power grid was initiated in July 2009. Collection of grab samples was initiated in July 2009, under funding from this grant (Figure 2). Continuous monitoring of electrical production, biogas production, and other variables, such as reactor temperature, started in July 2009 (Figure 1). Instruments for the continuous measurement of nitrogen oxides (NOx) were installed on the exhaust of the SCR in January 2009 and at the inflow to the SCR in June 2010. Presentation of all data collected and an analysis of this data is contained under Task 4 and 5 descriptions.
Task 4 – Sample collection and analysis of biogas and digester water Monthly influent and effluent samples were collected to establish baseline water quality and environmental conditions for the bioreactors. Samples were collected from the anaerobic digester and other locations as shown in Figure 2 and described in Table 2. During the course of this study (2009 – 2010), all biomass supplied to the bioreactor originated on the dairy and associated fields. In the future, biomass codigestates will be imported from off-site locations to be converted to methane using anaerobic digestion. The establishment of a baseline under current conditions will allow the environmental impact of importing biomass and other changes in operating conditions to be evaluated in the future. The Fiscalini Farms’ digesters were designed to operate at mesophilic temperatures. The average temperature in both anaerobic digesters was 101.4 °F, which is very close to the design temperature of 100 °F, and the temperature was very stable (a standard deviation of 1.7 °F in Anaerobic Digester Tank 1 and 2.7 °F in Anaerobic Digester Tank 2). The average depth in the anaerobic digesters is 22-feet and 22.2-feet, respectively, indicating that the combined anaerobic digester volume is 1.90 million gallons. Results from the monthly grab sample analysis are shown in Appendix C and D. the analysis of the monthly samples show that the data are consistent month to month and that the system operations were stable during the course of the study. The stability of the anaerobic digester operation is reflected in the low coefficient of variation observed in the tanks (sites 3 and 4) and the digester effluent (site 16) measurements for solids and salts (Table 3). The coefficient of variation for the inputs to the digesters are higher (sites 2, 7, and 8 in Table 3), but reasonable, given the heterogeneity of the substrates. The data indicates that reactor operations are stable and that results for the grab sampling program can be combined with continuous monitoring data to calculate mass balance and discharge rates. Measurements of methane, oxygen, hydrogen sulfide, and carbon dioxide in the biogas were taken by EERP scientists during site visits (Figure 3 and Table 4). A continuous monitoring device was used to measure hydrogen sulfide and oxygen content in the biogas (Figures 4 and 5). Methane in the biogas was also measured continuously, but the continuous monitoring device was not properly calibrated. Comparison between measurements by EERP scientists and continuous monitoring data indicate that the continuous monitoring has precision, but is reporting methane results approximately 132% of actual values. Continuous measurements for

Final Report Page 12 of 172
oxygen and hydrogen sulfide are also likely biased high in the case of hydrogen sulfide and low in the case of oxygen. Measurements made on calibrated equipment by EERP scientists are used in this analysis. Continuous monitoring devices were used to measure NOx in the power plant exhaust gas prior to and following treatment in the SCR. These instruments were maintained and calibrated by Engine, Fuel, and Emissions Engineering, Inc., the manufacturer of the SCR. Additional continuous data collected included engine temperature and electricity production. Continuous monitoring devices were also used to document operational parameters of the biomass energy system (Table 5). Three waste streams are fed into the anaerobic digesters: thickened slurry from the sedimentation basin, a combination of sudan grass and waste silage (feed residue), and manure screenings from the slope screen. Between August 2009 to November 2010, an average of 4,113 ft3/d of thickened input slurry was fed to the anaerobic digesters from the sedimentation basin, 40,835 lb/d of sudan grass and waste silage was added, and 40,661 lb/d of screened manure was loaded into the anaerobic digesters. Based on the design hydraulic detention time (HRT) of 24-30 days, the allowable average flowrate in the anaerobic digesters is between 63,000 and 79,000 gal/d. Only approximately 50-62% of the available digester capacity is being used. The estimated existing influent flowrate to the anaerobic digesters was 40,500 gal/d, based on a summation of the three digester inputs. The existing effluent flowrate from the anaerobic digesters was 38,500 gal/d, indicating a 5% reduction in volume of digester feedstocks due to microbial digestion and production of biogas.
Task 5 – Sustainability analysis
Sustainability of power plant operations Alternative electrical generation capacity from sources such as wind and solar energy are not able to consistently produce electricity and management of those alternative energy sources proposes challenges to the power industry. In contrast, anaerobic biomass conversion for electrical production appears to be a reliable and consistent source of energy. The Fiscalini Farms power plant has produced electricity every day. Analysis of power production as a function of hour of day demonstrated that power was produced on a 24 hour a day schedule (Figure 6). These results suggest that dairy-based anaerobic digester power plants could be a consistent source of 24 hour electricity capacity to regional power grids. This result illustrates a very important advantage of dairy-based, biomass energy production over many other renewal sources of electricity. During the 15-month period from August 2009 to November 2010, only 2.9% of the biogas was sent to the flare. Most of the power interruption days were for scheduled maintenance and were coordinated with the regional utility company (MID). Between August 2009 and November 2010, the power plant produced 106,340,952 kWh of electricity, which amounts to an average of 9754 kWh/d or 406 kW and is 57% of plant capacity (Figure 7). In 2008, average residential electrical consumption in California was 587 kWh per month (U. S. Energy Information Agency 2010), indicating that Fiscalini Farms produced power equivalent to the demand for approximately 498 homes. However, electrical production was significantly below sustainable capacity of the power plant (710 kW or 512,424 kWh per month).

Final Report Page 13 of 172
The thermal conversion efficiency (TCE) of the Fiscalini biomass energy plant was calculated in accordance with protocols developed by Eastern Research Group for the USEPA (Eastern Research Group, 2011):
TCE %Electricity, kWh/d 3,412Btu/kWh
Biogas,m d⁄ Methanecontent, decimal LHV, Btu/m100
Methane was assigned a lower heating value (LHV) of 27.2 Btu/m3 at standard conditions (0°C and 1 atm) (Mark’s Standard Handbook for Mechanical Engineers, 1978). Assuming the biogas temperature was the same as the soil temperature and the pressure was 80 mbar (based on field measurements), the TCE was 26.2% ± 5.8%. These efficiency calculations do not include heat recovery. This data suggests that electrical generation with the Guascor engine is less efficient that gas fired boilers, which are reported to have efficiencies of between 49% to 52%, but has a high efficiency for an internal combustion engine, which have reported energy efficiencies of between 18 % to 20 % (Spath and Mann 2000; Bellman, Blankenship et al. 2007; U. S. Energy Information Agency 2010). The major reason electrical production was less than capacity can be attributed to the quantity of methane produced by the anaerobic digesters. During the time period from August 2009 to November 2010, the anaerobic digesters produced 106,340,952 ft3 of biogas, of which 97.1% was used for energy production (Figure 8 and Table 6) and 2.9% was flared off (Figure 9). The use of the flare to dispose of excess gas has declined over time, as operations have moved from start-up to more routine operations. The methane content of the biogas averaged 49.7%, as indicated in monthly on-site measurements. An examination of the daily power production as a function of the daily biogas production (Figure 10) shows that, typically, power production increased as biogas production increased. On average, the biogas yield was 7.7 ft3 per pound of VS added, and 18.3 ft3 per pound of VS destroyed. Using the average methane content of the biogas (49.7%), methane yield was 3.8 ft3 per pound of VS added and 9.1 ft3 per pound of VS digested. The average electricity production was 44.7 kWh per 1000 ft3 of biogas used in combustion and 89.9 kWh per 1000 ft3 of methane used (Table 7). Factors limiting the production of methane were investigated using standard approaches for the analysis of biological reactors. Methane production was not a linear function of volatile solids (VS) loading to the reactor, suggesting that gas production is not limited by the amount of organic matter being added to the system at high loading rates (Figure 11). Possible limiting factors for methane production include trace- or macro-nutrient limitation or physical limitations such as mixing. Feedstocks were not fed to the reactor individually, so it was not possible to determine separate gas yields for sudan grass, feed residue, or screened manure solids. The contribution of volatile solids from the thickened slurry was reduced over time although inputs of manure solids, feed residue, and sudan grass have remained relatively constant (Figure 12). Although there is a slight downward trend in volatile solids from the thickening vault, the production of biogas and electricity appears stable (Figure 13). An analysis of the HRT reveals that the performance of the system to produce biogas is not correlated with the HRT, which is surprising for a biological treatment system (Figure 14).

Final Report Page 14 of 172
From this analysis, it can be concluded that plant operation are stable and dairy-based biomass energy plants can be a sustainable source of electricity. Fiscalini Farms is currently operating below design capacity. In this baseline study, three feedstocks were fed consistently and feedstock loading were kept within a limited range of values. Methane production appeared to be independent of increased VS loading, within the measured ranges, suggesting that methane production may be limited by physical mixing or nutrient substrates other than organic carbon. In the future, other feedstocks (cosubstrates) will be added to the anaerobic digesters and comparison to the baseline values collected in this study will allow a better understanding of parameters limiting biogas production in this system.
Environmental sustainability An important component of sustainability is the ability of the biomass energy system to meet environmental regulations. Environmental regulations for dairy-based biomass energy facilities have not been firmly established. However the impact of air and water regulations on operations is and will be an important constraint on the success of biomass energy in California and elsewhere. Constraints in permits affect how the biomass energy system can be operated and specifically expanded. However, the need to develop alternative energy sources, including bioenergy, is recognized and encouraged by the State of California. The California Energy Commission recognizes that current environmental policies detour further development of biomass energy systems and has established the Bioenergy Action Plan to streamline regulatory processes and encourage development of future systems (CEC, 2011). Fiscalini Farms must comply with environmental regulations that protect air and water quality and as a result holds environmental permits that contain provisions for stack gas emissions and for liquid and solid waste streams generated on-site, including maximum contaminant levels and reporting requirements. The biomass energy system currently operates under a temporary, conditional use air quality permit that was issued by the San Joaquin Valley Air Pollution Control District (SJVAPCD). The air quality permit will be reviewed by SJVAPCD following two years of operation of the biomass energy system. In addition, Fiscalini Farms holds water quality permits issued by California’s Central Valley Regional Water Quality Control Board (CVRWQCB) that are required for operation of a dairy and cheese factory. Their general operating water quality permit was modified following construction of the biomass energy system. In addition, CVRWQCB adopted new guidelines for dairies that operate anaerobic digesters for the treatment of manure and for the operation of co-digestion facilities. California environmental regulations applicable to dairies are complex and a simple review of applicable regulations reveals a variety of air and water regulations. In California, dairies are regulated by one of the nine California Regional Water Quality Control Boards (CRWQCB) that are collectively part of the State Water Resources Control Board and fall under the jurisdiction of the California Environmental Protection Agency. Fiscalini Farms is located in an area that is under the jurisdiction of the Central Valley Region, which is charged with regulating dairies within this region (CVRWQCB, 2011). General environmental regulations pertaining to water quality at dairies in California can be found in Title 27: Statewide Water Quality Regulations for Confined Animal Facilities. Environmental requirements specific to dairies can be found in Order No. R5-2009-0029: Waste Discharge Requirements, General Order for Existing Milk Cow

Final Report Page 15 of 172
Dairies, which replaced Order No. R5-2007-0035. In addition, California regulators recently approved Order No. R5-2010-0130: General Order for Dairies with Manure Anaerobic Digester or Co-digester Facilities. There are two additional orders that are in reference to dairies. The first is Order No. R5-2010-0018, General NPDES No. Cag135001: Waste Discharge Requirements for Cold Water Concentrated Aquatic Animal Production Facility Discharges to Surface Waters. This rule is not applicable to Fiscalini Farms because they are not directly discharging to a surface water body. However, Fiscalini Farms is required to comply with WQ Order No. 97-03-DWQ, NPDES No. CAS000001: Annual Report for Facilities in the Feedlot Category Regulated By Statewide General Permit. Consistent with the United States Clean Water Act (CWA), a dairy is considered a “concentrated animal feeding operation” and a “point source” and subject to the National Pollutant Discharge Elimination System (NPDES) permit program. Fiscalini Farms holds several water quality permits. They received Waste Discharge Requirements issued by the Central Valley CRWQCB in Order No. R5-2008-0100, issued June 12, 2008 as well as a corresponding Monitoring and Reporting Program (MRP) document. Operation of the cheese plant has led to procurement of a General Industrial Storm Water Permit, Water Quality Order No. 97-03-DWQ, NPDES No. CAS000001, that is identified by WDID No. 5S501013935. Order No. R5-2008-0100 allows Fiscalini Farms to anaerobically digest dairy manure, cheese whey, and sudan grass, all of which must be from on-site sources. Treatment of off-site waste streams is not allowed under the R5-2008-0100. The facility must comply with guidelines set in accordance with designated beneficial uses in the Water Quality Control Plan for the Sacramento and San Joaquin River Basin. The biomass energy project did not fall under the requirements of California Environmental Quality Act (CEQA) requirements as the Stanislaus County Planning and Community Development, the lead agency for CEQA, issued a Negative Declaration on April 5, 2007. Many of the provisions in the water quality permit are intended to protect groundwater quality. The State Water Resources Control Board Resolution 68-16 prohibits degradation of groundwater in most cases and requires use of best practicable treatment or control (BPTC) technologies to minimize degradation. Degradation of groundwater quality is allowed where it is in the best interests to the people of California, the degradation does not unreasonably affect present and future beneficial uses, the degradation does not result in water quality outcomes that are less than what is prescribed in state policies, and BPTC are being applied. To protect groundwater, the storage lagoons must be lined or underlain with impermeable soils. Previously the soils underlying the storage lagoons were found not to be sufficiently impermeable so the lagoons were modified. Manure and wastewater must be stabilized prior to land application. Generally, a storage time of 120 days during winter months is considered acceptable. Manure and wastewater that is land applied must be applied at “rates reasonable for the crop, soil, climate, special local situations, management system, and type of manure,” providing flexibility but also requiring facilities to report and demonstrate that their practices are reasonable. Under the Waste Discharge Requirements Order, Fiscalini Farms has numerous reporting responsibilities. A Hydrogeologic report was required and completed, which served to establish reasonable loading rates for manure and wastewaters that are applied to the facility’s fields (Harter 2011). Fiscalini Farms was also required to implement a Best Practicable Treatment or

Final Report Page 16 of 172
Control Plan (BPTC) of the wastes produced on-site to minimize environmental impacts. Fiscalini Farms is required to monitor and report conditions of the facility, including operation of the anaerobic digesters, as well as monitoring of nutrients and various constituents in the wastes, surface runoff, and groundwater. There are a series of monitoring wells on-site that are used to collect groundwater samples for analysis. The constituents of concern are nutrients (nitrogen and phosphorus), potassium, boron, and salts (primarily sodium and chloride). Fiscalini Farms was required to report background concentrations of nitrate and salinity (EC or TDS) in groundwater as well as a Salinity Evaluation and Minimization Plan. Additional reporting requirements included a Waste Management Plan (WMP) prior to digester effluent entering the storage lagoons, Nutrient Management Plan (NMP) prior to land application of wastewater containing digester effluent, a written BPTC Technical Evaluation after two years of operating data had been collected, and a Groundwater Limitations Analysis. The EC and TDS of anaerobic digester inputs and outputs must also be measured and reported. The currently held water quality permits result in several operating constraints for the dairy and cheese plant. The allowable herd size is 1,898. Whey wastewater is limited to 4,000 gal/d and land application of the undigested whey is prohibited. Wastewater from the storage ponds may be blended prior to using it for on-site irrigation of non-food crops, although this wastewater must infiltrate completely within 72 hours of the application. Export of wastewater off-site is allowed although it is strictly regulated and requires written agreements. Wastes may not be stored on-site for more than 12 months. Disposal of dead animals in the manure and wastewater systems is prohibited. Discharge of all wastes and storm water must be in accordance with the facility’s environmental permits. Setbacks and vegetated buffers are required where there are surface waters, permeable structures, sinkholes, and other conduits to surface waters. Dairies that wish to develop biomass energy systems also will be required to meet stringent air quality regulations. Fiscalini Farms’ air permit for the CHP unit consists of a “Notice of Issuance of Authority to Construct” that was issued as Permit No. N-6311-9-1 by the SJVAPCD on December 17, 2008 (Table 8). The facility is conditionally allowed to operate the 1075 bhp Guascor Model SFGLD-560 biogas-fired lean-burn internal combustion engine with a Miratech oxidation catalyst (or approved equivalent) and a Miratech selective catalytic reduction (SCR) system catalyst (or approved equivalent) that drives the 750 kW electrical generator. Although, as the project developed at Fiscalini Farms, it was determined the Miratech technology could not meet the regulatory standards. As a result, the SCR designed and built by Engine, Fuels, and Emissions was installed and tested to determine the long term effectiveness of the technology. The current air permit restricts stack gas emissions of hydrogen sulfide (H2S), NOx, carbon monoxide (CO), volatile organic carbon (VOC), particulate matter, and ammonia (NH3) in the power plant emissions (Table 8). Accordingly, source testing for NOx, CO, VOC, and NH3 is done such that the arithmetic averages of three 30-consecutive-minute test runs are calculated. During the initial two year period a violation shall occur if NOx emissions are above the 0.6 g NOx/bhp-hr level and thereafter violations shall occur if NOx emissions, or emissions of any other constituent, are above the stipulated level. Specific reporting requirements are contained in the permit.

Final Report Page 17 of 172
Nitrous Oxide Emissions Control A major focus of the SJVAPCD is the control of nitrogen oxide (NOx) emissions in the San Joaquin Valley. The conditional nature of Fiscalini Farms’ permit is related to the allowable level of NOx that may be discharged in the system emissions. The district has required use of the best available control technology (BACT) for engine emissions. The allowable NOx level was tentatively set at 0.6 g NOx/bhp-hr [44ppm-vd NOx at 15 % oxygen (O2)], although the permit conditions will be re-evaluated after two years of operating data have been obtained. It is possible that after two years of operation of the CHP system the SCR will need to be replaced in order that the BACT system is in use. Fiscalini Farms and the SJVAPCD agreed that a NOx emission limit of 0.6 g NOx/bhp-hr [44 ppm-vd at 15 % O2] be applied, as this is the limit that is guaranteed by the manufacturer of the engine. However, the SCR system was installed in order to determine if a lower emission level of 0.15 g NOx/bhp-hr could be met, although this technology has not been demonstrated on an engine fueled solely with dairy biogas. After two years of operational data has been obtained, Fiscalini Farms will have 90 days to submit a report and propose a final NOx level and the District will have 90 days to respond. Continuous measurements of NOx in the exhaust of the SCR indicated that the initial performance of the SCR did not meet expectations (Figure 15). Trouble shooting of the SCR indicated that the urea injection system was malfunctioning and modifications were necessary and made to improve performance. An additional NOx monitor was ultimately installed so the performance of the SCR could be better evaluated as part of this and future studies. The ability of the SCR to reach proposed emission limits was examined using average daily data collected between January 23, 2010 (8:23 pm) to June 21, 2011 (11:59 pm). The NOx measurements were collected using continuous, in-line sensors installed and operated by EFEE. The Ecological Engineering Research Program (EERP) scientists and staff have not independently verified the accuracy of the data, but EFEE has been working closely with Ramon Norman (Air Quality Engineer) and others at the San Joaquin Valley Air Pollution Control District (SJVAPCD) and the data from the sensors is believed to be accurate and comparable to measurements taken by SJVAPCD staff and scientists. The data that is included in this analysis were collected when the exhaust temperature was at least 400 °F (corresponding to a fully warmed up and running engine) and NOx values were within the sensors valid measurement range of 0 to 1000 ppm. This cut-off point was based on the upper range of the sensor. There were approximately 60 of the over 480,000 data points recorded that fell between 500 and 1500. The NOx emissions data included in this analysis are the oxygen corrected data as reported by the continuous NOx monitor. These data were collected continuously over an interval of 18 months. Regulation of NOx emissions by SJVAPCD is based on the average measurement of NOx during a 30 minute interval, so data were also binned or coded into 30 minute segments for analysis. There was an improvement in emissions from the SCR over time. Since the installation of the SCR in later 2009 or early 2010, there have been a number of modifications to the SCR, including improvements in the urea injection system. In Figure 15, the valid NOx data are plotted as a function of month of operation. Figure 15 is useful for visualization of the raw data set and a least-squares regression of the data (red line in Figure 15) shows there has been a significant improvement in SCR operations over time. When all data are included, NOx

Final Report Page 18 of 172
emissions are less than 29 ppmvd 90% of the time, equal or less than 44 ppmvd 92% of the time, and less than or equal to 11 ppmvd 72% of the time (Figure 16). The mean value for this data set is 15.9 ppmvd and the median value is 9 ppmvd. Analysis of data averaged over 30 minute intervals did not yield a greatly different result. Data collected at a one minute interval were binned into 30 minute increments and the mean NOx was calculated for each bin. Bin with more than 10 measurements (n = 20,923) were included in this analysis. The 30 minute average was less than approximately 28 ppmvd 90% of the time, equal or less than 44 ppmvd 92% of the time, and less than or equal to 11 ppmvd 68% of the time (Figure 17). Since the performance of the SCR was shown to improve over time, a separate analysis was conducted for data collected in 2011 (months 13 to 18 of operation). As before, data collected at a one minute interval were binned into 30 minute increments and the mean NOx was calculated for each bin. Bin with more than 10 measurements (n = 7,333) were included in this analysis. The 30 minute average was less than approximately 14 ppmvd 90% of the time, equal or less than 44 ppmvd 95% of the time, and less than or equal to 11 ppmvd 84% of the time (Figure 18). For this data set, the mean was 12.08 ppmvd and the median value was 8.42, with a range of 2.32 to 124.9. Hydrogen Sulfide in the Biogas The Fiscalini Farms digester is not regulated for sulfur oxides (SOx) directly, but rather is required to control H2S entering the engine in the biogas. The Biogas Energy, Inc. (BEI) anaerobic digester system includes an oxygen injection system for the removal of H2S in the produced biogas. According to information provided by the BEI, the system is intended to reduce H2S levels in the biogas to 250 ppm. H2S entering the power plant can contribute to the emissions of sulfur oxides (SOx) and the SJVAPCD regulates H2S in the biogas entering the power plant as a surrogate for controlling SOx emissions. Currently the SJVAPCD restricts H2S in digester biogas used as fuel to 50 ppm. Results from the first year start-up indicate that the H2S content of the Fiscalini Farms biogas is very low compared to other anaerobic digester systems, which do not have the air injection and netting system. However, the 50 ppm standard cannot be met by solely relying on the BEI air injection system. It is recommended additional study and experimentation be done in the next year to determine if the H2S levels can be further reduced. Additionally, the impact of adding ambient air to the anaerobic digester headspace should be evaluated. Salt Balance A major concern of the CVRWB concerning the sustainability of the agricultural land in the San Joaquin Valley is the management of a regional salt balance. At this time, the salt balance on the dairy has not changed as a result of the installation of the digester and power plant, because all biomass supplied to the plant originates on-site. In the future, Fiscalini Farms is interested in importing biomass material for the production of power and the data collected in this study can be used to establish an operational baseline. The impact of importing off site biomass to the digester system including a salt balance can be determined using this operational baseline.

Final Report Page 19 of 172
In this study, we investigated whether, using the sampling regime instituted under this program, sufficient data was being collected to develop a mass balance for total solids, volatile solids, mineral solids, chloride, potassium, and nitrogen (Table 9). The ability to conduct a reasonable mass balance is a prerequisite for the CVRWB to allow the importation of off-site wastes for co-digestion. The mass balance on mineral solids and total solids were less than 10%, which is very good for a reactor this size. The mass balance on salts is less than 15%, indicating that salts entering the system with solid feeds are being accurately measured. Maintaining a salt inventory is an important concern for protection of groundwater and maintenance of soil productivity and permits from the CVRWB allowing the importation of off-site codigestates are likely to include salt monitoring requirement. The overall mass balance had an apparent error of 7.0 %, which is within acceptable limits for a reactor of this size, and flush-water solids represented 68.5 % of the VS that were added to the anaerobic digesters with the co-digestates accounting for the balance. Treatment in the anaerobic digesters resulted in a 42.0% reduction in VS and the production of biogas. To limit salt and nutrient accumulation at the site, there are several enforceable water quality limits. The total nitrogen that is land applied cannot exceed 1.4 times the nitrogen removed by harvested portion of the crop (Harter 2011). Irrigation systems cannot be less than 75% efficient. Because one of the beneficial uses in the basin is municipal and domestic supply, the Basin Plan requires that water designated as domestic or municipal supply to meet the maximum contaminant level (MCLs) specified in Title 22 CCR. In addition, interim groundwater limits, applied to shallow groundwaters below the facility also apply (Table 10). The total dissolved solids (TDS) concentration in the storage lagoons cannot exceed 1,069 mg/L during the winter (December through March) or 4,736 mg/L during the summer (April through November). Greenhouse Gas Emissions Greenhouse gas released as a result of agricultural and energy-related activities is significant. In 2009, agricultural activities accounted for 6.3% of total U.S. greenhouse gas emissions and much of this resulted from enteric fermentation and manure management practices, which represented 20.4% and 7.2% of total methane emissions, respectively (U.S. EPA, 2011). Methane is a potent greenhouse gas, and contains 21 times the global warming potential (GWP) of carbon dioxide based on a 100 year time period (IPCC, 2006). To encourage reductions of greenhouse gases such as methane, carbon markets have developed where producers can buy and sell credits for emissions. Guidelines for calculating methane reductions must be followed to seek carbon credits (IPCC, 2006; UNFCCC, 2010). Methane reductions are possible as a result of biomass energy projects because of changes in manure management. In addition, carbon dioxide reductions result because of the displacement of electricity produced using combustion of fossil fuels. In 2009, fossil fuel combustion accounted for 79% of global warming potential (GWP), and 41% of carbon dioxide emissions resulting from fossil fuel combustion were emitted as a result of energy production (U.S. EPA, 2011). Typically biomass energy systems result in the environmental benefit of reduced methane emissions, thereby reducing release of greenhouse gases (U.S. EPA, 2004). The net methane reduction is not based on the quantity of methane generated in the biomass energy system.

Final Report Page 20 of 172
Rather, it is determined by first estimating the methane emissions from prior waste management systems for manure and co-mingled waste streams and then subtracting methane emissions from system leakage, flare use, imperfect internal combustion, and fossil-fuel use associated with operation of the system (Eastern Research Group 2011).
Economic analysis Appendix A includes the complete economic and engineering analysis for the Fiscalini Farms biomass energy plant. The Fiscalini Farms biomass energy project meets the definition of economic sustainability as it is currently operated, but the facility is not meeting the project design goals. Significant improvements should be made to enhance methane production and other steps can be taken to enhance economic performance. Economic sustainability was determined in this study using established protocols for engineering economic analyses and metrics of economic stability. Further analysis was conducted to identify key components of the Fiscalini Farms system that can be modified to improve economic sustainability. The project could benefit from increased utilization of on-site substrates as well as the addition of off-site co-digestates, which would allow the power plant to operate near system capacity. Additional revenue sources could be realized from additional avoided propane costs, tipping fees, increased biogas and electricity production, off-site sale of digester solids, and credits for reduction of GHG releases. Additional work is warranted to pursue these additional revenue sources. The results of this analysis indicate that dairy-based biomass energy production can be economically sustainable in California, but profitability will depend on many competing factors. The result suggests the Fiscalini Farms system could be replicated at dairies throughout California in a sustainable manner, if digester operations can be improved to the extent that the power plant will be supplied with sufficient gas to operate at capacity and other conditions, such as adequate financing, grants, and electrical prices are met. The results suggest obtaining favorable pricing structures and operating power plants near capacity are the most critical factors for economic sustainability. Where favorable pricing is not available, it may be possible to use State and Federal grants or tax incentives to sustain projects. Financing options and the impact on economic sustainability must be explored thoroughly prior to proceeding with new projects. Selection of appropriate anaerobic digester technology also appears to be a key component in project success. The results of this study suggest that additional work should be conducted to determine the optimal strategy for managing biomass energy project at dairies that use flush-water manure collection systems. A major contribution of this study was to analyze the economic impacts of emissions control technologies for NOx removal. The NOx removal system did contribute to the capital and O&M costs incurred; however, the contribution of these costs was not significant enough to alter the economic sustainability of the project. In future projects where emissions control devices are needed, it is necessary to assess the economic impacts of the required infrastructure. Overall the biomass energy project at Fiscalini Farms resulted in stabilization of manure and other wastes, reduction in GHGs released, generation of electricity and waste heat, yielding an economically sustainable project, as defined by standard economic indicators. Provided that the system continues to be operated to maintain the integrity of the equipment and co-digestation is

Final Report Page 21 of 172
implemented to achieve operation at system capacity, the biomass energy system should continue to be sustainable and potentially profitable. Conclusions & Recommendations
Temperature and pressure measurement. Continuous pressure and temperature measurements should be made in addition to continuous gas flow and gas composition measurements. Measurement of pressure and temperature will allow for application of green house gas (GHG) credits and improve the system mass balance.
Calibration of continuous monitors. Continuous monitoring devices for measurement of biogas components should be calibrated to provide accurate in-line readings of methane, hydrogen sulfide, and oxygen. The nitrous oxide monitors should continue to be maintained on a regular calibration schedule. The accuracy of scales and flow-meters used for biomass feed should be checked and calibrated as per manufacturer recommendations.
Nitrous oxide emissions. The utilization of continuous monitors to measure NOx emissions from the power plant after the SCR presents an opportunity for applying innovative approaches to the development of air pollution permit requirements for biomass energy facilities. For example, continuous monitoring would allow the establishment of emission limits based on rolling 30 day averaging periods, as is applied to other industries, rather than on three 30 minute averaging periods that occur monthly, as is currently the case. Continuous monitoring also allows for the development of regional emission trading markets.
Quality assurance plan. A quality assurance plan (QAP) should be instituted for all data collected at the facility. This QAP should include a regular calibration schedule for continuous monitoring devices. Regular calibration and quality assurance will be required for GHG credits and will allow the continuous monitoring data to be used with greater confidence for operational control.
Greenhouse gas survey. A GHG survey of the facility should be conducted using accepted international protocols. A complete GHG survey will allow for full application for GHG market credits. Future projects should conduct a GHG survey prior to construction of the anaerobic digestion project, so that a sound basis can be established for calculation of GHG credits.
Biomass feedstock availability. The regional biomass feedstock potential should be thoroughly evaluated. In this study, the availability of digestible feedstocks was identified as a potential limiting factor in the development of a regional biomass energy economy. The evaluation should include the availability of digestible agricultural and food wastes; the potential for production of biomass crops; and the economic trade-off occurring between silage for animal feed and digester feed. The actual availability of the feedstocks, as well as the theoretical availability, should be determined.
Limiting factors for methane production. The factors limiting methane production should be further investigated. During the course of this study, the type and amount of biomass fed to the digester did not vary significantly. The lack of relationship between changes in

Final Report Page 22 of 172
loading rate was indication that the loading of carbon (measured as VS) was not the only limiting factor to biogas production. Other possible limiting factors to methane production, include nutrient or trace metal limitation, should be investigated.
Optimization of methane production. Digester operations should be further investigated for the purpose of optimizing methane production. Anaerobic digesters have traditionally been operated for the purpose of waste stabilization, not the optimization of methane production. Waste stabilization is achieved using long retention times and operations are optimized for complete removal of all biodegradable material, the cessation of biological activity, and the removal of pathogens. Optimization for biomaterials production (in this case methane production) involves a different approach to reactor operations than waste stabilization. Changes in digester operations to optimize rapid degradation of the easily biodegradable (labile) organic matter and increase methanogen growth rates could result in an increased rate of methane production. It is possible that methane production rate could be increased by increasing feed rates and lowering digester residence times.
Hydrogen sulfide control system. Evaluate the efficacy of air injection sulfide control system. The use of aerobic sulfide-oxidizing bacteria attached to netting in the headspace of the digester is a clever innovation of the current reactor design. The netting is apparently reducing hydrogen sulfide levels in the biogas, however, the system need improvement in order meet the 50 ppm standard proposed by the regulator agency. Additionally, the effect of air injection on methane production and methane oxidation in the headspace is unknown. An investigation of the air injection-netting system should be conducted to determine the mechanism and kinetics of sulfide removal and the effect of the air injection on methane content of the biogas.
Maintenance and operations. Institute a routine maintenance program. The economic sustainability analysis conducted as part of this study (Appendix A) is based the assumption of a 20 year project life expectancy. In order to have a 20 expectancy, facilities and equipment must be regularly inspected and maintained. A schedule for inspection and preventive maintenance on the physical plant and the supervisory control and data acquisition (SCADA) system should be developed, documented, and applied. An operations manual should be developed for the facility.
Staffing and technical expertise. Staffing for long-term operation should be evaluated. During the baseline study period, the digester was staffed by the dairy farm manager and an experienced dairy farm employee. The operation of the digester was in addition to their normal duties in on the dairy. Additionally, technical support was provided by the University of the Pacific and equipment vendors, under various grants and service agreements. Operation of the digester will become more complicated as co-digestates are imported from off-site, the QAP is implemented, applications are made for GHG credits, and regulatory compliance becomes more strict. The development of a staffing plan is necessary to insure that the digester continues to be sustainable. The system will require staff with expertise in engineering and regulatory compliance. The potential for organizing technical expertise on a regional basis should be investigated, since operation of multiple digesters in a region may justify the cost of a full-time engineering and technical staff with specific expertise in biomass energy power production.

Final Report Page 23 of 172
References Anders, S. J. (2007). Biogas production and use on California's dairy farms: A survey of
regulatory challenges. San Diego, CA. Bellman, D. K., B. D. Blankenship, et al. (2007). Power Plant Efficiency Outlook, NATIONAL
PETROLEUM COUNCIL, POWER GENERATION EFFICIENCY SUBGROUP OF THE DEMAND TASK GROUP OF THE NPC COMMITTEE ON GLOBAL OIL AND GAS.
California Air Resources Board (ARB). (2009). "California Ambient Air Quality Standards (CAAQS)." http://www.arb.ca.gov/research/aaqs/caaqs/caaqs.htm Retrieved July 18, 2011.
California Department of Food and Agriculture (2011). California Agricultural Resource Directory 2010–2011. Sacramento, CA.
California Energy Commission (CEC). (2011, March 11, 2011). "Bioenergy Action Plan." Retrieved May 9, 2011.
Central Valley Regional Water Quality Control Board (CVRWQCB). (2011, May 2, 2011). "Dairy Program Regulations and Requirements." Retrieved May 9, 2011.
Eastern Research Group (2011). Protocol for quantifying and reporting the performance of anaerobic digestion systems for livestock manures. Lexington, MA, Prepared for: U.S. Environmental Protection Agency.
Forzatti, P. (2001). "Present status and perspectives in de-NOx SCR catalysis." Applied Catalysis A-General 222(1-2): 221-236.
Harter, T. (2011). Hydrology, Hydrogeology, and Groundwater Quality, Fiscalini Farms, Modesto, California. Davis, CA, University of California, Davis.
Intergovernmental Panel on Climate Change (IPCC) (2006). 2006 IPCC Guidelines for National Greenhouse Gas Inventories Eggleston H.S., Buendia L., Miwa K., Ngara T. and Tanabe K. Hayama, Japan, National Greenhouse Gas Inventories Programme.
Kramer, J. M. (2004). Agricultural Biogas Casebook - 2004 Update. Madison, WI. Lusk, P. D. (1998). Methane recovery from animal manures: The current opportunities casebook.
Golden, CO, National Renewable Energy Laboratory. Martin, J. H. (2004). A comparison of dairy cattle manure management with and without
anaerobic digestion and biogas utilization. Boston, MA. Martin, J. H. (2005). An evaluation of a mesophilic modified plug flow anaerobic digester for
dairy cattle manure. Morrisville, NC. Scott, N., J. Pronto, et al. (2010). Biogas Casebook: NYS On-farm Anaerobic Digesters.
www.manuremanagement.cornell.edu. Ithaca, NY, Department of Biological and Environmental Engineering, Cornell University.
Spath, P. L. and M. K. Mann (2000). Life Cycle Assessment of a Natural Gas Combined-Cycle Power Generation System, NREL/TP-570-27715. Oak Ridge, TN, U. S. Department of Energy.
Syed, M., G. Soreanu, et al. (2006). "Removal of hydrogen sulfide from gas streams using biological processes: A review." Canadian Biosystems 48: 1-14.
Tchobanoglous, G., F. L. Burton, et al. (2003). Wastewater Engineering: Treatment and Reuse. Boston, MA, McGraw Hill.
U. S. Energy Information Agency (2010). http://www.eia.doe.gov/ask/electricity_faqs.asp, Accessed August 2010. Washington, DC, U. S. Depatment of Energy.

Final Report Page 24 of 172
U.S. Environmental Protection Agency (U.S. EPA) (2004). AgSTAR Handbook: A Manual For Developing Biogas Systems at Commercial Farms in the United States. K.F. Roos, J. J.B. Martin and M. A. Moser.
U.S. Environmental Protection Agency (U.S. EPA). (2010). "Market Opportunities for Biogas Recovery Systems at U.S. Livestock Facilities." Retrieved July 18, 2011.
U.S. Environmental Protection Agency (U.S. EPA) (2011). Inventory of U.S. greenhouse gas emissions and sinks: 1990 – 2009. EPA 430-R-11-005. Washington, D.C.
U.S. Environmental Protection Agency (U.S. EPA). (2011, July 13. 2011). "Nitrogen Dioxide." http://www.epa.gov/oaqps001/nitrogenoxides/ Retrieved July 18, 2011.
U.S. Environmental Protection Agency (U.S. EPA). (2011, April 18, 2011). "Projects: Operating Anaerobic Digester Projects." Retrieved May 4, 2011.
United Nations Framework Convention on Climate Change (UNFCCC) (2010). AMS-III.D.: Methane recovery in animal manure management systems --- Version 17.0 Bonn, Germany.

Final Report Page 25 of 172
Figure 1. Fiscalini Farms biomass energy system flow schematic showing locations of continuous data meters.

Final Report Page 26 of 172
Figure 2. Fiscalini Farms biomass energy system flow schematic showing locations of grab sample locations.

Final Report Page 27 of 172
Figure 3. Biogas content of methane, carbon dioxide, oxygen, and hydrogen sulfide, as measured using a handheld gas analyzer (GFM 416 Biogas Analyzer).

Final Report Page 28 of 172
Figure 4. Hydrogen sulfide concentration of biogas expressed as parts per million. The regulatory target concentration is 50ppm.

Final Report Page 29 of 172
Figure 5. Continuous measurement of oxygen in biogas, measured as a percent of total gas volume.

Final Report Page 30 of 172
Figure 6. Electricity production as a function of hour of day for June 2010 to June 2011. Box plots of production by hour and overall mean (gray line). Mean production of 419 kW during this period was not a function of time of day. This analysis illustrates the 24 hour nature of biomass energy production, in contrast to solar, wind, and other alternative energy sources that typically exhibit a daily production cycle.

Final Report Page 31 of 172
Figure 7. Average daily power production kWh. Bold line represents 30 day (monthly) running average.

Final Report Page 32 of 172
Figure 8. Daily average biogas consumption by the Combined Heat and Power unit. Bold line represents 30 day (monthly) running average.

Final Report Page 33 of 172
Figure 9. Volume of biogas burned in the flare rather than used for power production.

Final Report Page 34 of 172
Figure 10. Average daily power production as a function of methane used by combined heat and power (CHP) plant.

Final Report Page 35 of 172
Figure 11. Methane production as a function of digester volatile solids loading, using 7-day running averages.

Final Report Page 36 of 172
Figure 12. 30-day average daily volatile solids loading of feedstocks added to the anaerobic digesters.

Final Report Page 37 of 172
Figure 13. 30-day running averages for total volatile solids loading, methane production, and power production.

Final Report Page 38 of 172
Figure 14. Methane production as a function of hydraulic retention time (HRT) (7-day running averages).

Final Report Page 39 of 172
Figure 15: NOx emissions by month. Includes all valid NOx emissions data, over 625 thousand individual measurements. The red line indicates a significant improvement in SCR performance over the 18 month period included in this analysis.
Figure 16: Probability plot for NOx emissions using complete data for 18 month period.

Final Report Page 40 of 172
Figure 17: Probability plot for NOx emissions using 30 minute averages for 18 month period.
Figure 18: Probability plot for NOx emissions using 30 minute averages for 2011 only (months 13 -18 only).

Final Report Page 41 of 172
Table 1. Fiscalini Farms biomass energy system specifications.
Constituent Description Anaerobic digesters: Type Continuous flow, intermittently mixed, mesophilic Number of tanks Two, above grade Temperature control Hot water pipes embedded in 14-in. thick digester walls Mixing frequency 5-10 min. every hour Capacity per tank 850,000 gal. Tank diameter 82-ft. Tank height 24-ft. Temperature 100°F Tank cover system Inner membrane for gas storage and outer membrane for weather
protection Sulfur treatment system Netting in biogas headspace and injection of ambient air to support
growth of sulfide oxidizing bacteria Feedstocks Dairy manure, cheese whey, Sudan green chop, waste silage Combined heat and power (CHP) system: Internal combustion engine power 1,057 BHP Electric generator capacity 710 kW Emissions control Selective catalytic reduction (SCR) system to reduce NOx Biogas supply 1500-foot gas pipeline delivering digester biogas to the generator Storage lagoons: Total volume with 2-ft freeboard 41,800,000 gal Minimum detention time 120 days Annual precipitation 12-in Annual pan evaporation 69-in Digesters designed for (combined totals feeding both anaerobic digesters): Input slurry from sedimentation basin 40,000 gal/d at 8-10% TS Solids from slope screen separator 20,000 lbs/d Sudan green chop solids feeder 60,000 lbs/d Effluent from anaerobic digesters 48,000 gal/d Residence time 24-30 days Equivalent treatment capacity 3,000 head of dairy cattle Assumption for manure production 18.623 gal/head/day

Final Report Page 42 of 172
Table 2. Fiscalini Farm Project sample locations.
Fiscalini Farms Sample Location Numbers Site name
1 Lane Flush2 Input Slurry3 Tank West4 Tank East5 Screwpress Effluent 6 Return Vault7 Sudan Grass Silage Pile 8 Screened Solids Pile 9 Screwpress Solids Pile
10 Flare Gas11 Biogas CHP12 Biogas Pre-SCR 13 Biogas Post-SCR 14 Biogas Tank West 15 Biogas Tank East 16 Digester Effluent 17 First Lagoon18 Screened Return

Final Report Page 43 of 172
Table 3. Coefficient of variation for total solids, volatile solids, chloride, potassium, and nitrogen (%).
Site name Site
number Total solids
Volatile solids
Mineral solids Chloride Potassium
Lane Flush 1 36.1 40.4 28.1 20.0 21.4Input Slurry 2 32.3 28.5 41.7 21.7 24.1Tank West 3 16.3 16.1 18.2 20.2 23.9Tank East 4 18.0 18.7 17.9 20.5 27.6Screwpress Effluent 5 20.9 25.9 16.9 18.9 32.2Return Vault 6 33.1 35.0 30.8 16.9 21.5Sudan Grass Silage Pile 7 19.7 21.5 21.2 50.5 45.1Screened Solids Pile 8 14.1 14.4 35.2 28.8 35.1Screwpress Solids Pile 9 13.1 10.4 26.2 18.3 22.2Digester Effluent 16 14.1 13.6 15.2 13.8 14.3First Lagoon 17 49.6 48.7 51.5Screened Return 18 19.4 18.5 21.4

Final Report Page 44 of 172
Table 4. Spot measurements on biogas1.
Site name Site
number CH4 %
C02 %
O2 %
H2S ppm
Pressure mbar
Biogas CHP 11 49.69 47.08 1.30 202.86 76.36 Biogas Tank West 14 48.95 47.90 1.15 167.50 3.00 Biogas Tank East 15 48.75 47.80 0.90 667.50 2.50
1Results from the online meter located on biogas pipeline are shown in Table L.

Final Report Page 45 of 172
Table 5. Summary of anaerobic digester influents, effluent, and operational data, collected August 2009 – November 2010. The numbers in parentheses represent the Fiscalini Farms site numbers where data were collected. Constituents were calculated using data collected by online meters.
Constituent Average Standard deviation Maximum Minimum Units
Thickened influent slurry (2)
4,113 1,840 8,034 0 ft3/d
Thickened influent slurry conc (2)
79.8 19.3 125.9 21.6 g/L
Waste feed and sudan grass (7)
40,835 12,542 96,891 0 lb/d
Manure solids added to digesters (8)
40,661 12,380 96,894 0 lb/d
Digester influent (2)+(7)+ (8)1
5,408 1,935 8,825 0 ft3/d
Digester effluent (16) 2
5,146 1,903 8,556 0 ft3/d
Screwpress effluent (5) 2
4,234 ft3/d
Screwpress solids pile (9) 2
59,156 lb/d
Digester 1 temperature
101.4 1.7 106 92.8 °F
Digester 2 temperature
101.4 2.7 106 80.3 °F
Digester 1 level
22.31 0.66 22.97 11.81 ft
Digester 2 level
21.98 1.64 22.97 10.17 ft
1Calculated assuming a specific gravity=1.02. 2Calculated based on a mass balance of the system dry solids.

Final Report Page 46 of 172
Table 6. Biogas, exhaust gas, and electricity production values as determined using data from online meters.
Constituent Average Standard deviation Maximum Minimum Units
Biogas sent to flare
6,227 24,968 210,831 0 ft3/d
Biogas used in CHP
213,007 72,770 540,320 0 ft3/d
Biogas oxygen content
0.8 0.7 6.9 0.08 %
Biogas hydrogen sulfide content
314 189 1,314 17.2 ppm
Exhaust gas NOx content
15.9 20.2 0 1000 ppmvd
Electricity production
9,754 3,664 25,234 0 kWh/d

Final Report Page 47 of 172
Table 7. Performance calculations for data collected August 2009 – November 2010.
Constituent Value Units Engine capacity
710 kW
Average daily biogas production
218,359 ft3/d
Percent methane in biogas
49.7 %
Average daily power production
9,754 kWh/d
Average daily power production
406 kW
Percent of generator capacity used
57 %
Average volatile solids added to digesters
28,600 lb/d
Average volatile solids destroyed in digesters
12,000 lb/d
Biogas yield per volatile solids added
7.7 ft3/lb VS added
Biogas yield per volatile solids destroyed
18.3 ft3/lb VS destroyed
Methane yield per volatile solids added
3.8 ft3/lb VS added
Methane yield per volatile solids destroyed
9.1 ft3/lb VS destroyed
Electricity yield relative to biogas used
44.7 kWh/1000 ft3 biogas
Electricity yield relative to methane used
89.9 kWh/1000 ft3 methane

Final Report Page 48 of 172
Table 8. Air quality limits for the Fiscalini Farm CHP as established by the San Joaquin Valley Air Pollution Control District (SJVAPCD) in Permit No. N-6311-9-1 issued on December 17, 2008.
Constituent Limit Basis H2S
1 50 ppmv NOx limit2 0.60 g/bhp-hr 44 ppmvd NOx @ 15% O2 NOx target2 0.15 g/bhp-hr 11 ppmvd NOx @ 15% O2 CO2 1.75 g/bhp-hr 210 ppmvd CO @15% O2 VOC2 0.13 g/bhp-hr 28 ppmvd VOC @ 15% O2 Particulate matter 0.036 g-PM10/bhp-hr NH3
2 10 ppmvd NH3 @ 15% O2 1Permit requirement pertains to biogas used for engine combustion, not emissions. 2Compliance based on arithmetic average of three consecutive 30-minute tests.

Final Report Page 49 of 172
Table 9. Mass balance on total solids, volatile solids, chloride, potassium, and nitrogen (lb/d).
Site name Site
numberTotal solids
Volatile solids
Mineral solids Chloride Potassium Nitrogen
Input Slurry 2 20,504 13,290 5,852 95 183 256
Sudan Grass Silage Pile 7 10,586 8,983 1,603 84 289 179
Screened Solids Pile 8 7,237 6,317 902 9 26 108
Digester Effluent 16 24,312 16,608 7,702 207 562 386
Biogas 10+13 16,778 - - - - -
Difference (kg/d) -2,763 11,982 655 -22 -64 159
Difference (%) 7% 42% 8% 11% 13% 29%

Final Report Page 50 of 172
Table 10. Water Quality Limits for Groundwater as established by the California Regional Water Quality Control Board (CRWQCB) in Order No. R5-2008-0100, issued June 12, 2008.
Constituent Limit Nitrate-nitrogen 10 mg/L Chloride 250 mg/L Boron 1.0 mg/L Total Dissolved Solids 500 mg/L Electrical Conductivity 900 μmhos/cm Total coliform (E. coli or fecal coliform) 2.2 MPN/100 mL Taste and odor-producing constituents, toxic substances Not specified

Appendix A Page 51 of 172
Appendix A
Fiscalini Farms Biomass Energy Project Economic Sustainability Analysis
Task 5 Report
William Stringfellow1 Mary Kay Camarillo2
Jeremy Hanlon1
Justin Graham1
Chelsea Spier1
Michael Jue1
July 19, 2011
1Ecological Engineering Research Program 2School of Engineering & Computer Science
3601 Pacific Avenue John T. Chambers Technology Center
University of the Pacific Stockton, CA 95211

Appendix A Page 52 of 172
Executive Summary
The U.S. EPA estimates that there is potential for 863 MW of biogas-derived electricity
generation from 2,645 candidate dairy farms in the U.S, providing the potential benefits of odor
control, water quality protection, greenhouse gas reduction, energy use and sales, valuable by-
products, and energy credits. There are over 1,800 dairies and 1.8 million dairy cows in
California and it is estimated that dairy farms in California have the potential to produce 271
MW of energy per year, or 31% of projected potential U.S. production. Although the number of
biomass energy projects located on dairy farms in the U.S. is increasing, the economic
sustainability of dairy located biomass energy plants is uncertain, particularly in California
where environmental regulations are stringent and impacting development.
Few in-depth economic analyses have been performed that include an evaluation of
concurrently collected engineering performance and economic data for full-scale, privately
owned biomass power plants. This report represents the first publication to examine the
economic sustainability of a fully-operational biomass energy system utilizing a complete-mix
anaerobic digestion system located at a dairy in California. In 2008, Fiscalini Farms in Modesto,
CA installed an anaerobic digester with a nominal capacity of 1.9 million gallons and a
combined heat and power (CHP) electrical generation plant capable of a sustained output of 710
kW. The Fiscalini Farms dairy currently has approximately 1,500 head of cattle and uses a
flush-lane manure collection system. The Fiscalini Farms biomass energy system is unique in
that it utilizes a complete-mix reactor design and a combined heat and power (CHP) electrical
generation system that is equipped with a selective catalytic reducer (SCR) for air pollution
control. We evaluated the engineering performance of this operational biomass energy plant and
placed the results of that evaluation in the context of a standard economic sustainability analysis.

Appendix A Page 53 of 172
We then interpreted those results in the broader context of the biomass energy future of
California.
U.S. EPA protocols for performing economic evaluations of biomass energy projects
were used in this investigation. In addition, approaches used in previous studies were followed
to allow comparison of results between this and previous studies. The Fiscalini Farms biomass
energy project lifecycle was evaluated using three metrics: 1) net present value (NPV); 2) simple
payback period (SPP); and 3) internal rate of return (IRR). NPV is the sum of all project costs
and revenues over the life of the project, which are calculated using a discount rate to convert
costs and revenues throughout the life of the project into current or initial dollar values. Projects
with a positive NPV indicate those with positive cash flows, while projects with negative NPV
are those where the costs are higher than the generated revenues. SPP is the amount of time
needed to recoup an initial investment and start generating net positive cash flow. Projects with a
calculated SPP greater than the expected lifespan of the project are unlikely to be economically
sustainable. The IRR is the discount rate that yields a NPV of zero, and is a metric used by
investors to identify economically favorable investments. In this study, we assumed a life-span
of 20 years and a real discount rate of 4% to allow comparison with previous studies. Economic
sustainability was defined as analysis that yielded a positive NPV, an SPP less than 20 years, and
a positive IRR. Economic sustainability, as defined in this report, is not a guarantee of
profitability.
The analysis in this report includes a combination of technical and economic factors. The
technical assessment consists of an evaluation of digester and power plant operations. The
operating conditions investigated are a function of dairy practices, feedstocks used, methane-
generating potential of the feedstocks, equipment used for power generation, existing local

Appendix A Page 54 of 172
conditions, and other factors. The technical assessment was used to place the economic analysis
in the context of existing conditions and constraints, including regulatory conditions. In
particular, the current operating conditions were examined relative to the capacity of the CHP
system and anaerobic digesters.
To determine the economic sustainability of this project, the capital costs as well as the
periodic operations and maintenance (O&M) costs were established. The capital cost includes
the cost of equipment, construction, engineering, permitting, and other costs associated with
installing and implementing the biomass energy system. The O&M costs include costs of
operating the system, maintaining equipment, record-keeping, and ordering supplies. The
operational cost for the CHP generator includes overhauling the engine and replacing the SCR
catalyst. The calculated capital cost of the project was $4,020,000 and the calculated annual
O&M cost was $154,800. Overall, the annual O&M costs were estimated to be 3.9% of the
capital costs. In contrast, in previous studies O&M costs were estimated to be approximately 5%
of the capital costs.
Parallel use of technical and economic data allowed for generalization of the data set so
that the performance and cost data could be compared with data from other facilities. The
overall objectives of this economic analysis were to: 1) document the facility’s record of
methane production, power generation, waste heat use, and digestate solids production based on
the feedstocks added and design constraints, 2) document capital and O&M costs based on
available records and experience of sustained operation, 3) document revenues and cost saving
experienced as a result of operating the facility, including the benefit of grants received, 4)
determine the economic sustainability of the system as currently operated, and 5) evaluate the
effects of the following parameters on economic sustainability: operational performance relative

Appendix A Page 55 of 172
to capacity; extent of waste heat utilization; use of emissions control technology; the availability
of State and Federal grants; financing and debt service; wholesale electricity rates; alternative
anaerobic digester technologies; use of digester by-products; and greenhouse gas credits.
The baseline case for this economic analysis was established as a continuation of current
operations with no changes or improvements. This analysis assumed the current operational
condition of 57% of power plant capacity and an avoidance of 30% of propane usage by the
utilization of waste heat from the CHP. The outcome of this analysis is that the NPV is positive
($1,114,638), the SPP is less than the expected lifespan of the digester (12.1 years), and the IRR
projects a positive, though modest, rate of return (8.6%). This analysis indicates that current
operation of the power plant can be sustainable, even though it is being operated below effective
capacity.
Although the Fiscalini Farms biomass energy plant appears to be economically
sustainable under current operations, the potential of the plant is not being realized. The
engineering analysis clearly shows that electrical production is limited by the amount of biogas
(methane) produced by the digesters and delivered to the CHP plant. Currently the digester
system is only producing enough biogas to allow the CHP to operate at an average of 406 kW.
In this analysis, we tested the economic viability of the power plant assuming that the digester
operations were changed to increase biogas production and that the CHP would be operated at
the effective operational capacity of 710 kW. Under this “effective capacity” scenario, the NPV
is over $5 million, the SPP is less than 6 years, well below the expected 20 year useful life of the
digesters, and the IRR is 21.7%. This outcome is a significant improvement over the “current
operations” scenario and the result suggests that the Fiscalini Farms digester operations should

Appendix A Page 56 of 172
be improved to the extent that the power plant will be supplied with sufficient gas to operate at
full capacity.
The importation of co-digestates to the dairy will be required to reach design methane
production rates. The importation of off-site food and agricultural wastes for co-digestion is
being evaluated by Fiscalini Farms; technical and significant regulatory barriers to
implementation of an off-site waste utilization program are being addressed. However, an
engineering analysis suggests that better utilization of on-site biomass could enhance methane
production in the interim period, before a waste co-digestion program is initiated. Among other
alternatives suggested for improving digester operations and biogas production, it was identified
that the digester has the capacity to receive an additional 24,400 to 40,500 gallons per day (gal/d)
of flush-water. The current hydraulic residence time (HRT) is 48.1 days, which is much higher
than the design range of 24-30 days. Increasing the feed rate of the flush-water to achieve the
design HRT could result in an additional loading of between 1,800 to 3,000 lb of volatile solids
(VS) per day. Assuming that the current performance of the anaerobic digesters can be
maintained at a 42% reduction in VS and a methane yield of 11.9 ft3 methane per lb VS digested,
methane production could increase approximately 10% which could lead to additional revenues
of up to $40,000 per year.
Propane avoidance was identified as a significant revenue stream for the biomass energy
plant. Current use of heat from the CHP unit has resulted in a decrease in propane consumption
by approximately 30%. Based on projections made by Fiscalini Farms, it appears that sufficient
waste heat is generated by the CHP system to effectively eliminate most propane use on-site. If
propane avoidance can be increased to 90%, NPV can be increased to approximately $2 million,
SPP decreased to 9.2 years, and the IRR rises to 11.8%. The effect of propane avoidance is

Appendix A Page 57 of 172
significant and obviously beneficial: for every 10,000 gallons of propane avoided the NPV
increased by approximately $230,000 over the 20-year lifespan of the project.
California has some of the most strict air pollution control regulation in the US; Fiscalini
Farms was required by the San Joaquin Valley Air Pollution Control District (SJVAPCD) to
install a SCR for control of NOx emissions as a condition of operation. This is the first
installation of this technology at a lean burn exclusive dairy biogas biomass power plant in
California. The impact of compliance with California pollution regulations was examined by
conducting an analysis of the current conditions and the effective capacity conditions without the
construction and operation of the SCR. Previous studies of the economic and technical
performance of biomass energy systems located at dairies have not conducted a comparable
evaluation of pollution control costs. With elimination of the SCR system under the current
operating condition, the NPV is improved by approximately 25%, the SPP is marginally reduced,
and the IRR improves over 1%. However, if the facility were operating at effective capacity and
did not have an SCR, it would experience only a 7% improvement in NPV, a minimal
improvement in SPP, and a slightly higher than 2% improvement in IRR. The results indicate
that, since pollution control technology costs are fixed, the marginal impact of the pollution
control device is a function of the power plant operational efficiency.
Fiscalini Farms received approximately $2 million in government grants to support
development of the biomass energy plant. Economic analysis demonstrated that under current
operational conditions, the project would not be sustainable in the absence of government
support (the NPV of the project is negative, the SPP exceeds the 20 year lifespan of the project,
and the IRR is marginal). The importance of grants can also be shown even if the power plant
was operating at capacity: without the grants included as revenue, the SPP is increased by

Appendix A Page 58 of 172
approximately 60% and the NPV is reduced over 30%, however the biomass energy plant would
still be sustainable. These results suggest that government support is critical for the development
of biomass energy projects, especially as the technology is being developed and operations are in
start-up periods.
The standardized economic sustainability analysis is an important tool for evaluating
potential government and private investment in biomass energy power plants, however the
standard analysis does not take into account the reality that most dairymen will need to borrow
money to develop dairy-based facilities. If the Fiscalini Farms biomass energy plant is replicated
at other dairies using borrowed money, the economic sustainability will be dependent on the
ability of the plant to produce revenue streams that exceed the debt burden and other operational
costs. An examination of the outcome for the use of borrowed money under the current
operational conditions would be negative, as indicated by a negative NPV. (The values for SPP
and IRR have limited meaning in this context). In the case of operation at the effective capacity
of 710 kW, and assuming a wholesale electrical price of $0.1095, the revenue stream would be
sufficient to service debt and the NPV would be strongly positive (>$3 million). This again
emphasizes the importance of operating digesters at a biogas production potential sufficient to
achieve effective electrical production capacity.
The influence of wholesale electricity price on NPV was investigated under current
operations (406 kW), operation at the effective capacity (710 kW), and operation with and
without grant support. The results suggest that the division between sustainable and
unsustainable projects occurs at wholesale prices between $0.06 and $0.13/kWh. At lower
electricity prices it is more critical to operate the system close to capacity and the contribution of
State and Federal grants is more critical for economic sustainability.

Appendix A Page 59 of 172
The results of this study suggest that power plant costs are fixed and that, in order to
maximize economic sustainability, a complete analysis of alterative digester designs and
associated cost should be considered as part of planning any dairy-located biomass energy
facility. A complete-mix reactor design was chosen for the Fiscalini Farms project after
consideration of alternative designs. A similar investigation of alternative digester designs should
be considered for each future operation. Using less expensive digester technology could provide
an economic advantage, assuming that alternative digester designs would provide equivalent
methane production. However, in California, use of lower technology systems (e.g., covered
lagoons) may be cost-prohibitive because strict environmental policies are causing developers to
construct these systems covering a large land area to have extensive liner systems to prevent
degradation of groundwater quality. In addition, monitoring systems must be installed and
maintained (sampled) to verify liner performance. In addition to concerns over environmental
compliance, the ability to co-digestate products other than dairy manure may influence
technology choices.
Finally, additional revenue streams that could enhance the economic sustainability of the
biomass energy system were examined. The slurry produced in the anaerobic digesters contains
stabilized solids that are suitable for cattle bedding and have value as a soil amendment. The
stabilized solids from the digester represent a potential revenue stream of up to $128,000 per
year. Greenhouse gases released as a result of agricultural and energy-related activities are
significant. The value of the diversion of flushed manure to the digester, rather than to the open
lagoon, could be between $5,460 to over $163,000 per year in carbon credits on the open market.
A complete greenhouse gas audit for the biomass energy power plant is recommended to
maximize potential revenue from this source.

Appendix A Page 60 of 172
In summary, dairy-based biomass energy plants appear economically sustainable in
California, provided a number of conditions are met. Plants need to be operated at effective
design capacity, which will require the importation of co-digestates for larger plants. The
regulatory and technical hurdles to implementing a co-digestate program need to be resolved.
Utilization of waste heat and the associated avoidance of propane purchases represent a
significant benefit for the use of CHP systems and should be fully exploited. Air pollution
control is a significant cost, but has a lower marginal impact when plants are operating at
capacity. Wholesale electrical prices are obviously critical for economic sustainability and
analysis suggests prices well above $0.06 per kWh are required for economic sustainability, even
with direct government subsidies for construction and operation of biomass energy plants. The
availability of grants and financing will have a significant impact on the economic sustainability
of biomass energy in California and elsewhere. Finally, additional revenue streams, including
sale of greenhouse gas credits and digester solids, should be developed to increase the economic
diversity and sustainability of biomass energy power production.

Appendix A Page 61 of 172
Introduction and Background
The U.S. EPA estimates that there is potential for 863 MW of biogas-derived electricity
generation from 2,645 candidate dairy farms in the U.S, providing the additional potential
benefits of odor control, water quality protection, greenhouse gas reduction, energy use and
sales, valuable by-products, and energy credits (U.S. EPA, 2010). Given that there were over
1,800 dairies and 1.8 million dairy cows in California in 2009 producing 20.9% of the nation’s
milk and resulting in $4.54 billion in sales of milk and cream (California Department of Food
and Agriculture, 2011), it is no surprise that dairy farms in California have the potential to
produce 31% of the nation’s total dairy-based biogas, reducing methane emissions by 341,000
tons/yr and producing 271 MW of energy on 889 candidate farms (U.S. EPA, 2010).
In April 2011, the U.S. EPA estimated that there were 167 anaerobic digestion systems
being used at livestock farms in the U.S. and that 146 of these produce electricity or thermal
energy (U.S. EPA, 2011). The U.S. EPA database for anaerobic digestion does not include
complete information on the production and use of electricity, such as whether electricity is sold
wholesale to a power company, exclusively used on-site, or is managed as part of a net-metering
agreement, however, off-site sales of electricity from dairy-based biomass energy systems appear
common. In a study of biomass energy systems located on dairies in New York, 12 of the 14
operational systems sold electricity to the local utility. Although the number of biomass energy
projects located on dairy farms in the U.S. is increasing, the economic sustainability of dairy
located biomass energy plants is uncertain and further investigation of fully-operational systems
is needed, particularly in California where the environmental regulations are stringent and strict
(Anders, 2007, Kramer, 2004, Lusk, 1998, Scott, et al., 2010).

Appendix A Page 62 of 172
In 2008, Fiscalini Farms in Modesto, CA installed an anaerobic digester system with a
capacity of 1.9 million gallons and a combined heat and power (CHP) electrical generation plant
capable of a nominal output of 710 kW. Fiscalini Farms has approximately 1,500 cows and
calves on-site, including 1,200 milking cows. Like many dairies in California, Fiscalini Farms
uses a flush-water system to collect manure from the free stall barns. The Fiscalini Farms’
biomass energy system differs from other dairy installations in that it incorporates emissions
control technology and relies on a dual above-ground tank complete-mix reactor design to
generate methane from flush-wastewater and a variety of co-digestate feedstocks, including
whey produced by the associated cheese production facility. Other co-digestates fed to the
digester in addition to dairy manure include sudan grass, refused feed, and waste silage. The
CHP plant uses an internal combustion engine designed for the combustion of biogas to produce
electricity and waste heat that is utilized on the dairy via a heat exchanger and radiator
infrastructure. The internal combustion engine is operated on a “lean burn” setting, in which the
air-to-fuel ratio is high relative to normal operation. (See the Methods section for a complete
description of the facility).
Despite the growing presence of biomass energy projects in the U.S., few in-depth
economic analyses have been performed that include an evaluation of concurrently collected
performance and cost data (Bishop and Shumway, 2009, Frear, et al., 2010, Martin, 2004,
Martin, 2005, Martin, 2008, Nelson and Lamb, 2002). Historically, biomass energy projects
have often not been sustainable. In a study of 74 anaerobic digestion projects that had been
constructed at livestock facilities, Lusk (1998) found that only 28 of these systems were still in
operation; of the remaining facilities, 17 were located on farms that had closed and 29 were
projects that had been abandoned for a variety of reasons. Discontinued operation appeared

Appendix A Page 63 of 172
correlated with digester complexity, as was related to design problems, leaking covers, excessive
maintenance, accumulation of grit in reactors, corrosion, and other problems (Lusk, 1998).
Challenges faced by managers of biomass energy projects include unfavorable pricing structures
for the sale of electricity and environmental policies that are difficult to negotiate (Anders,
2007).
U.S. EPA protocols for performing economic evaluations of biomass energy projects
were used in this investigation (Eastern Research Group, 2011). In addition, methods developed
in previous studies were followed to allow comparison of results between this and previous
studies (Bishop and Shumway, 2009, Lazarus and Rudstrom, 2007, Lusk, 1991, Martin, 2004,
Martin, 2005, Martin, 2008). The Fiscalini Farms biomass energy project lifecycle was
evaluated using three metrics: 1) net present value (NPV); 2) simple payback period (SPP); and
3) internal rate of return (IRR) (Eastern Research Group, 2011, Lusk, 1998). NPV is the sum of
all project costs and revenues over the life of the project, which are calculated using a discount
rate to convert costs and revenues throughout the life of the project into current or initial dollar
values. Projects with a positive NPV indicate those with positive cash flows while projects with
negative NPV are those where the costs are higher than the revenues. Projects with NPV
equivalent to zero represent projects where the costs are equivalent to the cash flows generated.
A positive NPV is not a guarantee of profitability, but a project with a positive NVP is more
likely to be sustainable. SPP is the amount of time needed to recoup an initial investment and
start generating net positive cash flow. Projects with a calculated SPP greater than the expected
lifespan of the project are unlikely to be economically sustainable. The IRR is the discount rate
that yields a NPV of zero, and is a metric used by investors to identify economically favorable
investments (Eastern Research Group, 2011, Lusk, 1998).

Appendix A Page 64 of 172
The combination of NPV, SPP, and IRR is typically used for an economic sustainability
assessment, because each of these metrics gives incomplete information if presented alone.
Using NPV as an economic indicator leads to a bias for large projects with high capital costs.
Larger project have the potential to generate a higher NPV; however, a higher NPV does not
ensure a higher rate of return for investors. A disadvantage of using SPP is that it does not
account for revenue following the payback period or the lifespan of a project relative to the
payback period, both of which are important for considering project viability. A shortcoming of
the IRR is that its use is based on the assumption that all positive cash flows are reinvested with
a yield equal to the IRR, which is unrealistic for projects that are expected to produce cash flow
or projects with high calculated IRR values (Lusk, 1998). Despite their limitations, NVP, SPP,
and IRR are widely used and accepted indicators of economic sustainability and allow
comparison between disparate projects and investments (Bishop and Shumway, 2009, Eastern
Research Group, 2011, Sullivan, et al., 2011).
To perform an economic evaluation of a biomass energy system a number of factors must
be established or assumed, including the project life-span, the real discount rate, and tax rates.
For life-span, some investigators used conservative values of 10 years, while others use a
perhaps more realistic life-span of 15 or 20 years (Garrison and Richard, 2005, Giesy, et al.,
2005, Lazarus and Rudstrom, 2007). For example, Lusk (1991) used a life-span of 20 years for a
complete-mix anaerobic digester and 15 years for an earthen lagoon anaerobic digester. In some
cases, equipment can have a life-span that is shorter than the lifespan of the project and will
require periodic replacement. Lazarus (2009) assumed that the power plant engine would require
a major overhaul every 3-5 years. A variety of approaches are also taken for estimating the
project value at the end of the lifespan. While some evaluators assume no salvage value at the

Appendix A Page 65 of 172
end of the project life (Giesy, et al., 2005, Lazarus and Rudstrom, 2007), others make an
assumption such as a salvage value equivalent to 10% of the capital cost (Wright, et al., 2004).
In this study, we assumed a life-span of 20 years for the anaerobic digesters, based on experience
with municipal treatment facilities (Quick, 1997), assigned appropriate life-spans for various
mechanical components (see below), and did not include any salvage value at the end of the
project life-span.
Other critical parameters include the discount rate and the tax rate. Variable values have
been used for the discount rate, including 5% (Wright, et al., 2004), 7% (Lusk, 1991), 8%
(Giesy, et al., 2005), and 9% (Garrison and Richard, 2005). Garrison and Richard (2005) used
straight-line depreciation, a marginal tax rate of 20%, and a general inflation rate of 5%.
Rapport et al. (2011) used a variety of discount rates and included state and federal taxes in their
development of a theoretical economic model. In this study, we used a real discount rate of 4%,
which is consistent with values used in previous studies and with guidelines published by the
Office of Management and Budget (Lusk, 1991, Martin, 2004, Martin, 2005, Martin, 2008,
Martin and Roos, 2007, Office of Management and Budget, 2010). We did not include any
calculation of State or Federal tax burden, which is beyond the scope of this study.
The analysis in this report includes a combination of technical and economic factors. The
technical assessment consisted of an evaluation of digester and power plant operations. The
operating conditions investigated are a function of dairy practices, feedstocks used, methane-
generating potential of the feedstocks, equipment used for power generation, existing local
conditions, and other factors. The technical assessment was used to place the economic analysis
in the context of existing conditions and constraints, including economic and regulatory
conditions. In particular, the current operating conditions were examined relative to the capacity

Appendix A Page 66 of 172
of the CHP system and anaerobic digesters. To determine the economic sustainability of this
project, the capital costs as well as the periodic operations and maintenance (O&M) costs were
established. The O&M costs include costs of operating the system, maintaining equipment,
record-keeping, and ordering supplies.
Potential revenues and cost savings from the operation of biomass energy projects
include sale of electricity onto the grid, on-site use of electricity, off-site sale of digestate,
avoided bedding costs from use of digestate, avoided propane costs from use of waste heat,
tipping fees from acceptance of off-site feedstocks, carbon credits, and tax incentives. Revenues
from electricity sales and cost savings from propane avoidance were considered in this analysis.
Avoided bedding costs were not included in this analysis because on-site compost was
previously used by Fiscalini Farms as a bedding material. Other revenue streams (e.g. digestate
sales, carbon credits) could be incorporated if appropriate markets could be located and prices
confirmed. The cost analysis was based on a standard engineering economic analysis
incorporating capital, maintenance, and operating costs (Eastern Research Group, 2011, Lusk,
1998, Sullivan, et al., 2011). Parallel use of technical and economic data allowed for
generalization of the data set so that the performance and cost data could be compared with data
from other facilities.
The overall objectives of this economic analysis were to: 1) document the facility’s
record of methane production, power generation, waste heat use, and digestate production based
on the feedstocks added and design constraints, 2) document capital and O&M costs based on
available records and experience of sustained operation, 3) document revenues and cost saving
experienced as a result of operating the facility, including the benefit of grants received, 4)
determine the economic sustainability of the system as currently operated, and 5) evaluate the

Appendix A Page 67 of 172
effects of the following parameters on economic sustainability: operational performance relative
to capacity; extent of waste heat utilization; use of emissions control technology; the availability
of State and Federal grants; financing and debt service; wholesale electricity rates; alternative
anaerobic digester technologies; use of digester by-products; and greenhouse gas credits.

Appendix A Page 68 of 172
Methods
Site and Facility Description Fiscalini Farms is located in Stanislaus County at 4848 Jackson Road in Modesto, CA
and has been in operation as a dairy since 1912. The facility also includes a cheese factory that
has been in operation since 2000. There are approximately 1,200 milking cows and 300 dry cows
maintained at the facility. The dairy has the capacity for up to 3,000 cows. Dairy operations and
the cheese factory occupy approximately 38 acres, and there are an additional 480 acres, divided
into six fields, which are used for crop production. The entire 480 acres is triple cropped with
corn, winter wheat forage, and sudan grass. The dairy facilities include a milking parlor (the
dairy barn), wash pens, three free stall barns, feed lanes, open corrals, a heifer holding facility,
two slope screen solid separators, and two wastewater storage lagoons. Manure from the dairy
barns is removed using a recycled flush-water system. The cows spend approximately 85% of
their time in concrete lanes, which are approximately 8 foot wide. As a result, much of the
manure is present in these concrete lanes and these are flushed six times per day. Approximately
1.2 million gal/d is flushed through the barn; the flush-water consists of 1 million gal/d of
recycled flush-water from the storage lagoon and approximately 200,000 gal/d of new water
added daily as a result of washing down the dairy barn. The cheese factory generates
approximately 4,000 gal/d of whey wastewater; this waste stream is discharged into the flush-
water collection system.
Fiscalini Farms uses anaerobic digesters to generate methane from organic waste streams
that are generated on-site, including: manure, cheese whey (discharged to the flush-water
system), waste silage (feed that is not appropriate for the cattle or that was rejected), and plant
biomass (sudan grass grown on-site). Initially sudan grass was grown on-site as a groundwater
nitrogen management tool, and it has proven to be extremely beneficial as a feedstock to the

Appendix A Page 69 of 172
anaerobic digester to improve biogas production. The anaerobic digestion process is a biological
system that relies on microorganisms to metabolize the organic materials in the absence of
oxygen and produce biogas with a high methane content. The anaerobic digesters are designed to
be operated within the mesophilic range of approximately 85-100 °F, a range frequently used in
anaerobic digesters treating domestic waste operate (Tchobanoglous, et al., 2003). A description
of the anaerobic digesters is included in Table 1.
The Fiscalini Farms biomass energy system consists of two anaerobic digesters and a
combined heat and power (CHP) system that uses an internal combustion engine and generator to
produce electricity (Table 1). The anaerobic digesters and associated equipment were provided
by Biogas Energy, Inc. (Kensington, CA), a company that has been installing biomass energy
systems since 1998 worldwide. The complete-mix anaerobic digesters contain an intermittently
operated recirculation mixing system that was designed to accommodate multiple feedstocks.
There are two above ground concrete anaerobic digester tanks, each having a diameter of 82-feet
and a height of 24-feet, with a capacity of approximately 850,000 gal per tank. The anaerobic
digesters are kept at a mesophilic temperature of approximately 100 °F using a system of hot
water pipes embedded in the 14-inch thick digester walls. The roofing system on the anaerobic
digester tanks consists of a double membrane roof; an inner membrane that serves as gas storage
and an outer membrane that protects against the weather and is pressurized using an air
compressor. This type of roofing system provides flexibility in the operation of the CHP system;
a limited amount (approximately 10 hrs.) of biogas can accumulate in the digesters (e.g., when
the CHP system is out of service for maintenance) instead of being flared, thus wasting the
biogas.

Appendix A Page 70 of 172
The CHP system was manufactured by Guascor (St. Rose, LA), a company with 601
systems and a combined capacity of 784 MW worldwide. The CHP system consists of a 1057
BHP internal combustion engine with a rated capacity of 750 kW using natural gas and 710 kWh
using biogas and operates with a continuous, synchronous generator (Guascor Model SFGLD
560). The CHP engine was designed by the manufacturer to operate using natural gas. Martin
Machinery (Latham, MO) completed the conversations necessary to allow the engine to operate
properly using the biogas. As designed, this engine is operated in a “lean burn” condition that
minimizes the quantity of fuel (e.g. biogas) added during combustion, thus improving the engine
efficiency while minimizing the nitrous oxide (NOx) output in the exhaust. Biogas from the
anaerobic digesters is conveyed to the CHP system via a 1,700-foot buried gas pipeline. Excess
biogas that is not used in the CHP unit (e.g., because the unit is out of service for maintenance)
and cannot be stored in the digester tanks is diverted to an open flare where it is burned prior to
emission (Muche Kläranlagenbau GmbH, Lemgo, Germany). Quantities of biogas used by the
CHP for electricity production and biogas flared are both measured using velocity meters to
measure biogas volume (Proline Prowirl 72, Endress + Hauser, Inc., Greenwood, IN).
Biogas is primarily composed of methane and carbon dioxide (e.g., (Martin, 2004)),
although there are other gases present such as ammonia (NH3) and hydrogen sulfide (H2S).
Hydrogen sulfide is undesirable in biogas because it converts to sulfuric acid, which is very
corrosive and detrimental to engines and other mechanical systems. Additionally, hydrogen
sulfide contributes to the production of sulfur oxides (SOx) in CHP emissions. There are
ambient air quality standards in California for hydrogen sulfide, sulfate (SO42-), and sulfur
dioxide (SO2) (ARB, 2009). Hydrogen sulfide can be removed chemically or biologically (Syed,
et al., 2006). A biological treatment system, manufactured by Biogas Energy, Inc. (Kensington,

Appendix A Page 71 of 172
CA), is used to reduce the presence of H2S in the biogas at Fiscalini Farms. The biological
treatment method consists of netting located in the biogas headspace of the anaerobic digesters,
and is intended to support a microbiological community that oxidizes sulfide (S2-), originating
from H2S, to elemental sulfur (S). Small amounts of ambient air are injected into the headspace
to accommodate growth of the appropriate bacteria on the netting. The Biogas Energy, Inc.
biological H2S removal system is intended to reduce H2S levels to approximately 250 ppm. In
contrast, hydrogen sulfide concentrations of 1930 ppm and 3100 ppm in biogas have been
reported for plug flow anaerobic digesters without hydrogen sulfide removal systems (Martin,
2004, Martin, 2005).
A compact selective catalytic reduction (SCR) emission control system manufactured by
Engine, Fuel and Emissions Engineering, Inc. (Rancho Cordova, CA) is used to control stack
emissions, primarily nitrogen oxides (NOx). Although not specifically listed as a greenhouse
gas, nitrogen oxides contribute to ground-level ozone formation and pollution due to particulate
matter, resulting in numerous health effects (U.S. EPA, 2011). Nitrogen oxides are therefore
undesirable and are regulated in stack emissions. The SCR catalyst functions by reacting the
NOx with ammonia (NH3), added in the form of urea [(NH2)2CO] (Forzatti, 2001). The reaction
results in conversion of NOx and NH3 to nitrogen gas (N2) and water (H2O). To prevent any
ammonia “slip” (leftover ammonia) from escaping, a narrow layer of finely-dispersed platinum
catalyst is placed at the end of the SCR modules to burn any remaining ammonia to nitrogen and
water. The SCR reactions require an exhaust temperature of at least 200 oC. The SCR is
equipped with monitors and ancillary equipment that adjusts the urea flow to match the rate of
NOx emissions from the engine.

Appendix A Page 72 of 172
The biomass energy system was integrated into the previously established dairy
operations (Figure 1). The flush-water from the free-stall barn is screened using a slope-screen
separator and then sent to the thickening vault (thickener), where the flush-water is further
clarified before return to the flush-water storage tanks at the head of each free-stall barn, where it
is reused for lane flushing. The slurry from the bottom of the thickener is pumped into the
anaerobic digester tanks via a computer-controlled pump. Screened manure solids, sudan grass
and waste silage are collected and fed into the anaerobic digesters via the solids feeder hopper
(Figure 1).
Effluent slurry from the anaerobic digesters is conveyed to a screwpress for solids
separation. The separated solids from the screwpress are used as a bedding material at the dairy
and the clarified effluent is sent to the storage lagoons (Figure 1). Water is added to the system
from dairy and cheese manufacturing facility. Excess flush-water is pumped from the return
vault to the storage lagoons using a sump. The two storage lagoons are in series and have a
combined storage volume of 41.8 million gal. The lagoons are used to stabilize the excess flush-
water before subsequent land application (following blending with irrigation water) on
surrounding fields that are used to grow the livestock feed and bioenergy crops. Assumptions
and criteria that were used to design the biomass energy system are shown in Table 1. It was
assumed the anaerobic digester feedstocks would consist of 40,000 gal/d of thickened solids
from the sedimentation basin, 20,000 lb/d of solids from the slope screen separator, and 60,000
lb/d of sudan grass. Based on the intended influent feedstock loadings, it was assumed the
anaerobic digester effluent would consist of 48,000 gal/d of slurry. The residence time in the
digesters was intended to be 24 to 30 days. The design was based on a facility that has 3,000
head of dairy cattle that produce 18.623 gal/head/day of manure.

Appendix A Page 73 of 172
Construction of the biomass energy system commenced in the fall of 2007 and was
complete in the spring of 2009. Following start-up of the facilities, sale of electricity commenced
in August 2009. A project to replace the mixers in Anaerobic Digester Tank 2 commenced in
February 2011. Construction of hot water pipes used to heat the dairy barns using waste heat
from the CHP unit is an on-going project.
Collection and Analysis of Solid, Liquid, and Gas Samples
Operational data collected from August 2009 to November 2010 for the biomass energy
system were used to perform this economic analysis. Prior to this time period the system was not
fully operational and start-up activities were still underway. Data from December 2010 were not
available as the result of a computer malfunction. In addition, starting in February 2011
Anaerobic Digester Tank 2 was taken out of service for an extended period for mixer
replacement and removal of accumulated solids. The originally installed mechanical mixing
equipment was replaced with a recirculation hydraulic system that mixes the digester contents
using pumps. The downtime necessary to replace the mixing equipment was not included in this
economic analysis because it is not part of the routine maintenance schedule.
Data collected included flows and mass loading rates, and constituents in the solid, liquid,
and gas process streams. Data collected daily included volume of thickened flush-water added to
the digesters, total weight of solids added (manure solids, sudan grass, and waste silage), digester
depth, digester temperature, total biogas volume, biogas content (CH4, O2, H2S), quantity of
biogas used for power production, quantity of biogas flared, and power production. Additionally,
weather data was collected from a nearby weather station in Modesto, CA. Weather data
consisted of rainfall, temperature, average wind speed, solar radiation, and soil temperature.
During site visits, grab samples were collected and analyzed for solid, water, and air constituents
including those that characterize the solid, organic, and mineral content of the samples.

Appendix A Page 74 of 172
Constituents analyzed in grab samples included total solids (TS), volatile solids (VS), mineral
solids (MS), and total dissolved solids (TDS). TS and VS were analyzed by SM 2540 B and E,
respectively (APHA, 2005). TDS were analyzed by SM 2540 C and E (APHA, 2005). VS
concentrations were calculated by subtracting MS from TS. Site visits were made monthly from
July 2009 to July 2010. For this analysis, the digester feedstock solids data, biogas data, and
power production data were analyzed. Other water quality, operational, and biological data were
collected, but were not used in this analysis, but will be included in another section of the full
final report for this overall project.
Measurement and Calculation of Flows and Mass Loadings
Critical flows and loadings for the biomass energy system were measured during the
observation period. The digester influent slurry flow rate from the sedimentation basin was
measured using a flow meter. The total mass of solids was measured using a scale connected to
the feed hopper (FC20, PTM S.R.L., Visano, Italy). The relative contributions of manure solids,
feed residue, and sudan grass silage were determined from records kept by Fiscalini Farms.
Values of 50%, 46%, and 4% are assigned to the contributions from manure solids, silage, and
feed residue, respectively. The digester effluent flowrate and thickened digestate mass were
calculated using a mass balance approach. The mass of the anaerobic digester effluent was
calculated by subtracting the biogas mass from the mass of the anaerobic digester inputs. The
anaerobic digester effluent flowrate was then calculated using the measured density. The volume
of liquid from the screwpress thickener and the weight of thickened solids were both calculated
using separate mass balances on the total wet mass and on the mass of dry total solids (TS). To
calculate the hydraulic retention time (HRT) in the anaerobic digesters, the average of the
influent and effluent flowrates was divided by the average operating volume.

Appendix A Page 75 of 172
The biogas volume was measured continuously using an in-line velocity meter, and the
biogas weight was calculated by assigning values to the biogas temperature and pressure. The
biogas temperature in the anaerobic digesters was assumed to be equivalent to the temperature of
the anaerobic digester contents (approximately 100 °F). However, it was assumed that the biogas
temperature was lowered as a result of conveyance in an underground gas pipeline that extends
1,700 feet from the anaerobic digesters to the CHP system. Since the biogas temperature was not
continuously monitored, it was assumed that the biogas temperature at the CHP unit was
equivalent to the soil temperature. Based on measurements taken during site visits, the biogas
pressure was assigned a value of 80 mBar. The biogas was monitored continuously for CH4, O2,
and H2S content on a volume basis. It was assumed that CO2 occupies the remaining portion of
the biogas volume.
Economic Data Collection and Analysis
Capital costs were determined from invoices for purchase and installation of all system
components, including the anaerobic digesters, CHP system, and ancillary facilities. The
invoices were collected by Fiscalini Farms and made available to University of the Pacific
Ecological Engineering staff. Care was taken to separate costs for the biomass energy system
from those for the dairy and cheese operations. Analysis of the invoices allowed for separation of
capital costs from operation and maintenance costs. Labor costs for operations and maintenance
were calculated based on information from Fiscalini Farms’ managers, which included man-
hours spent on individual tasks and hourly rates. A multiplier of 1.20 was used on labor rates to
account for the costs of insurance and benefits. Records of wholesale electricity sales, retail
purchase of electricity, and propane purchases are maintained by Fiscalini Farms and were made
available for this analysis. Information on the costs of engineering and permitting as well as the

Appendix A Page 76 of 172
grants received was provided by B&N Enterprises, a contractor to Fiscalini Farms who oversaw
development of the biomass energy project.
The economic assessment was performed in accordance with established guidelines and
recommendations for biomass energy projects (Eastern Research Group, 2011, Lusk, 1998),
following a standard engineering approach (Sullivan, et al., 2011). All calculations were
performed using Microsoft Excel (Redmond, WA). The economic metrics NPV, SPP, and IRR
were calculated as part of this analysis (see below). To calculate the NPV, the present value of
all project costs and revenues, a real discount rate (i) of 4% and a time period (t) of 20 years was
used. The 20 year time period reflects the expected lifespan of the facility. Capital costs (P)
represent the costs of constructing and initiating operation of the facility and cash flows (CF)
represent the annual revenue minus the O&M costs.
NPV CF1 1∗ 1
To calculate SPP, the time period that occurs when the sum of the capital cost (P) and the
annualized CF equal zero, a real discount rate (i) of 4% was used.
CF1 1∗ 1
0
To calculate IRR, the discount rate that occurs when the NPV is 0, a time period of 20
years was used.
CF1 IRR 1
IRR ∗ 1 IRR0

Appendix A Page 77 of 172
Results and Discussion
The Fiscalini Farms’ biomass energy system differs from previous installations in that it
is larger than many existing systems, it relies on a complete-mix reactor for the fermentation of
methane, it is located on a dairy using a flush manure collection system, and methane production
is fueled by co-digestates, including sudan grass, cheese whey, and waste silage, in addition to
the dairy manure. Although the biomass energy system includes many benefits, the capital cost
was significant and there are on-going operation and maintenance costs. This economic analysis
addresses the sustainability of this sophisticated system and the feasibility of implementing
similar systems at other dairies. This report examines the likely economic outcome, using NVP,
SPP, and IRR, for the current operation and also tests the outcome against a number of possible
alternatives. This study uses a standard engineering economic approach for calculation of
economic sustainability, which allows comparison with previous studies (Bishop and Shumway,
2009, Lazarus and Rudstrom, 2007, Lusk, 1991, Martin, 2004, Martin, 2005, Martin, 2008).
Current Operation of the CHP Biomass Energy Plant
Digester Operations
The Fiscalini Farms’ digesters were designed to operate at mesophilic temperatures. The
average temperature in both anaerobic digesters was 101.4 °F, which is very close to the design
temperature of 100 °F, and the temperature was very stable (a standard deviation of 1.7 °F in
Anaerobic Digester Tank 1 and 2.7 °F in Anaerobic Digester Tank 2). The average depth in the
anaerobic digesters is 22-feet and 22.2-feet, respectively, indicating that the combined anaerobic
digester volume is 1.90 million gallons.
Three waste streams are fed into the anaerobic digesters: thickened slurry from the
sedimentation basin, a combination of sudan grass and waste silage (feed residue), and manure
screenings from the slope screen (Table 2). According to records obtained from August 2009 to

Appendix A Page 78 of 172
November 2010, an average of 30,800 gal/d of thickened input slurry was fed to the anaerobic
digesters from the sedimentation basin, 40,800 lb/d of sudan grass and waste silage was added,
and 40,600 lb/d of screened manure was discharged into the anaerobic digesters. Based on the
design hydraulic detention time (HRT) of 24-30 days, the allowable average flowrate in the
anaerobic digesters is between 63,000 and 79,000 gal/d. However, the estimated existing influent
flowrate to the anaerobic digesters is only 40,500 gal/d, based on a summation of the three
digester inputs. The existing effluent flowrate from the anaerobic digesters is 38,500 gal/d,
indicating that there is a 5% reduction in volume of digester feedstocks due to microbial
digestion and production of biogas.
Using daily data collected for the anaerobic digesters along with average values for total
solids (TS) and volatile solids (VS) data, it was possible to calculate the TS and VS that are
added to the anaerobic digesters (Table 2). Based on results from an automated online sampling
device, the input slurry from the sedimentation basin had an average TS content of 8%. On
average, loading of TS to the anaerobic digesters was estimated to be 20,500 lb/d from the
sedimentation basin; 10,600 lb/d of sudan grass and waste silage; and 7,200 lb/d of screened
manure. In term of VS, this represented 13,300 lb/d of VS from the sedimentation basin; 9,000
lb/d from sudan grass and silage; and 6,300 lb/d of screened manure VS. The overall mass
balance had an apparent error of 7.0 %, which is within acceptable limits for a reactor of this
size, and flush-water solids represented 68.5 % of the VS that were added to the anaerobic
digesters with the co-digestates accounting for the balance. Treatment in the anaerobic digesters
resulted in a 42.0% reduction in VS and the production of biogas.
Biogas and Electricity Production
Biogas and electricity production are reported alongside the technical operating data in
Table 3. During the 487 day observation period included in this study, a total of 106,340,952 ft3

Appendix A Page 79 of 172
of biogas were produced, or an average of 218,000 ft3/d. Of the biogas produced, only 2.9% was
sent to the flare and the remainder was used in the CHP system to generate electricity (Figure 2).
More gas was sent to the flare in 2009 than in 2010, when system operations became more
routine and the project was no longer in a start-up phase. On average, the biogas contained
64.8% methane. During the observation period 4,750,170 kWh of electricity was generated, or an
average of 9,754 kWh/d. In 2008, average residential electrical consumption in California was
587 kWh per month (U.S. Energy Information Agency, 2010), indicating that Fiscalini Farms
produced power equivalent to the demand for approximately 498 homes. The average electricity
production of 9,754 kWh/d, equivalent to 406 kW, is only 57% of the effective generator
capacity of 710 kW. On average, the biogas yield was 7.6 ft3 per pound of VS added, and 18.3 ft3
per pound of VS destroyed. Using the average methane content of the biogas (64.8%), methane
yield was 5.0 ft3 per pound of VS added and 11.9 ft3 per pound of VS digested. The average
electricity production was 44.7 kWh per 1000 ft3 of biogas used in combustion and 69.0 kWh per
1000 ft3 of methane used.
In Table 4, the performance of the Fiscalini Farms biomass energy systems is compared
with other dairy-based biomass energy systems (Bishop and Shumway, 2009, Frear, et al., 2010,
Martin, 2004, Martin, 2005, Martin, 2008, Nelson and Lamb, 2002). Although published case
studies exist for additional systems, the performance and economic data sets collected are not
extensive enough for a meaningful comparison with this study (Kramer, 2004, Lusk, 1998, Scott,
et al., 2010). The systems shown in Table 4 include a variety of geographical locations, reactor
types, manure collection systems, and digester designs. There were also differences in
feedstocks added at different facilities. Most of the systems are small (reactors smaller than
100,000 ft3), have generators less than 200 kW in size, and only digest dairy manure. Notable

Appendix A Page 80 of 172
exceptions include the Castelanelli Brothers’ system that has a large covered lagoon (2.5 million
gallons), the Vander Haak Dairy in Washington that has a modified plug-flow anaerobic digester
(0.14 million gallons), a 450 kW generator, and incorporates co-digestion into the operation, and
the system at the Cottonwood Dairy that uses a large covered lagoon (44.2 million gallons) and
700 kW of installed generator capacity. Volatile solids reduction in the anaerobic digesters
ranges from approximately 30% to 62%, indicating that the observed value of 42% at the
Fiscalini Farms is in the middle of this range. The methane content of the biogas in the Fiscalini
Farms system (64.8%) is also in the middle of the reported values (56-70%). The biogas and
methane yields for the Fiscalini Farms system are also within the range of values reported for
other systems. For example, the methane yield of 11.9 ft3/lb VS destroyed is within the reported
range of 9.4-12.3 ft3/lb VS destroyed. The electricity production of 69.0 kWh/1000 ft3 of
methane is also within the reported range of 56.3-78.2 kWh/1000 ft3 methane. These results
suggest that the Fiscalini Farms biomass energy system is performing in a similar manner to
systems that are using other technologies such as covered lagoons and plug flow reactors.
It is worth comparing the Fiscalini Farms system to the other system in California that
also practices flush-water or flush-lane manure collection. In the case of the Castelanelli
Brothers’ Farm system, the clarified liquid portion of the flush-water is treated and not the solids
portion as at the Fiscalini Farms system. In the case of the Castelanelli system, the generator is
under-sized so is running at capacity with the excess biogas being conveyed to the flare. As is
shown, the methane yield for the Castelanelli Brothers’ Farm system is low compared with the
other systems, but the efficiency of the generator (kWh per 1000 ft3 CH4) is better than the
performance of the other systems.
Capital Investment and Operation & Maintenance Costs
Capital Costs

Appendix A Page 81 of 172
The capital cost of the Fiscalini Farms project was $4,020,000 (Table 5). The capital cost
includes the cost of equipment, construction, engineering, permitting, and all other costs
associated with implementing the biomass energy system. Costs that were encountered during
the first year of operation as a result of deficiencies in the initial construction were also attributed
to the capital cost. The anaerobic digesters and associated ancillary equipment represent
approximately 71% of the total capital cost, whereas the CHP system accounted for only 19% of
the capital cost. The other categories are each less than 5% of the total capital cost. Costs
incurred to obtain environmental permits and building permits from the County represented 1.2%
of the capital cost (Table 5).
The anaerobic digester category includes all equipment needed for the anaerobic
digesters including pumps, tank insulation, hot water piping, flexible membrane covers, netting
and air injection for the hydrogen sulfide removal system, digestate piping, biogas piping,
electrical equipment, monitoring equipment, screwpress separator, silage feeder system, and the
biogas flare. The anaerobic digester category also includes the cost of the process control system
(e.g. software, hardware, and automation) and start-up assistance from the manufacturer.
Construction costs unrelated to equipment procurement for the project were valued at
$1.1 million and were apportioned between the anaerobic digester, CHP, and SCR categories in
Table 5, as appropriate. The construction cost includes the cost of earthwork, equipment
installation, concrete construction, and the mechanical and electrical infrastructure required to
operate the biomass energy system. Overall, construction costs represented 27% of the total
capital costs. The construction costs, including costs for the concrete digester tanks, represented
26% of costs assigned to the anaerobic digesters and 45% of the costs for the CHP system.
Installation of the SCR was approximately 3% of the total SCR cost category.

Appendix A Page 82 of 172
Operation & Maintenance Costs
Annual reoccurring costs were included in the O&M calculation, and was calculated
based on estimates provided by Fiscalini Farms’ managers (Tables E, F, and G). Overall, the
annual O&M costs were estimated to be 3.9% of the capital costs, which is lower than an
estimate used in a previous study where O&M costs were assumed to be 5% of the capital costs
(Bishop and Shumway, 2009). Daily work includes cleaning the silage feeder and screwpress
separator, requiring one employee 1.5 and 0.5 hours for each task, respectively (Table 6).
Weekly work includes cleaning the settling and recycled flush-water basins, this work requires
two employees and takes approximately 1.5 hours. Periodic equipment maintenance is required
to provide a functional system and includes work on the auger, motor, pumps, and biogas chiller.
On average, approximately 20 hours annually is required for maintenance on the auger, motor
and pumps and 20 hours is required for maintenance of the biogas chiller (Table 6). Fiscalini
Farms has encountered other cost due to the German manufacture of the complete-mixed
digester, including international service calls and complications arising from the German
language software, but these costs were not specifically included in this analysis.
The equipment used for operation of the digester system includes a Caterpillar front
wheel loader (CAT 962G), which is used daily for approximately 3 hours (Table 6). The front
loader is used to add silage into the feed hopper and to clean the settling and storage basins. A
diesel consumption of 3.2 gallons per hour was determined for the front loader using the Milton
CAT handbook. The annual cost for operating the front loader at this rate of fuel consumption is
$12,614, assuming a diesel cost of $3.60 per gallon.
The generator maintenance cost was calculated assuming that the generator would be in
continuous operation (Table 6). Maintenance includes oil changes that are performed every 500
hours and spark plugs that are replaced every 1,000 hours. Initially generator maintenance was

Appendix A Page 83 of 172
contracted to Escalon Portable Welding and took between three and five hours to complete at a
rate of $80.00 per hour. Now this work is now being performed in-house and takes two hours,
requiring two employees at a rate of $30.00 per hour. The SCR system requires approximately 9
gallons of urea per day, which is included with generator O&M cost in Table 7.
The long-term cost for the CHP generator includes repairing the engine and replacing the
SCR catalyst. When used with biogas, an engine typically must be overhauled every 10,000
hours; however, the low hydrogen sulfide levels in Fiscalini Farms biogas (resulting from the
hydrogen sulfide removal system) allow the engine to be overhauled every 15,000 hours. The
annual cost to repair the engine was estimated to be $25,000. The lifespan of the SRC is
unknown because this is the first installation of this system for a biogas system. A conservative
estimate of 3 years was used for the lifespan of the SCR catalyst with a replacement cost of
$40,000. Currently, Fiscalini Farms has contracted with Engine, Fuel and Emissions
Engineering, Inc. (EF&EE) of Rancho Cordova, CA to install, operate, and maintain the SCR
system. The costs associated with project-term maintenance are annualized in Table 5 with
O&M costs.
The addition of the digester system, which includes pumps, mixers, compressors, and
performance control equipment as described above, has increased electricity usage at Fiscalini
Farms. All electricity generated by Fiscilini Farms is sold to Modesto Irrigation District and is
not used directly on-site. In 2010 Fiscalini Farms started to designate their electricity use for
different parts of the facility including the cheese facility, calf barn, milking parlor and digester.
Electricity usage for the digester system was $25,000 in 2010, which was assumed to represent
the annual cost (Table 5).

Appendix A Page 84 of 172
In addition to routine maintenance, additional maintenance must be performed on a more
infrequent basis. For example, solids (e.g., sand) accumulate in the anaerobic digesters,
decreasing the effective volume and treatment capacity. Removal of accumulated solids requires
temporarily taking each tank out of service and using a front loader and a container to excavate
and lift out the accumulated solids. It is estimated that removal of accumulated solids in the
anaerobic digesters will need to take place approximately every two years.
Additional parts of the biomass energy system that require periodic replacement include
the mechanical equipment and flexible digester cover. The mechanical parts (feed auger, pumps,
engine, and screwpress separator) were assumed to require replacement every seven years and
the flexible digester covers were assumed to require replacement every 10 years. The anticipated
annualized cost for these repairs is shown in Table 5.
Description of Revenues
Electricity Production
The biomass energy plant operations are summarized in Table 3. From August 2009 thru
November 2010, the average electricity produced was 9,754 kWh per day. This represents an
average annual electricity production of 3,560,210 kWh generating $389,843 per year at the
current sale price of $0.1095 per kWh. The average electricity produced took into account the
down-time of the generator. During the time period the generator was not in operation for an
average of 3 days per month which totals 36 days per year. The down-time may include, but is
not limited to, routine maintenance on the CHP and emergency maintenance on the digester,
such as a mixing pump failure.
Propane Avoidance
Before installation of the CHP system, Fiscalini Farms consumed approximately 55,000
to 60,000 gallons of propane per year for heating the milking parlor, cheese facility, and calf

Appendix A Page 85 of 172
barn, based on a review of monthly propane statements from January 2008 to December 2010
(Table 8). The unit cost of propane fluctuates on the open market and Fiscalini Farms used two
different propane providers with differing price structures between 2008 and 2009 (Fiscalini
Farms switched providers in July 2009). For this analysis, the net unit price for propane was
calculated by averaging Fiscalini Farms’ yearly average cost per gallon of propane from 2008
through 2010. This average was estimated to be $1.80 per gallon. The service fees for filling
propane tanks were omitted, since they are reflected in the average price.
Grants
Fiscalini Farms is the only dairy in California that is currently operating a complete-
mixed anaerobic digester for a flushed manure collection system as well as the only dairy
operating a biomass energy system with an emissions control system for NOx removal. Since
the data gathered will not only benefit Fiscalini Farms but all dairies in California, Fiscalini
Farms was awarded grants to help offset the construction and start-up costs of the biomass
energy system (Table 5). The United States Department of Agriculture Rural Development
(USDA RD), United States Department of Agriculture Natural Resources Conservation Service
(USDA NRCS) and California Energy Commission Western United Resource Development
(CEC WURD) awarded grants to Fiscalini Farms during the design and construction phases of
this project. The USDA NRCS and CEC WURD grants focused on funding the development
and construction of the anaerobic digester system and the USDA RD grant focused installing and
operating the CHP unit.
Fiscalini Farms was also awarded a grant from the United States Department of
Energy/National Energy Technology Lab (US DOE/NETL) to monitor the quality and quantity
of biogas production, quality and quantity of the influent and effluent streams, indicators of
economic viability, and evidence of regulatory compliance. The grant helped establish an

Appendix A Page 86 of 172
operational and economic baseline for the digester system. In addition to other analyses, an
economic analysis was conducted to determine the importance of the grant programs to the
sustainability of the Fiscalini Farms project.
Economic Sustainability Analysis
Economic Sustainability under Current Operations
A baseline case was established utilizing a continuation of current anaerobic digestion
power generation system operations with no changes or improvements (Table 9). This analysis
was based on the current operational condition of 57% of power plant capacity and avoidance of
30% of propane usage by the utilization of waste heat from the CHP. Economic sustainability is
defined as a positive NPV, an SPP of less than 20 years (the lifespan of the digesters), and a
positive IRR. In this context, sustainability is not a determination of profitability.
Analysis of current operations indicates that operation of the power plant can be
sustainable, even though it is being operated at only 57% of capacity (Table 9). The NPV is
positive, the SPP is less than the expected lifespan of the digester, and the IRR projects a
positive, though modest, rate of return. Previous studies have indicated similar economic
outcomes for dairy based biomass energy plants. The estimated SPP for the AA Dairy biomass
energy system was calculated to be 11 years, but it could have been reduced to three years if the
system had been operated closer to design conditions (Martin, 2008). Despite the low electrical
wholesale price of $0.015/kWh received for bioenergy, the Gordondale Farms’ project had an
estimated SPP of 6.3 years (Martin, 2005). The estimated payback period for the Castelanelli
Brothers Dairy was 8.2 years, which was possible because the system was operated at full
capacity to the point where a portion of the biogas could not be used for electricity production
and had to be flared (Martin, 2008). Rapport et al. (2011) estimated a 13% IRR for an anaerobic
digestion system that was fed a mixture of food and green waste.

Appendix A Page 87 of 172
Evaluation of Economic Outcomes if the Biomass Energy System were Operating at a Effective Capacity of 710 kW
Although the Fiscalini Farms biomass energy plant appears to be economically
sustainable under current operations, the potential of the plant is not being fully realized. The
engineering analysis clearly demonstrates the electrical production is limited by the amount of
biogas-derived methane produced by the digesters and delivered to the CHP plant (Figure 3).
Currently the digesters are only producing enough biogas to allow the CHP to operate at
approximately 57% of capacity. In this analysis, we tested the economic viability of the power
plant assuming that the system operations were changed to increase biogas production allowing
the CHP to be operated at the effective operational capacity of 710 kW. Under this scenario, the
project appears financially healthy (Table 9). The NPV is over $5 million, the SPP is less than 6
years, well below the expected 20 year useful life of the digesters, and the IRR is 21.7%. This
outcome is a significant improvement and the result suggests that the Fiscalini Farms digester
operations should be improved to the extent that the power plant will be supplied with sufficient
gas to operate at capacity.
A number of alternatives exist to improve methane production from the digester. The
digester is operating with an apparent zero-order relationship between VS added and methane
gas production (Figure 4). Increasing the rate of VS loading would increase the amount of
methane produced and allow increased electrical production. A multitude of products, crops, and
waste streams have been considered as anaerobic digester feedstocks (Alatriste-Mondragon, et
al., 2006). At Fiscalini Farms, there is interest in adding food industry wastes and crop wastes
from off-site sources as co-digestates, which would provide labile VS and could have the added
benefit of providing tipping fees as an additional revenue stream to the dairy. In an evaluation of
five biomass energy project located on dairies in upstate New York, Wright et al. (2004)

Appendix A Page 88 of 172
demonstrated that only two of systems were economically sustainable. One of the successful
systems incorporated food waste as a co-digestate and the other system had a high biogas yield
relative to the other systems, but the reasons for this efficiency were not explained. Bishop and
Shumway (2009) reported on a system that was only economically viable when co-digestion was
implemented. Other published case studies demonstration that biomass energy projects can be
successful without co-digestion (e.g., Martin, 2004, Martin, 2005, Martin, 2008, Martin and
Roos, 2007).
The importation of off-site wastes for co-digestion is being examined by Fiscalini Farms
and the technical and regulatory barriers to implementation of an off-site waste utilization
program are being addressed. However, an engineering analysis suggests that better utilization
of on-site biomass could enhance methane production in the interim period, before a waste co-
digestion program is initiated (Table 10). Currently, the digester is underutilized. The design
loading rate includes 20,000 lb/d of slope screen solids and 60,000 lb/d of sudan grass silage.
Currently, approximately 40,600 lb/d of manure screenings and 40,800 lb/d of sudan grass are
fed into the anaerobic digesters. The current hydraulic residence time (HRT) is 48.1 days, which
is much lower than the design range of 24-30 days. This suggests that only 50-62% of the
anaerobic digester capacity is currently being used and it would be possible to add 24,400 to
40,500 gal/d of influent to the anaerobic digesters without exceeding the design HRT. Increasing
the feed rate of the thickened slurry to achieve the design HRT would result in an additional
loading of 1,800 to 3,000 lb of VS per day. Assuming that the performance of the anaerobic
digesters would remain near 42% reduction in VS (Table 2) and methane yield is maintained at
11.9 ft3 methane per lb VS digested (Table 3), methane production could increase approximately
10% which could lead to revenues of up to $40,000 per year (Table 10).

Appendix A Page 89 of 172
Whey is a high value substrate for anaerobic digestion (Siso, 1996). Currently, whey
from the cheese factory is being blended into the flush-water stream before delivery to the
thickener. Since this system is designed to focus the delivery of the solids fraction of the flush-
water to the digesters, a significant portion of the whey is diluted and not fully utilized for biogas
production. Of the estimated 200,000 gal/d that is added to the flush-water system daily,
approximately 30,800 gal/d is conveyed to the anaerobic digesters via the thickening tank and
5,930 gal/d is conveyed to the anaerobic digesters via the addition of the screened manure solids
(measured compressed density of 0.82 kg/L and an average of 40,600 lb/d wet mass). The
remaining estimated 163,000 gal/d of clarified flush-water is conveyed to the storage lagoons for
stabilization and subsequent land application. Delivering the whey directly to the digester, either
by tanker truck or pipeline, would provide immediate benefit to methane production. The
characteristics of whey wastewater are variable (Kavacik and Topaloglu, 2010). Based on
bench-scale testing, Antonopoulou and Stamatelatou (2008) determined the methane generating
potential of whey was 17.9 L of methane per liter of whey. Based on the results of
Antonopoulou and Stamatelatou (Antonopoulou, et al., 2008) and the current production of whey
wastewater of 4,000 gal/d, the methane generating potential of the whey wastewater is 271 m3
CH4/d. Using current electricity production rates, approximately 675 kWh/d could be produced
from the whey wastewater resulting in an annual income of approximately $27,000. Again, it is
not clear how much of the whey wastewater is currently diverted to the anaerobic digesters.
Further investigation is warranted to determine the full methane potential of the whey
wastewater substrate and the cost associated with direct delivery verses revenue generated.
Importance of Propane Avoidance to Improve Sustainability
Fiscalini Farms and other dairies use propane and natural gas to heat buildings and
produce hot water for cleaning and sterilization. In addition, Fiscalini Farms has an on-site

Appendix A Page 90 of 172
cheese factory that also requires heat for processing and sanitation. Currently, Fiscalini Farms
uses waste heat from the CHP system to maintain the digester temperature and heat some of their
buildings, such as the dairy barn, but plumbing for the efficient utilization of waste heat
throughout the dairy and cheese factory has not been installed. From 2007 through 2009, before
installation of any heat recovery systems, Fiscalini Farms used approximately 60,000 gallons of
propane per year (Table 8). Even with the current limited use of waste heat, propane
consumption decreased by approximately 30% in 2010, since the installation of the CHP system.
Based on projections made by Fiscalini Farms, it appears that sufficient waste heat is generated
by the CHP system to effectively eliminate most propane use on-site.
For this analysis, we considered how the avoidance of propane cost would impact the
overall economic sustainability of the power plant. We assumed an avoidance of 90%, with the
consideration that some propane would be purchased and stored on-site to serve as a back-up
system for dairy operations in the case of an extended power plant shutdown. The effect of
propane avoidance is significant and obviously beneficial, increasing NPV and IRR and reducing
SPP for both the current operation and the effective capacity scenarios (Table 9). For every
10,000 gallons of propane avoided the NPV increased by approximately $230,000 over the 20-
year lifespan of the project.
Costs of Air Pollution Emission Control
California has some of the most stringent and strict air pollution control regulation in the
US; the Fiscalini Farms Power Plant was required to install a SCR for control of NOx emissions
as a condition of operation. The SCR represent a significant capital investment (Table 5) and
contributes to annual O&M costs (Tables 5 and 7). The cost for the SCR equipment and
installation fees was approximately $190,000 with an annual replacement cost for the catalyst of
$13,300 and an annual urea cost of $15,000. Since dairies outside of California may not be

Appendix A Page 91 of 172
required to install similar air pollution control equipment, and there is interest in understanding
how environmental regulations impact business operations in California, we evaluated the fiscal
impact of the SCR system on the power plant. With elimination of the SCR system under the
current operating condition, the NPV is improved by approximately 25%, the SPP is marginally
reduced, and the IRR improves over 1%. However, if the facility were operating at effective
capacity and did not have an SCR, it would experience only a 7% improvement in NPV, a
minimal improvement in SPP, and a slightly more than 2% improvement in IRR (Table 9).
The results indicate that, since the air pollution control technology costs are fixed, the marginal
impact of the pollution control device is a function of the power plant operational efficiency.
Previous studies of the economic and technical performance of biomass energy systems located
at dairies have not conducted a comparable evaluation (Bishop and Shumway, 2009, Frear, et al.,
2010, Martin, 2004, Martin, 2005, Martin, 2008, Nelson and Lamb, 2002).
Impact of Grants on the Economic Sustainability of Biomass Energy Projects
The initial characterization of the Fiscalini Farms biomass energy project identified
Federal and State grants as a significant positive variable impacting start-up costs (Table 5). An
analysis of the predicted economic outcome in the absence of the approximately $2.2 million in
grants was conducted (Table 9) and demonstrates the importance of grants to the economic
success of the biomass energy plant. As discussed above, under current digester gas production
rates, the economic sustainability of the project is favorable; however, the economic results
become unfavorable if grants were not available to offset start-up costs (Table 9). Given the
current operational efficiency of 57% and without the inclusion of income from Federal and
State grants to offset capital costs, the NPV of the project is negative, the SPP exceeds the 20
year lifespan of the project, and the IRR is marginal. The importance of grants can also be
shown even if the power plant was operating at capacity: the SPP is approximately 60% higher

Appendix A Page 92 of 172
and the NPV is reduced over 30%, however the biomass energy plant would still be sustainable.
These results suggest that government support is critical for the development of biomass energy
projects, especially as the technology is being developed and operations are in start-up periods.
Impact of Financing on the Economic Sustainability of Biomass Energy Projects
The standard engineering economic analysis presented above is important to
understanding the economic sustainability of biomass energy projects and allows the
standardized comparison of different biomass energy systems (Eastern Research Group, 2011,
Lusk, 1998). These analyses take a capital investment approach that is intended to guide
investors in deciding which investments to make. In many, if not most cases, dairy farmers are
not investing their own capital, but rather will borrow money to build digesters with the intention
of increasing revenue streams. Assuming a farmer borrows the construction cost of the biomass
energy power plant ($ 4.0 million, Table 5) using a simple loan at a fixed rate of 3.5% with 10%
down, the “out-of-pocket” capital cost will be $400,000, but he will have to service an annual
payment of $252,300 (Table 11). If the Fiscalini Farms biomass energy plant is replicated at
other dairies using borrowed money, the economic sustainability will be dependent on the ability
of the plant to produce revenue streams that exceed the debt burden and other operational costs
(Table 11). An examination of the outcome for the use of borrowed money under the current
operational conditions would be negative, as indicated by a negative NPV. (The values for SPP
and IRR have limited meaning in this context). In the case of operation at the effective capacity
of 710 kW, and assuming a wholesale electrical price of $0.1095, the revenue stream would be
sufficient to service debt (Table 11) and the NPV would be strongly positive (>$3 million, Table
9). The results of this analysis again emphasize the importance of reaching the full effective
operational capacity of the power plant in order to maintain economic sustainability.

Appendix A Page 93 of 172
Influence of Electrical Wholesale Price on the Economic Sustainability of Biomass Energy Power Plants
The wholesale price of electricity is a major factor determining the viability of any
alternative energy system. In California, renewable energy projects are given a favorable price
structure by law and regulation (CEC, 2006). Other projects, especially projects in other states,
may not have such a favorable price structure and it is of interest to determine the impact of
wholesale price on economic sustainability. In Figure 5, the influence of wholesale price on
NPV is investigated under current operations, operation at capacity, and operation with and
without grant support. The results suggest that the division between sustainable and
unsustainable projects occurs at wholesale prices between $0.06 and $0.13/kWh (Figure 5). At
lower electricity prices it is more critical to operate the system close to capacity and the
contribution of State and Federal grants is more critical for economic sustainability.
Fiscalini Farms is currently selling electricity at a wholesale price of $0.1095/kW to the
Modesto Irrigation District. This wholesale price is generally higher than prices reported in
previous projects. As an example, the AA Dairy biomass energy system, an AgSTAR project,
received a wholesale price of $0.025/kWh prior to 2001 and $0.0525/kWh after 2001 and paid a
retail price of $0.105/kWh (Martin, 2004). The system at Gordondale Farms, another AgSTAR
project, had an arrangement with the electric utility to sell electricity at a rate of $0.015/kWh
(Martin, 2005). Other wholesale prices reported in the literature include $0.05/kWh in
Washington State (Bishop and Shumway, 2009), $0.0605 in Lodi, CA (Martin, 2008), and
$0.073/kWh in Minnesota (Nelson and Lamb, 2002). In their analysis using cost estimates for
biomass energy systems in Florida, Giesy et al. (2005) assumed a retail price for electricity of
$0.10/kWh and a wholesale price of $0.035/kWh for their baseline case and determined that the
wholesale value needed to be between $0.08 and $0.16/kWh for project feasibility. Using the

Appendix A Page 94 of 172
FarmWare software to simulate economic conditions of biomass energy projects, Garrison and
Richard (2005) found that electricity prices on the order of $0.12/kWh and financial assistance
were needed to advance development of biomass energy systems at dairies and swine farms in
Iowa.
Alternative Digester Technologies
The capital cost per kW for the Fiscalini Farms biomass energy system was higher than
other systems identified in published literature (Table 4). There are many reasons for higher
costs, such as location and time, but the Fiscalini Farms digester is a more sophisticated design
(complete mix, temperature controlled, etc.) than many systems that have been installed
elsewhere. Experience suggests that less sophisticated technologies such as plug-flow reactors
and covered lagoons are more likely to be economically successful (Lusk, 1998). In a
comparison of a complete-mix reactor operating in the mesophilic temperature range and an
earthen psychrophilic reactor, Lusk (1991) found that the simpler psychrophilic reactor was more
economically advantageous due to lower capital and operational costs. Based on a study
evaluating potential systems for a flush dairy, Giesy et al (2005) found that a covered lagoon was
more economically favorable than a more complex fixed-film system. The biomass energy
simulations performed by Garrison and Richard (2005) suggest that economic feasibility is
related to dairy size (assuming that co-digestion is not practiced) and that centralized operation,
constructing large systems that accept wastes from multiple dairies, of biomass energy is
preferred. The results from other studies; however, do not take the regulatory climate in
California into account. In California protection of groundwater resources is ensured by
requiring that lagoons be lined with costly liner and that monitoring systems be installed and
used. In addition, California air quality regulations are dictating the use of emissions controls
technologies to achieve stringent stack gas emissions limits. The differing regulations in

Appendix A Page 95 of 172
California may encourage development of more complex systems that can be constructed to meet
environmental regulations.
Given the impact of electrical wholesale price on the NPV of biomass energy systems
(Figure 5) and the dependence of NPV on initial capital costs, it is important to explore how the
capital cost of the digester influences economic sustainability. The cost of the 710 kW CHP
power plant and associated air pollution control equipment was approximately $968,000 (Table
5). If the capital cost of the CHP power plant is fixed and the system is operated at the capacity
of 710 kW, the allowable digester cost to reach a neutral outcome (NPV = 0) can be determined
as a function of wholesale electricity price (Figure 6). The significance of this analysis is that
there is greater flexibility in the digester design than in the type of power plant that can be used.
Using less expensive digester technology could provide an economic advantage, assuming that
alternative digester designs would provide equivalent methane production. For example, a
simple covered lagoon may be less efficient than a complete mixed reactor, but if space is
available, the larger lagoon could potentially produce as much methane as a complete-mix
reactor, but for potentially less cost. The information in Figure 6 is intended to assist in
establishing the feasible cost for digester construction as a function of wholesale electricity rates.
Several biomass energy projects have been implemented at dairies with scrape manure
collection systems; however, there is less information available for a flush manure collection
system on a dairy operations (Frear, et al., 2011, Giesy, et al., 2005, Martin, 2008). The
Castelanelli Brothers Dairy in Lodi, CA is a flush-lane dairy that uses a covered lagoon to
produce biogas (Martin, 2008). Additionally, the CottonWood Dairy in Atwater, CA uses a
covered lagoon that treats dairy manure and cheese processing wastewater. No prior reports or
publications were found that examined the operations or economics of complete-mix anaerobic

Appendix A Page 96 of 172
digestion systems on flush dairies or other livestock operations. In fact, some studies have
suggested that both complete-mix and plug flow anaerobic digesters are not appropriate for flush
wastewater, since flush-water has a solids concentration of the order of only 2% total solids
(Frear, et al., 2011, Giesy, et al., 2005). Frear et al. (2011) found that approximately 50% of the
methane-generating capacity in flush wastewater is present in the liquid portion of the waste, and
50% is in the settled solids portion of the waste stream. At Fiscalini Farms, the flush-water is
screened to remove manure solids for anaerobic digestion and the screened flush-water is further
treated in a thickener to achieve a solids concentration of approximately 8%. In addition, the
anaerobic digesters are receiving solid co-digestates (sudan grass and waste silage). At Fiscalini
Farms, it is predominantly the solid fraction of the flush-water that is being used to produce
methane, whereas at Castelanelli Brothers Dairy in Lodi, CA and at the CottonWood Dairy in
Atwater, CA it the liquid portion that is diverted to a covered lagoons for methane production
(Martin, 2008, Pacific Regional CHP Application Center, 2011).
A complete-mix reactor design was chosen for the Fiscalini Farms project after
consideration of alternative designs. Although it has been proposed that fixed-film anaerobic
digesters were appropriate for flush wastewater (Giesy, et al., 2005), these systems are expensive
and operationally complex. Fixed-film systems can process large volumes of wastewater or
flush-water, because the microbial biomass retained within the system attached to the media, but
these systems are not appropriate for solids, which must be removed from the waste stream to
prevent clogging within the fixed-film media. Plug-flow reactors have been used with scrape
systems and solid co-digestates (Table 4), but their applicability to flush-lane dairies is unknown
(Bishop and Shumway, 2009, Frear, et al., 2010, Martin, 2004, Martin, 2005, Nelson and Lamb,
2002). A lagoon system was not considered manageable for processing of plant derived co-

Appendix A Page 97 of 172
digestates at the Fiscalini Farms dairy and would require more land than is occupied by the
complete-mixed system. The results of this study suggest that power plant costs are fixed and
that, in order to maximize economic sustainability, a complete analysis of alterative digester
designs and associated cost should be considered as part of planning any dairy-located biomass
energy facility. When conducting an alternative analysis such as this, all costs should be
considered including costs of environmental systems that protect air and water quality.
Use of Digester By-Products
The slurry produced in the anaerobic digesters contains stabilized solids that are suitable
for cattle bedding and a have value as a soil amendment (Kruger, et al., 2008). In the project
reported by Martin (2005), the sale of digestate and avoided bedding costs were significant
factors in project viability. Prices reported for sale of digestate include $13.50/cubic yard
(Bishop and Shumway, 2009), $16/cubic yard (Martin, 2008) and $15/ton (Martin, 2005). The
quantity of digested solids produced by the Fiscalini Farms digesters was estimated to be 13,300
lb dry solids per day (Table 12). Using a density of 2,500 lbs per cubic yard (reflective of
average values for loose soil), the digester could be producing approximately 8,600 cubic yards
per year of soil amendment, which, at the prices above, represents potential revenue stream of
approximately $116,000 to $138,000 per year. Currently, the digester solids are being used for
bedding, but if the value of the material as a soil amendment exceeds the cost of importing cattle
bedding, sale of this material could increase profitability. Use of the digestate as bedding is
advantageous over prior practice of using composted manure for bedding, because pathogens can
be significantly reduced during anaerobic digestion, potentially reducing the occurrence of
infections in the dairy cows although this must be verified on a site-specific basis (Sahlstrom,
2003).
Greenhouse Gas Credits

Appendix A Page 98 of 172
Greenhouse gases released as a result of agricultural and energy-related activities is
significant. In 2009, agricultural activities accounted for 6.3% of total U.S. greenhouse gas
emissions and much of this resulted from enteric fermentation and manure management
practices, which represented 20.4% and 7.2% of total methane emissions, respectively (U.S.
EPA, 2011). Methane is a potent greenhouse gas, and contains 21 times the global warming
potential (GWP) of carbon dioxide based on a 100 year time period (IPCC, 2006). To encourage
reductions of greenhouse gases (GHG) such as methane, carbon markets have developed where
producers can buy and sell GHG credits for emissions. Guidelines for calculating methane
reductions have been established as part of the establishment of markets for the sale of GHG
credits (Eastern Research Group, 2011, IPCC, 2006, UNFCCC, 2010).
A complete analysis of GHG reduction credits available as a result of the Fiscalini Farms
biomass energy project is beyond the scope of this report, but an estimate of annual methane
emission reduction (kg CH4 per year) that occur due to diversion of manure from the lagoon to
the digester can be estimated using conversion factors provided for calculation of carbon credits
from dairy facilities (Eastern Research Group, 2011, UNFCCC, 2010). Approximately 13,000
lb/d of VS are diverted to the anaerobic digester that were previously sent untreated to the
facultative lagoon (Table 2). Using the conversion factor of 0.16 kg CH4/kg VS and a digestion
efficiency of 70% for facultative lagoons (Eastern Research Group, 2011), the diversion of
flushed manure to the digester represents approximately 260,000 kg of CH4 avoidance per year
or 5,460 metric tons of carbon dioxide equivalents (CO2E) that could be applied toward GHG
credits. Methane reductions result from biomass energy projects because of changes in manure
management practices, but biomass energy projects also receive credit for GHG reductions in
other ways (Eastern Research Group, 2011, IPCC, 2006, UNFCCC, 2010). In 2009, 41% of

Appendix A Page 99 of 172
carbon dioxide emissions resulting from fossil fuel combustion were emitted as a result of energy
production (U.S. EPA, 2011). Since biomass energy projects displace electricity produced from
the combustion of fossil fuels, CO2E value can be assigned to electrical production and the
utilization of water heat from the CHP system.
USDA (2011) reports that carbon credits on the international market are between $15 and
$30 per ton of CO2E, however carbon credits have been less than $1 per ton CO2E on the
Chicago Climate Exchange (CCX) since 2009. Based these prices, the value of the diversion of
flushed manure alone could be between $5,460 to over $163,000 per year. The actual number of
CO2E credits available will depend on the outcome of a more complete GHG audit, that takes
into account net GHG reductions, and includes factors such as leakage from the digesters and the
efficiency of the flare (Eastern Research Group, 2011, IPCC, 2006, UNFCCC, 2010). A
complete GHG audit is recommended to maximize potential revenue from this source.

Appendix A Page 100 of 172
Conclusions
The Fiscalini Farms biomass energy project meets the definition of economic
sustainability as it is currently operated, but the facility is not meeting the project design goals.
Significant improvements should be made to enhance methane production and other steps can be
taken to enhance economic performance. Economic sustainability was determined in this study
using established protocols for engineering economic analyses and metrics of economic stability.
Further analysis was conducted to identify key components of the Fiscalini Farms system that
can be modified to improve economic sustainability. The project could benefit from increased
utilization of on-site substrates as well as the addition of off-site co-digestates, which would
allow the power plant to operate near system capacity. Additional revenue sources could be
realized from additional avoided propane costs, tipping fees, increased biogas and electricity
production, off-site sale of digester solids, and credits for reduction of GHG releases. Additional
work is warranted to pursue these additional revenue sources.
The results of this analysis indicate that dairy-based biomass energy production can be
economically sustainable in California, but profitability will depend on many competing factors.
The result suggests that the Fiscalini Farms system could be replicated at dairies throughout
California in a sustainable manner, if digester operations can be improved to the extent that the
power plant will be supplied with sufficient gas to operate at capacity and other conditions, such
as adequate financing, grants, and electrical prices are met. The results suggest that obtaining
favorable pricing structures and operating power plants near capacity are the most critical factors
for economic sustainability. Where favorable pricing is not available, it may be possible to use
State and Federal grants or tax incentives to sustain projects. Financing options and the impact
on economic sustainability must be explored thoroughly prior to proceeding with new projects.

Appendix A Page 101 of 172
Selection of appropriate anaerobic digester technology also appears to be a key component in
project success. The results of this study suggest that additional work should be conducted to
determine the optimal strategy for managing biomass energy project at dairies that use flush-
water manure collection systems. A major contribution of this study was to analyze the
economic impacts of emissions control technologies for NOx removal. The NOx removal
system did contribute to the capital and O&M costs incurred; however, the contribution of these
costs was not significant enough to alter the economic sustainability of the project. In future
projects where emissions control devices are needed, it is necessary to assess the economic
impacts of the required infrastructure.
Overall the biomass energy project at Fiscalini Farms resulted in stabilization of manure
and other wastes, reduction in GHGs released, generation of electricity and waste heat, yielding a
economically sustainable project, as defined by standard economic indicators. Provided that the
system continues to be operated to maintain the integrity of the equipment and co-digestation is
implemented to achieve operation at system capacity, the biomass energy system should
continue to be sustainable and potentially profitable.

Appendix A Page 102 of 172
Acknowledgements
This work was supported by subcontract to Fiscalini Farms LP for work under the
Assistance Agreement DE-EE0001895, “Measurement and Evaluation of a Dairy Anaerobic
Digestion/Power Generation System,” from the United States Department of Energy National
Energy Technology Laboratory. Nettie Drake of B&N Enterprises, Brian Fiscalini of Fiscalini
Farms LLC, John Fiscalini of Fiscalini Farms LLC, Chris Weaver of EF&EE, Galen Weaver of
Martin Machinery, and Brian Gannon of Biogas Energy Inc. provided invaluable technical and
logistic support to this project.

Appendix A Page 103 of 172
References
Alatriste-Mondragon, F., Samar, P., Cox, H. H. J., Ahring, B. K., and Iranpour, R. (2006). "Anaerobic codigestion of municipal, farm, and industrial organic wastes: A survey of recent literature." Water Environment Research, 78(6), 607-636.
American Public Health Association (APHA) (2005). Standard Methods for the Examination of Water and Wastewater, Washington, D.C.
Anders, S. J. (2007). Biogas production and use on California's dairy farms: A survey of regulatory challenges, San Diego, CA.
Antonopoulou, G., Stamatelatou, K., Venetsaneas, N., Kornaros, M., and Lyberatos, G. (2008). "Biohydrogen and methane production from cheese whey in a two-stage anaerobic process." Industrial & Engineering Chemistry Research, 47(15), 5227-5233.
Bishop, C. P., and Shumway, C. R. (2009). "The economics of dairy anaerobic digestion with coproduct marketing." Review of Agricultural Economics, 31(3), 394-410.
California Air Resources Board (ARB) (2009). "California Ambient Air Quality Standards (CAAQS)." http://www.arb.ca.gov/research/aaqs/caaqs/caaqs.htm. (July 18, 2011).
California Department of Food and Agriculture (2011). California Agricultural Resource Directory 2010–2011, Sacramento, CA.
California Energy Commission (CEC) (2006). State Bill 1250. Chapter 512. Energy: cost-effective energy efficiency programs: renewable energy resources, Sacramento, CA.
Eastern Research Group (2011). Protocol for quantifying and reporting the performance of anaerobic digestion systems for livestock manures, Lexington, MA.
Forzatti, P. (2001). "Present status and perspectives in de-NOx SCR catalysis." Applied Catalysis A-General, 222(1-2), 221-236.
Frear, C., Liao, W., Ewing, T., and Chen, S. (2010). "Baseline performance monitoring of commercial dairy anaerobic digester." Climate Friendly Farming: Improving the Carbon Footprint of Agriculture in the Pacific Northwest. CSANR Research Report 2010-001, Washington State University, Pullman, WA.
Frear, C., Wang, Z. W., Li, C. L., and Chen, S. L. (2011). "Biogas potential and microbial population distributions in flushed dairy manure and implications on anaerobic digestion technology." Journal of Chemical Technology and Biotechnology, 86(1), 145-152.

Appendix A Page 104 of 172
Garrison, A. V., and Richard, T. L. (2005). "Methane and manure: Feasibility analysis of price and policy alternatives." Transactions of the ASAE, 48(3), 1287-1294.
Giesy, R., Wilke, A. C., de Vries, A., and Nordstedt, R. A. (2005). "Economic feasibility of anaerobic digestion to produce electricity on Florida dairy farms." D. AN159, ed., Department of Animal Sciences, Florida Cooperative Extension Service, Institute of Food and Agricultural Sciences, University of Florida, Gainesville, FL.
Intergovernmental Panel on Climate Change (IPCC) (2006). "2006 IPCC Guidelines for National Greenhouse Gas Inventories ", Eggleston H.S., Buendia L., Miwa K., Ngara T., and Tanabe K., eds., National Greenhouse Gas Inventories Programme, Hayama, Japan.
Kavacik, B., and Topaloglu, B. (2010). "Biogas production from co-digestion of a mixture of cheese whey and dairy manure." Biomass & Bioenergy, 34(9), 1321-1329.
Kramer, J. M. (2004). Agricultural Biogas Casebook - 2004 Update, Madison, WI.
Kruger, C., Chen, S. L., MacConnell, C., Harrison, J., Shumway, R., Zhang, T. X., Oakley, K., Bishop, C., Frear, C., Davidson, D., and Bowers, K. (2008). "High-quality fiber and fertilizer as co-products from anaerobic digestion." Journal of Soil and Water Conservation, 63(1), 12A-13A.
Lazarus, W. F. "Anaerobic digester technology." Proc., The Role of Extension in Energy.
Lazarus, W. F., and Rudstrom, M. (2007). "The economics of anaerobic digester operation on a Minnesota dairy farm." Review of Agricultural Economics, 29(2), 349-364.
Lusk, P. D. (1991). "Comparative economic analysis: Anaerobic digester case study." Bioresource Technology, 6.
Lusk, P. D. (1998). Methane recovery from animal manures: The current opportunities casebook, National Renewable Energy Laboratory, Golden, CO.
Martin, J. H. (2004). A comparison of dairy cattle manure management with and without anaerobic digestion and biogas utilization, Boston, MA.
Martin, J. H. (2005). An evaluation of a mesophilic modified plug flow anaerobic digester for dairy cattle manure, Morrisville, NC.
Martin, J. H. (2008). An evaluation of a covered anaerobic lagoon for flushed dairy cattle manure stabilization and biogas production, Morrisville, NC.

Appendix A Page 105 of 172
Martin, J. H., and Roos, K. F. "Comparison of the performance of a conventional and a modified plug-flow digester for scraped dairy manure." Proc., International Symposium on Air Quality and Waste Management for Agriculture.
Nelson, C., and Lamb, J. (2002). "Final report summary: Haubenschild Farms anaerobic digester, updated!" The Minnesota ProjectSt. Paul, MN.
Office of Management and Budget (2010). "OMB Circular A-94 Appendix C, Revised December 2010." <http://www.whitehouse.gov/omb/circulars_a094/a94_appx-c>. (June 14, 2011).
Pacific Regional CHP Application Center (2011). "Joseph Gallo Farms Dairy." (July 19, 2011).
Quick, L. E. (1997). Management Guide to Retrofitting Wastewater Treatment Plants, Technomic Publishing Company, Inc., Lancaster, PA.
Rapport, J. L., Zhang, R., Jenkins, B. M., Hartsough, B. R., and Tomich, T. P. (2011). "Modeling the performance of the anaerobic phased solids digester system for biogas energy production."
Rapport, J. L., Zhang, R. H., Jenkins, B. M., Hartsough, B. R., and Tomich, T. P. (2011). "Modeling the performance of the anaerobic phased, solids digester system for biogas energy production." Biomass & Bioenergy, 35(3), 1263-1272.
Sahlstrom, L. (2003). "A review of survival of pathogenic bacteria in organic waste used in biogas plants." Bioresource Technology, 87(2), 161-166.
Scott, N., Pronto, J., and Gooch, C. (2010). "Biogas Casebook: NYS On-farm Anaerobic Digesters." www.manuremanagement.cornell.edu, ed., Department of Biological and Environmental Engineering, Cornell University, Ithaca, NY.
Siso, M. I. G. (1996). "The biotechnological utilization of cheese whey: A review." Bioresource Technology, 57(1), 1-11.
Sullivan, W. G., Wicks, E. M., and Koelling, C. P. (2011). Engineering Economy, Prentice Hall, Upper Saddle River, NJ.
Syed, M., Soreanu, G., Falletta, P., and Béland, M. (2006). "Removal of hydrogen sulfide from gas streams using biological processes: A review." Canadian Biosystems, 48, 1-14.
Tchobanoglous, G., Burton, F. L., and Stensel, H. D. (2003). Wastewater Engineering: Treatment and Reuse, McGraw Hill, Boston, MA.

Appendix A Page 106 of 172
U.S. Department of Agriculture (USDA) (2011). "Carbon prices and the adoption of methane digesters on dairy and hog farms." Economic Brief No. 16, USDA Economic Research Service, ed.Washington, D.C.
U.S. Environmental Protection Agency (U.S. EPA) (2010). "Market Opportunities for Biogas Recovery Systems at U.S. Livestock Facilities." (July 18, 2011).
U.S. Environmental Protection Agency (U.S. EPA) (2011). Inventory of U.S. greenhouse gas emissions and sinks: 1990 – 2009, Washington, D.C.
U.S. Environmental Protection Agency (U.S. EPA) (2011). "Nitrogen Dioxide." http://www.epa.gov/oaqps001/nitrogenoxides/. (July 18, 2011).
U.S. Environmental Protection Agency (U.S. EPA) (2011). "Projects: Operating Anaerobic Digester Projects." (May 4, 2011).
United Nations Framework Convention on Climate Change (UNFCCC) (2010). AMS-III.D.: Methane recovery in animal manure management systems --- Version 17.0 Bonn, Germany.
Wright, P., Inglis, S., Ma, J., Gooch, C., Aldrich, B., Meister, A., and Scott, N. "Preliminary comparison of five anaerobic digestion systems on dairy farms in New York State." Proc., 2004 ASAE/CSAE Annual International Meeting.

Appendix A Page 107 of 172
Table 1. Fiscalini Farms biomass energy system specifications.
Constituent Description Anaerobic digesters: Type Continuous flow, intermittently mixed, mesophilic Number of tanks Two, above grade Temperature control Hot water pipes embedded in 18-in. thick digester walls Mixing frequency 5-10 min. every hour Capacity per tank 850,000 gal. Tank diameter 82-ft. Tank height 24-ft. Temperature 100°F Tank cover system Inner membrane for gas storage and outer membrane for weather
protection Sulfur treatment system Netting in biogas headspace and injection of ambient air to support
growth of sulfide oxidizing bacteria Feedstocks Dairy manure, cheese whey, Sudan green chop, waste silage Combined heat and power (CHP) system: Internal combustion engine power 1057 BHP Electric generator capacity 710 kW Emissions control Selective catalytic reduction (SCR) system to reduce NOx Biogas supply 1500-foot gas pipeline delivering digester biogas to the generator Storage lagoons: Total volume with 2-ft freeboard 41,800,000 gal Minimum detention time 120 days Annual precipitation 12-in Annual pan evaporation 69-in Digesters designed for (combined totals feeding both anaerobic digesters): Input slurry from sedimentation basin 40,000 gal/d at 8-10% TS Solids from slope screen separator 20,000 lbs/d Sudan green chop solids feeder 60,000 lbs/d Effluent from anaerobic digesters 48,000 gal/d Residence time 24-30 days Equivalent treatment capacity 3000 head of dairy cattle Assumption for manure production 18.623 gal/head/day

Appendix A Page 108 of 172
Table 2. Average daily anaerobic digester input and output flows and solids mass balance.
Average Concentrations Mass
Value Units TS VS Units TS VS UnitsInput slurry 30,800 gal/d 79,800 51,800 mg/L 20,500 13,300 lb/dSudan grass/silage 40,800 lb/d 259,000 220,000 mg/kg 10,600 9,000 lb/dScreened manure 40,600 lb/d 178,000 155,000 mg/kg 7,200 6,300 lb/dTotal input 38,300 28,600 lb/dDigester effluent 38,500 gal/d 75,800 51,800 mg/L 24,300 16,600 lb/dTotal gas produced 16,700 lb/dTotal output 41,000 16,600 lb/dDifference between input and output -2,700 12,000 lb/dPercent difference between input and output 7.0% 42.0%

Appendix A Page 109 of 172
Table 3. Biomass energy system current operating conditions, including biogas production and electricity generation.
Constituent Value Observation period Aug. 1, 2009 –
Nov. 30, 2010Observation period (days) 487 Engine capacity (kW) 710 Total biogas production (ft3) 106,340,952 Average daily biogas production (ft3/d) 218,000 Percent of biogas sent to flare 2.9% Percent methane in biogas 64.8% Total power production (kWh) 4,750,170 Average daily power production (kWh/d) 9,754 Average daily power production (kW) 406 Average electrical consumption per home (kWh/d) 19.6 Equivalent number of homes 498 Percent of generator capacity used 57% Average volatile solids added to digesters (lbs/d) 28,500 Average volatile solids digested (lbs/d) 11,900 Biogas yield per volatile solids loading (ft3/lb VS added) 7.6 Biogas yield per volatile solids digested (ft3/lb VS destroyed) 18.3 Methane yield per volatile solids loading (ft3/lb VS added) 5.0 Methane yield per volatile solids digested (ft3/lb VS destroyed) 11.9 Electricity yield (kWh/1000 ft3 biogas) 44.7 Electricity yield (kWh/1000 ft3 methane) 69.0

Appendix A Page 110 of 172
Table 4. Performance comparison between biomass energy systems located at dairies.
Facility Fiscalini Farms AA Dairy
Castelanelli Bro. Dairy
CottonWood Dairy
Gordondale Farms
Haubenschild Farms
Vander Haak Dairy1
Location Modesto, CA Candor, NY Lodi, CA Atwater, CA Nelsonville, WI
Princeton, MN Lynden, WA
Digester type Complete mix Plug flow Covered lagoon
Covered lagoon
Modified plug flow
Heated plug flow
Modified plug flow
Manure collection Flush Scraper Flush2 Flush2 Scraper Scraper Scraper
Co-digestates yes no no yes no no yes
Year that operation started
2009 1998 2004 2004 2002 1999 2004
Anaerobic digester volume (ft3)
227,000 40,000 2,500,000 5,900,000 71,000 47,000 138,000
Side water depth (ft) 22 14 -- 19.3 -- -- --
Generator capacity (kW)
710 130 180 700 140 135 285
Volatile solids reduction (%)
42.0% 29.7% 62.4% -- 39.6% -- 55.3%
COD reduction (%) -- 41.9% 59.7% -- 38.5% -- 67.7%
Methane content in biogas (%)
64.8% 59.1% 70.1% -- 55.9% -- 61.4%
Biogas yield (ft3/lb VS added)
7.6 6.2 -- -- 9.0 -- --
Biogas yield (ft3/lb VS destroyed)
18.3 20.8 13.4 -- 21.8 -- --
Methane yield (ft3/lb VS added)
5.0 3.7 -- -- 4.8 -- 5.9
Methane yield (ft3/lb VS destroyed)
11.9 12.3 9.4 -- 12.2 -- 10.6
Electricity yield (kWh/1000 ft3 biogas)
44.7 33.29 54.8 43.1 35.49 42.4 --

Appendix A Page 111 of 172
Facility Fiscalini Farms AA Dairy
Castelanelli Bro. Dairy
CottonWood Dairy
Gordondale Farms
Haubenschild Farms
Vander Haak Dairy1
Electricity yield (kWh/1000 ft3 CH4)
69.0 56.33 78.2 -- 63.49 -- --
Capital cost ($)3 $4,020,000 $245,200 $882,136 3,200,000 $650,000 $355,000 $1,136,364
Capital cost per capacity ($/kW)
$5,662 $1,886 $4,901 $4,571 $4,643 $2,630 $3,987
Reference Martin 2004 Martin 2008 http://www.chpcentermw.org/pdfs/JosephGa
lloFarms.pdf
Martin 2005 Nelson and Lamb, 2002
Bishop and Shumway,
2009; Frear et al 2010
1The solids portion of the flush wastewater is treated and not the liquid portion. 2The liquid portion of the flush wastewater is treated and not the solid portion. 3Capitol costs are based on numbers provided in references and may not be directly comparable between studies.

Appendix A Page 112 of 172
Table 5. The capital cost of the anaerobic digester system with annual cost and revenues
Sources Cost ($) Capital Cost
Anaerobic digesters 2,841,000CHP system 782,000SCR system 186,000Utility interface 75,000Professional services 86,000Permitting 50,000
Capital Cost Total 4,020,000 Grants
CEC WURD2 800,000USDA – RD2 500,000USDA NRCS2 200,000DOE – NETL2 782,420
Grant Total 2,282,420 Annual O&M Cost
Daily O&M 30,000Generator maintenance 37,000Additional electricity costs 25,000 Digester cleanout 5,000 Mechanical repair 3,500 Engine repair 25,000Cover replacement 16,000Catalyst replacement 13,300
Total O&M Cost 154,800 Annual Revenue and Cost Savings
Propane avoidance 32,400Electricity sold 1 389,843
Total Revenue and Cost Savings 422,3161The purchase price for electricity is $0.1095 2CEC WURD: California Energy Commission Western United Resource Development USDA – RD: U.S. Department of Agriculture Rural Development
USDA NRCS: U.S. Department of Agriculture National Resources Conservation Services DOE – NETL: Department of Energy National Energy Technology Laboratory

Appendix A Page 113 of 172
Table 6. Annual operation and maintenance (O&M) cost details for digester operations.
Maintenance Frequency Time (hr) Workers Labor rate ($/hr) Annual CostSilage Feeder Daily 1.5 1 13.2 $7,227Screwpress Separator Daily 0.5 1 13.2 $2,409Pits Weekly 1.5 2 12 $1,872Auger/Motors/Pumps As Needed 20 1 23 $460Biogas Chiller As Needed 20 1 23 $460Electrical As Needed 100 1 23 $2,300Technical Support As Needed 100 1 23 $2,300 Equipment Frequency Time (hr) Consumption
(gal/hr) Diesel ($/gal)
CAT 962G Daily 3 3.2 3.6 $12,614 1Total Cost $29,642 1The total O&M cost was rounded to $30,000 for the cost analyzes.

Appendix A Page 114 of 172
Table 7. Annual operation and maintenance (O&M) cost details for the generator operations.
Maintenance Replacement
(per year) Amount Cost Units Annual
Cost Oil Change 18 Filters 54 $45.12 per filter $2,436 Oil 1 $699.00 per barrel $12,582 Spark Plugs Change 9 Spark Plugs 16 $25.00 per plug $3,600 Air Filter 2 1 $141.03 per filter $282 Gas Filter 1 1 $291.80 per filter $292
Labor Routine (per year) Time (hr) Workers Labor rate ($/hr) Oil Change 18 2 2 30 $2,160 Spark Plug Change 9 2 2 30 $1,080 Consumption
(gal/day) Urea ($/gal)
Urea Solution 9.84 $4.13 $14,833 1Total Cost $37,265 1The total generator cost was rounded to $37,000 for the cost analyzes.

Appendix A Page 115 of 172
Table 8. The amount of propane used at Fiscalini Farms during a three year period from January 2008 through December 2010.
Year Gallons Cost ($) 2008 55,998 112,5292009 59,182 82,8112010 39,716 66,632

Appendix A Page 116 of 172
Table 9. The NPV, SPP, and IRR for fourteen alternative cases concerning the operation and financing of biomass energy power plants1. Refer to text for details of each analysis.
Analysis NPV (Dollars) SPP (Years) IRR (%)Current Operation $ 1,114,638 12.06 8.56% Operation at Effective Engine Capacity $ 5,072,184 5.07 21.73% Propane Avoidance (90%)
Current Operation $ 1,995,291 9.22 11.76% Operation at Effective Engine
Capacity $ 5,952,837 4.50 24.43% Without Emission Control
Current Operation $ 1,504,492 10.23 10.44% Operation at Effective Engine
Capacity $ 5,462,039 4.53 24.26% Without Grants
Current Operation $ (385,362) 23.44 2.89% Operation at Effective Engine
Capacity $ 3,572,184 8.65 12.60% Simple Financing without Grants
Current Operation $ (207,792) - -
Operation at Effective Engine Capacity
$ 3,749,755 - -
1Using a real discount rate of 4%. Tax and financial burden not included.

Appendix A Page 117 of 172
Table 10. Potential revenue from increasing flow from the thickener to the anaerobic digester, to use excess capacity and operate the anaerobic digesters at the design hydraulic residence time (HRT) of 24-30 days.
Constituent Value Average slurry volume in digesters (gal) 1,900,000 Average digester influent (gal/d) 40,500 Average digester effluent (gal/d) 38,500 Volumetric change resulting from digestion (%) 4.9% Average hydraulic retention time (d) 48.1 Average flowrate at HRT=30 d (gal/d) 63,300 Average flowrate at HRT=24 d (gal/d) 79,100 Excess influent capacity if design HRT=30 d (gal/d) 24,400 Excess influent capacity if design HRT=24 d (gal/d) 40,500 Solids concentration, Site #6 (mg/L) 13,400 Volatile solids concentration, Site #6 (mg/L) 8,720 Additional VS loading, HRT=30 d (lb/d) 1,800 Additional VS loading, HRT=24 d (lb/d) 3,000 VS destruction (%)1 42% Methane yield (ft3 methane/lb VS destroyed)1 11.9 Electricity production (kWh/1000 ft3 methane)1 69.0 Additional VS destruction estimate, HRT=30 d (lb/d) 739 Additional VS destruction estimate, HRT=24 d (lb/d) 1,230 Additional methane estimate, HRT=30 d (ft3) 8,560 Additional methane estimate, HRT=24 d (ft3) 14,300 Additional electricity estimate, HRT=30 d (kWh/d) 605 Additional electricity estimate, HRT=24 d (kWh/d) 1,010 Electricity wholesale price ($/kWh) $0.1095 Additional revenue, HRT=30 d ($/yr) $24,200 Additional revenue, HRT=24 d ($/yr) $40,200 1Values are based on analysis of existing data. It is assumed that the anaerobic digester performance will not change significantly as it is operated closer to capacity (HRT of 24-30 days).

Appendix A Page 118 of 172
Table 11. Variables used for the calculation of economic sustainability assuming a simple financing of the biomass energy power plant (Table 9).
Sources Current Operation
($)
Current Operation at Effective Engine
Capacity ($) Capital Cost 400,000 400,000 Annual O&M Cost 154,800 154,800 Annual Loan Payment 253,300 253,300 Annual Revenue
Propane Avoidance 32,400 32,400 Electricity Sold 389,843 681,046

Final Report Page 119 of 172
Table 12. Digestate production. Screwpress solids have potential economic value as a soil amendment. Site Average Concentrations Wet Mass Dry Mass No. Value Units TS VS Units Mass Units TS VS Units
Digester effluent1 16 38,500 gal/d 75,800 51,800 mg/L 328,000 lb/d 24,300 16,600 lb/d Screwpress effluent1,2 5 31,700 gal/d 41,900 26,600 mg/L 270,000 lb/d 11,100 7,030 lb/d Screwpress solids2 9 59,000 lb/d 225,000 180,000 mg/kg 59,000 lb/d 13,300 10,600 lb/d Difference between input and output 0 lb/d -100 -1,030 lb/d 1Used a density of 1.02. 2Calculated screwpress effluent flowrate and screwpress solids mass loading rate based on mass balances on the wet mass and dry mass total solids.

Final Report Page 120 of 172
Figure 1. Fiscalini Farms biomass energy system materials flow schematic.

Appendix A Page 121 of 172
Figure 2. Quantity of biogas flared and not used for electricity production during the project study period.

Appendix A Page 122 of 172
Figure 3. Average daily power production as a function of methane used by combined heat and power (CHP) plant.

Appendix A Page 123 of 172
Figure 4. Methane production as a function of digester volatile solids loading, using 7-day running averages.

Appendix A Page 124 of 172
Figure 5. The net present value of the Fiscalini Farms biomass energy plant at varying wholesale electricity prices. Analysis compares outcome with and without grants of 1.5 million dollars, which were awarded from state and federal agencies.

Appendix A Page 125 of 172
Figure 6. The maximum price allowable for a digester in order to have a net present value (NPV) of zero given a fixed cost of $968,000 for the power plant system, a wholesale electrical price of $0.1095, and electrical production at effective capacity (710 kW). NPV calculated over a 20 year period using a real rate of return of 4%.

Appendix B Page 126 of 172
Appendix B
Analytical Methods, Quality Assurance, and Quality Control for Field Sampling and
Laboratory Water Quality Analysis for the Fiscalini Farms Project
Jeremy Hanlon William Stringfellow
Justin Graham Chelsea Spier
August, 2010
Ecological Engineering Research Program
School of Engineering & Computer Sciences University of the Pacific,
3601 Pacific Avenue, Sears Hall Stockton, CA 95211

Appendix B Page 127 of 172
List of Acronyms APHA American Public Health Association BOD Biochemical Oxygen Demand CBOD Carbonaceous Biochemical Oxygen Demand Cl Chloride COD Chemical Oxygen Demand DOC Dissolved organic carbon DO Dissolved oxygen EC Electrical Conductivity EERP Ecological Engineering Research Program HDPE High density polyethylene K Potassium g/L microgram per liter µS/cm microSiemens per centimeter mg/L milligram per liter mV millivolts MS Mineral solids nm nanometers NBOD Nitrogenous Biochemical Oxygen Demand NIST National Institute of Standards and Technology NO3-N Dissolved Nitrate PTFE Polytetrafluoroethylene QA Quality Assurance QC Quality Control QAPP Quality Assurance Project Plan SM Standard Methods SOP Standard Operating Procedures TAN Total ammonia nitrogen TDS Total Dissolved Solids TN Total nitrogen TP Total Phosphorous TS Total solids UOP University of the Pacific VS Volatile solids

Appendix B Page 128 of 172
Introduction
The purpose of this report is to describe the methods used for field and laboratory procedures. This report will also describe the performance of the analytical and field crews and evaluate the quality of the data set as defined in the Quality Assurance Project Plan (QAPP) (Stringfellow, 2006). For the purpose of this report, Quality Assurance (QA), as outlined in the QAPP, was the process in which the project data was evaluated and handled. Quality Control (QC) guidelines were the requirements specified in the QAPP to determine if the data was valid. The QAPP provided both a QA processes and QC requirements for production of accurate and precise water quality analysis from the laboratory and the field in support of the project objectives. The QAPP imposed several layers of quality review on the data. These included procedures established for data collection and processing by the laboratory analyst and the field personnel; oversight by the QA/QC manager; review by data analysts; and review by independent personnel. This iterative process has helped create a complete and high quality data set.
Methods
Data Quality Assurance and Quality Control
EERP has established Standard Operating Procedures (SOPs) (Borglin et al., 2008) for all routine analysis methods. The SOPs insure consistency in the analysis procedures, data reporting, and QC requirements. The SOPs were prepared by experienced analysts in collaboration with the QA/QC manager. The SOPs are kept in the analysis area and a master copy is kept on file. Daily laboratory work at the bench level is carried out according to these documents.
Data produced by analysts is recorded electronically and in a laboratory notebook. Electronic forms are used for entering data and calculation of results from the unknown samples and standards using calibration parameters. Preliminary review of data quality is completed by the analyst who confirmed that all standards and quality control samples met quality control guidelines. If the guidelines are not met, the analyst meets with the QA/QC manager to identify the problem. The samples are then re-analyzed after remediation of any problems with analytical instrumentation, standards, calibration, or analysis procedures. Data that passed QC guidelines are then entered into the master spreadsheet.
Data in the master spreadsheet is subject to further review by applying simple linear regressions between correlated analyses to identify data outliers. This procedure is used to check for data entry or calculation errors. If problems are discovered during this process, the analyst is asked to recheck the data entry and quality of the sample analysis.
Quality control procedures for each laboratory analysis and discrete field sampling event included calibration of instruments with certified standards. Quality control samples were run in conjunction with unknown samples and, depending on the analysis, could include all or some of the following: calibration check standards, laboratory control samples, sampling and analytical duplicates, matrix spikes, and analytical blanks (Table 1).

Appendix B Page 129 of 172
Sampling and Field Water Quality Measurements
All sample collection, data evaluation, and analysis in the project is collected in accordance with rigorous, SWAMP compatible, QA/QC procedures (Puckett 2002; Stringfellow 2005; Borglin, Stringfellow et al. 2006; California Department of Fish and Game 2007; SWAMP 2008).
Field sampling consists of collecting solid and slurry dairy samples, measuring slurry quality with field instruments, and recording of field conditions. The day before sample collection a Multi-Parameter pH/Specific Conductance PCSTestr 35 (Oakton Vernon Hills, IL), a YSI pH10 meter (YSI, Yellow Springs, OH), and a Specific conductance ultrameter (Myron L Company, Carlsbad, CA) are calibrated at EERP following manufacturer procedures. The Specific conductance meter made by Myron L Company was only used in 2009. Specific conductance is measured with a temperature compensated electrical conductivity probe (EC), and was calibrated using a 1408 µS/cm conductivity standard (Radiometer Analytical SAS, Lyon, France). Temperature calibration is checked against a NIST certified thermometer. The pH probe was calibrated using standards of pH 4, pH 7, and pH 10 (VWR International, West Chester, PA).
Solid samples are collected from three locations at the site. All solids are collected by hand with clean gloves and stored in gallon Ziploc bags until processed. Screened solids, screw-pressed effluent solids, and silage solids are collected for analysis. Screened solids are collected from the solids that accumulate below the slope screen separator. Screw-pressed solids are collected from the effluent of the screwpress. The silage is sampled from the current silage feed going into the digester, which is piled behind the digester tanks.
Liquid slurry samples are collected in 16 fluid oz glass bottles (Qorpak, Bridgeville, PA) or 250 mL HDPE Trace-Clean wide mouth plastic bottles (VWR International) in accordance with requirements for different lab analysis and volume requirements. All bottles are rinsed with sample prior to sample collection. Samples are immediately stored at 4°C after sampling and transported to the lab on the day of sampling. Slurry samples are taken from specific locations throughout the site. Different collection strategies are applied depending on the sample being collected. Samples from the lagoon, flush lane vault, screwpress effluent, return vault, and digester effluent are all collected using a sampling pole modified to hold the glass bottles. In the case of the flush lane vault, the sample is collected in the middle of a flush event. The digester effluent is collected from a backflush valve off of the screwpress. The valve is allowed to flow before the sample is taken to flush the line. The input slurry is collected near the pump feeding the digesters. A sample is taken while the pump is running and after the valve has been flushed out for a few seconds. Digester tank samples are collected from ports on the side of the tanks. The valve is opened and allowed to flush for a few seconds before collecting a sample.
On the day of sampling, specific conductance, pH, and temperature of the liquid slurry samples are measured, and density is measured for the solid samples. Density of the solid samples is measured by weighing 20 L of loose material. Then this material is compacted and the reduced volume is recorded.

Appendix B Page 130 of 172
Gas samples were measured on site using a GFM 416 Biogas analyzer (Gas Data Limited, Coventry, U.K.). Gas samples were collected at the CHP room through a valve placed after the plate heat exchanger. The meter was connected and allowed to take a two minute sample before the values were recorded. Methane, carbon dioxide, oxygen, LEL, hydrogen sulfide, and pressure were recorded for each measurement.
Sample preparation and processing
Samples are received by the laboratory the same day they are sampled, logged in and inspected for damage, and stored at 4°C. The day of sampling liquid samples are blended for 2 minutes using an Oster Fusion blender (Boca Raton, FL). A portion of the liquid sample is diluted 1:10 by weight immediately after being blended. All dilutions are made in triplicate. Additional dilutions, all filtration and preservation of samples is completed within 24 hours of sample collection. Samples are collected, preserved, stored, and analyzed by methods outlined in Standard Methods for the Analysis of Water and Wastewater (APHA 1998; APHA 2005), unless otherwise indicated.
EERP Laboratory Procedures
Samples for dissolved organic carbon (DOC) and nitrate (NO3-N) were filtered through 47mm Whatman GF/F filters (0.7µm pore size) for the collection of filterable solids. Samples for total dissolved solids (TDS) were filtered though 47mm Whatman GF/F filters (1.5µm pore size). All filters were pre-combusted for 6 hours at 550°C prior to filtering.
Unfiltered samples were analyzed for Biochemical oxygen demand (BOD) by Standard Method (SM) 5210 B (APHA, 2005). Oxygen demand was determined after 5 days. BOD samples were prepared, incubated, and measured without any additional microbial seed added. Initial and final DO was measured using a calibrated YSI 5000 DO meter equipped with a YSI 5010 BOD probe (Yellow Springs, OH) and calibrated by air saturated water method according to YSI manual. Duplicate samples were prepared every 20 analyses and blanks consisted of BOD buffer solution prepared according to SM 5210 B. All samples were diluted before analysis with at least three different dilution factors to increase the number of reportable results. All BOD tests were initiated within 24 hours of sample collection. A standard curve was prepared for each sample set consisting of a BOD standard solution (Hach, Loveland, CO) containing glucose and glutamic acid at 1, 2, 3, and 4 mg/L in dilution buffer with 5 mL of seed from a randomly selected sample. In addition, Carbonaceous BOD (CBOD) was determined by adding 0.16 mg of nitrification inhibitor (N-serve, Hach, Loveland, Colorado) to a duplicate sample set. The resulting CBOD was subtracted from the total BOD to determine the Nitrogenous BOD (NBOD).
Dissolved organic carbon (DOC), was analyzed on a Teledyne-Tekmar Apollo 9000 (Mason, OH) by high temperature combustion according to SM 5310 B (APHA, 2005) and quantified using a NDIR detector. DOC was analyzed from filtrate. This machine was equipped with an auto-sampler that allows for continuous stirring of sample. DOC was preserved < pH 2 with concentrated H3PO4 and stored at 4°C until analysis. Samples were analyzed within 28 days of collection.

Appendix B Page 131 of 172
Total solids (TS) and volatile solids (VS) were analyzed by SM 2540 B and E (APHA, 2005). Typically 5 mL of sample was weighed into a pre-weighed, pre-combusted, ceramic crucible. The crucible and samples were dried at 105°C under vacuum to constant weight. After drying, the filter and dish were allowed to cool in a desiccator and were weighed for TS determination. The dried and weighted crucibles were subsequently combusted at 550°C for 6 hours and reweighed for VS determination. Mineral solids (MS) concentration was calculated by subtracting VS from TS.
Total dissolved solids (TDS) are analyzed by SM 2540 C and E. Because of high solids content 45mL samples are centrifuged for approximately 20 minutes. The exact weight of the sample being centrifuged is recorded. After being centrifuged, specific conductance in the supernate is recorded. The supernate is then filtered through a 47mm Whatman GF/F filters (1.5µm pore size). The filtrate is added to a pre-weighed and pre-combusted crucible and the weight of the crucible and sample is recorded. The filtrate is then dried at 180°C under vacuum to constant weight to determine TDS.
Total ammonia nitrogen (TAN), dissolved nitrate (NO3-N), and total nitrogen (TN) were quantified using the TL-2800 ammonia analyzer made by Timberline Instruments (Boulder, CO). The TAN test was performed on unfiltered samples that were frozen within 24 hours of collection. TAN was quantified using an automated membrane diffusion/conductivity detection method (Carlson, 1978, 1986; Carlson et al., 1990). The NO3-N test was performed on filtered samples that were frozen within 24 hours of collection. NO3-N was quantified using the same diffusion/conductivity detection method (above) after samples passed through a reducing zinc cartridge. The Total N test was performed on digested unfiltered samples that were frozen within 24 hours of collection. To digest samples, 5.0 mL of each sample was aliquotted into trace clean 16x100 mm glass tubes with PTFE lined caps (VWR International). 5.0 mL of digestion reagent was then added (10 g potassium persulfate, 6 g boric acid, and 3 g NaOH in 1000mL Millipore water) and samples were autoclaved for 30 minutes in a Tuttnauer Brinkman autoclave (Westbury, NY). After cooling, TN was determined using the nitrate diffusion/conductivity method as described above. To measure TN in solid samples, the samples are first dried at 105°C under vacuum, and then finely ground. A weighed amount of dry sample is mixed with digestion reagent (50 g potassium persulfate, 30 g boric acid, and 15 g NaOH in 1000mL Millipore water). Sample and digestion reagent are autoclaved for 90 minutes in a Tuttnauer Brinkman autoclave (Westbury, NY). After samples cool they are analyzed using the nitrate diffusion/conductivity method as described above.
Total phosphorous (TP) was quantified in unfiltered samples by the ascorbic acid method adapted from SM 4500-P-E (APHA, 2005) using HACH PhosVer3 packets (Loveland, CO) and measurement at 880 nm following digestion. To digest samples, 5.0 mL of each sample was aliquotted into trace clean 16x100 mm glass tubes with PTFE lined caps (VWR International). 5.0 mL digestion reagent was then added (10 g potassium persulfate, 6 g boric acid, and 3 g NaOH in 1000mL Millipore water) and samples were autoclaved in a Tuttnauer Brinkman autoclave (Westbury, NY).
Alkalinity was measured on samples within 24 hours of sample collection by titration of a 50 mL sample with 0.02 N H2SO4 to an endpoint of pH 8.3 and 4.5. The samples were stirred continuously during titration. Quality control included analysis of two

Appendix B Page 132 of 172
independent alkalinity standards, one from HACH (Loveland, CO) and the other from Ultra Scientific (Kingstown, RI), to insure proper preparation of the titrating solution and calibration of the pH probe.
Chemical oxygen demand (COD) was determined using reagents made by Hach (Loveland, CO) according to method 8000 approved by the EPA under Federal Register, April 21, 1980, 45(78), 26811-26812. After sample is added to HACH reagent tubes, it is heated to 150 C for 2 hours. The tubes are cooled to room temperature and the COD concentration is determined by spectrographic measurement at 620 nm.
Chloride (Cl) is measured by an ion selective electrode (ISE) (Thermo Scientific, Beverly, MA) according to EPA method 9212. Samples and standards are mixed with an equal volume of ion strength adjusting solution of 1.5 M Nitric Acid (VWR International, West Chester, PA) and 15g/L sodium bromate (Alfa Aesar, Ward Hill, MA), to reduce interferences with S-2, and Ammonia-N. Temperature is recorded at the time samples are being measured for Cl because temperature differences can cause a change in the slope of the probe.
Potassium (K) is measured by ISE (Oakton, Williston, VT) according to SM 3500 C. One mL of ion strength adjusting solution (Oakton, Williston, VT) is added to 50 mL of all samples and standards to adjust the background ionic strength to a high and constant value. Temperature is recorded at the time samples are being measured for K because temperature differences can cause a change in the slope of the probe. To measure water extractable K in solid samples, the samples are first dried at 105°C under vacuum, and then finely ground. A weighed amount of dry sample is mixed with high purity deionized water (Millipore, Billerica, MA) and shaken for at least 10 minutes. Then K is measured as described above.
Boron is determined by the carmine method, adapted from SM 4500 C. After reaction with HACH reagents (Loveland, CO) and sulfuric acid (J.T. Baker, Phillipsburg, NJ), sample concentration is determined by spectrographic measurement at 605 nm.
Density of the liquid samples is determined by weighing 100 mL of sample in a volumetric flask.
The Higher Heating Value (HHV) of solid samples is measured using an oxygen bomb calorimeter (Parr, Moline, IL) and a digital thermometer (Parr, Moline, IL). The samples are first dried at 105°C under vacuum. Duplicate samples are air dried in a fume hood. Once dried, samples are finely ground. The ground samples are passed through a steel mesh sieve to ensure uniform particle size. Approximately 1 g of sample is weighed and placed in a metal crucible and sealed in the stainless steel bomb. The bomb is pressurized to 30 atm with oxygen gas and set inside the plain jacket calorimeter. The calorimeter is filled with 2000g of MilliQ surrounding the bomb. Temperature readings of the water are taken every minute for the first six minutes. At the time of ignition and every 15 seconds following ignition, temperature readings are taken until the temperature reaches its max and starts to decline. Complete combustion of the sample is assumed for calculations.
Results

Appendix B Page 133 of 172
Summary of QC samples
Routine measurements of QC samples were used to evaluate the performance of the laboratory and field crew. The summary of the QC samples run in conjunction with sample collection does not address the actual values or trends in the samples collected. The QC data collected addressed the precision, accuracy and the overall confidence in the produced data set.
EERP laboratory had an overall QC sample pass rate of 91.5 in 2009 and 97.4% in 2010. This included all the required QC samples: calibration checks, laboratory check samples, analytical and field duplicates, matrix spikes, and blanks run in conjunction with the unknown samples. Average pass rates for the QC samples of each individual analysis is shown in Table 2 and 3.
Table 4 shows proficiency check samples. These are blind QA samples analyzed yearly to check the accuracy of laboratory methods and instruments.
The Field QC samples include both the pre and post calibration standards. These numbers represent two different pH units and 2 different EC unit used throughout the study. The overall passage of QC samples for the field was 100.0 %.

Appendix B Page 134 of 172
Table 1: Definition of Analytical Quality Control Samples used in Laboratory analysis.
QC Type Definition Frequency Used to Evaluate
Limits Corrective Action
Calibration Check (CC)
Standard solution at a concentration in the center of the calibration curve.
Every analytical batch or at least every 20 samples.
Accuracy Comparability
80 –120%
Analysis can not proceed unless the CC passes.
Laboratory Control Sample (LCS)
Standard solution from a different vendor than that of the calibration standard spiked with compounds of interest into a clean water matrix.
Every analytical batch or at least every 40 samples.
Accuracy Comparability
80 –120%
Perform instrument maintenance and prepare new standard solution if necessary.
Matrix spike & Matrix spike duplicate (MS/MSD)
Standard solution with compounds of interest spiked into a representative sample matrix.
Every 40 samples.
Precision Accuracy Comparability
80 –120%
If LCS passes, result may reflect matrix interference and may be reported with qualification.
Field Duplicate
A duplicate sample is collected in the field in separate containers
Every sampling event a field duplicate is included
Precision Comparability of field sampling techniques
80-120% Rerun sample. If second result is not within limits, report with qualifier.
Instrument or Analytical Blank (IB or AB)
Clean water matrix, free of analyte. Analyzed in same manner as samples.
Every analytical batch or at least every 40 samples.
Accuracy Below Method Detection Limit (MDL)
In some cases, target compound values may be subtracted out, in other analyses target compounds present in blank must be flagged as contamination and may not be subtracted out.
Trip Blank Clean water matrix, free of analyte. Taken to field sampling events in the same containers used to collect samples. Analyzed in same manner as samples.
Every analytical batch or at least every 40 samples.
Accuracy and can be used to identify contamination sources
Below Method Detection Limit (MDL)
In some cases, target compound values may be subtracted out, in other analyses target compounds present in blank must be flagged as contamination and may not be subtracted out.
Laboratory Replicates
Samples are analyzed in triplicate. If samples are diluted at least 2 different dilution factors are used and each replicate is made from entirely different set of dilutions if serial dilutions are needed
Every sample collected
Accuracy Relative standard deviation of 80-120%
Rerun sample. If second result is not within limits, report with qualifier.

Appendix B Page 135 of 172
Table 2: Summary of Quality Control Samples for the EERP Laboratory analyses in 2009.
Alkalinity Cl COD BOD CBODLab Duplicates 50.00% 100.00% 25.00% 75.00% 75.00%Field Duplicates 100.00% 100.00% 75.00% 75.00% 75.00%Matrix Spikes 100.00% 66.67% 100.00%Calibration Check 100.00% 100.00% 100.00%Laboratory Control Standard 100.00% 100.00% 75.00%Laboratory Blanks 100.00% 100.00% 100.00% 100.00% 100.00%Trip Blanks 100.00% 75.00% 100.00% 100.00% 100.00%Overall QA 92.86% 91.67% 82.14% 87.50% 87.50%
KWater extractable
K in solid samples
Total Ammonia-
NTotal N Total P Boron
Lab Duplicates 100.00% 100.00% 50.00% 100.00%Field Duplicates 100.00% 100.00% 75.00% 100.00%Matrix Spikes 100.00% 100.00% 100.00% 100.00%Calibration Check 100.00% 100.00% 100.00% 100.00%Laboratory Control Standard 100.00% 100.00% 100.00% 100.00%Laboratory Blanks 100.00% 75.00% 75.00% 100.00%Trip Blanks 100.00% 100.00% 75.00% 100.00%Overall QA 100.00% 96.43% 82.14% 100.00%
TS VS MS TDSSpecific
Conductance
DOC
Lab Duplicates 100.0% 100.0% 50.0% 50.0%Field Duplicates 100.0% 100.0% 100.0% 100.0% 100.0%Matrix Spikes 100.0%Calibration Check 100.0%Laboratory Control Standard 100.0%Laboratory Blanks 100.0%Trip Blanks 100.0% 100.0% 100.0% 100.0%Overall QA 100.0% 100.0% 83.3% 100.0% 92.9%
2009 QA Summary
2009 QA Summary
2009 QA Summary

Appendix B Page 136 of 172
Table 3: Summary of Quality Control Samples for the EERP Laboratory analyses in 2010.
Alkalinity Cl COD BOD CBODLab Duplicates 100.0% 100.0% 66.7% 100.0% 100.0%Field Duplicates 100.0% 100.0% 100.0% 100.0% 80.0%Matrix Spikes 100.0% 100.0% 100.0%Calibration Check 100.0% 100.0% 100.0%Laboratory Control Standard 100.0% 100.0% 100.0%Laboratory Blanks 100.0% 100.0% 83.3% 100.0% 100.0%Trip Blanks 100.0% 100.0% 100.0% 100.0% 100.0%Overall QA 100.0% 100.0% 92.9% 100.0% 95.0%
KWater
extractable K in solid samples
Total Ammonia-
NTotal N Total P Boron
Lab Duplicates 80.0% 100.0% 100.0% 100.0% 100.0% 50.0%Field Duplicates 100.0% 100.0% 100.0% 100.0% 100.0%Matrix Spikes 100.0% 100.0% 100.0% 100.0% 75.0% 100.0%Calibration Check 100.0% 100.0% 100.0% 100.0% 100.0% 100.0%Laboratory Control Standard 100.0% 100.0% 100.0% 100.0% 100.0% 100.0%Laboratory Blanks 100.0% 100.0% 100.0% 100.0% 50.0% 100.0%Trip Blanks 100.0% 100.0% 100.0% 100.0% 100.0%Overall QA 97.1% 100.0% 100.0% 100.0% 89.3% 92.9%
TS VS MS TDSSpecific
Conductance
DOC
Lab Duplicates 100.0% 100.0% 90.0% 33.33% 100.0%Field Duplicates 100.0% 83.3% 100.0% 100.0% 100.0% 100.0%Matrix Spikes 100.0%Calibration Check 100.0%Laboratory Control Standard 100.0%Laboratory Blanks 100.0%Trip Blanks 88.9% 100.0% 80.0% 100.0% 100.0%Overall QA 96.3% 91.7% 96.7% 71.11% 100.0% 100.0%
2010 QA Summary
2010 QA Summary
2010 QA Summary

Appendix B Page 137 of 172
Table 4. Laboratory proficiency check samples. Blind QA samples analyzed yearly.
Analysis SupplierCatalog Number Units
Determined Concentration
Expected Value
Acceptable Range
% differenc
e Pass/FailTotal P RTC QCI-028-2 mg/L 4.3 4.9 4.05-5.88 86.45%Total N RTC QCI-028-2 mg/L 6.9 8.4 5.58-10.9 82.43% PassDOC RTC QCI-026 mg/L 35.2 36.3 30.2-42 96.94% PassDOC RTC QCI-040 mg/L 94.7 93.9 78.5-108 100.82% Pass
TS RTC QCI-039-1 mg/L 495.3 495.0 446-536 100.05% PassTS RTC QCI-039-2 mg/L 481.9 500.0 344-638 96.37% PassTS RTC QCI-027-12 mg/L 651.7 576.0 341-805 113.14% PassVS RTC QCI-039-2 mg/L 39.4 50.0 25.8-60.2 78.74% Pass
TDS RTC QCI-039-1 mg/L 440.3 441.0 347-545 99.85% PassTDS RTC QCI-039-2 mg/L 298.2 250.0 211-299 119.29% PassTDS RTC QCI-027-12 mg/L 517.6 618.0 395-633 83.76% Pass
Ammonia RTC QCI-042-1 mg/L 1.7 2.0 1.37-2.34 83.72% PassPotassium RTC QCI-027-12 mg/L 11.9 13.3 10.8-16.0 89.80% PassAlkalinity RTC QCI-027-12 mg/L as CaCO3 93.0 91.8 81.3-101 101.31% Pass
EC RTC QCI-027-12 mS/cm 787.0 808.0 735-884 97.40% PassCl RTC QCI-027-12 mg/L 48.1 47.5 42.7-52.8 101.36% PasspH RTC QCI-010-3 5.5 5.5 5.27-5.67 100.91% Pass
BOD RTC QCI-026 mg/L 31.5 56.9 28.6-85.3 55.36% PassBOD RTC QCI-040 mg/L 98.0 147.0 74-219 66.67% Pass
CBOD RTC QCI-026 mg/L 35.8 49.0 22-76.1 73.06% PassCBOD RTC QCI-040 mg/L 76.5 126.0 56.6-198 60.71% PassCOD RTC QCI-026 mg/L 99.3 91.9 67.6-108 108.09% PassCOD RTC QCI-040 mg/L 244.3 238.0 186-268 102.63% Pass

Appendix B Page 138 of 172
References
American Public Health Association (APHA). 2005. Standard Methods for the Examination of Water and Wastewater, 21st Edition. American Public Health Association, Washington, DC.
Borglin, S., R. Burks, J. Hanlon, C. Spier, J. Graham and W. Stringfellow (2008).Standard Operation Procedures for the Up-Stream Dissolved Oxygen TMDL Project. Ernest Orlando Lawrence Berkeley National Laboratory Report No. LBNL/PUB-937. Stockton, CA, Environmental Engineering Research Program.
Carlson, R.M. 1978. Automated separation and conductimetric determination of ammonia and dissolved carbon dioxide. Anal. Chem. 50:1528-1531.
Carlson, R.M. 1986. Continuous flow reduction of nitrate to ammonia with granular zinc. Anal. Chem. 58:1590-1591.
Carlson, R.M., R. Cabrera, J. Paul, J. Quick and R.Y. Evans. 1990. Rapid direct determination of ammonium and nitrate in soil and plant tissue extracts. Comm. Soil Sci. Plant Anal. 21:1519- 1530.
Collins, J.N., E.D. Stein, M. Sutula, R. Clark, A.E. Fetscher, L. Grenier, C. Grosso, and A. Wiskind. 2008. California Rapid Assessment Method (CRAM) for Wetlands and Riparian Areas (website). www.cramwetlands.org APHA, 2005. Standard Methods for the Examination of Water and Wastewater, 20th Edition. American Public Health Association, Washington, D.C.
Potter, B., Wimsatt, J.C., 2005. METHOD 415.3. Determination of total organic carbon and specific UV absorbance at 254 nm in source water and drinking water. US EPA.
White, D.C., Ringelberg, D.B., 1998. Signature Lipid Biomarker Analysis. Techniques in Microbial Ecology, 255-272.
Stringfellow, W. Quality Assurance Project Plan(QAPP) Agricultural Discharge Management Program Monitoring & Evaluation – West Stanislaus County SWRCB Agreement Number 04-169-555-0 (WSC-BMP Project, Study #471)
YSI 6-Series Environmental Monitoring Systems Manual. Revision B. January 2002. YSI, Inc.; Yellow Spring: Oh: 264p.

Appendix B Page 139 of 172
Yu, Z., R.R. Northup and R.A. Dahlgren. 1994. Determination of dissolved organic nitrogen using persulfate oxidation and conductimetric quantification of nitrate-nitrogen. Commun. Soil Sci. Plant Anal. 25:3161-3169.

Appendix C Page 140 of 172
Appendix C
Summary of Data Collected 2009 – 2010 (Figures)
William Stringfellow1 Mary Kay Camarillo2
Jeremy Hanlon1
Chelsea Spier1
Michael Jue1
September 2011
1Ecological Engineering Research Program 2School of Engineering & Computer Science
3601 Pacific Avenue John T. Chambers Technology Center
University of the Pacific Stockton, CA 95211

Appendix C Page 141 of 172
Figure A. Fiscalini Farms biomass energy system flow schematic showing locations of continuous data meters.

Appendix C Page 142 of 172
Figure B. Fiscalini Farms biomass energy system flow schematic showing locations of grab sample locations.

Appendix C Page 143 of 172
Figure C. Alkalinity of digester slurry samples

Appendix C Page 144 of 172
Figure D. Biological Oxygen Demand (BOD) of digester slurry samples.

Appendix C Page 145 of 172
Figure E. Carbonaceous Biological Oxygen Demand (CBOD) of digester slurry samples

Appendix C Page 146 of 172
Figure F. Chemical Oxygen Demand (COD) of digester slurry samples

Appendix C Page 147 of 172
Figure G. Chloride (Cl-) concentration in digester slurry samples.

Appendix C Page 148 of 172
Figure H. Dissolved Organic Carbon (DOC) of digester slurry samples.

Appendix C Page 149 of 172
Figure I. Mineral Solids of digester slurry samples

Appendix C Page 150 of 172
Figure J. Potassium concentration in digester slurry samples.

Appendix C Page 151 of 172
Figure K. Total Dissolved Salts (TDS) concentration in digester slurry.

Appendix C Page 152 of 172
Figure L. Total Ammonia concentration in digester slurry samples.

Appendix C Page 153 of 172
Figure M. Total Nitrogen concentration in digester slurry samples.

Appendix C Page 154 of 172
Figure N. Total Organic Nitrogen concentration in digester slurry samples

Appendix C Page 155 of 172
Figure O. Total Phosphorus concentration in digester slurry samples.

Appendix C Page 156 of 172
Figure P. Total Solids concentration of digester slurry samples.

Appendix C Page 157 of 172
Figure Q. Volatile Solids concentration in digester slurry samples.
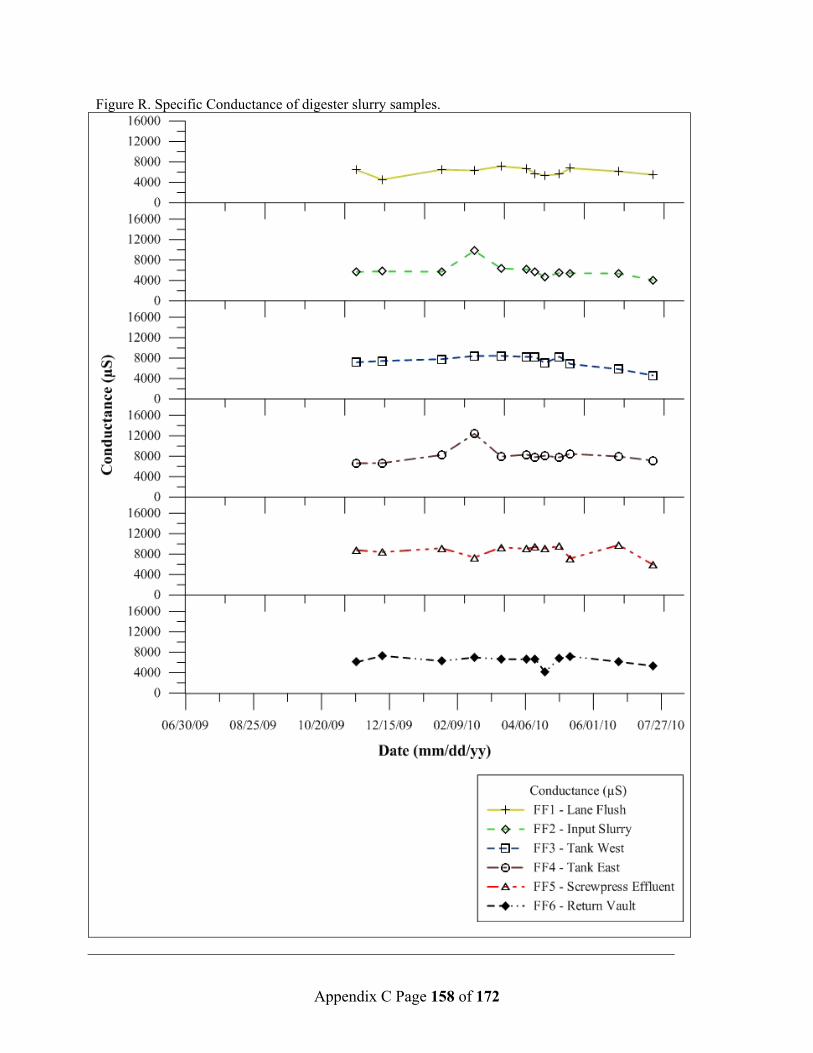
Appendix C Page 158 of 172
Figure R. Specific Conductance of digester slurry samples.

Appendix C Page 159 of 172
Figure S. pH of digester slurry samples at the time of sample collection.

Appendix C Page 160 of 172
Figure T. Mineral Solids concentration of digester solid samples

Appendix C Page 161 of 172
Figure U. Total Solids concentration of digester solid samples

Appendix C Page 162 of 172
Figure V. Volatile Solids concentration of digester solid samples

Appendix D Page 163 of 172
Appendix D
Summary of Data Collected 2009 – 2010 (Tables)
William Stringfellow1 Mary Kay Camarillo2
Jeremy Hanlon1
Chelsea Spier1
Michael Jue1
September 2011
1Ecological Engineering Research Program 2School of Engineering & Computer Science
3601 Pacific Avenue John T. Chambers Technology Center
University of the Pacific Stockton, CA 95211

Appendix D Page 164 of 172
Table A. Fiscalini Farm Project sample locations.
Fiscalini Farms Sample Location Numbers Site name
1 Lane Flush2 Input Slurry3 Tank West4 Tank East5 Screwpress Effluent 6 Return Vault7 Sudan Grass Silage Pile 8 Screened Solids Pile 9 Screwpress Solids Pile
10 Flare Gas11 Biogas CHP12 Biogas Pre-SCR 13 Biogas Post-SCR 14 Biogas Tank West 15 Biogas Tank East 16 Digester Effluent 17 First Lagoon18 Screened Return

Appendix D Page 165 of 172
Table B. Mean results for grab sample data, including temperature, pH, alkalinity, specific conductance, and densities of slurry and solid streams.
Site name Site
number Temperature
°C pH
Alkalinity mg/L as CaCO3
Specific conductance
µS
Slurry density
g/ml
Uncompressed solids density
kg/L
Compressed solids density
kg/L
Lane Flush 1 16.5 8.00 3,052 6,045 1.00
Input Slurry 2 19.5 7.39 4,511 5,849 1.02
Tank West 3 28.5 7.29 6,839 7,358 1.03
Tank East 4 29.1 7.25 6,462 8,101 1.02
Screwpress Effluent 5 29.8 7.27 6,091 8,599 1.02
Return Vault 6 16.9 7.81 3,036 6,356 1.00
Sudan Grass Silage Pile 7 0.30 0.50
Screened Solids Pile 8 0.57 0.82
Screwpress Solids Pile 9 0.56 0.83
Digester Effluent 16 31.2 7.32 7,800 7,112 1.02
First Lagoon 17 15.7 7.52 4,270 7,320 1.00
Screened Return 18 15.3 8.04 3,550 6,430 1.00

Appendix D Page 166 of 172
Table C. Mean results for grab sample data, including total solids, volatile solids, mineral solids, total dissolved solids, volatile dissolved solids, and mineral dissolved solids.
Site name Site
number Units
Total solids (TS)
Volatile solids (VS)1
Mineral solids (MS)
Total dissolved
solids (TDS)
Volatile dissolved
solids1
Mineral dissolved
solids
Lane Flush 1 mg/L 14,610 9,864 4,746 5,699 2,739 2,960Input Slurry 2 mg/L 64,788 41,994 22,793 7,811 4,489 3,322Tank West 3 mg/L 76,152 52,784 23,369 8,701 3,946 4,755Tank East 4 mg/L 77,018 53,383 23,635 7,744 3,297 4,447Screwpress Effluent 5 mg/L 41,850 26,596 15,255 7,847 3,306 4,541Return Vault 6 mg/L 13,368 8,719 4,649 5,789 2,897 2,892Sudan Grass Silage Pile2 7 mg/kg 259,182 219,930 39,252 Screened Solids Pile2 8 mg/kg 177,931 155,353 22,171 Screwpress Solids Pile2 9 mg/kg 224,758 180,102 44,656 Digester Effluent 16 mg/L 75,827 51,802 24,025 7,601 3,102 4,499First Lagoon 17 mg/L 13,523 8,754 4,769 Screened Return 18 mg/L 14,692 9,701 4,992
1Calculated: volatile solids = total solids - mineral solids. 2The total solids, volatile solids, and mineral solids concentrations for the solids samples (Sites #7, 8, and 9) are mg/kg wet mass.

Appendix D Page 167 of 172
Table D. Mean results for grab sample data, including total phosphorus, ammonia, organic nitrogen, total nitrogen, chloride, potassium, and boron.
Site name Site
number Units
Total phos-
phorus
Ammonia
as NOrganic nitrogen
Total nitrogen Chloride
Potass-ium Boron
Lane Flush 1 mg/L 123 295 472 740 349 728 22Input Slurry 2 mg/L 266 295 736 1,000 368 717 53Tank West 3 mg/L 431 513 974 1,459 640 1,490 83Tank East 4 mg/L 386 499 805 1,265 596 1,313 103Screwpress Effluent 5 mg/L 274 467 803 1,259 572 1,415 58Return Vault 6 mg/L 119 309 374 641 387 725 25Sudan Grass Silage Pile1 7 mg/kg 16,900 7,815 27,186Screened Solids Pile1 8 mg/kg 15,056 1,282 3,612Screwpress Solids Pile1 9 mg/kg 20,785 1,575 5,568Digester Effluent 16 mg/L 464 576 1,204 648 1,752First Lagoon 17 mg/L 181 337 425 762 438 950 34Screened Return 18 mg/L 133 343 797 1,140 363 969 23
1The nitrogen, chloride and potassium concentrations for the solids samples (Sites #7, 8, and 9) are mg/kg dry mass.

Appendix D Page 168 of 172
Table E. Mean results for grab sample data, including chemical oxygen demand, biochemical oxygen demand (BOD), carbonaceous biochemical oxygen demand (CBOD), nitrogenous biochemical oxygen demand (NBOD), dissolved organic carbon (DOC), carbon, and sulfur.
Site name Site
number Units
Chemical oxygen demand (COD)
Bio-chemical oxygen demand (BOD)
Carbon-aceous
biochemical oxygen demand (CBOD)
Nitro-genous
biochemical oxygen demand (NBOD)1
Dissolved organic carbon (DOC) Carbon2 Sulfur2
Lane Flush 1 mg/L 16,390 2,297 1,893 405 952Input Slurry 2 mg/L 57,036 4,354 3,394 961 1,055Tank West 3 mg/L 69,907 1,646 886 760 527Tank East 4 mg/L 62,743 1,506 916 591 518Screwpress Effluent 5 mg/L 36,700 1,291 782 509 552Return Vault 6 mg/L 13,534 2,344 2,065 278 982Sudan Grass Silage Pile 7 mg/kg 410,266 1,441Screened Solids Pile 8 mg/kg 433,039 2,315Screwpress Solids Pile 9 mg/kg 404,027 3,661Digester Effluent 16 mg/L 71,151 1,753 1,023 729 593First Lagoon 17 mg/L 21,506 2,438 2,120 318 936Screened Return 18 mg/L 16,768 2,655 2,438 218 949
1Calculated: NBOD=BOD - CBOD. 2The carbon and sulfur concentrations for the solids samples (Sites #7, 8, and 9) are mg/kg dry mass.

Appendix D Page 169 of 172
Table F. Mean results for grab sample data, including isotope data for carbon and nitrogen.
Site name Site number UnitsIsotope d 13C/12C
Isotope d 15N/14N
Isotope d 13C/12C, Air
dried
Lane Flush 1 mg/LInput Slurry 2 mg/LTank West 3 mg/LTank East 4 mg/LScrewpress Effluent 5 mg/LReturn Vault 6 mg/LSudan Grass Silage Pile 7 mg/kg -14.54 8.35 -7.96Screened Solids Pile 8 mg/kg -19.81 4.47 -19.52Screwpress Solids Pile 9 mg/kg -21.09 5.56 -20.63Digester Effluent 16 mg/LFirst Lagoon 17 mg/LScreened Return 18 mg/L

Appendix D Page 170 of 172
Table G. Mean results for grab sample data, including ash, lignin, cellobiose, glucose, xylose, galactose, arbinose, and mannose (mg/kg total solids).
Site name Site
number Average
Ash1 Average Lignin Cellobiose Glucose Xylose Galactose Arabinose Mannose
Lane Flush 1 Input Slurry 2 Tank West 3 Tank East 4 Screwpress Effluent 5 Return Vault 6 Sudan Grass Silage Pile 7 1,318 214,494 9,932 282,143 141,842 2,380 20,216 15,042Screened Solids Pile 8 1,076 291,331 14,216 272,586 161,888 9,366 29,167 95,556Screwpress Solids Pile 9 2,192 408,232 6,339 169,216 87,431 6,267 7,327 392,194Digester Effluent 16 First Lagoon 17 Screened Return 18
1Measurement done at USDA.

Appendix D Page 171 of 172
Table H. Spot measurements on biogas1.
Site name Site
number CH4 %
C02 %
O2 %
H2S ppm
Pressure mbar
Biogas CHP 11 49.69 47.08 1.30 202.86 76.36 Biogas Tank West 14 48.95 47.90 1.15 167.50 3.00 Biogas Tank East 15 48.75 47.80 0.90 667.50 2.50
1Results from the online meter located on biogas pipeline are shown in Table L.

Appendix D Page 172 of 172
Top Related