


Languages
Pages
Legal

WP/15/172
IMF Working Papers describe research in progress by the author(s) and are published to elicit comments and to encourage debate. The views expressed in IMF Working Papers are those of the author(s) and do not necessarily represent the views of the IMF, its Executive Board, or IMF management.
Fiscal Deficit and Public Debt in the Western Balkans:15 Years of Economic Transition
by Zsoka Koczan

© 2015 International Monetary Fund WP/15/172
IMF Working Paper
European Department
Prepared by Zsoka Koczan1
Authorized for distribution by Zuzana Murgasova
July 2015
Abstract
In this paper we analyze how Western Balkans public finances adapted to the boom-bust
cycle. Large capital inflows into emerging European economies during the mid-2000s
resulted in rapid economic growth and convergence to EU income levels. This also resulted
in improved fiscal positions of most countries, on the back of strong revenue performance.
Yet, since the onset of the global economic crisis, many countries have struggled to adjust
to the new situation of lower external financing and lower growth.
JEL Classification Numbers: E62, H5, H6, P27
Keywords: Western Balkans, fiscal policies, debt, deficit, transition
Author’s E-Mail Address: [email protected]
1Parts of this analysis appeared in Murgasova, Z., Ilahi, N., Miniane, J., Scott, A., Vladkova-Hollar, I. and an
IMF Staff Team, 2015. “The Western Balkans: 15 Years of Economic Transition”, IMF Regional Economic
Issues Special Report..
IMF Working Papers describe research in progress by the author(s) and are published to
elicit comments and to encourage debate. The views expressed in IMF Working Papers are
those of the author(s) and do not necessarily represent the views of the IMF, its Executive Board,
or IMF management.

Contents Page
I. INTRODUCTION ..................................................................................................................4
II. THE BOOM YEARS ............................................................................................................4
III. THE CRISIS AND ITS AFTERMATH ..............................................................................8
IV. CONCLUSIONS AND POLICY RECOMMENDATIONS.............................................12
Boxes
1. Estimating Discretionary Fiscal Policy ..................................................................................7
2. Public Pension Spending in the Western Balkans ...............................................................10
Annex
Fiscal Policies and Fiscal Frameworks in the Western Balkans .............................................14

I. INTRODUCTION
In the past decade, most of Emerging Europe experienced a severe boom bust cycle. Several
papers have examined the experience of the New Member States, arguing that their credit
boom-bust cycle was to a large extent the result of factors external to the region. Rapid credit
growth followed from high liquidity in global markets and the attractiveness of “new
Europe” for capital flows, while the end of the credit cycle was brought about by a global
crisis. However, overly expansionary macroeconomic policies and underestimation of
prudential risks also contributed to the crisis (see e.g., Bakker and Gulde 2010, Roaf et al.,
2014).
Very little has however been written on the experience of the Western Balkans. In this paper
we examine how public finances in the Western Balkans adapted to the boom-bust cycle, and
how this compares to the experiences of the New Member States. We analyze policies in the
boom years of the early 2000s, the impact of the crisis, and how countries have adapted in its
aftermath. We find that, as in the New Member States, the boom years were associated with
good fiscal positions. However, headline figures masked underlying vulnerabilities. The
crisis led to a particularly sharp decline in revenues in the Western Balkans, which, together
with difficulties in scaling back spending, resulted in a significant deterioration in fiscal
positions and a build-up of debt. The Western Balkans has struggled to adapt to the new
environment, and remains characterized by rigid expenditure patterns.
II. THE BOOM YEARS1
Rapid economic growth improved the fiscal positions of the Western Balkans states in the
early 2000s. As growth picked up across the region, rising revenues in most countries more
than offset increasing government expenditures. This in turn helped improve overall fiscal
positions and led to reductions in general government debt across the board (Table A.1).
Previously-very-high government debt fell to levels comparable to Central and Eastern
European economies by 2008.
Most of the Western Balkan states saw large increases in general government revenue as a
percent of GDP prior to 2008, similar to the experience in many of the New Member States.
Cyclical factors, resulting from strong economic growth and booming consumption, were
partly responsible for strong revenues, despite discretionary cuts in tax rates in some cases.
These cyclical factors were particularly sizeable in Montenegro and to a lesser extent
Kosovo, Albania, and Croatia (see Figure A.1). However, important fiscal reforms were
implemented in many Western Balkan countries, at times in the context of Fund-supported
programs, and played a key role in boosting revenues. These reforms included buildup of
1 In all of the following, Western Balkans refers to Albania, Bosnia and Herzegovina, Croatia, Kosovo, FYR
Macedonia, Montenegro and Serbia. Central and Eastern Europe includes Bulgaria, the Czech Republic,
Hungary, Poland, Romania, Slovakia and Slovenia. The Baltics refers to Estonia, Latvia and Lithuania. Central
and Eastern Europe and the Baltics will be referred to together as the New Member States.

institutional capacity and widening the range of tax instruments in Kosovo, improved tax
collection efficiency and tax system simplification in Albania, unification of indirect tax
policy and customs administration in Bosnia and Herzegovina (across the Federation of
Bosnia and Herzegovina and the Republika Srpska) and virtual elimination of all exemptions.
The revenue increase during the 2000s was less pronounced in Croatia and Serbia, where
improvements in tax administration had started earlier.
0
1
2
3
4
5
6
7
8
average GDP growth
Growth and fiscal positions
(2002-2008)
-1
-0.5
0
0.5
1
1.5
2
change in primary balance
-25
-20
-15
-10
-5
0
5
10
change in debt
WB
Baltics
CEE
EU-15
Source: World Economic Outlook.
Sources: The World Tax Database of the University of Michigan, KPMG Global Corporate Tax Rate Tables, IBFD Comparative Tables.
0
5
10
15
20
25
30
35
40
45
50
2000 2002 2004 2006 2008 2010 2012
Average WB
Average Baltics
Average CEE
Average EU-15
Individual tax rates
(top individual tax rates, percent)
0
5
10
15
20
25
30
35
40
2000 2002 2004 2006 2008 2010 2012
Average WB
Average Baltics
Average CEE
Average EU-15
Corporate tax rates
(top corporate tax rates, percent)
0
0.5
1
1.5
2
2.5
3
0
10
20
30
40
50
60
ALB BIH HRV UVK MKD MNE SRB Avg
WB
Avg
Baltics
Avg
CEE
Avg
EU-15
2002 2008 2002-2008 change (rhs)
Revenue in 2002 and 2008
(general government revenue as percent of GDP)
Source: World Economic Outlook.
CountryDate VAT
introduced
Albania Jul 1996
Bosnia and Herzegovina Jan 2006
Croatia Jan 1998
Kosovo Jul 2001
Macedonia, FYR Apr 2000
Serbia and Montenegro Apr 2003
Sources: International Bureau of Fiscal Documentation
(www.ibfd.org).
VAT introductions

However, buoyant cyclical revenues and one-off receipts from privatization also increased
the appetite for spending, especially in the run-ups to elections. As a result, government
expenditures surged, particularly on public wages and pensions and ambitious infrastructure
projects (Table A.2). Econometric analysis confirms that spending was less responsive to
economic conditions (GDP growth and inflation) and debt levels in the Western Balkans than
in the New Member States or the EU-15, and had a somewhat larger discretionary
component (as proxied by spending unexplained by inertia or the business cycle; Box 1).
As a result primary balances strengthened across Emerging Europe, but to a lesser extent in
the Western Balkans than in the New Member States. Yet debt ratios fell particularly sharply
in the Western Balkans, which also benefited from debt forgiveness through Paris club debt
reductions.
-3
-2
-1
0
1
-8
-6
-4
-2
0
2
4
6
ALB BIH HRV UVK MKD MNE SRB Avg
WB
Avg
Baltics
Avg
CEE
Avg
EU-15
2002
2008
2002-2008 change (rhs)
Primary balance in 2002 and 2008
(primary balance as percent of GDP)
Source: World Economic Outlook.
Note: Primary balance calculated as net lending/borrowing minus interest expense. Net lending/borrowing for Kosovo as data on interest is not available.
Debt data for Kosovo only available after 2009.
-25
-20
-15
-10
-5
0
5
10
15
20
25
-90
-70
-50
-30
-10
10
30
50
70
90
ALB BIH HRV MKD MNE SRB Avg
WB
Avg
Baltics
Avg
CEE
Avg
EU-15
2002
2008
2002-2008 change (rhs)
Gross debt in 2002 and 2008
(general government gross debt as percent of GDP)
-1
0
1
2
3
4
5
6
-10
0
10
20
30
40
50
60
ALB BIH HRV UVK MKD MNE SRB Avg
WB
Avg
Baltics
Avg
CEE
Avg
EU-15
2002 2008 2002-2008 change (rhs)
Expenditure in 2002 and 2008
(general government expenditure as percent of GDP)
CountryDate of
treatment
Type of
treatment
Albania Dec 1993 Classic
Albania Jul 1998 Naples 50%
Albania Jan 2000 Classic
Bosnia and Herzegovina Oct 1998 Naples
Bosnia and Herzegovina Jul 2000 Naples
Croatia Mar 1995 Classic
Macedonia Jul 1995 Classic
Macedonia Sep 2000 Ad hoc
Serbia and Montenegro Nov 2001 Ad hoc
Source: Paris Club (www.clubdeparis.org).
Paris club debt reductions after 1990

Box 1. Estimating Discretionary Fiscal Policy
Three main approaches have been followed in the literature for estimating discretionary expenditures: (1) looking at
cyclically adjusted budget balances (Blanchard 2003, Girouard and André 2005), (2) obtaining discretionary expenditure
from the estimated residuals of a total expenditure regression, determined by lagged expenditure (the inertial component)
and some measures of economic activity to approximate cyclical components (Fatás and Mihov 2003, Afonso et al. 2010,
Corsetti et al. 2012) and (3) through a “narrative” approach or event studies, looking at policy or administrative decisions
(Ramey and Shapiro 1998, Romer and Romer 2010, Ramey 2011). Despite their wide use adjusted balances have several
limitations – including not accounting for differences in government size, which are important for characterizing fiscal
policy in a structural way, and overstating the ability of adjusted balances to remove cyclical fluctuations. The key
drawback of identifying discretionary expenditure as residuals from an estimated equation is that this confines
discretionary spending to an unpredictable shock, even though discretion and unpredictability are not synonymous, and
discretionary spending may well react to the state of the economy. The narrative approach looks at policy decisions
directly, however policy intentions may not always result in approved budget decisions, actual spending may not
correspond to approved spending for the reference year and accrual accounting further complicated this analysis. While all
three approaches have their drawbacks, our focus here is on the second since while this looks at a narrow measure of
discretionary policy, it allows us to examine the potentially ‘harmful’ component of policy, extracting for instance the
component driven by the political business cycle rather than by economic considerations. Focus here is on the expenditure
side as with the exception of discretionary tax rate changes and lump-sum receipts revenues generally reflect their cyclical
tax bases (Coricelli and Fiorito 2013).
We extract the discretionary component of fiscal policy by estimating a fiscal policy rule, quantifying the unexpected
variation in fiscal policy. In line with the work of Fatás and Mihov (2003, 2006), Afonso et al. (2010) and Agnello et al.
(2013) we estimate the following rule for each country ( to obtain the discretionary component of
government spending:
(1)
where is the logarithm of real government spending, is the logarithm of real GDP and is a set of controls including
inflation and the logarithm of real public debt. We treat discretionary fiscal policy as the component of government
spending that is not explained by persistence (captured using lagged spending), responsiveness to the business cycle
(captured using current and lagged GDP growth) and other factors such as inflation and the level of debt. Thus is a
measure of persistence; and gauge the responsiveness of fiscal policy to the business cycle and is the unexpected
discretionary variation in fiscal policy. We include country fixed effects to account for the impact of country-specific
factors. We rely on a panel dataset including 34
countries (Western Balkans, EU).
Across all countries government spending
exhibits a high degree of persistence, with
lagged expenditure explaining most of the
variation in current expenditure. Current
GDP growth has a negative impact on
spending, possibly capturing effects through
lower revenues requiring corresponding
spending cuts. Debt has a significant
constraining impact on spending only in the
EU-15 and the Baltics, but not in the
Western Balkans and CEE. The
discretionary component, treated here as the
unexpected variation that could include
factors such as windfall revenue gains or the
political business cycle, appears to be
somewhat larger for the Western Balkans,
where less of the variation in spending for a
given country over time is explained by
cyclical factors and inertia.
Full sample WB CEE Baltics EU15
Log real expenditure (lagged) 0.911*** 0.872*** 0.919*** 0.898*** 0.935***
-0.012 -0.037 -0.035 -0.046 -0.015
Change in log real GDP -0.843*** -0.336 -0.523** -0.984*** -1.140***
-0.07 -0.267 -0.177 -0.127 -0.107
Change in log real GDP (lagged) 0.172* 0.203 0.189 0.333* 0.068
-0.068 -0.212 -0.175 -0.148 -0.106
Inflation -0.005*** -0.004*** -0.007** -0.005** -0.007***
-0.001 -0.001 -0.002 -0.002 -0.002
Log real debt -0.031*** -0.012 -0.013 -0.062* -0.043***
-0.007 -0.033 -0.014 -0.026 -0.008
Constant 0.491*** 0.498* 0.363* 0.435* 0.518***
-0.063 -0.214 -0.147 -0.191 -0.082
Number of obs. 631 95 119 49 336
Number of fixed effects (countries) 34 7 7 3 15
R-sq within 0.935 0.902 0.948 0.966 0.942
R-sq between 0.899 0.993 0.995 0.877 0.631
R-sq overall 0.909 0.974 0.950 0.911 0.847
Fiscal policy responsiveness, persistence and discretion
Note: The dependent variable is log real expenditure. Standard errors in parentheses, * denotes significant at
the 5 percent level, ** at the 1 percent level, *** at the 0.1 percent level.

III. THE CRISIS AND ITS AFTERMATH
The onset of the crisis in 2008 revealed underlying fiscal vulnerabilities in many emerging
European countries. A sharp decline in capital inflows led to economic recessions and
modest recoveries thereafter. In this context, part of the revenue surge of the boom years
turned out to be temporary, and set the stage for large deficits across the Western Balkan
countries. The collapse in tax revenues was particularly marked for taxes on goods and
services and international trade and transactions, which account for a higher share of revenue
in the Western Balkans than in the EU-15 or New Member States.
Most of these countries lacked the fiscal space and the financing to accommodate falling
revenues, and thus resorted to pro-cyclical fiscal tightening. A number of them restrained
expenditures and/or increased tax rates. For example, Serbia reduced capital spending,
Croatia introduced a VAT rate hike and a temporary “solidarity tax,” and both countries
resorted to a wage and pension freeze. In contrast, Albania implemented a fiscal stimulus, in
part financed from the privatization of the electricity distribution system. Kosovo showed
considerable resilience to external turbulence due to limited economic linkages to crisis
countries and robust remittances and FDI inflows. Nevertheless, Kosovo’s fiscal deficit also
widened after the crisis due to capital spending on an ambitious highway project.
In the aftermath of the crisis, the Western Balkans experienced difficulties in regaining
control of public finances. Unlike in Central and Eastern Europe, where current spending was
reduced after 2009 (see e.g. Blanchard, Griffiths and Gruss, 2013), mandatory expenditures
proved difficult to scale back in the Western Balkans, thus restricting the room for maneuver.
In particular, public sector wage bills and pensions (in the economies with older
populations), which constitute a larger share of overall spending in the Western Balkans,
proved to be very rigid (Box 2). Furthermore, as public debts increased, interest payments
also drifted up, approaching levels observed in Central and Eastern Europe. As a result,
mandatory spending (on wages, pensions, and interest payments) is now much higher in the
Western Balkans than in the New Member States or the EU-15, in particular in Albania,
Croatia, FYR Macedonia and Montenegro, thus severely constraining the flexibility of the
budget. While the other countries—Bosnia
and Herzegovina, Kosovo and Montenegro—
have lower levels of mandatory spending,
they also have fewer policy tools due to the
lack of independent monetary and exchange
rate policy (Bosnia and Herzegovina has a
currency board, Kosovo and Montenegro are
unilaterally euroized). Capital expenditures,
which had increased sharply in the boom
years, were relatively easier to compress, and
thus declined after the crisis.2
2 Ambitious infrastructure projects, such as Kosovo’s and Montenegro’s highways, may however reverse this
trend.
-1.0
-0.5
0.0
0.5
1.0
1.5
2.0
2.5
3.0
3.5
4.0
Avg WB Avg Baltics Avg CEE
Changes in tax revenue
(ppts of GDP)
2002-2007 2008-2009
Source: World Economic Outlook.
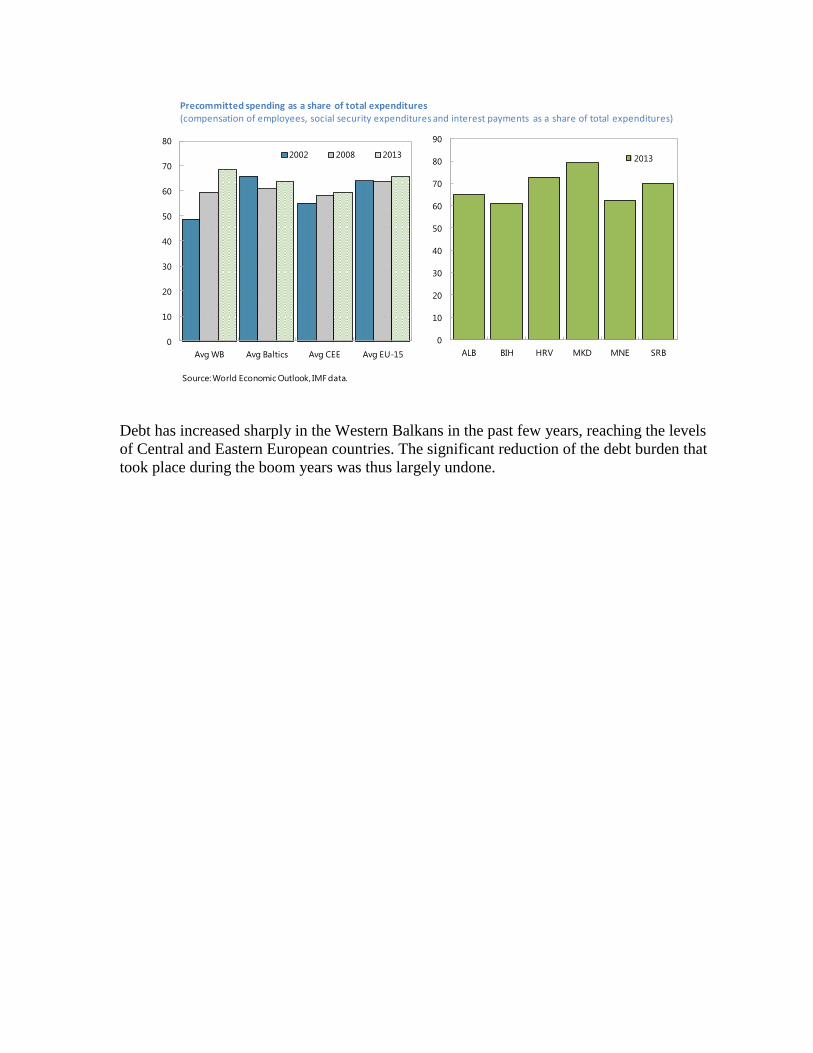
Debt has increased sharply in the Western Balkans in the past few years, reaching the levels
of Central and Eastern European countries. The significant reduction of the debt burden that
took place during the boom years was thus largely undone.
0
10
20
30
40
50
60
70
80
Avg WB Avg Baltics Avg CEE Avg EU-15
2002 2008 2013
Source: World Economic Outlook, IMF data.
0
10
20
30
40
50
60
70
80
90
ALB BIH HRV MKD MNE SRB
2013
Precommitted spending as a share of total expenditures(compensation of employees, social security expenditures and interest payments as a share of total expenditures)

Box 2. Public Pension Spending in the Western Balkans 1/
Pension spending in most of the Western Balkans is much higher than in New Member States, amounting to
almost 10 percent of GDP and almost a quarter of total government expenditure. The dominant system is a
public pension scheme with compulsory contributions on a pay-as-you-go basis (the first pillar), which covers
all workers in the formal economy. However, aging populations, low employment and participation rates, and a
large informal economy threaten the sustainability of such systems. The widespread practice of early retirement
that has accompanied privatization and enterprise restructurings has further worsened the situation.
0
2
4
6
8
10
12
14
16
18
20
Ko
sovo
Alb
ania
Irela
nd
Lith
uania
Est
onia
Latv
iaSlo
vakia
Bulg
ari
aR
om
ania
Mace
do
nia
, FYR
Cyp
rus
Hung
ary
Malta
Bo
snia
and
Herz
eg
ovi
na
Luxe
mb
ourg
Cze
ch R
ep
ub
licC
roatia
Po
land
Mo
nte
neg
roSlo
venia
Sw
ed
en
Sp
ain
Germ
any
United
Kin
gd
om
Belg
ium
Finla
nd
Neth
erl
and
sSerb
iaD
enm
ark
Po
rtug
al
Aust
ria
France
Italy
Gre
ece
Public pensions spending
(Percent of GDP)
NMS Avg
EU17 Avg
Source: Eurostat ,national authorities.
Note: Data refer to 2012/2013.
0
5
10
15
20
25
30
35
UVK BIH ALB HRV MNE MKD SRB
Pension spending as a share of total
government expenditure, 2013
(Percent)
Source: National authorities.
NMS Avg
0
10
20
30
40
50
60
70
80
90
100
ALB BIH HRV MKD MNE SRB
Old age contributors
% of working age population
% of labor force
Source: ILO.
Note: 2009-2011, depending on data availability.
NMS average excludes Romania due to lack of data.
NMS Avgs
0.0
0.1
0.2
0.3
0.4
0.5
0.6
Share of Employed
in Population
LF Participation
Rate
Share of Elderly
in Population
Demographic and labor market indicators
Albania
Bosnia and Herzegovina
Croatia
Kosovo
Macedonia, FYR
Montenegro
Serbia
Sources: World Bank, The Atlas of Social Protection: Indicators of Resilience and Equity and
national authorities.
Note: Using latest available data (2004-2011). The economic support ratio is defined as
the ratio of contributors to pensioners.

Box 2. Public Pension Spending in the Western Balkans (concluded)
Several countries have introduced pension system reforms, albeit with wide variation in their scope:
Croatia and FYR Macedonia partly transformed the inherited redistributive universal pension systems into
selective contributive systems, where the second pillar now replaces part of the first pillar social security
pension. Third-pillar voluntary private pensions operate in Croatia, FYR Macedonia, Montenegro, and
Serbia, but play only a small role.
Serbia and Montenegro have instead focused on reforms to the existing pay-as-you-go system, changing
indexation formulas, gradually increasing retirement ages and/or tightening eligibility criteria for early
retirement, and reducing occupational and gender privileges. However, these reforms are unlikely to bring
significant savings in the short run and the pension systems are still not sustainable.
In Bosnia and Herzegovina, early reforms focused on harmonization between the two entities, and
implementation of a new privileged pension law in the Federation is ongoing, focusing on reducing
benefits, increasing the number of contributors, and raising the effective retirement age.
Younger populations in Albania and Kosovo explain the relatively lighter pension burdens in these
countries, though low employment rates and high levels of informality in these countries will contribute to
increasing pressures as populations age. A combined first- and second-pillar system was created in Kosovo
in 2002. In Albania contribution rate cuts, recent unfunded increases in benefits, and incentives for
underreporting income led to an increase in the social insurance system deficit.
As a consequence of financing constraints, pensions across the region are low in relation to subsistence needs.
Going forward, the Western Balkan economies should concentrate on increasing participation and employment
rates, reducing informality, and supporting the development of second and third pillars to ensure long-term
fiscal sustainability.
___________
1/ See also Bartlett and Xhumari (2007), and ITUC-PERC (2012).
0
50
100
150
200
250
300
350
400
450
BIH HRV MKD MNE SRB
Average monthly old-age pension, 2013 (EUR)
57
58
59
60
61
62
63
64
65
66
ALB BIH HRV UVK MKD MNE SRB
men women
Statutory retirement age, 2013 (years)
Sources: National authorities.
Note: Does not show planned increases in retirement ages not yet fully in effect.
Data on average pensions not available for Albania and Kosovo.
NMS
Avg

IV. CONCLUSIONS AND POLICY RECOMMENDATIONS
The early 2000s saw rapid growth, good fiscal positions, and falling government debt to GDP
ratios in the Western Balkans; however, headline figures masked underlying vulnerabilities.
Significant progress was made in terms of macroeconomic consolidation as general
government revenue increased in most countries and gross debt was reduced across the
board. However, the surge in government revenues was partly cyclical and was accompanied
by increasing expenditures and discretionary tax cuts. The crisis led to a decline in revenues
which, together with the difficulty in scaling back spending, resulted in a significant
deterioration of fiscal positions and a build-up of debt. Changes to the composition of
expenditures were also postponed during the boom years, leaving countries with rigid
spending patterns and little fiscal room for maneuver.
Looking forward, the Western Balkan countries face important structural challenges as they
strive to adjust to a post-boom environment. Efforts aimed at containing deficits and debt
levels are also needed in light of aging populations, which over time will add to expenditure
pressures. And while in some countries substantial adjustment has already taken place,
additional consolidation would be needed to achieve further deficit reduction. Crucially,
fiscal consolidation should be complemented by compositional changes, reducing in
particular the share of current expenditures. Controls in the broader public sector should also
be improved as off-budget operations and the legacy of social and subsidy spending continue
to complicate budget planning in several Western Balkans countries. In most countries
revenue measures should be seen as a complement to adjustment on the expenditure side.
Challenges Policy recommendations
Albaniahigh debt and financing needs, heavily
dependent on banks
fiscal consolidation largely through revenue measures
and phasing out energy subsidies
Bosnia and
Herzegovina
balance the need for further fiscal consolidation
with supporting growth; composition of
spending
contain current, non-disaster related spending, notably
wages and benefits; improve the quality and targeting
of public spending; continue on-going efforts to
improve revenue collection and administration
Croatiahigh fiscal deficits, rapidly increasing public
debt and elevated risk spreads
emphasis on revenue measures in near term in view
of already fragile growth; gradual switch to
expenditure consolidation in subsequent years
Kosovosafeguard fiscal sustainability, arrest the
worsening composition of the budget
wage and benefit moderation; improve tax
compliance; shift tax policy gradually towards
domestically collected taxes
Macedoniarebuild buffers and safeguard sustainability of
public finances and the exchange rate peg
fiscal consolidation embedded in a comprehensive
spending review
Montenegro high and rising debt, preserving market accessfundamental expenditure reform, including on the
pension system and public sector wages
Serbia high debt, increasing debt dynamics
ambitious and sustained fiscal adjustment through
curtailing mandatory spending (wages and pensions),
reducing state aid to weak SOEs

Fiscal rules can help contain spending pressures during good times and a medium-term
strategy would facilitate the planning of large investment projects. Empirical studies suggest
that fiscal rules have been generally associated with improved fiscal performance (IMF
2009), though of course they are only successful if there is sufficient political commitment to
them. While some countries in the region have recently adopted fiscal rules (Croatia,
Kosovo, Montenegro and Serbia—see Table A.2), enforcement is weak in some of these
countries. It should be acknowledged that running large surpluses during boom times may be
politically difficult, in particular in catching-up economies, with large demands for
improvements in infrastructure.
Fixed exchange rates and a high dependence on external financing make fiscal consolidation
even more crucial. Fiscal consolidation and fiscal buffers are particularly important in the
context of unilaterally euroized economies (Montenegro, Kosovo), currency boards (Bosnia
and Herzegovina) and exchange rate pegs (Croatia, FYR Macedonia). The prospect of tighter
global financing conditions ahead could increase vulnerabilities in countries with a high
reliance on external financing.

Annex. Fiscal Policies and Fiscal Frameworks in the Western Balkans
2002-
2008
2009-
20132002 2008 2013 2002 2008 2013
WB 4.9 0.7 -2.9 -2.3 -4.1 55.2 33.0 49.9
CEE 5.1 0.0 -4.4 -2.0 -4.5 39.9 32.5 52.8
Baltics 7.0 -0.1 -1.4 -4.6 -1.3 13.8 12.4 27.6
EU-15 2.3 -0.6 -1.3 -1.7 -3.2 58.1 59.6 88.6
Primary balance Debtavg GDP growth
Table A.1. Fiscal positions

15
Table A.2. Main Fiscal Policy Measures
Period Revenue measures Expenditure measures
ALB boom
years
measures to improve compliance (2000);
new road tax to help finance road construction (2002);
SSC rate cut (2006);
tax reform lowering CIT (2007-2008)
infrastructure investment (early 2000s);
spending contained to meet program targets (2003–04)
crisis &
aftermath
SSC rate cut (2009) fiscal stimulus to soften effect of crisis, large infrastructure project (2008–09),
strong fiscal relaxation prior to elections (2009);
fiscal slippage and accumulation of arrears (2013)
BIH boom
years
tax system harmonization and simplification (2000-2001);
VAT introduced to replace dual rate sales tax (2006)
fiscal consolidation: scale-back of pension entitlements (2001);
cuts to investment and operations and maintenance spending as disappointing revenues and
slow progress on demobilization required offsetting adjustments (2004–05);
elections fuelled spending pressures (2006);
sizeable fiscal impulse, sharp increases in transfers to households, capital spending and a
10% wage increase, fiscal policy became procyclical (2007–08)
crisis &
aftermath
administrative measures to improve tax collection (2013) fiscal consolidation dictated by lack of foreign financing, reduction in spending on wages
and war-related benefits as a share of GDP, underexecution of capital budget (2010–11);
significant compression in non-priority spending due to revenue shortfalls and delays in
official foreign financing (2013);
new privileged pension law in the Federation, benefits of existing beneficiaries reduced
(2013);
registration of farmers to broaden collection base for SSC in RS (2013)
HRV boom
years
higher income tax deduction, SSC cut by 2 ppts, new VAT
exemption, tax holidays and employment subsidies for new
employment projects (2000),
PIT average rate lowered, introduced dividend income
taxation, CIT nominal rate lowered, increased depreciation
allowances, but abolished the deduction for the imputed
cost of equity (2001)
large wage increases (1999);
cut in top salaries and 5% cut in basic wage in budgetary sphere,
cuts in discretionary spending (2000);
reforms in public administration and social transfers, but launch of ambitious highway
project (2001);
sharp reversal of fiscal policy in run-up to elections, increased highway spending, large
off-budget fiscal operations (Development Bank loans for housing reconstruction; Croatian
Railways) (2003);
significant fiscal adjustment under SBA: continued pension reform, wage moderation,
investment cuts, DB scaled back its (quasi-fiscal) activity (2004–06)
crisis &
aftermath
VAT rate hike, temporary solidarity tax (2009);
VAT increase of 2 ppts, only partly offset by a 2ppts cut in
health insurance contributions; some personal tax relief
paid for by introduction of a 12 percent tax on dividends
and profit distribution (2012)
cash spending reduced, mainly on goods and services as revenues underperformed, but
arrears increased (2008),
expenditure cuts, wage and pension freeze to offset plunging revenues (2009);
significant consolidation: cuts in wage bill, subsidies, health spending (2012)
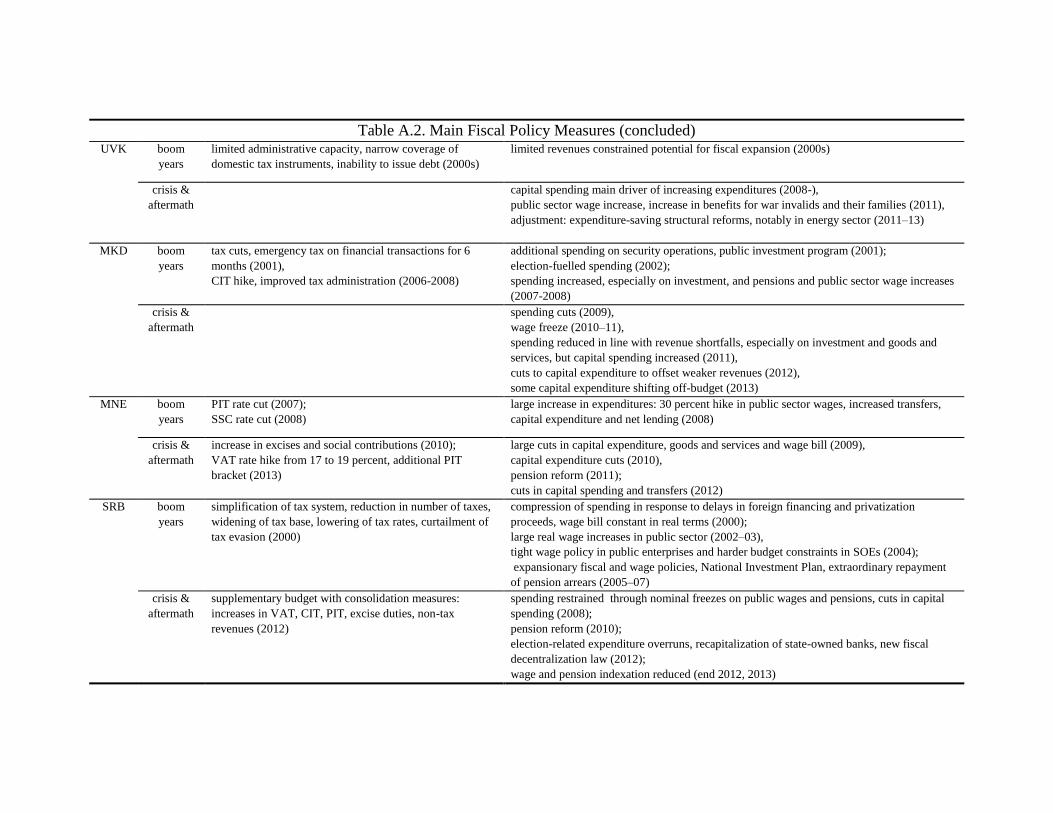
Table A.2. Main Fiscal Policy Measures (concluded) UVK boom
years
limited administrative capacity, narrow coverage of
domestic tax instruments, inability to issue debt (2000s)
limited revenues constrained potential for fiscal expansion (2000s)
crisis &
aftermath
capital spending main driver of increasing expenditures (2008-),
public sector wage increase, increase in benefits for war invalids and their families (2011),
adjustment: expenditure-saving structural reforms, notably in energy sector (2011–13)
MKD boom
years
tax cuts, emergency tax on financial transactions for 6
months (2001),
CIT hike, improved tax administration (2006-2008)
additional spending on security operations, public investment program (2001);
election-fuelled spending (2002);
spending increased, especially on investment, and pensions and public sector wage increases
(2007-2008)
crisis &
aftermath
spending cuts (2009),
wage freeze (2010–11),
spending reduced in line with revenue shortfalls, especially on investment and goods and
services, but capital spending increased (2011),
cuts to capital expenditure to offset weaker revenues (2012),
some capital expenditure shifting off-budget (2013)
MNE boom
years
PIT rate cut (2007);
SSC rate cut (2008)
large increase in expenditures: 30 percent hike in public sector wages, increased transfers,
capital expenditure and net lending (2008)
crisis &
aftermath
increase in excises and social contributions (2010);
VAT rate hike from 17 to 19 percent, additional PIT
bracket (2013)
large cuts in capital expenditure, goods and services and wage bill (2009),
capital expenditure cuts (2010),
pension reform (2011);
cuts in capital spending and transfers (2012)
SRB boom
years
simplification of tax system, reduction in number of taxes,
widening of tax base, lowering of tax rates, curtailment of
tax evasion (2000)
compression of spending in response to delays in foreign financing and privatization
proceeds, wage bill constant in real terms (2000);
large real wage increases in public sector (2002–03),
tight wage policy in public enterprises and harder budget constraints in SOEs (2004);
expansionary fiscal and wage policies, National Investment Plan, extraordinary repayment
of pension arrears (2005–07)
crisis &
aftermath
supplementary budget with consolidation measures:
increases in VAT, CIT, PIT, excise duties, non-tax
revenues (2012)
spending restrained through nominal freezes on public wages and pensions, cuts in capital
spending (2008);
pension reform (2010);
election-related expenditure overruns, recapitalization of state-owned banks, new fiscal
decentralization law (2012);
wage and pension indexation reduced (end 2012, 2013)

17
21
22
23
24
25
26
27
28
2000 2001 2002 2003 2004 2005 2006 2007 2008 2009
Albania
Revenues (% of GDP)
HP filtered revenues (% of GDP)
40
42
44
46
48
50
52
54
2000 2001 2002 2003 2004 2005 2006 2007 2008 2009
Bosnia and Herzegovina
36
37
38
39
40
41
42
2002 2003 2004 2005 2006 2007 2008 2009
Croatia
0
5
10
15
20
25
30
2000 2001 2002 2003 2004 2005 2006 2007 2008 2009
Kosovo
28
30
32
34
36
38
2000 2001 2002 2003 2004 2005 2006 2007 2008 2009
Macedonia
24
29
34
39
44
49
54
2002 2003 2004 2005 2006 2007 2008 2009
Montenegro
26
28
30
32
34
36
38
40
42
44
46
48
50
2000 2001 2002 2003 2004 2005 2006 2007 2008 2009
Serbia
Figure A.1: Revenues and HP filtered revenues (% of GDP)
Source: World Economic Outlook and staff calculations.

18
Source: World Economic Outlook.
Note: Some country-years excluded due to missing data.
0
10
20
30
40
50
60
2003 2005 2007 2009 2011 2013
Avg WB
Avg Baltics
Avg CEE
Avg EU-15
Current expenditure
(percent of GDP)
0
1
2
3
4
5
6
2003 2005 2007 2009 2011 2013
Capital expenditure
(percent of GDP)
8
9
10
11
12
13
14
2003 2005 2007 2009 2011 2013
Compensation of employees
(percent of GDP)
8
10
12
14
16
18
20
22
24
2003 2005 2007 2009 2011 2013
Social security expenditure
(percent of GDP)
4
4.5
5
5.5
6
6.5
7
7.5
8
2003 2005 2007 2009 2011 2013
Use of goods and services
(percent of GDP)
0
1
2
3
4
2003 2005 2007 2009 2011 2013
Interest payments
(percent of GDP)
Figure A.2 Changes in the composition of expenditures

19
References
Afonso, A., L. Agnello,. and D. Furceri, 2010, “Fiscal policy responsiveness, persistence and
discretion,” Public choice, Vol. 145(3), pp. 503–530.
Agnello, L., D. Furceri, and R.M. Sousa, 2013, “How best to measure discretionary fiscal
policy? Assessing its impact on private spending,” Economic Modelling 34, pp. 15–24.
Bakker, B., and Anne-Marie Gulde, 2010, “The Credit Boom in the EU New Member States:
Bad Luck or Bad Policies,” IMF Working Paper No. 10/130.
Bakker, B., and L.E. Christiansen, 2012, “Crisis and Consolidation – Fiscal Challenges in
Emerging Europe,” ONB Workshop No. 17.
Bartlett, W., and Xhumari, M., 2007. “Social Security Policy and Pension Reforms in the
Western Balkans.” European Journal of Social Security, Vol. 9 (4).
European Commission, 2010, “Public Finances in EMU010,” European Economy, Vol. 4.
Blanchard, O.J., 1990, “Suggestions for a New Set of Fiscal Indicators,” OECD Working
Paper No. 79.
Blanchard, O.J., M. Griffiths, and B. Gruss, 2013, “Boom, Bust, Recovery: Forensics of the
Latvia Crisis,” Brookings Papers on Economic Activity, Fall 2013.
Coricelli, F., and R. Fiorito, 2013. “Myths and Facts about Fiscal Discretion: A New
Measure of Discretionary Expenditure,” Available at
http://works.bepress.com/riccardo_fiorito/2.
Corsetti G., A. Meier, and G.J. Müller, 2012. “What Determines Government Spending
Multipliers?” IMF Working Paper No. 12/150.
Fatás, A., and I. Mihov, 2003, “The case for restricting discretionary fiscal policy,” Quarterly
Journal of Economics Vol. 118, pp. 1419–47.
Fatás, A., and I. Mihov, 2006, “The macroeconomic effects of fiscal rules in the U.S. states”
Journal of Public Economics, Vol. 90, pp. 101–117.
Girouard N., and C. André, 2005, “Measuring Cyclically Adjusted Budget Balances for
OECD Countries,” OECD Working Paper No. 434.
IMF, 2003, Public Debt in Emerging Markets, World Economic Outlook.
IMF, 2009, “Fiscal rules – Anchoring Expectations for Sustainable Public Finances,” IMF
Fiscal Affairs Department.

20
IMF, 2010, “Recovery, Risk and Rebalancing,” World Economic Outlook.
IMF Staff Reports for Western Balkans countries, 1990–2013.
ITUC-PERC., 2012, “Pension Reforms in the Countries of the Western Balkans from a
European Perspective,” Brussels: The International Trade Union Confederation &
Pan-European Regional Council.
Murgasova, Z., N. Ilahi, J. Miniane, A. Scott, I. Vladkova-Hollar and an IMF Staff Team,
2015, “The Western Balkans: 15 Years of Economic Transition,” IMF Regional Economic
Issues Special Report.
Ramey, V.A., 2011, “Identifying Government Shocks: It’s All in the Timing,” Quarterly
Journal of Economics, pp.1–50.
Ramey, V.A., and M. D. Shapiro, 1998, “Costly Capital Reallocation and the Effects of
Government Spending,” Carnegie-Rochester Conference on Public Policy, Vol. 48(1),
pp. 145–94.
Roaf, J., R. Atoyan, B. Joshi, K. Krogulski and an IMF Staff Team, 2014, “25 Years of
Transition: Post-Communist Europe and the IMF,” IMF Regional Economic Issues Special
Report.
Romer C. and D. Romer, 2010, “The Macroeconomic Effects of Tax Changes: Estimates
Based on a New Measure of Fiscal Shocks,” American Economic Review, Vol. 100,
pp. 763–801.
Schaechter, A., T. Kinda, N. Budina, and A. Weber, 2012, “Fiscal Rules in Response to the
Crisis - Toward the ‘Next-Generation’ Rules. A New Dataset,” IMF Working Paper
No. 12/187.
Top Related