


Languages
Pages
Legal


© Subsea 7 - 20211 subsea7.com
First Quarter 2021Earnings Presentation
29 April 2021
© Subsea 7 - 20212 subsea7.com
Forward looking statements• This document may contain ‘forward-looking statements’ (within the meaning of the safe harbour provisions of the U.S. Private Securities
Litigation Reform Act of 1995). These statements relate to our current expectations, beliefs, intentions, assumptions or strategies regarding the future and are subject to known and unknown risks that could cause actual results, performance or events to differmaterially from those expressed or implied in these statements. Forward-looking statements may be identified by the use of words such as ‘anticipate’, ‘believe’, ‘estimate’, ‘expect’, ‘future’, ‘goal’, ‘intend’, ‘likely’ ‘may’, ‘plan’, ‘project’, ‘seek’, ‘should’, ‘strategy’ ‘will’, and similar expressions. The principal risks which could affect future operations of the Group are described in the ‘Risk Management’ section of the Group’s Annual Report and Consolidated Financial Statements for the year ended 31 December 2020. Factors that may cause actual and future results and trends to differ materially from our forward-looking statements include (but are not limited to): (i) our ability to deliver fixed price projects in accordance with client expectations and within the parameters of our bids, and to avoid cost overruns; (ii) our ability to collect receivables, negotiate variation orders and collect the related revenue; (iii) our ability to recover costs on significant projects; (iv) capital expenditure by oil and gas companies, which is affected by fluctuations in the price of, and demand for, crude oil and natural gas; (v) unanticipated delays or cancellation of projects included in our backlog; (vi) competition and price fluctuations in the markets and businesses in which we operate; (vii) the loss of, or deterioration in our relationship with, any significant clients; (viii) the outcome of legal proceedings or governmental inquiries; (ix) uncertainties inherent in operating internationally, including economic, political and social instability, boycotts or embargoes, labour unrest, changes in foreign governmental regulations, corruption and currency fluctuations; (x) the effects of a pandemic or epidemic or a natural disaster; (xi) liability to Fourth parties for the failure of our joint venture partners to fulfil their obligations; (xii) changes in, or our failure to comply with, applicable laws and regulations (including regulatory measures addressing climate change); (xiii) operating hazards, including spills, environmental damage, personal or property damage and business interruptions caused by adverse weather; (xiv) equipment or mechanical failures, which could increase costs, impair revenue and result in penalties for failure to meet project completion requirements; (xv) the timely delivery of vessels on order and the timely completion of ship conversion programmes; (xvi) our ability to keep pace with technological changes and the impact of potential information technology, cyber security or data security breaches; and (xvii) the effectiveness of our disclosure controls and procedures and internal control over financial reporting;. Many of these factors are beyond our ability to control or predict. Given these uncertainties, you should not place undue reliance on the forward-looking statements. Each forward-looking statement speaks only as of the date of this document. Weundertake no obligation to update publicly or revise any forward-looking statements, whether as a result of new information, future events or otherwise.
© Subsea 7 - 20213 subsea7.com
First Quarter 2021John Evans, CEORicardo Rosa, CFO• Highlights• Financial performance• Outlook• Q&A

© Subsea 7 - 20214 subsea7.com
First quarter 2021 results
OPERATIONAL HIGHLIGHTS
• Active fleet vessel utilisation: 66%• Zinia complete; Barossa restarted• Re-commenced offshore activities
in Saudi Arabia• Seagreen making good progress
STRATEGIC HIGHLIGHTS
FINANCIAL HIGHLIGHTS
• Revenue $1.0 billion• Adjusted EBITDA $102 million• Adjusted EBITDA margin 10%‒ After incurring net Covid-19 costs of
approximately $9 million
• Cash and cash equivalents $527 million
• Net cash $74 million • First carbon capture award• New floating wind joint venture
© Subsea 7 - 20215 subsea7.com
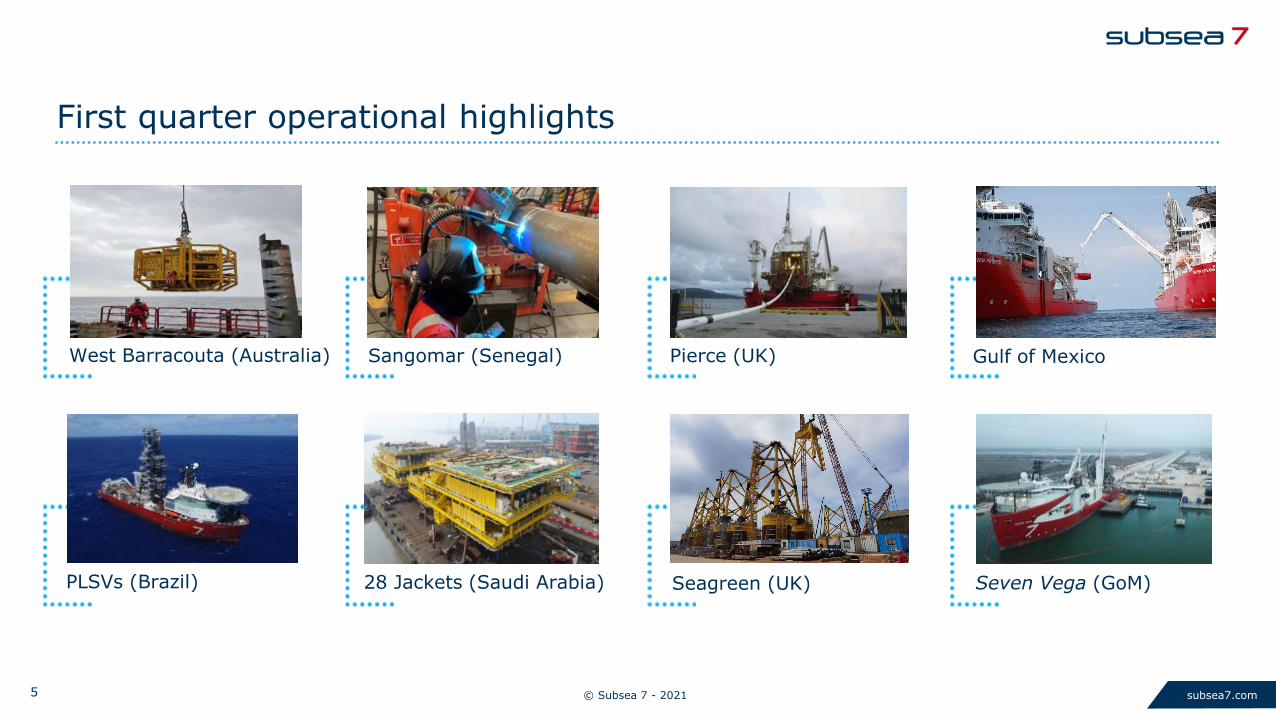
First quarter operational highlights
Pierce (UK)
Seven Vega (GoM)
Sangomar (Senegal)West Barracouta (Australia)
28 Jackets (Saudi Arabia) Seagreen (UK)
Gulf of Mexico
PLSVs (Brazil)

© Subsea 7 - 20216 subsea7.com
First quarter 2021 backlog
• Order intake• $0.6 billion new orders• $0.2 billion escalations
• 0.8 book-to-bill ratio
• Awards announced in Q1:• Sanha Lean Gas $150-300m• Northern Lights ~$50m• Subsea order $50-150m
Backlog of $6.0 billion, as at 31 March 2021
Order backlog includes: - $0.4 billion relating to long-term contracts for PLSVs in Brazil - approximately $20 million favourable foreign exchange movement

© Subsea 7 - 20217 subsea7.com
Q1 2021 – income statement summary
Three months ended
In $ millions, unless otherwise indicated31 March 2021
Unaudited31 March 2020
Unaudited
Revenue 996 751
Net operating loss (9) (49)
Income/(loss) before taxes 3 (33)
Taxation (2) (4)
Net income/(loss) 1 (38)
Adjusted EBITDA(1) 102 68
Adjusted EBITDA margin 10% 9%
Diluted earnings per share $ 0.01 (0.13)
Weighted average number of shares (millions) 298 299
(1) Adjusted EBITDA defined in Appendix

© Subsea 7 - 20218 subsea7.com
Q1 2021 – supplementary details
In $ millions
Three months ended
31 March 2021Unaudited
31 March 2020Unaudited
Administrative expenses (56) (63)
Depreciation, amortisation, mobilisation and impairment (111) (117)
Net operating loss (9) (49)
Net finance cost (5) (4)
Other gains and losses 16 20
Income/(Loss) before taxes 3 (33)
Taxation (2) (4)
Net income/(loss)(1) 1 (38)
(1) Q1 2021: $2m net income is attributable to shareholders of the parent company with a net loss of $1m attributable to non-controlling interests
© Subsea 7 - 20219 subsea7.com
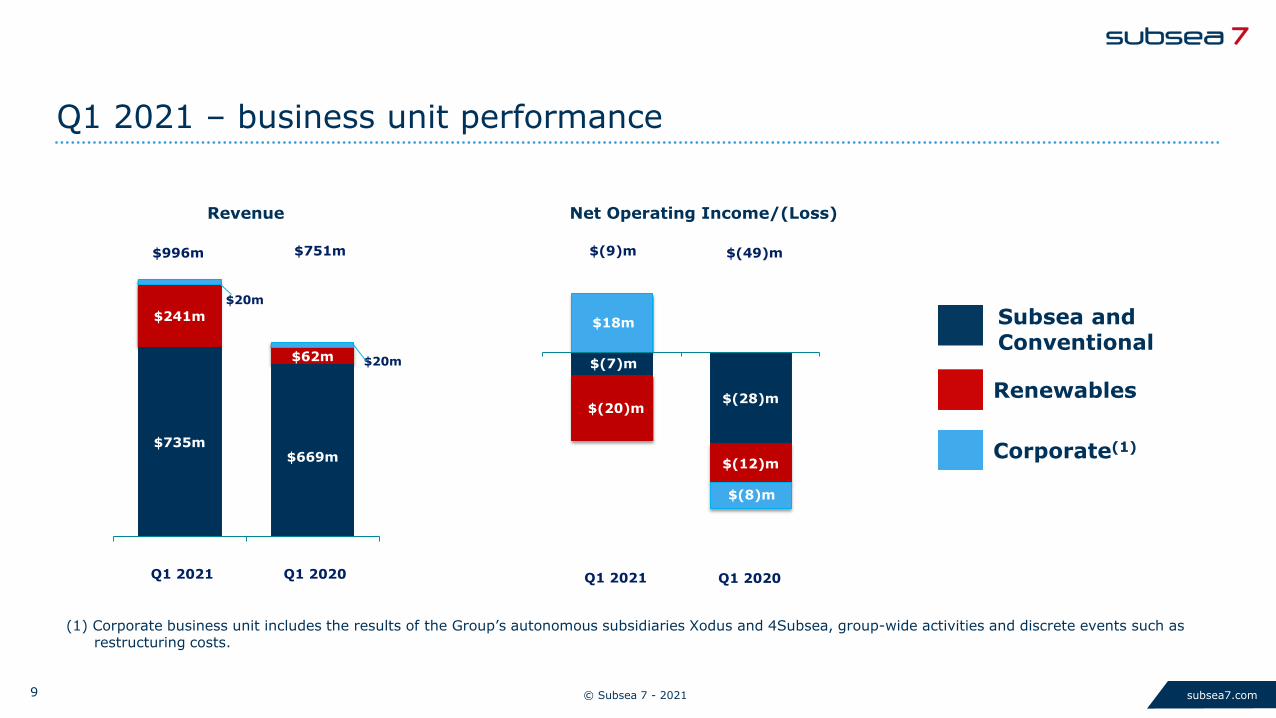
$(7)m
$(28)m$(20)m
$(12)m
$18m
$(8)m
$(9)m $(49)m
Net Operating Income/(Loss)
Q1 2021 – business unit performance
Subsea and Conventional
Renewables
Corporate(1)$735m$669m
$241m
$62m
$20m
$20m
Q1 2020Q1 2021
$996m
Revenue
$751m
Q1 2021 Q1 2020
(1) Corporate business unit includes the results of the Group’s autonomous subsidiaries Xodus and 4Subsea, group-wide activities and discrete events such as restructuring costs.
© Subsea 7 - 202110 subsea7.com
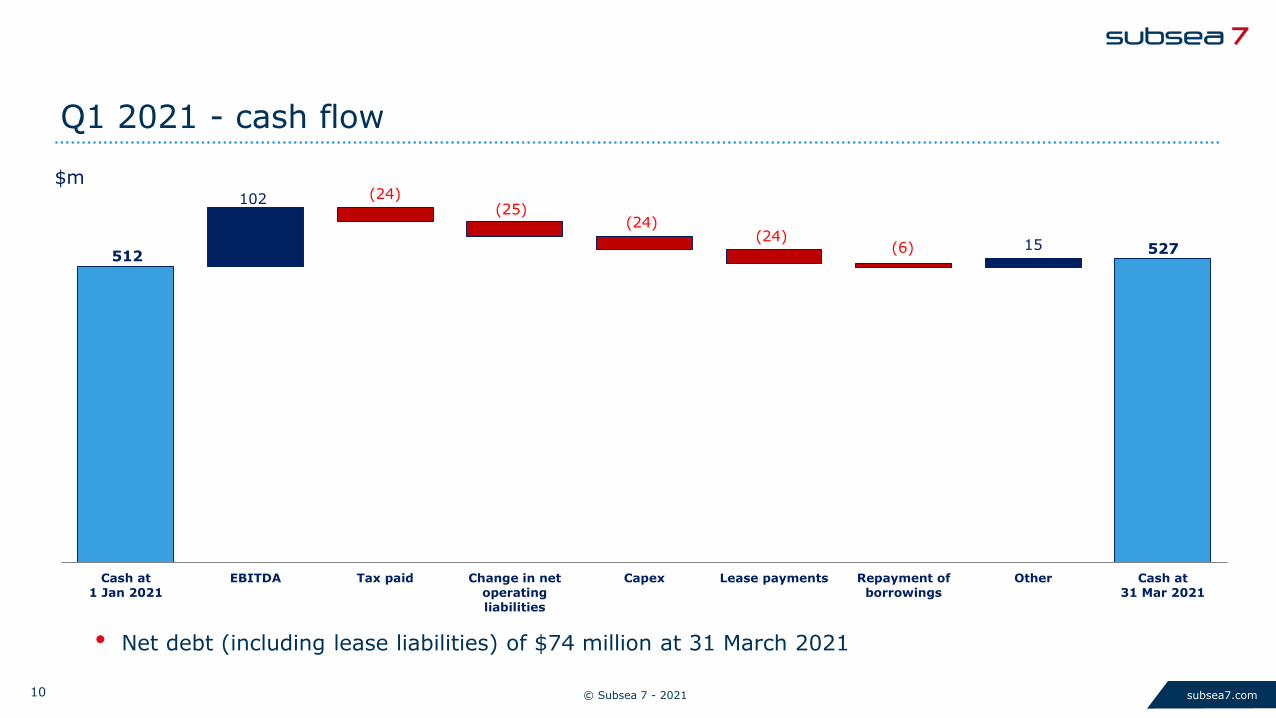
512
102 (24)(25)
(24)(24)
(6) 15 527
Cash at1 Jan 2021
EBITDA Tax paid Change in netoperatingliabilities
Capex Lease payments Repayment ofborrowings
Other Cash at31 Mar 2021
Q1 2021 - cash flow
• Net debt (including lease liabilities) of $74 million at 31 March 2021
$m

© Subsea 7 - 202111 subsea7.com
Capital allocation framework
• Balanced capital allocation strategy to protect and drive growth in shareholder value
• Re-investment in a disciplined manner− Investment in technology and digitalisation
remains a priority− Sufficient cash to fund working capital
requirements, to enable growth
• Prudent management of the balance sheet− Support the business through-cycle− Maintain flexibility to seize opportunities
• Return excess cash to shareholders− Approximately $2 billion returned in the last ten
years through special dividends and share repurchases
− Regular evaluation by Board of Directors based on outlook and strategic priorities
− Share repurchases authorised until April 2023
Cash flowfrom
operations
Investmentgrade credit
rating
Disciplinedreinvestment
Capitalreturns

© Subsea 7 - 202112 subsea7.com
Financial guidance - unchanged2021 Guidance
Revenue Higher than 2020
Adjusted EBITDA Higher than 2020
Net operating income Positive
Administrative expense $220 million - $240 million
Net finance cost $15 million - $20 million
Depreciation and amortisation $430 million - $450 million
Tax charge $30 million - $40 million
Capital expenditure $120 million - $140 million
• New business units from 1 January 2021:– Subsea and Conventional: comprising SURF and Conventional, and Life of Field– Renewables: excluding oil and gas activities (negligible in 2020)– Corporate: including Xodus and 4Subsea

© Subsea 7 - 202113 subsea7.com
The Subsea 7 Strategy
Energy Transition: Proactive Participation
• Early engagement and partnerships
• Systems innovation and enabling products
• Integrated SPS and SURF
• Digital delivery of projects andservices
Subsea Field of the Future: Systems and Delivery
• Renewables – offshore wind
• Oil and gas – lower carbon developments
• Emerging energy – new markets and opportunities
• Operations – sustainable and efficient

© Subsea 7 - 202114 subsea7.com
Energy Transition – emerging energy
Carbon Capture: Northern Lights• CO2 generated by cement and waste-to-
energy operations piped to a storage location in the North Sea, for permanent storage
• Initial capacity up to 1.5 million tonnes of CO2 per year
• Scheduled to be in operation in 2024• Subsea 7 scope
− Engineering, fabrication and installation of 100km CO2 pipeline from Øygarden to CO2 storage complex
− Installation of umbilicals, tie-in and pre-commissioning activities
Source: Equinor

© Subsea 7 - 202115 subsea7.com
Energy Transition – renewables
Floating wind: Salamander• Pre-commercial size, “stepping-stone”
project up to 200MW• Offshore north-east coast Scotland• 35km from shore, 75-110m water• Preliminary technology selection based on
maximising Scottish supply chain content• Aiming to participate in the CFD round in
2025• Subsea 7 a minority shareholder

© Subsea 7 - 202116 subsea7.com
Outlook: global prospects
• Subsea and Conventional• Brazil accelerating• Gulf of Mexico active• Norway busy with early
engagement• Fewer prospects in UK,
Asia, Middle East
• Renewables• Active in the three main
regions including the US
Africa• Aker Energy Pecan (i,f)• ENI Rovuma (f)• Total CLOV 3, Begonia
South America• Petrobras Mero 3, 4; Búzios
6,7,8; riser replacements; PLSVs • Equinor Bacalhau (i,f); BMC-33 (i)• Shell Gato do Mato• Total Lapa SW (i)
Australia• Woodside Scarborough (i,f)• Chevron Jansz-Io Compression
Canada and USA• Ørsted Ocean Wind, Skipjack (w)• Shell & EDPR Mayflower (w)• Equinor Empire (w)• Dominion Energy Coastal Virginia (w)• Shell Whale• Total North Platte• Equinor Bay du Nord (i)
Europe• Iberdrola East Anglia Hub (w)• Red Rock Inch Cape (w)• EDPR Moray West (w)• Shell Jackdaw, Ormen Lange Phase III (i)• AkerBP Future subsea portfolio• Equinor Future subsea portfolio• OKEA Hasselmus (i)
Middle East & Asia• RWE Chu Feng(w)• NOC Qatar Gallaf• Saudi Aramco Zuluf
(i) Integrated SURF-SPS, (w) offshore wind, (f) FEED already awarded, Subsea 7 is preferred EPCI supplier

© Subsea 7 - 202117 subsea7.com
Summary: delivering on a diversified energy services strategy
• Strong balance sheet with net cash of $74 million and liquidity in excess of $1 billion
• Robust, diversified backlog of $6.0 billion− 30% of backlog in offshore wind− Good visibility on 2021 with a backlog for
execution this year of $3.4 billion
• Tendering activity increasing in key areas− Pace of new oil and gas awards to the industry
expected to increase in the coming months resulting in higher offshore activity from late 2023
− Increased tendering for US offshore wind projects
• Strategy in place to capitalise on a recovery in oil and gas as well as continued high growth in offshore wind and carbon capture
Seven Navica and Seven Seas working in the Gulf of Mexico

© Subsea 7 - 202118 subsea7.com

© Subsea 7 - 202119 subsea7.com
AppendixMajor project progressionTrack recordFleetFinancial summaries

© Subsea 7 - 202120 subsea7.com
Major project progression
• Continuing projects >$100m between 5% and 95% complete as at 31 March 2021 excluding PLSV and Life of Field day-rate contracts
Sizeable ($50-$150m)
Substantial($150-$300m)
Large($300-$500m)
Very Large($500-$750m)
Major(Over $750m)
Announced size of project
0% 10% 20% 30% 40% 50% 60% 70% 80% 90% 100%
Arran (United Kingdom)Nova (Norway)
3 PDMs (Saudi Arabia)Manuel (USA)
Jubilee Turret Remediation (Africa)Ichalkil, Pokoch - Phase I (USA)
Buzzard Phase 2 (UK)Mad Dog Phase 2 (USA)
Penguins Redevelopment (UK)Blythe & Vulcan Satellite Hubs (UK)Yunlin Offshore Wind Farm (Taiwan)
Bacalhau (Brazil)Julimar Phase 2 Development (Australia)
Ærfugl phase 2 (Norway)T&I Formosa 2 OWF (Taiwan)
Vito Construction (USA)Johan Sverdrup Phase II (Norway)
Berri/Zuluf (Saudi Arabia)King's Quay (USA)
28 Jackets (Saudi Arabia)Seagreen OWF (UK)Sangomar (Senegal)
Hornsea 2 (UK)Barossa (Australia)
Hollandse Kust Zuid I-IV (Netherlands)

© Subsea 7 - 202121 subsea7.com
Track record – over 1,000 projects delivered worldwide
• Shearwater, Shell• Buzzard ph. 2,
CNOOC• Culzean, Maersk• Alligin, BP• Penguins, Shell• Snorre, Equinor • Katmai, Fieldwood
• Vito, Shell• Mad Dog 2, BP• TVEX, US Gulf of
Mexico• Manuel, BP
• PLSVs, Petrobras• Guará-Lula, Petrobras• BC-10, Shell• Lapa NE, Total
• Zinia Phase 2, Total• WDDM 9b, Burullus• West Nile Delta Phase 2, BP• PUPP, Mobil Producing Nigeria• OCTP, offshore Ghana• Sangomar, Woodside
• EPRS, INPEX/Chevron• G1/G15, Oil & Natural Gas Corp.• Gorgon, Chevron• Scarborough, Woodside• Sole, Cooper• West Barracouta, Exxon Mobil
• Aasta Hansteen, Statoil• Maria, Wintershall• IRM Services, Equinor
• Beatrice wind farm• Borkum II, Trianel• Seagreen, SWEL
• Al-Khalij, Total• Hasbah, in consortium with L&T• 3 Gas Production Platforms, Saudi
Aramco
• IRM Services, BP

© Subsea 7 - 202122 subsea7.com
Fleet – 29 active vessels at the end of Q1 2021
Long-term charter from a vessel-owning joint venture
Stacked
Chartered from a third party
Seven Antares and Seven Inagha are owned by Subsea 7’s Nigerian joint venture.
© Subsea 7 - 202123 subsea7.com
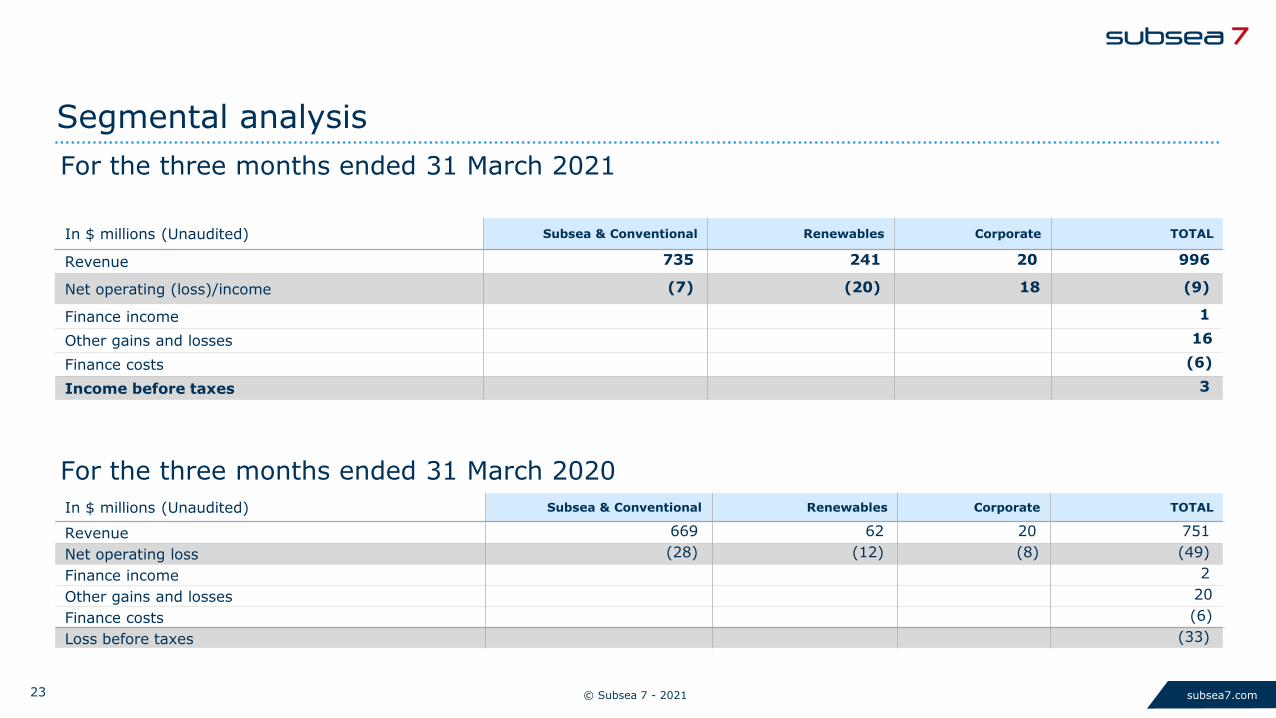
In $ millions (Unaudited) Subsea & Conventional Renewables Corporate TOTAL
Revenue 669 62 20 751Net operating loss (28) (12) (8) (49)Finance income 2Other gains and losses 20Finance costs (6)Loss before taxes (33)
In $ millions (Unaudited) Subsea & Conventional Renewables Corporate TOTAL
Revenue 735 241 20 996
Net operating (loss)/income (7) (20) 18 (9)
Finance income 1
Other gains and losses 16
Finance costs (6)
Income before taxes 3
Segmental analysis
For the three months ended 31 March 2020
For the three months ended 31 March 2021

© Subsea 7 - 202124 subsea7.com
In $ millions31 Mar 2021
Unaudited31 Dec 2020
Audited
Assets
Non-current assets
Goodwill 86 85
Property, plant and equipment 3,928 3,983
Right-of-use asset 212 213
Other non-current assets 189 181
Total non-current assets 4,415 4,462
Current assets
Trade and other receivables 545 591
Construction contracts - assets 515 471
Other accrued income and prepaidexpenses 204 198
Cash and cash equivalents 527 512
Other current assets 69 63
Total current assets 1,860 1,835
Total assets 6,275 6,297
Summary Balance sheet
In $ millions31 Mar 2021
Unaudited31 Dec 2020
Audited
Equity & Liabilities
Total equity 4,269 4,255
Non-current liabilities
Non-current portion of borrowings 158 184
Non-current lease liabilities 171 169
Other non-current liabilities 125 138
Total non-current liabilities 454 491
Current liabilities
Trade and other liabilities 1,067 982
Current portion of borrowings 45 25
Current lease liabilities 80 85
Construction contracts – liabilities 210 280
Deferred revenue 2 2
Other current liabilities 148 177
Total current liabilities 1,552 1,551
Total liabilities 2,006 2,042
Total equity & liabilities 6,275 6,297

© Subsea 7 - 202125 subsea7.com
Reconciliation of adjusted EBITDA
For the period (in $millions)Three Months Ended 31 March 2021
UnauditedThree Months Ended 31 March 2020
Unaudited
Net income/(loss) 1 (38)
Depreciation, amortisation, mobilisation and impairment 111 117
Finance income (1) (2)
Other gains and losses (16) (20)
Finance costs 6 6
Taxation 2 4
Adjusted EBITDA 102 68
Revenue 996 751
Adjusted EBITDA % 10% 9%
Net income/(loss) to Adjusted EBITDA
Net operating loss to Adjusted EBITDA
For the period (in $millions)Three Months Ended 31 March 2021
UnauditedThree Months Ended 31 March 2020
Unaudited
Net operating loss (9) (49)
Depreciation, amortisation, mobilisation and impairment 111 117
Adjusted EBITDA 102 68
Revenue 996 751
Adjusted EBITDA % 10% 9%
© Subsea 7 - 202126 subsea7.com
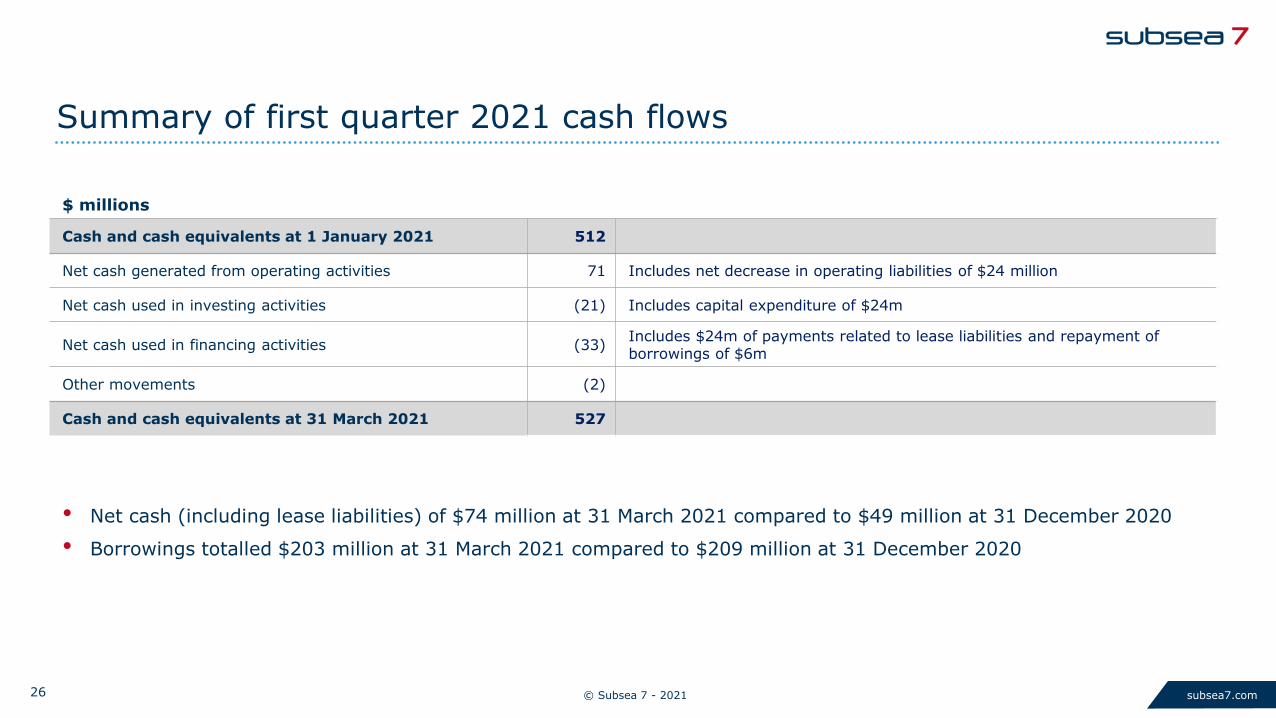
Summary of first quarter 2021 cash flows
$ millions
Cash and cash equivalents at 1 January 2021 512
Net cash generated from operating activities 71 Includes net decrease in operating liabilities of $24 million
Net cash used in investing activities (21) Includes capital expenditure of $24m
Net cash used in financing activities (33) Includes $24m of payments related to lease liabilities and repayment of borrowings of $6m
Other movements (2)
Cash and cash equivalents at 31 March 2021 527
• Net cash (including lease liabilities) of $74 million at 31 March 2021 compared to $49 million at 31 December 2020
• Borrowings totalled $203 million at 31 March 2021 compared to $209 million at 31 December 2020

© Subsea 7 - 202127 subsea7.com
Top Related