


Languages
Pages
Legal


Fines Content Correction Factors for SPT N Values – Liquefaction Resistance
Correlation
Marawan ShahienProfessor of Geotechnical Engineering & Foundations
Stuctural Engineering Department
Tanta University, Tanta, Egypt

Content
• Introduction• Liquefaction Resistance – SPT N Correlations• Existing Fines Content Correction Factors
• Motivation and Aim of the Paper
• Proposed Correction Factors: Methodology
• Influence of FC on (N1)60
• Influence of FC on CRR
• Influence of FC on CRR-(N1)60
• Proposed Relationship
• Concluding Remarks
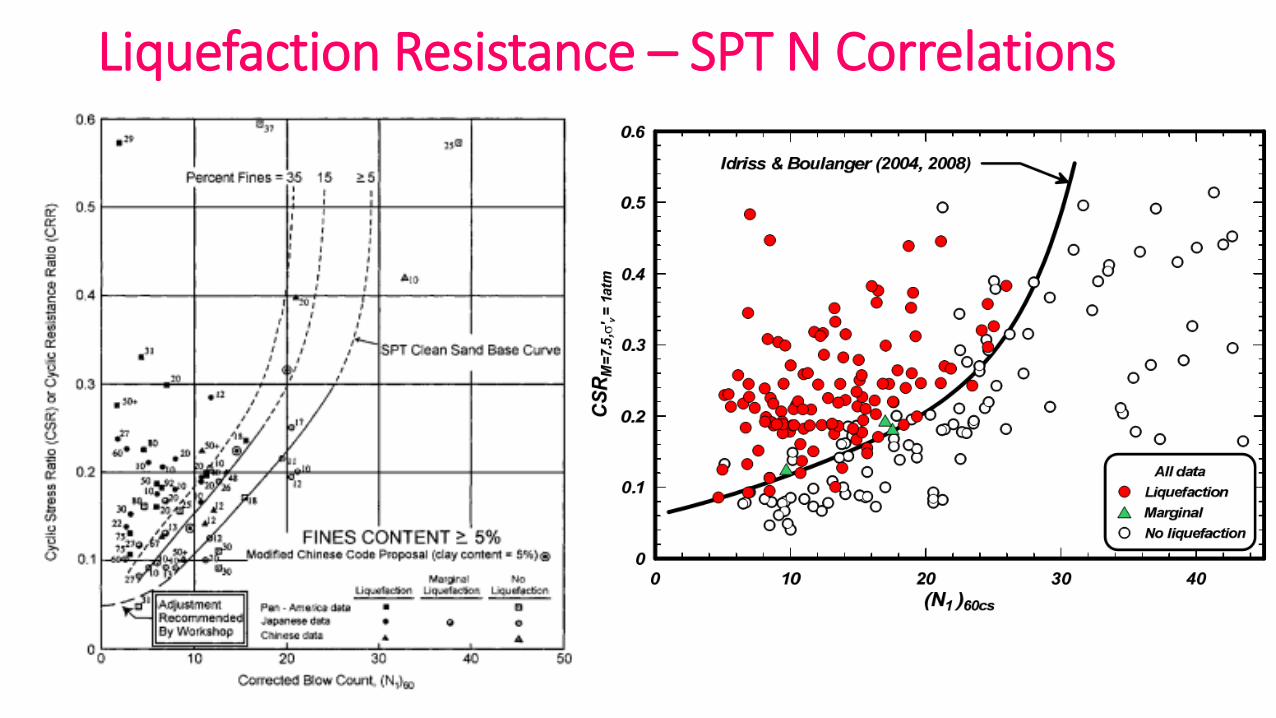
Liquefaction Resistance – SPT N Correlations
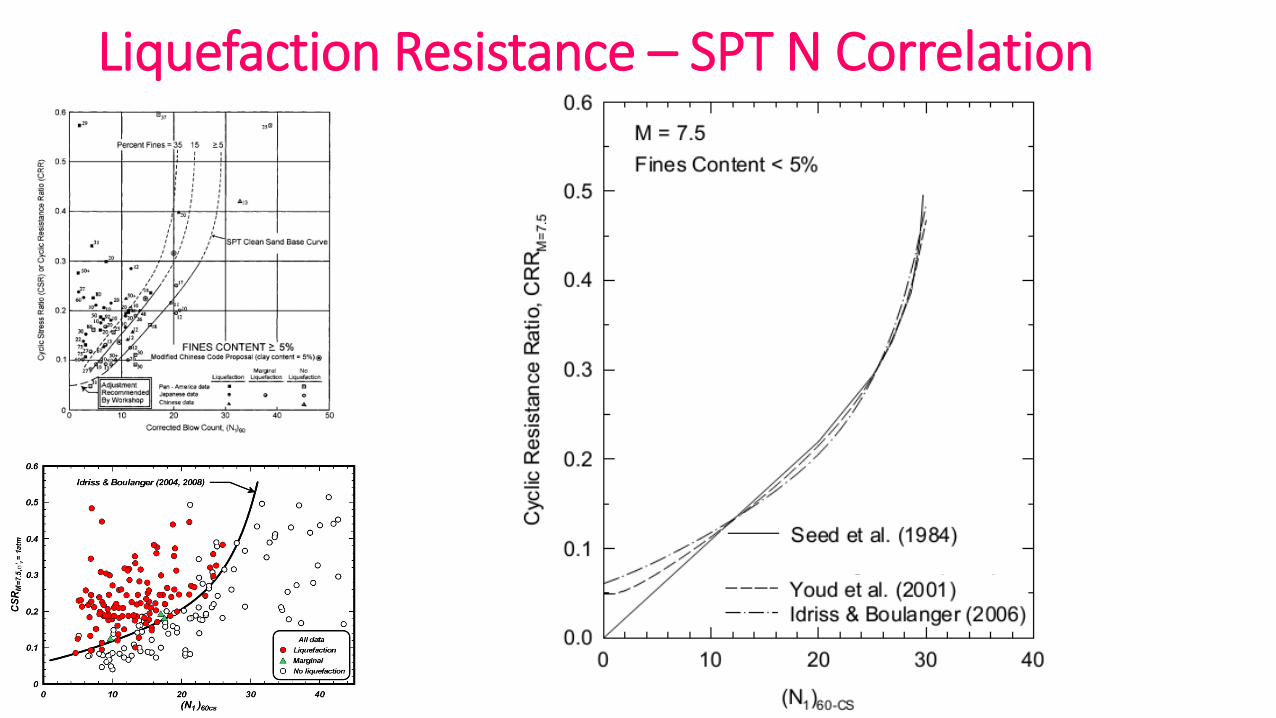
Liquefaction Resistance – SPT N Correlation
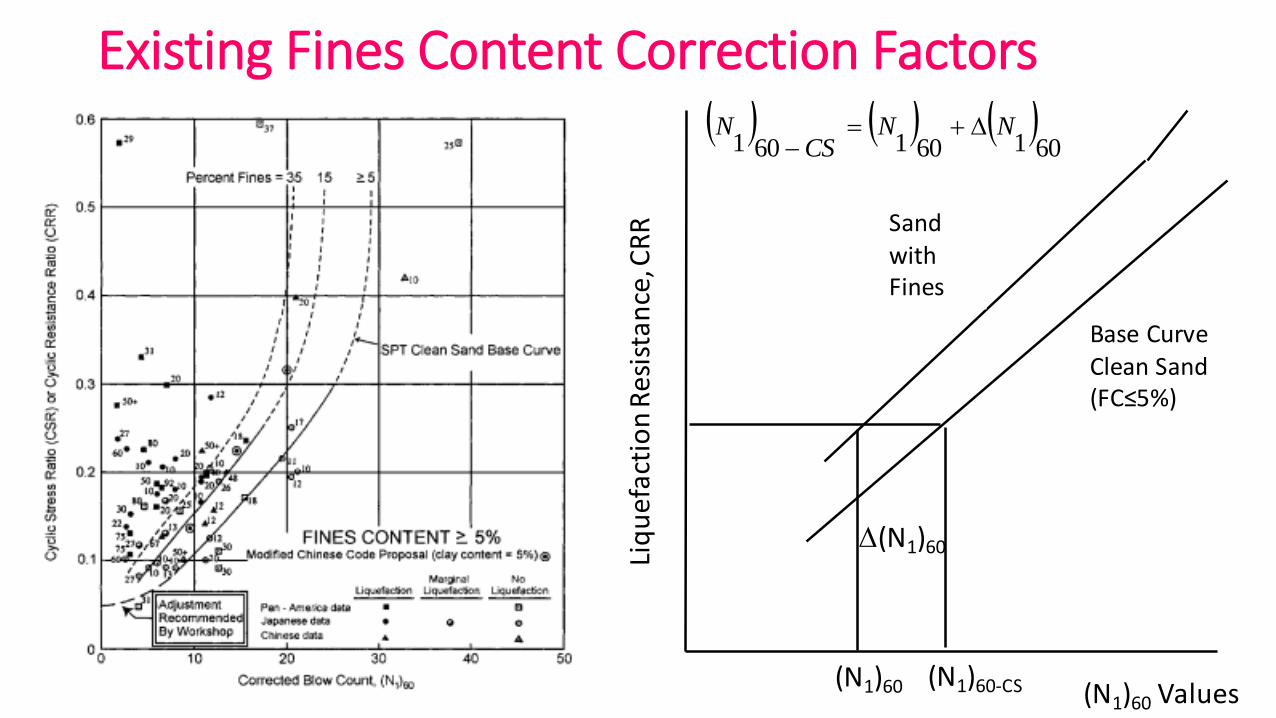
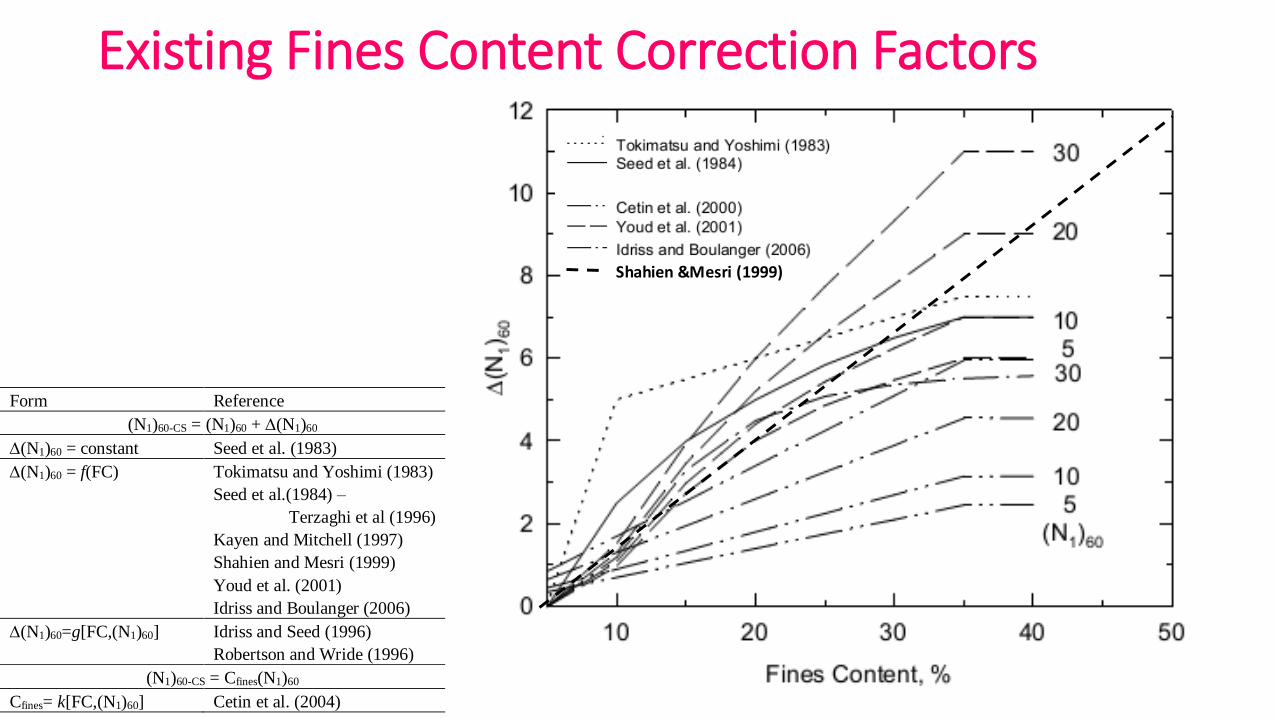
Existing Fines Content Correction Factors
Liq
uef
act
ion
Res
ista
nce
, CR
R
Base Curve Clean Sand (FC≤5%)
Sand with Fines
(N1)60 Values
D(N1)60
(N1)60-CS(N1)60
601601601
NNCS
N D
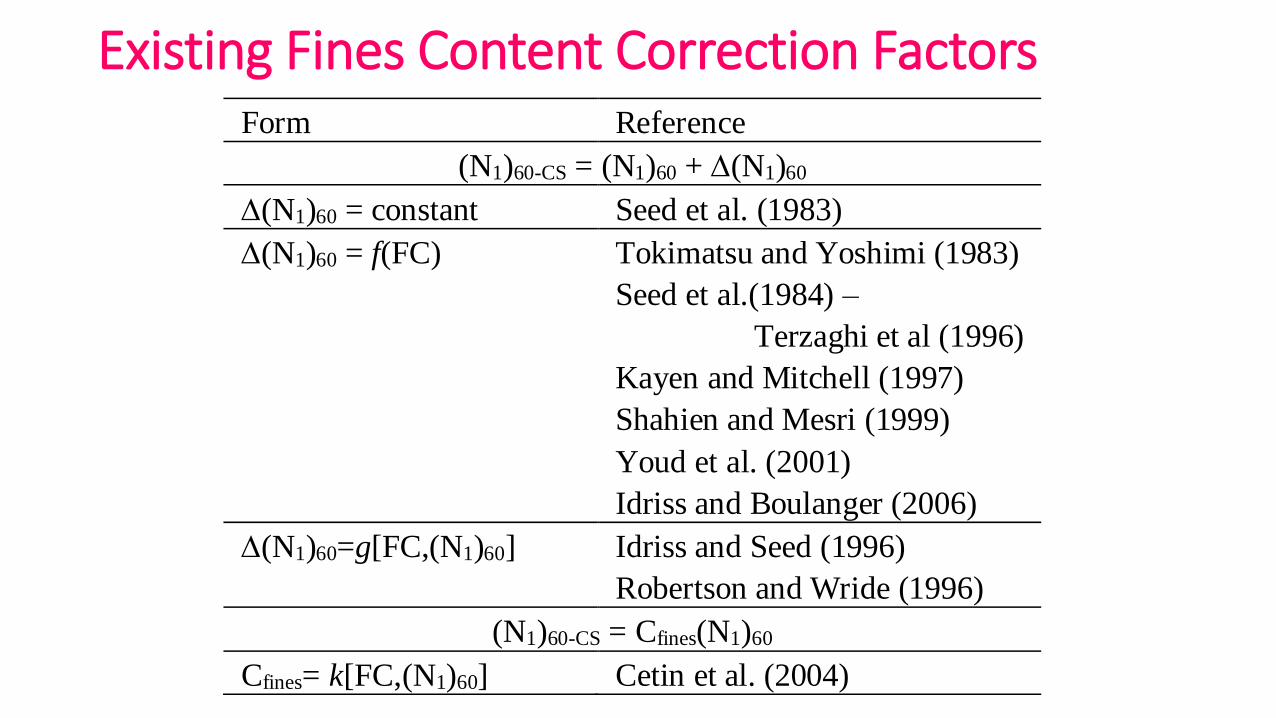
Existing Fines Content Correction FactorsForm Reference
(N1)60-CS = (N1)60 + D(N1)60
D(N1)60 = constant Seed et al. (1983)
D(N1)60 = f(FC) Tokimatsu and Yoshimi (1983)
Seed et al.(1984) –
Terzaghi et al (1996)
Kayen and Mitchell (1997)
Shahien and Mesri (1999)
Youd et al. (2001)
Idriss and Boulanger (2006)
D(N1)60=g[FC,(N1)60] Idriss and Seed (1996)
Robertson and Wride (1996)
(N1)60-CS = Cfines(N1)60
Cfines= k[FC,(N1)60] Cetin et al. (2004)
Existing Fines Content Correction Factors
Form Reference
(N1)60-CS = (N1)60 + D(N1)60
D(N1)60 = constant Seed et al. (1983)
D(N1)60 = f(FC) Tokimatsu and Yoshimi (1983)
Seed et al.(1984) –
Terzaghi et al (1996)
Kayen and Mitchell (1997)
Shahien and Mesri (1999)
Youd et al. (2001)
Idriss and Boulanger (2006)
D(N1)60=g[FC,(N1)60] Idriss and Seed (1996)
Robertson and Wride (1996)
(N1)60-CS = Cfines(N1)60
Cfines= k[FC,(N1)60] Cetin et al. (2004)
Shahien &Mesri (1999)

Motivation and Aim of the Paper
Green et al. (2006)
examined FC correction factors
used 98 case records of SPT N
with liquefaction/no liquefaction
14 earthquakes
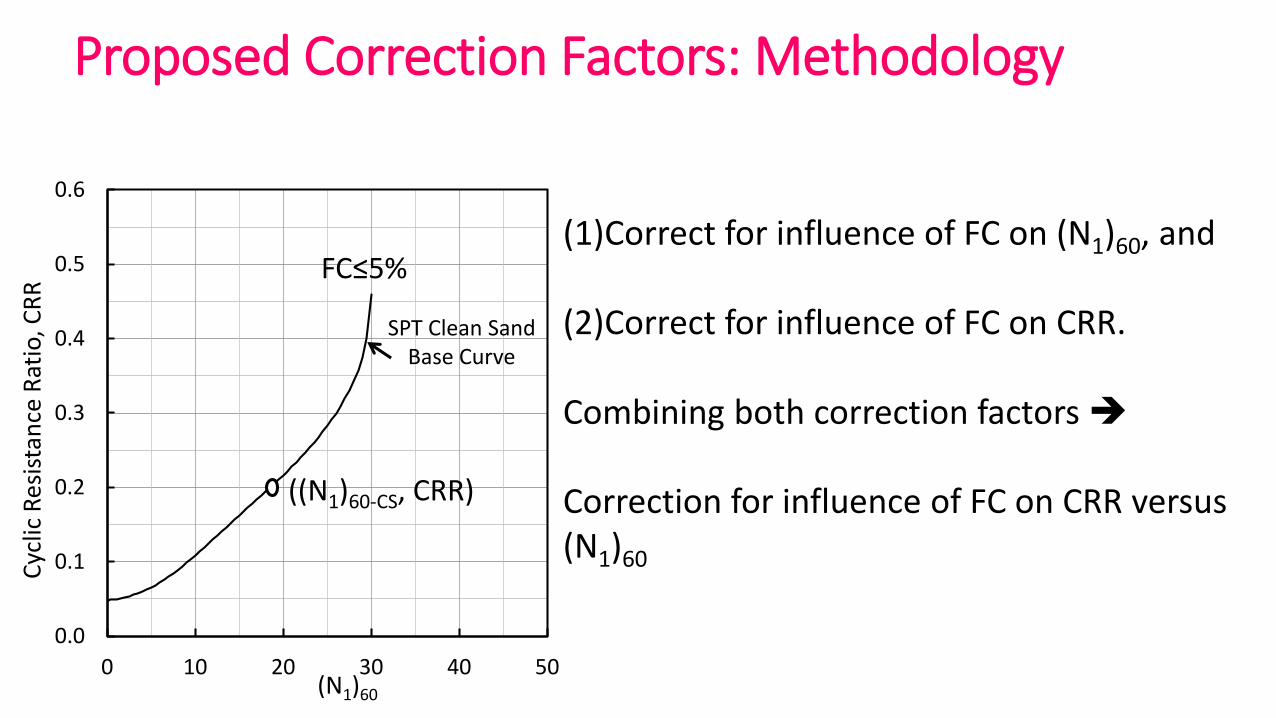
Proposed Correction Factors: Methodology
(1)Correct for influence of FC on (N1)60, and
(2)Correct for influence of FC on CRR.
Combining both correction factors
Correction for influence of FC on CRR versus (N1)60
0.0
0.1
0.2
0.3
0.4
0.5
0.6
0 10 20 30 40 50
Cyc
lic R
esis
tan
ce R
atio
, CR
R
(N1)60
FC≤5%
SPT Clean Sand Base Curve
((N1)60-CS, CRR)
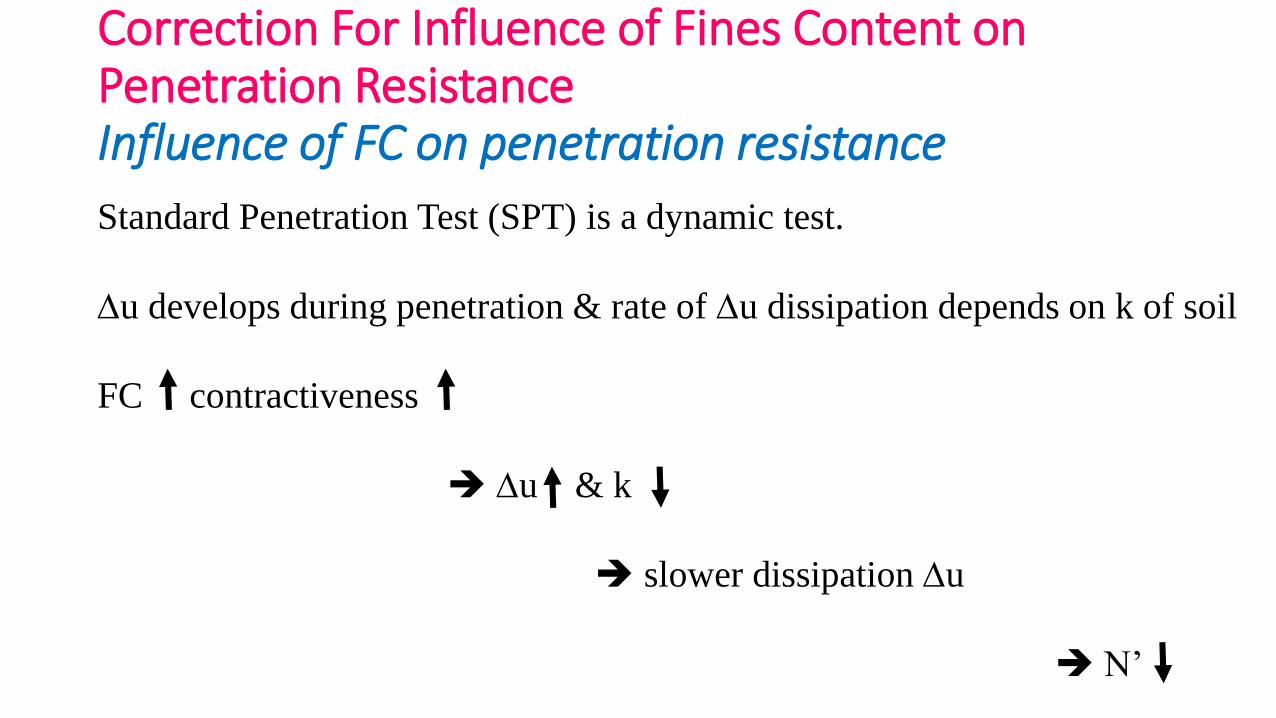
Correction For Influence of Fines Content on Penetration ResistanceInfluence of FC on penetration resistance
Standard Penetration Test (SPT) is a dynamic test.
Du develops during penetration & rate of Du dissipation depends on k of soil
FC contractiveness
Du & k
slower dissipation Du
N’
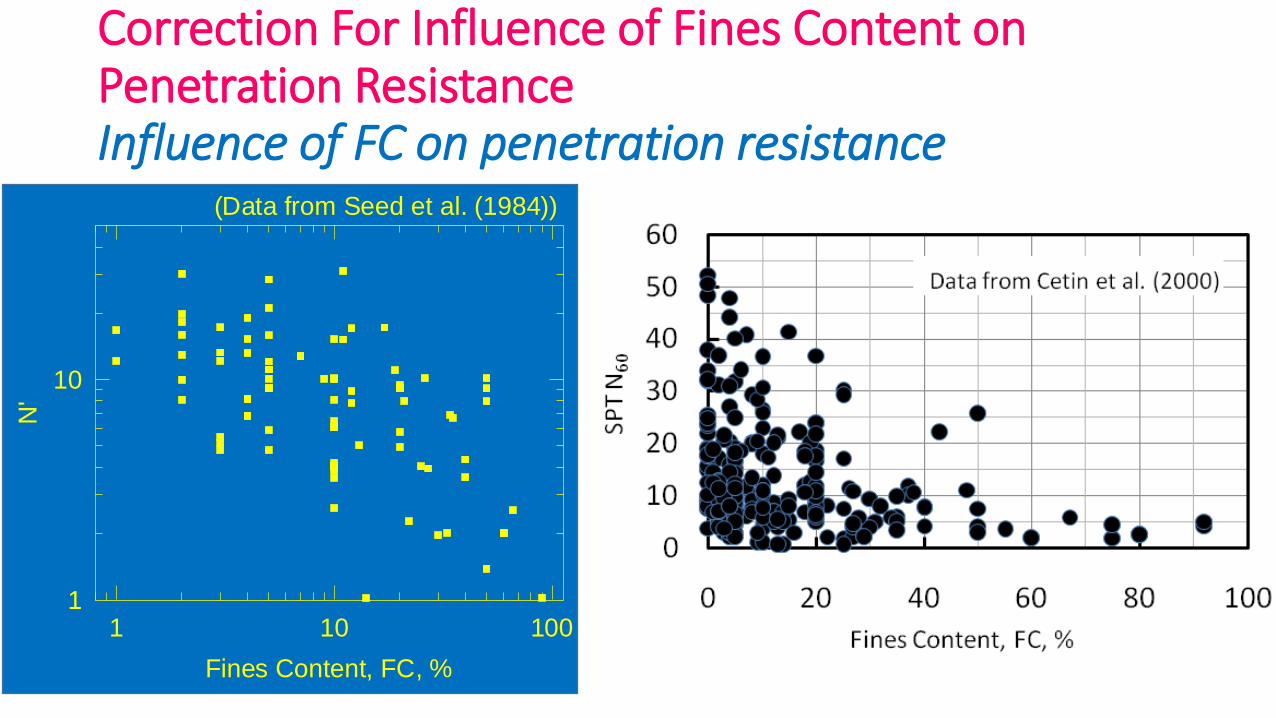
Correction For Influence of Fines Content on Penetration ResistanceInfluence of FC on penetration resistance
Fines Content, FC, %
1 10 100
N'
1
10
(Data from Seed et al. (1984))
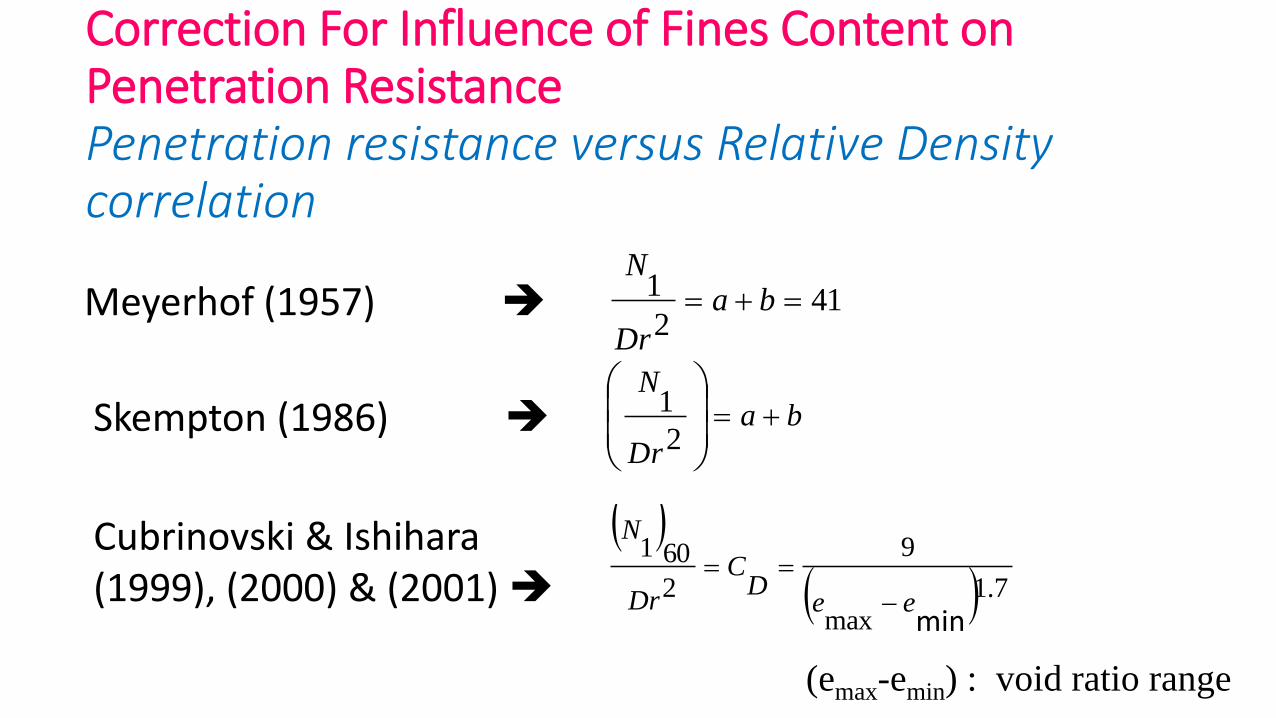
Correction For Influence of Fines Content on Penetration ResistancePenetration resistance versus Relative Density correlation
Meyerhof (1957) 412
1 ba
Dr
N
Skempton (1986) ba
Dr
N
2
1
Cubrinovski & Ishihara (1999), (2000) & (2001)
7.1
maxmax
9
2
601
eeD
C
Dr
N
(emax-emin) : void ratio range
min
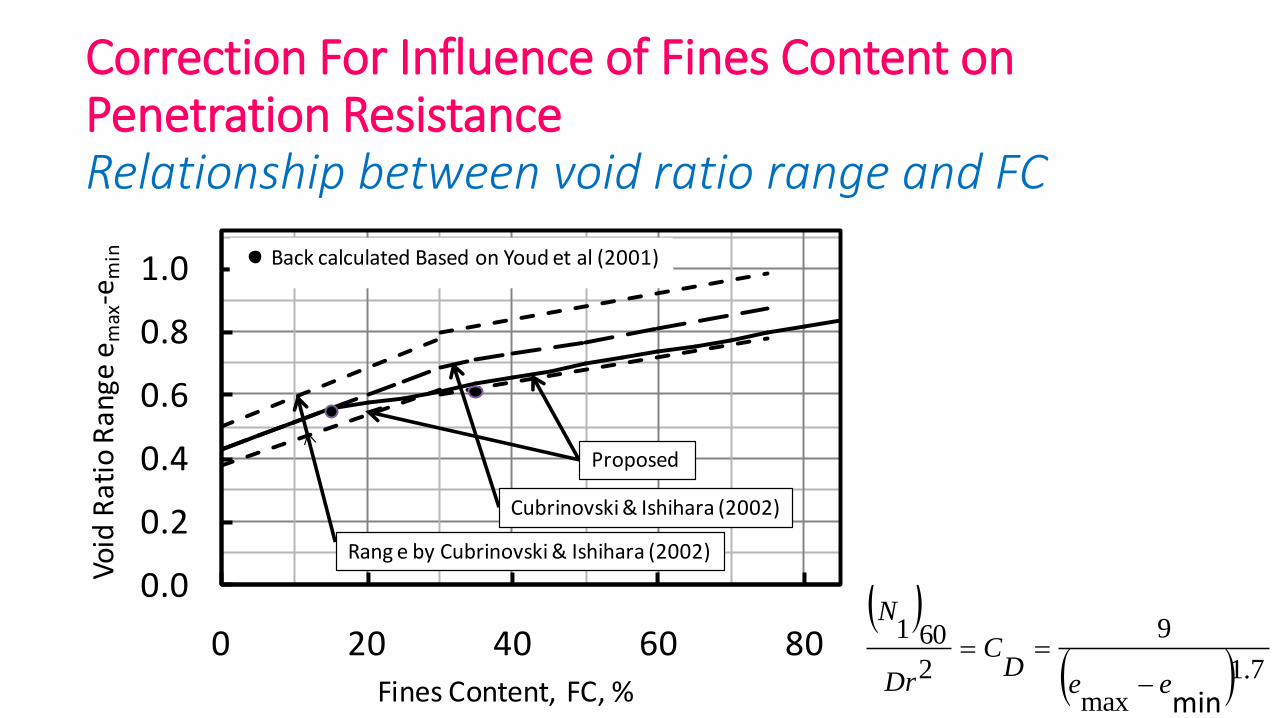
Correction For Influence of Fines Content on Penetration ResistanceRelationship between void ratio range and FC
0.0
0.2
0.4
0.6
0.8
1.0
0 20 40 60 80
Vo
id R
atio
Ran
ge e
max
-em
in
Fines Content, FC, %
Rang e by Cubrinovski & Ishihara (2002)
Cubrinovski & Ishihara (2002)
Proposed
Back calculated Based on Youd et al (2001)
7.1
maxmax
9
2
601
eeD
C
Dr
N
min
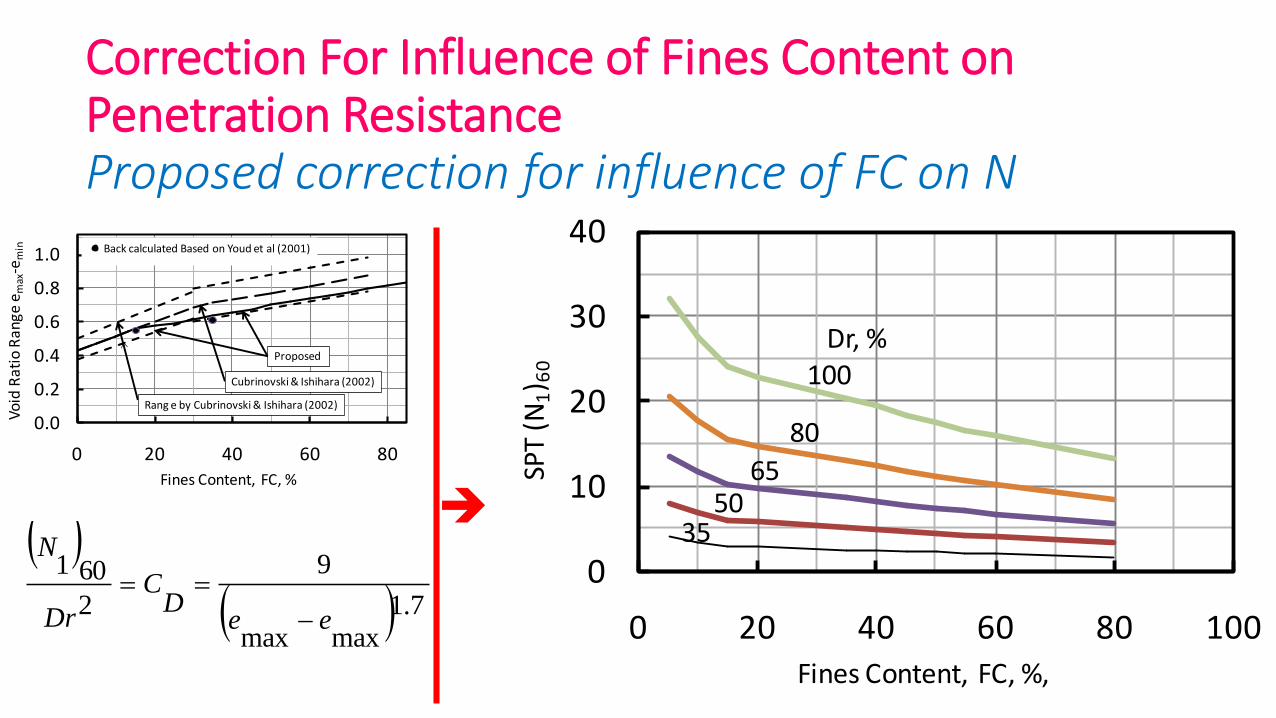
Correction For Influence of Fines Content on Penetration ResistanceProposed correction for influence of FC on N
0.0
0.2
0.4
0.6
0.8
1.0
0 20 40 60 80
Vo
id R
atio
Ran
ge e
max
-em
in
Fines Content, FC, %
Rang e by Cubrinovski & Ishihara (2002)
Cubrinovski & Ishihara (2002)
Proposed
Back calculated Based on Youd et al (2001)
7.1
maxmax
9
2
601
eeD
C
Dr
N
0
10
20
30
40
0 20 40 60 80 100
SPT
(N1) 6
0
Fines Content, FC, %,
Dr, %100
80
6550
35
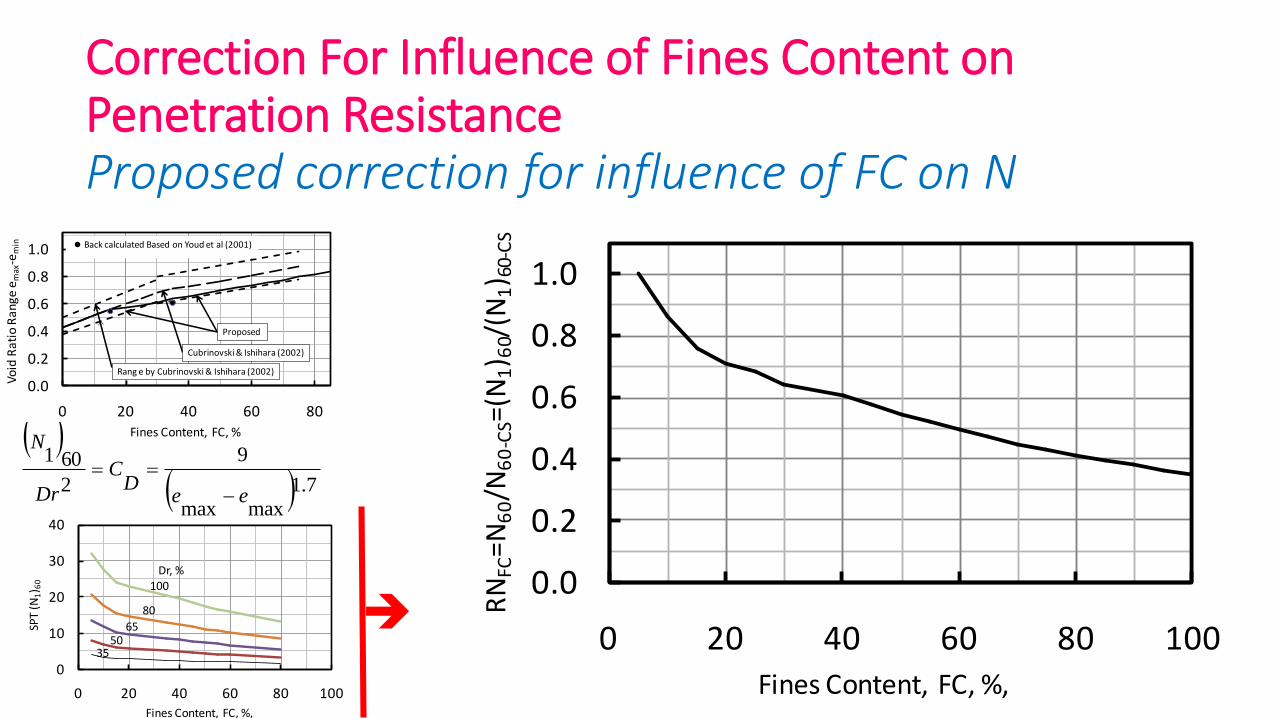
0.0
0.2
0.4
0.6
0.8
1.0
0 20 40 60 80 100
RN
FC=N
60/N
60
-CS=
(N1) 6
0/(N
1) 6
0-C
S
Fines Content, FC, %,
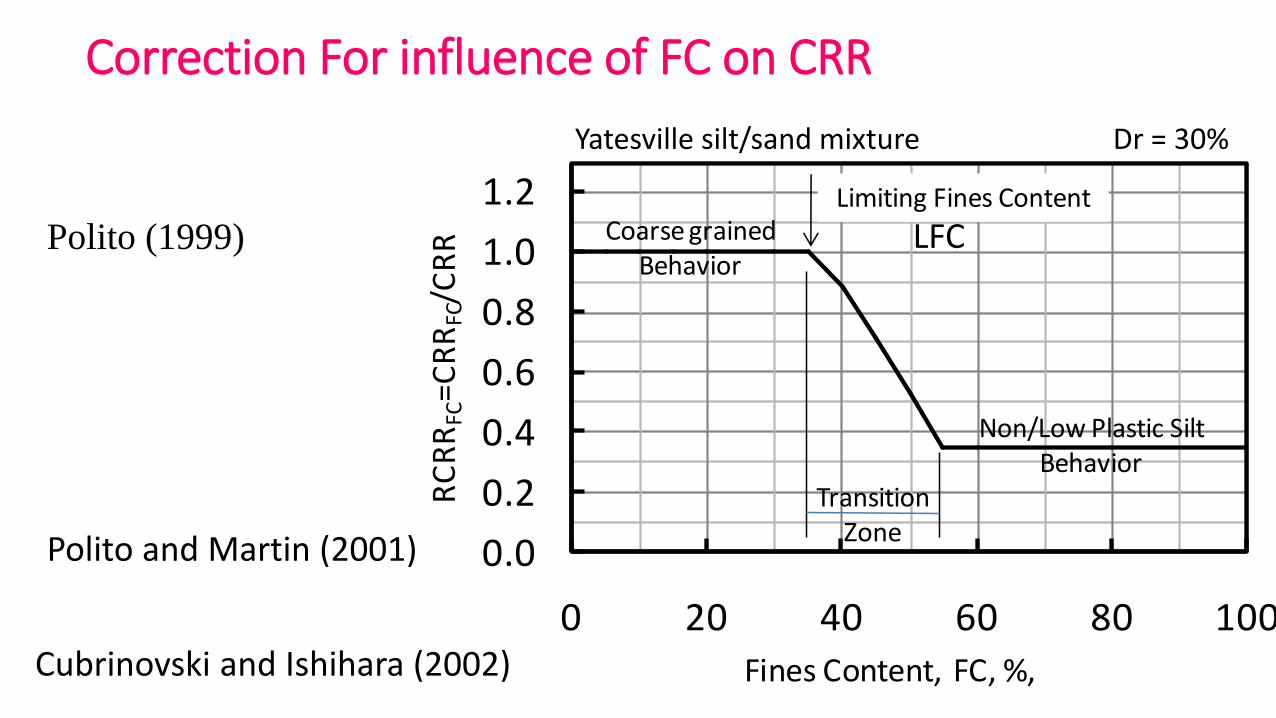
Correction For influence of FC on CRR
0.0
0.2
0.4
0.6
0.8
1.0
1.2
0 20 40 60 80 100
RC
RR
FC=C
RR
FC/C
RR
Fines Content, FC, %,
Limiting Fines Content
Transition Zone
Non/Low Plastic Silt Behavior
Coarse grained Behavior
Polito (1999)
Polito and Martin (2001)
LFC
Cubrinovski and Ishihara (2002)
Yatesville silt/sand mixture Dr = 30%
0.0
0.1
0.2
0.3
0.4
0.5
0.6
0 10 20 30 40 50
Cyc
lic R
esis
tan
ce R
atio
, CR
R
(N1)60
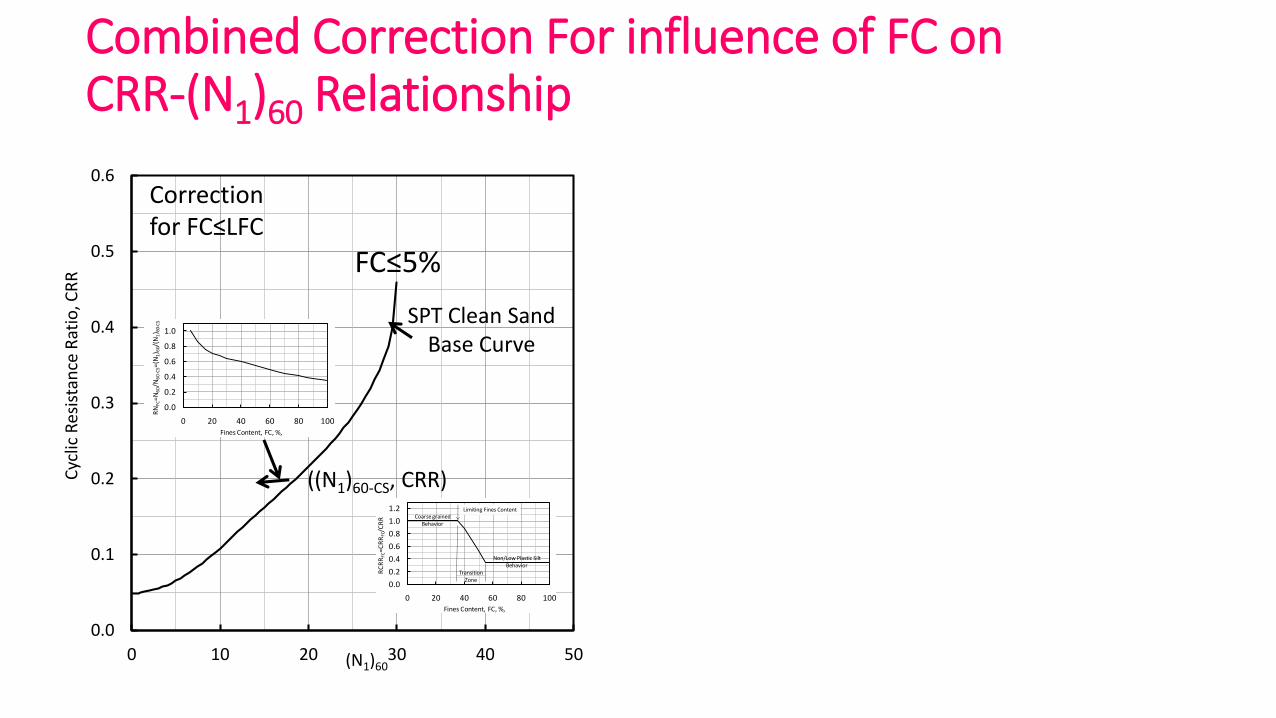
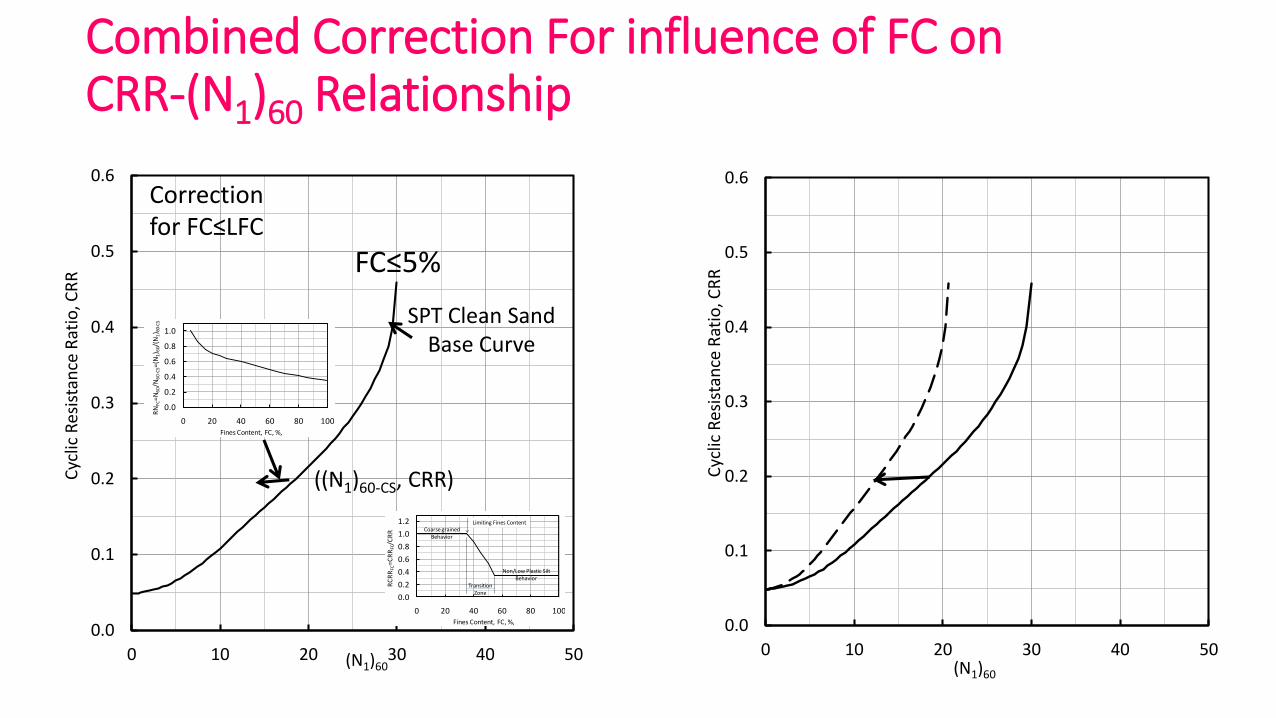
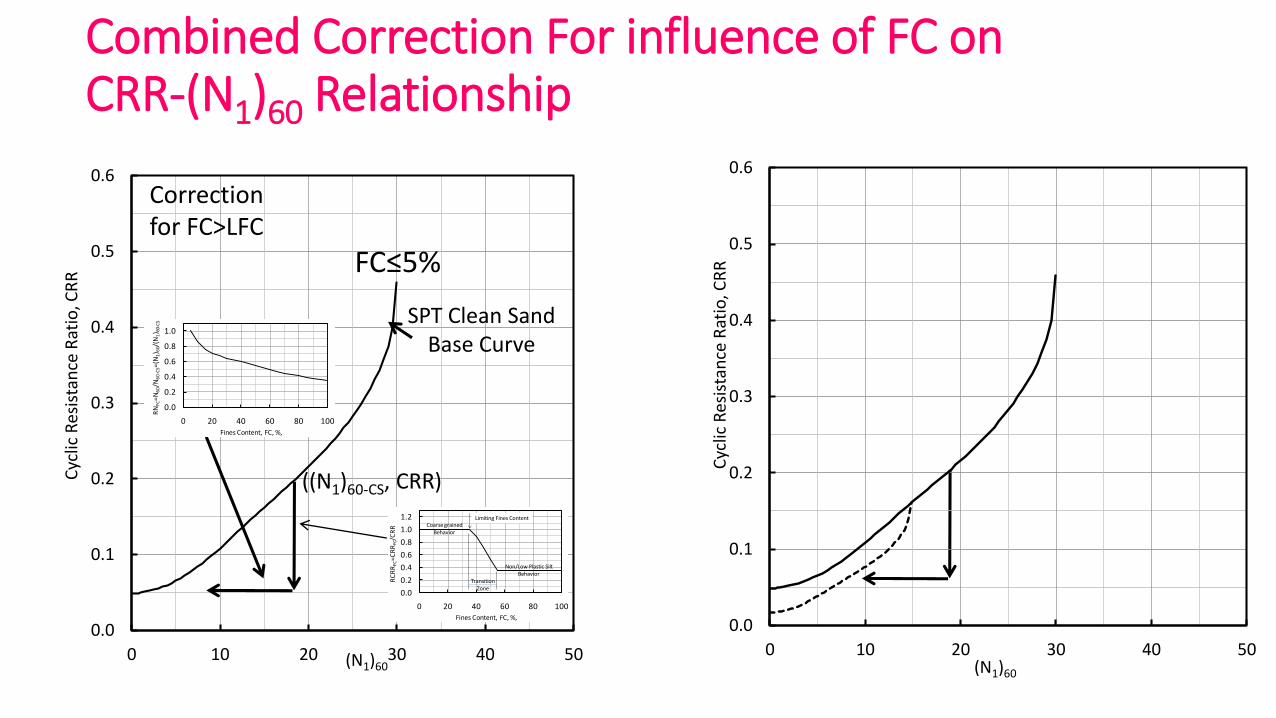
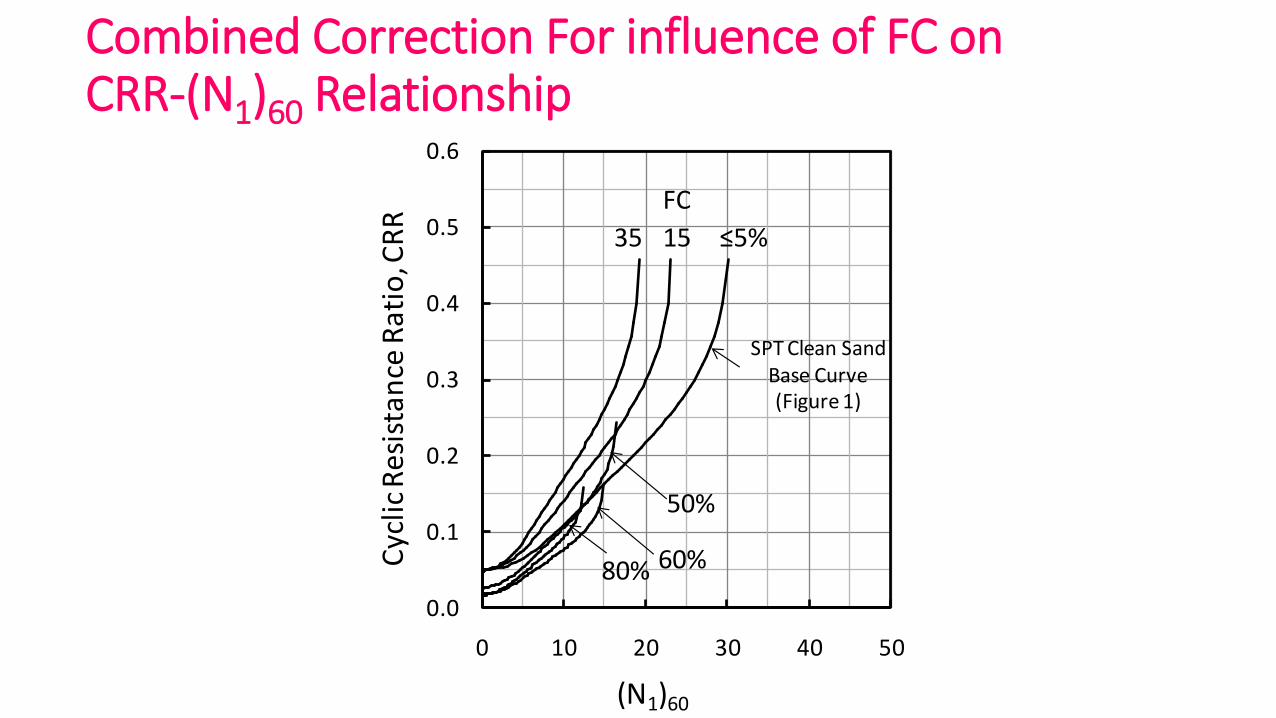
Combined Correction For influence of FC on CRR-(N1)60 Relationship
FC≤5%
SPT Clean Sand Base Curve
Correction for FC≤LFC
0.0
0.2
0.4
0.6
0.8
1.0
1.2
0 20 40 60 80 100
RC
RR
FC=C
RR
FC/C
RR
Fines Content, FC, %,
Limiting Fines Content
Transition Zone
Non/Low Plastic Silt Behavior
Coarse grained Behavior
0.0
0.2
0.4
0.6
0.8
1.0
0 20 40 60 80 100
RN
FC=
N6
0/N
60
-CS=
(N1) 6
0/(N
1) 6
0-C
S
Fines Content, FC, %,
((N1)60-CS, CRR)
0.0
0.1
0.2
0.3
0.4
0.5
0.6
0 10 20 30 40 50
Cyc
lic R
esis
tan
ce R
atio
, CR
R
(N1)60
Combined Correction For influence of FC on CRR-(N1)60 Relationship
FC≤5%
SPT Clean Sand Base Curve
Correction for FC≤LFC
0.0
0.2
0.4
0.6
0.8
1.0
1.2
0 20 40 60 80 100
RC
RR
FC=C
RR
FC/C
RR
Fines Content, FC, %,
Limiting Fines Content
Transition Zone
Non/Low Plastic Silt Behavior
Coarse grained Behavior
0.0
0.2
0.4
0.6
0.8
1.0
0 20 40 60 80 100
RN
FC=
N6
0/N
60
-CS=
(N1) 6
0/(N
1) 6
0-C
S
Fines Content, FC, %,
0.0
0.1
0.2
0.3
0.4
0.5
0.6
0 10 20 30 40 50
Cyc
lic R
esis
tan
ce R
atio
, CR
R
(N1)60
((N1)60-CS, CRR)
0.0
0.1
0.2
0.3
0.4
0.5
0.6
0 10 20 30 40 50
Cyc
lic R
esis
tan
ce R
atio
, CR
R
(N1)60
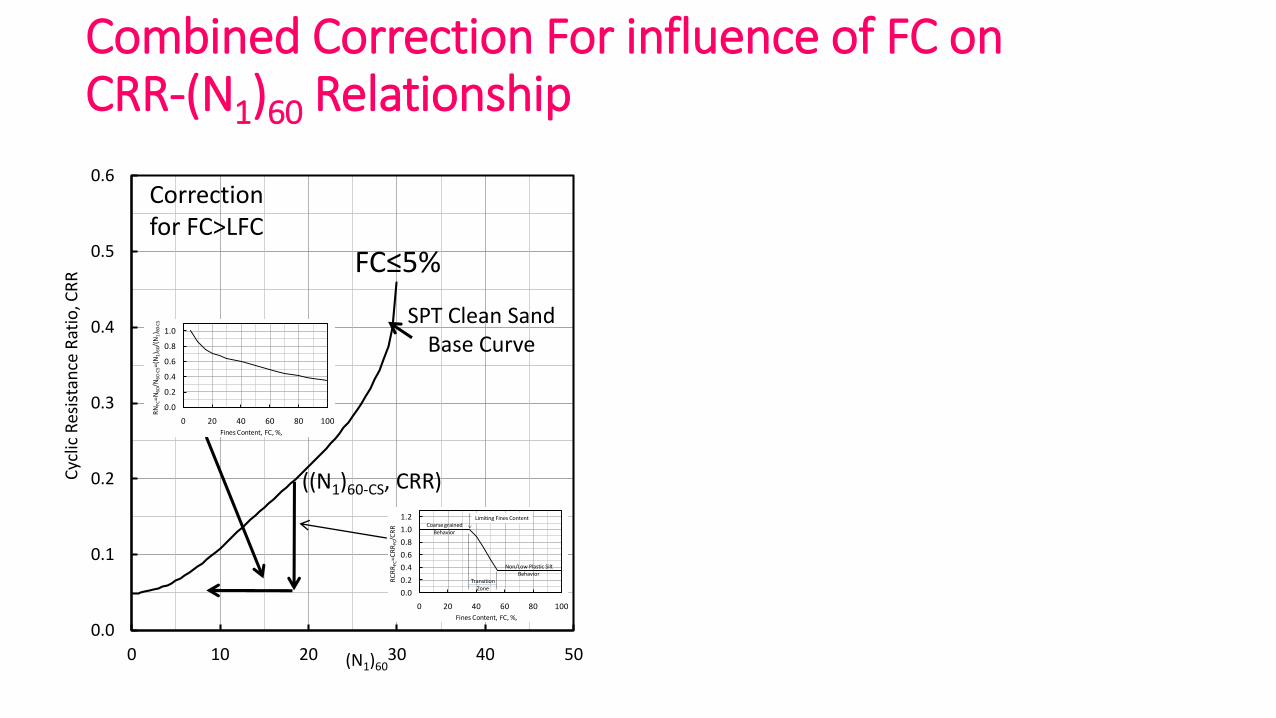
Combined Correction For influence of FC on CRR-(N1)60 Relationship
FC≤5%
SPT Clean Sand Base Curve
Correction for FC>LFC
0.0
0.2
0.4
0.6
0.8
1.0
1.2
0 20 40 60 80 100
RC
RR
FC=C
RR
FC/C
RR
Fines Content, FC, %,
Limiting Fines Content
Transition Zone
Non/Low Plastic Silt Behavior
Coarse grained Behavior
0.0
0.2
0.4
0.6
0.8
1.0
0 20 40 60 80 100
RN
FC=
N6
0/N
60
-CS=
(N1) 6
0/(N
1) 6
0-C
S
Fines Content, FC, %,
((N1)60-CS, CRR)
0.0
0.1
0.2
0.3
0.4
0.5
0.6
0 10 20 30 40 50
Cyc
lic R
esis
tan
ce R
atio
, CR
R
(N1)60
Combined Correction For influence of FC on CRR-(N1)60 Relationship
0.0
0.1
0.2
0.3
0.4
0.5
0.6
0 10 20 30 40 50
Cyc
lic R
esis
tan
ce R
atio
, CR
R
(N1)60
≤5%
SPT Clean Sand Base Curve(Figure 1)
1535
FC
50%
60%80%

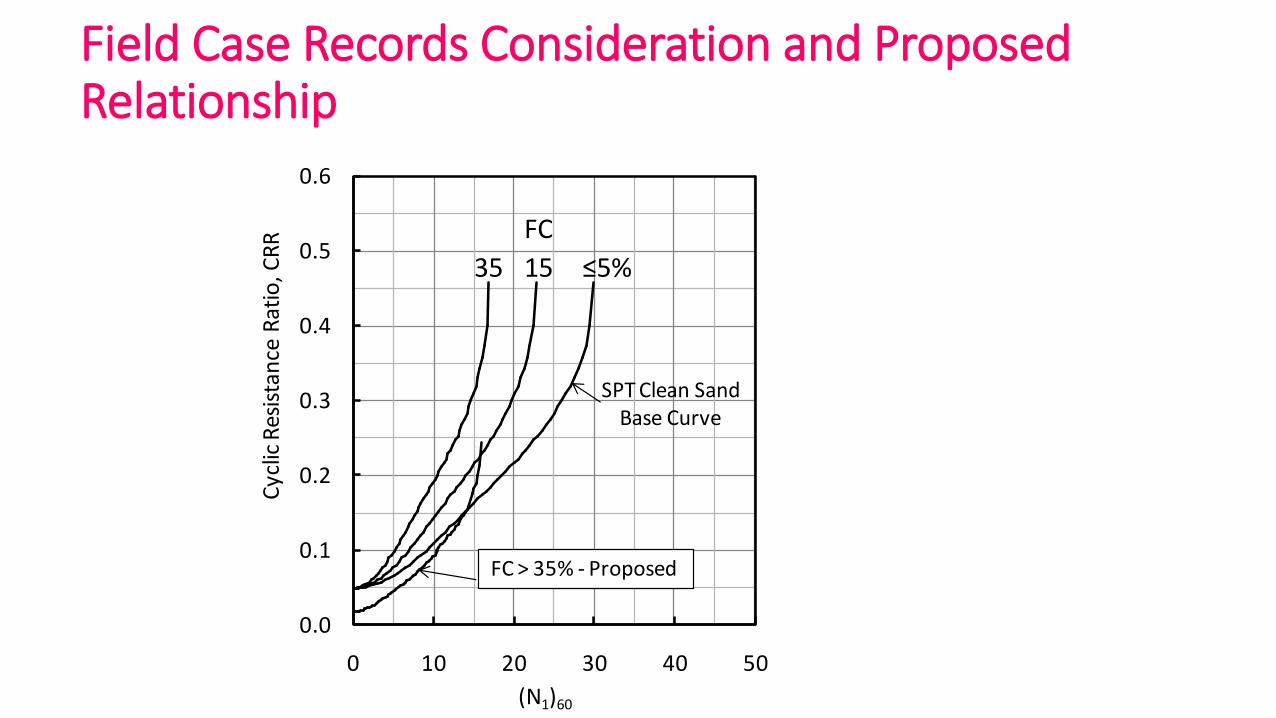
Field Case Records Consideration and Proposed Relationship
0.0
0.1
0.2
0.3
0.4
0.5
0.6
0 10 20 30 40 50
Cyc
lic R
esis
tan
ce R
atio
, CR
R
(N1)60
≤5%
SPT Clean Sand Base Curve(Figure 1)
1535
FC
50%
60%80%
0.0
0.1
0.2
0.3
0.4
0.5
0.6
0 10 20 30 40 50
Cyc
lic R
esis
tan
ce R
atio
, CR
R
(N1)60
LiquefactionNo Liquefaction
Green et al. (2006)35<FC ≤92%
50
6080
Youd and Idriss (2001)FC ≥ 35%
(This Paper)FC = 35%
Proposed -This PaperFC > 35%
Field Case Records Consideration and Proposed Relationship
0.0
0.1
0.2
0.3
0.4
0.5
0.6
0 10 20 30 40 50
Cyc
lic R
esis
tan
ce R
atio
, CR
R
(N1)60
≤5%
SPT Clean Sand Base Curve
1535
FC
FC > 35% - Proposed

Concluding Remarks
• This paper presents an alternative approach to obtain FC
correction to the liquefaction resistance versus
penetration resistance ((N1)60) relationship.
• The obtained correction confirmed the already existing
one for FC≤ 35% (Youd et al., 2001).
• However, it provided new correction for FC> 35% that is
consistent with field case records.

Thank you
Top Related