


Languages
Pages
Legal

A crash course in financial management for startup businesses Presented by:
Matt H. Evans SCORE Mentor
Finance 101 for Startups Outline
• Module 1 – How Accounting Works
• Module 2 – Reading the Financial Statements
• Module 3 – Analyzing the Financial Statements
• Module 4 – Additional Financial Analysis
• Module 5 – Evaluating Long Term Investments
• Module 6 – Advanced Concepts in Finance
• Module 7 – Business Analysis
1
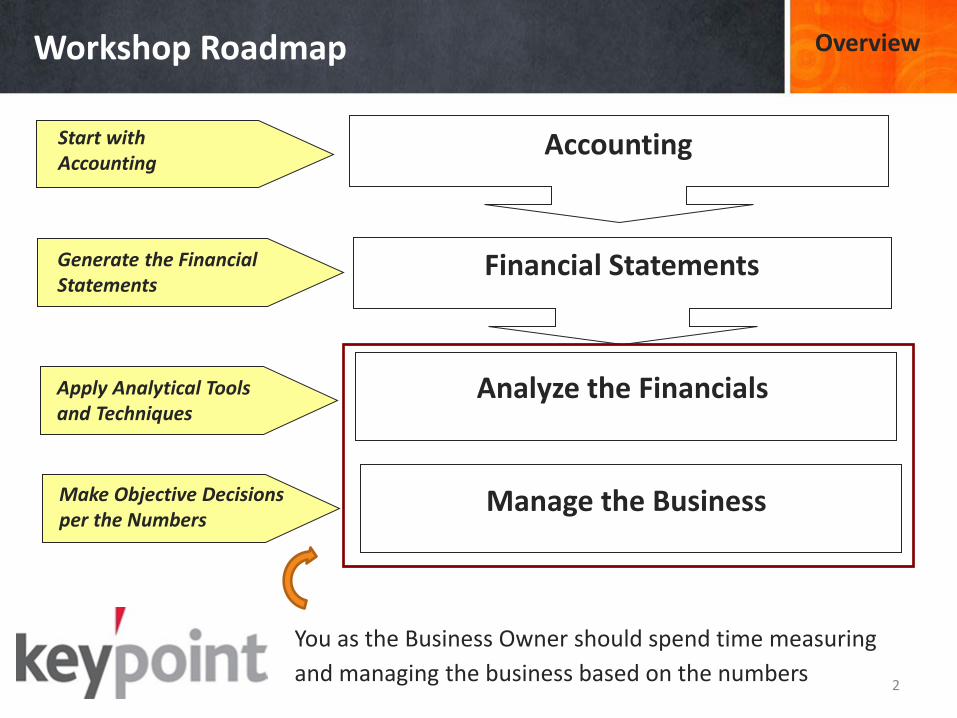
Workshop Roadmap Overview
2
Accounting
Financial Statements
Analyze the Financials
Start with Accounting
Generate the Financial Statements
Apply Analytical Tools and Techniques
Make Objective Decisions per the Numbers
Manage the Business
You as the Business Owner should spend time measuring
and managing the business based on the numbers

Module 1 How Accounting Works
3
Overview of how the accounting process works at
a detail transaction level

Think in Terms of Your Check Book Module 1
4
• All transactions pass through your Check Book
• All transactions must be recorded
• Businesses have a wide range of transactions:
- Customers buy your products or services = Cash Inflows
- Vendors and Employees must be paid = Cash Outflows
Cash Inflows
(Deposits)
Cash Outflows
(Checks)

Accrual Accounting is Preferred Module 1
5
Most transactions are cash basis (pass through your cash account), but . . .
• Accrual Accounting recognizes revenues when earned before you collect the cash – Accounts Receivable Account
• Accrual Accounting recognizes expenses when incurred before you make payment – Accounts Payable Account
• Cash Basis – Only post transactions when they go in and out of your Check Book
• Tracking – Make sure you can control and track the money you owe others in the future and collect all money owed to you (customers pay on time when due).

Simple Cash Basis Accounting Module 1
6
Simple Spreadsheet for Cash Basis Accounting
Year:
Date Description Name Amount Category RefRevenues: (Cash Collected from Sales to Customers)
2/8/2018 Sold 18 bars soap at Eastern Market Various Walk By Traffic 54.00$ Sales Revenue
2/17/2018 Sold 20 bars soap to Rosa Ela Shop Rosa Ela Shop in College Prk 40.00$ Sales Revenue
2/22/2018 Sold 22 bars soap at Dupont Circle Various Walk By Traffic 66.00$ Sales Revenue
Feb-18 Online Orders of Soap - Etsy Various per Etsy 22.00$ Sales Revenue
TOTAL REVENUES 182.00$
Expenses: (Cash Paid for all business related expenses)1/6/2018 Soap Materials Sarah's Craft House (110.09)$ Materials Expense
1/15/2018 Booth Materials for Markets M-Displays Inc (75.00)$ Marketing Expense
1/22/2018 Promotion Flyers Office Max (36.55)$ Marketing Expense
2/6/2018 License Fee to County DC Dept of Cons / Reg Affairs (115.00)$ Legal Expenses
TOTAL EXPENSES (336.64)$
PROFIT OR (LOSS) (154.64)$

How the Accounting Model Works Module 1
Businesses invest in assets two ways: Liabilities and
Equity. Assets exist for one single reason: To Generate
Revenues
1. Assets – Resources of the Business
2. Liabilities – Obligations
3. Equity – Investments by Owners
4. Revenues – Inflows from Sales
5. Expenses – Outflows for Costs
Balance Sheet
Income Statement
The Accounting Model can be summarized through two equations: Assets = Liabilities + Equity Revenues – Expenses = Profit or (Loss)
7

Chart of Accounts – Capture the Transactions Module 1
Chart of Accounts is the structure by which all
transactions are categorized and reported by the business
Cash Money in the bank
Accounts Receivable Amounts owed to the company for sales
Inventory Pants, Shirts, Hats, Shoes, Socks, Belts, etc.
Prepaid Expenses Amounts paid in advance
Furniture and Fixtures Storefront assets such as tables, racks, chairs, etc.
Machinery and Equipment Property used to manufacture clothing (Sewing Machines)
Accounts Payable Amounts that must be paid to vendors / suppliers
Loans Payable Amounts due to banks
Long Term Debt Amounts due to investors or bank against long term assets
Owners Capital Account Amount invested by the owner of the business
Retained Earnings Profits held by the business for reinvesting
Sales Revenue Amount of revenues from selling products / services
Cost of Goods Sold Cost of inventory that has been sold
Administrative Expense Cost of office support personnel
Selling and Marketing Expense Advertising, Sales Commissions, Trade Show Displays, etc.
Utility Expense Gas, Water & Electric expenses
Depreciation Expense Expense a portion of the cost of a long term asset
Assets
Liabilities
Equity
Revenues
Expenses
8

Most Transactions Go Thru the Cash Account Module 1
9
1-6-2014 Purchase office supplies
1-1-2014 Beginning Balance
Account Title: Cash
1-16-2014 Run Bi Weekly Payroll
1-12-2014 Deposit payment from customer
1-26-2014 Pay Monthly Electric Bill
1-22-2014 Insurance Premium Paid
$ 4,220.55
$ 142.20
1-31-2014 Ending Balance
$ 3,600.00
$ 2,640.00
$ 265.00
$ 516.30
$ 4,257.05
Debit (Left) Credit (Right)
Let’s walk through a few accounting entries as it relates to the Cash Account
The balance as of a cut off date is what gets reported
on the Financial Statements

Accounting is Dual (Two Sides)
10
Module 1
Balance Sheet
Assets offset by Liab +Equity
Income Statement Revenues offset by Expenses

The Accounting Process Module 1
11
Accounting
System
Financial
Statements
End of Period
Accrual Entries
Transactions
(Mostly Cash Basis)
Post to General
Ledger Accounts
Accounting is a very iterative process that captures transactions (inputs)
to generate Financial Statements (outputs)
Balance
Sheet
Income
Statement
Economic Activity of the
Business

Recap Important Points Module 1
12
1. Most transactions pass through the Cash Account. Make sure you post all transactions that go through your Business Bank Account.
2. You must classify all transactions according to how you want to report financial results. Chart of Accounts
3. Accounts capture transactions. There are five major groups of accounts: Assets, Liabilities, Equity, Revenues, and Expenses
4. The five groups of accounts is the basis for presenting the financial statements of a business: Balance Sheet and Income Statement.
5. Financial Statements are prepared as of a cut off date (such as March 31st) presenting the balances as of this date.

Comprehensive Example – Accounting Entries Module 1
13
Let’s go through a startup business and see how accounting transactions get posted over time Three phases take place over time when starting a business: 1. Fund the Business – Financing Transactions 2. Acquire the Right Mix of Assets to Generate Revenues –
Investment Transactions 3. Generate Revenues and Expenses – Operating Transactions
Someone in your business must be responsible for
posting accounting transactions on a regular basis

Accounting Software Programs
14
Module 1
Using software programs can help automate the entire process including invoicing, creating financial reports, etc. Here are some very inexpensive programs for small businesses that are highly rated:
Quick Books > https://quickbooks.intuit.com/ Fresh Books > https://www.freshbooks.com/ Wave > https://www.waveapps.com/ Billy > https://billyapp.com/ Zip Books > https://zipbooks.com/ Express Accounts > https://www.nchsoftware.com/accounting/index.html KashFlow > https://www.kashflow.com/ GoDaddy Accounting > https://www.godaddy.com/email/online-bookkeeping Clear Books > https://www.clearbooks.co.uk/ Less Accounting > https://lessaccounting.com/ Zoho Books > https://www.zoho.com/us/books/ Xero > https://www.xero.com/us/

Module 2 Financial Statements
15
Read and understand the three financial
statements associated with your business
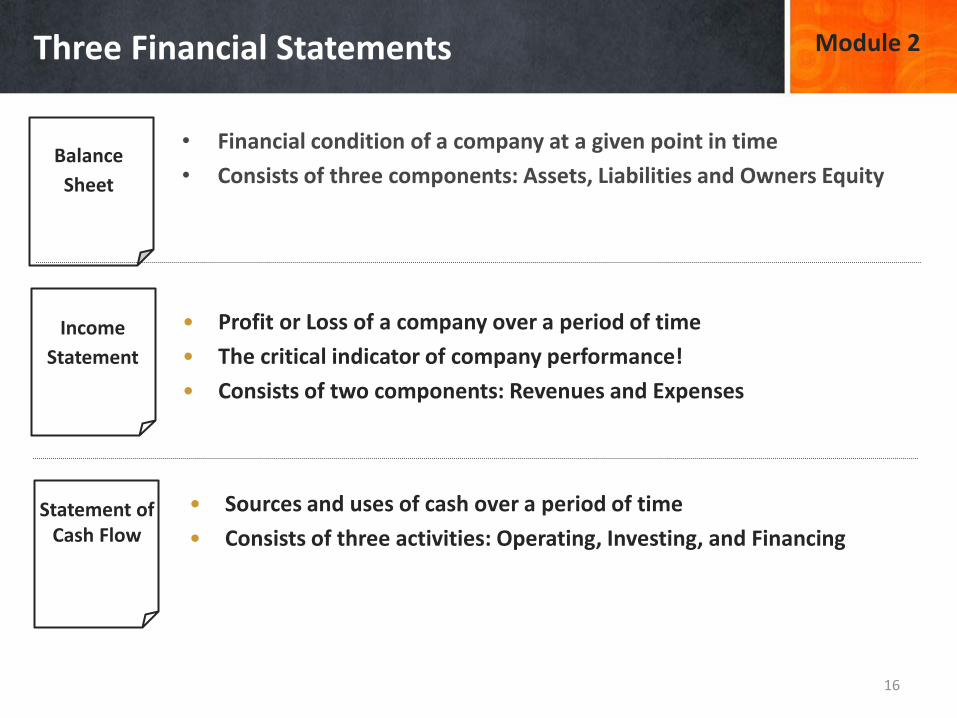
Three Financial Statements Module 2
• Financial condition of a company at a given point in time
• Consists of three components: Assets, Liabilities and Owners Equity
• Profit or Loss of a company over a period of time
• The critical indicator of company performance!
• Consists of two components: Revenues and Expenses
• Sources and uses of cash over a period of time
• Consists of three activities: Operating, Investing, and Financing
Income
Statement
Statement of Cash Flow
Balance
Sheet
16

Overview of the Balance Sheet
17
Module 2
The Balance Sheet is prepared as of a Cut Off Date and what-ever the balances are in the Accounts gets compiled and reported under key categories: Current Assets, Long Term Assets, Current Liabilities, Long Term Liabilities and Owners Equity

Balance Sheet – Key Financial Points (Red) Module 2
These accounts should Turnover in the Current Year
18
Long term investments in the business should generate positive returns (Module 5)
Current Assets
Cash 850
Receivables 2,300
Inventories 6,600
Prepaid Insurance 400
Total Current Assets 10,150
Long Term Assets
Furniture and Fixtures 1,950
Vehicle 12,400
Special Equipment 6,450
Intangible - Patent 1,200
Total Long Term Assets 22,000
Total Assets 32,150
Pay attention to key concepts (such as Turnover)as you read and compare the Balance Sheet

Balance Sheet – More Key Points (Red) Module 2
Sufficient Liquidity: Total Current Liabilities should be less than Total Current Assets
19
Be careful – High debt level equates to a high risk of default. Too much debt (Total Liabilities) – Unable to Borrow Money
Currrent Liabilities
Accounts Payable 1,760
Salaries Payable 1,500
Short Term Loan Payable 3,500
Total Current Liabilities 6,760
Long Term Liabilities
Bank Loan on Vehicle 9,800
Total Long Term Liabilities 9,800
Total Liabilities 16,560
Equity
Owners Capital Account 14,690
Retained Earnings 1,100
Owners Withdrawal (200)
Total Equity 15,590
Total Liabilities + Equity 32,150

Income Statement – Covers a Period of Time
20
Module 2
For the entire year

Income Statement – Key Points Module 2
Operating Expenses
Non-Operating Expenses
Non-Operating line items add “noise” to Income
Statements – they can be both revenue and expense 21
Sales Revenues 6,800
Cost of Goods Sold 2,600
Gross Profit 4,200
Selling and Marketing Expenses 1,824
Rent and Utilities 2,600
Administrative Support Expenses 750
Other Operating Expenses 300
Operating Income (1,274)
Interest Expense 81
Special Legal Fee 300
Net Income (1,655)
TOP LINE
BOTTOM LINE
Distinguish Operating vs. Non Operating when presenting the Income Statement

Reporting Cash Flows – Three Categories Module 2
22
Operating Activities
• Cash received from customers
• Payments made to vendors and employees
• Tax payments, rent payments, utilities, etc.
Investment Activities • Invest in Real Estate
• Sell Off Equipment
Financing Activities • Secure Long Term Financing (Loan)
• Distribute Income to Owners
For financial reporting purposes, cash flows have three categories:
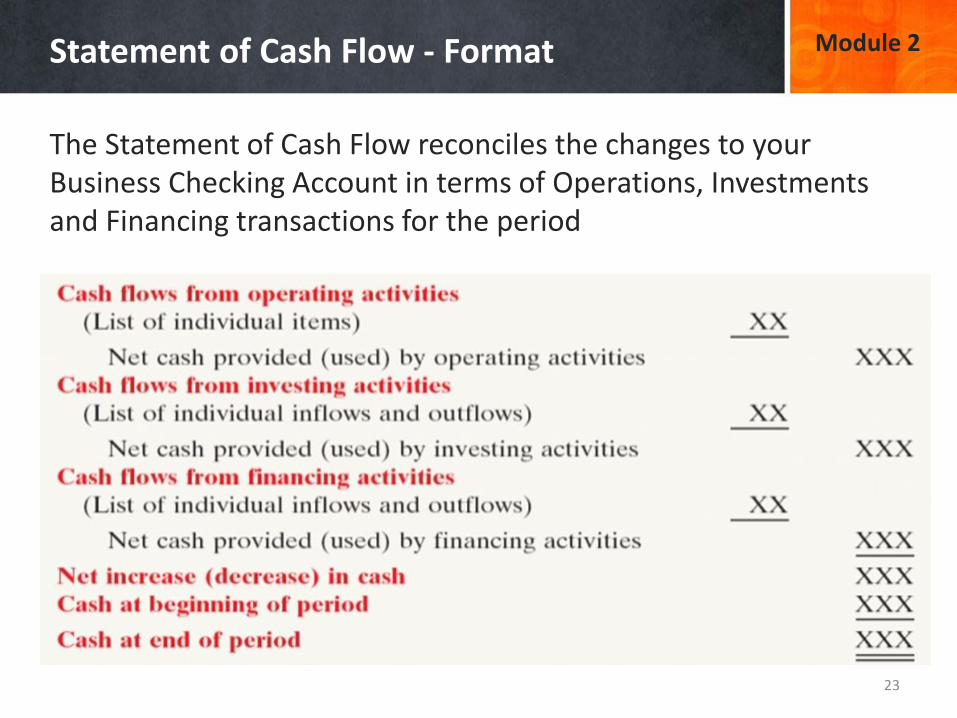
Statement of Cash Flow - Format
23
The Statement of Cash Flow reconciles the changes to your Business Checking Account in terms of Operations, Investments and Financing transactions for the period
Module 2

Statement of Cash Flow – Key Point (Red) Module 2
You eventually want your business to be cash flow positive from its operations so you can avoid having to finance the business from yourself or lenders
24

Exercise 1 – Generate Financial Statements Module 2
25
Close out the accounting period and generate the Balance Sheet per the balances that are outstanding in the various general ledger accounts Two handouts – Financial Statement Template and Account Activity for the Period
Sales is the most important enabler for producing
favorable financial results. You must spend time and
effort on acquiring customers – selling!

Some Important Tax Information
26
Due Dates for 2019 Estimated Quarterly Tax Payments:
Q1: Monday, April 15, 2019 (January – March) Q2: Monday, June 17, 2019 (April – May) Q3: Monday, September 16, 2019 (June – August) Q4: Wednesday, January 15, 2020 (September – December)
Module 2
1. Profits are subject to taxation 2. Most businesses are pass through entities (such as LLC) – Profits
pass through to the Owners who get taxed on the Profits 3. Three forms of taxation on Profits to the Owner(s):
1. State Income Tax (personal tax rate) 2. Federal Income Tax (personal tax rate) 3. Self Employment Tax (12.4% social security + 2.9% medicare)
Some Useful Links – Learning Related
27
Module 2
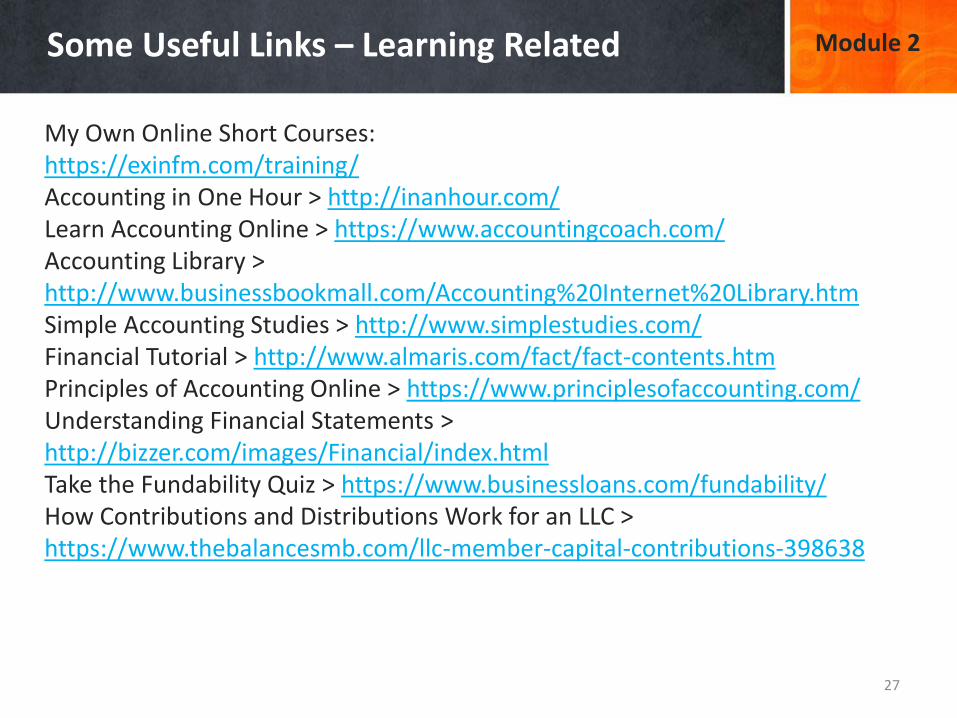
My Own Online Short Courses: https://exinfm.com/training/ Accounting in One Hour > http://inanhour.com/ Learn Accounting Online > https://www.accountingcoach.com/ Accounting Library > http://www.businessbookmall.com/Accounting%20Internet%20Library.htm Simple Accounting Studies > http://www.simplestudies.com/ Financial Tutorial > http://www.almaris.com/fact/fact-contents.htm Principles of Accounting Online > https://www.principlesofaccounting.com/ Understanding Financial Statements > http://bizzer.com/images/Financial/index.html Take the Fundability Quiz > https://www.businessloans.com/fundability/ How Contributions and Distributions Work for an LLC > https://www.thebalancesmb.com/llc-member-capital-contributions-398638

28
Take a Break

Module 3 Analyze the Financials
29
Apply analytical techniques to your financial
statements to better assess where you stand

Financial Terminology Module 3
30
Cash Flow – The amount of cash receipts and disbursements that flows in and out of the business over time. We want more cash coming in then cash going out.
Debt – Liabilities such as Loans, Mortgages, Bonds, and Commercial Paper (large public corporations). High debt levels equates to high risk.
Equity – The amount of funds invested by owners of the business + profits that are retained by the business for future growth.
Liquidity – The ability of a company to convert assets into cash for meeting short-term obligations. It is important to have sufficient liquidity to meet your short term obligations.
Leverage – How a company finances its assets; debt vs. equity
Earnings = Net Income = Profits – The residual income remaining after all expenses.
Rate of Return – How much return does the investment generate for the business; residual income after all costs. It is important for long term assets to generate positive returns.
Turn Over – The ability of a company to turn over and convert an asset into something else, such as sales or cash. It is important to turn over current assets into cash.
Working Capital – The funds available to the business within the current operating cycle, expressed as current assets in excess of current liabilities.
Every business owner should be financially smart. This will require an understanding of some important concepts such as:

Important Concept - Turnover Module 3
Any asset that is “current” needs to turnover – the shorter the cycle the better which in turn reduces the need to finance the current operations of the business. Try and collect the money at the Point of Sale – No Need to Collect Money
Accounts
Receivable (Send a bill to the customer)
Cash
Inventory - Appliances
Sale on Credit
Eventually everything will flow through your cash account!
31

Three Useful Analytical Techniques Module 3
32
Ratio Analysis • Divide one number by another number • Easy to benchmark and understand performance Horizontal Analysis • Track Trends over Time • Key Trends include Sales Revenues, Net Income, Debt Levels Vertical Analysis • Track Relationships (between accounts) over Time • Monitor proportion of debt and equity to assets – too much debt equates to
higher risk • Monitor proportion of non-operating expenses to operating expenses – most
of your costs should be operating with minimal non-operating expenses
Analyze a set of financial statements:

Four Types of Ratios Module 3
33
Liquidity Ability to meet short-term
obligations of the business
Leverage Degree to which assets are
financed by debt
Asset Management Management’s ability to manage
assets
Profitability Degree of profitability generated
You need both a Balance Sheet and Income Statement
in order to calculate ratios
Ratios help you measure the following:
Liquidity – Meet Short Term Obligations Module 3
34
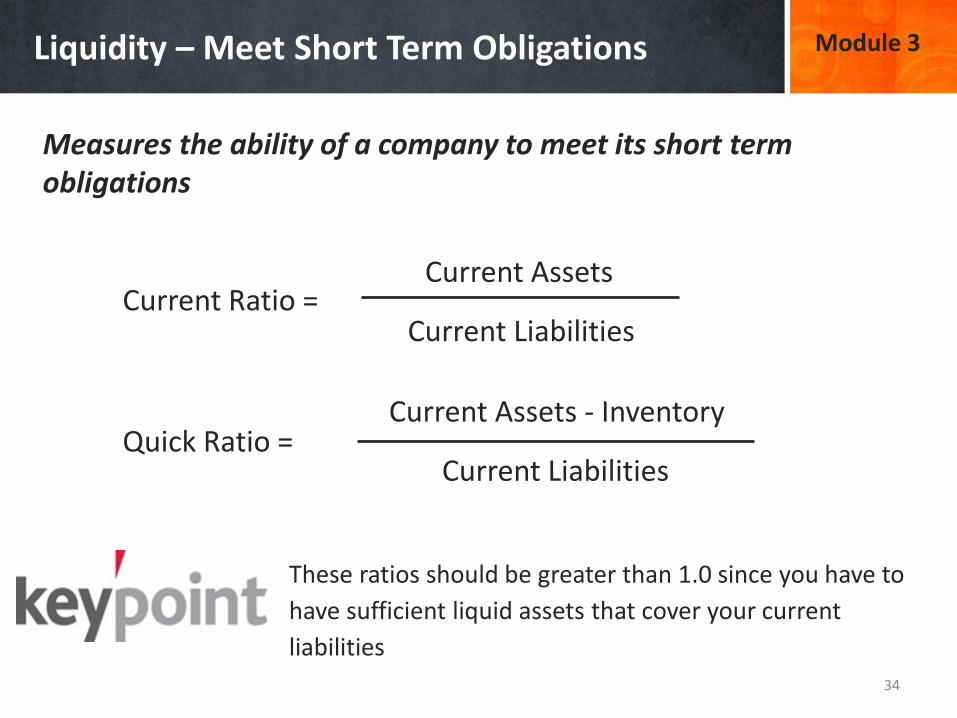
Measures the ability of a company to meet its short term obligations
Current Ratio =
Quick Ratio =
Current Assets
Current Liabilities
Current Assets - Inventory
Current Liabilities
These ratios should be greater than 1.0 since you have to
have sufficient liquid assets that cover your current
liabilities

Liquidity Ratio Calculations
35
Module 3
Assets
Cash $ 5,600
Accounts Receivable 12,400
Inventory 39,000
Total Current Assets 57,000
Plant and Equipment 145,000
Real Estate Holdings 55,000
Total Non-Current Assets 200,000
Total Assets 257,000
Liabilities
Accounts Payable 11,500
Long Term Loans Payable 73,000
Total Liabilities 84,500
Equity
Owners Capital 110,000
Retained Earnings 62,500
Total Equity 172,500
Current Ratio
$ 57,000 / $ 11,500 = 5
We have 5 times the current assets that we have in current liabilities
Quick Ratio
( 57,000 - 39,000) / 11,500 = 1.5
Our current liabilities are covered 1.5 times by highly liquid assets

Asset Management Ratios Module 3
36
Use Ratios to measure how well a company manages its current assets
Accounts Receivable Turnover
Sales
Accounts
Receivable
Days Held in Accounts Receivable
A / R Turnover
365 Days
Inventory Turnover
Cost of Goods Sold
Inventory Days Held in Inventory
365 Days
Inventory Turnover

Inventory Ratio Calculations
37
Module 3
Revenues
Sales Revenues $ 620,000
Investment Revenues 115,000
Total Revenues 735,000
Expenses
Cost of Goods Sold 380,000
Assets
Cash $ 5,600
Accounts Receivable 12,400
Inventory 39,000
Total Current Assets 57,000
Inventory Turnover
$ 380,000 / $ 39,000 = 9.7
How often does Inventory turn over during the year?
Number of Days Held in Inventory
365 / 9.7 = 37 days
How many days does it take to convert Inventory into Accounts Receivable?

Measuring Risk (Debt Levels) Module 3
38
Measure the degree to which the company is leveraged in terms of debt and equity
Debt to Equity
Debt to Assets
Total Liabilities
Owners Equity
Total Liabilities
Total Assets
Greater than 100% means company is using more debt than equity – more risk to the company
Greater than 50% means the company is using more debt than equity – more risk to the company

Leverage Ratio Calculations
39
Module 3
Proportion of Debt (Total Liabilities) to Equity in Funding the Business: Debt / Equity or $ 1,000 / $ 500 = 2 (you have 2 times more debt vs. equity) Proportion of Debt used to finance the assets of the business: Debt / Assets = $ 1,000 / $ 1,500 = .67% of financing of assets is in the form of debt (.33% is equity – owner)

Calculate Your Margins Module 3
40
Profit Margin
Net Income
Sales
Operating Margin Sales
Operating Income
Return on Assets
Net Income
Total Assets (1)
Gross Margin
Gross Profit
Sales
(1) Average balances for the year are often used
Know your margins – every industry has an approximate
margin it should generate
Use Ratios to measure profitability and benchmark to your respective industry

Profitability Ratio Calculations
41
Module 3
Gross Margin = $ 98,841 / $ 524,359 = 19% Operating Margin = $ 26,765 / $ 524,359 = 5% Profit Margin = $ 20,166 / $ 524,359 = 4%

Horizontal - Track Your Historical Trends Module 3
42
Another easy way to read and understand financial results is to
look at trends from period to period
2004 2005 2006
Sales Revenues $ 120,000 $ 135,000 $ 146,000
Operating Expenses $ 68,000 $ 73,000 $ 78,000
Net Income $ 22,000 $ 26,000 $ 29,000
$-
$20,000
$40,000
$60,000
$80,000
$100,000
$120,000
$140,000
$160,000
2004 2005 2006
Sales Revenues
Operating
Expenses
Net IncomeIt can be easier to read trends when you show it graphically

More Examples of Horizontal Analysis
43
Module 3
How are the numbers tracking / trending over time?

Vertical Analysis – Income Statement Module 3
44
Express the balances as a percentage of Total Revenues to size up the breakdown of all line items on the Income Statement
%
Revenues Breakdown
Sales Revenues 4,000.00$ 100%
Total Revenues 4,000.00
ExpensesCost of Goods Sold 1,320.00 33%
Office Supply Expense 680.90 17%
Depreciation Expense 458.33 11%
Interest Expense 278.96 7%
Tax Expense 312.50 8%
Total Expenses 3,050.69 76%
Net Income 949.31$ 24%

Vertical Analysis – Balance Sheet Module 3
45
Percentage Breakdown of all assets
Assets %
Current Assets Breakdown
Cash 32,714.60$ 32%
Accounts Receivable -$ 0%
Inventory 9,680.00$ 9%
Total Current Assets 42,394.60 41%
Long Term Assets
Furniture & Fixtures 6,104.50 6%
Warehouse Facility 55,000.00$
Less Accumulated Depreciaiton 458.33$
Net Warehouse Facility 54,541.67 53%
Total Long Term Assets 60,646.17 59%
Total Assets 103,040.77 100%
Minimize and Turnover
Generate a Return

Vertical Analysis – Balance Sheet Module 3
46
Percentage Breakdown of all liabilities and equity
Liabilities
Current Liabilities
Accounts Payable 591.46 1%
Mortgage Payable - Current 305.81 0%
Total Current Liabilities 897.27 1%
Long Term Liabilities
Mortgage Payable 51,194.19 50%
Total Long Term Liabilities 51,194.19 50%
Total Liabilities 52,091.46 51%
EquityCapital Account 50,000.00 49%
Retained Earnings 949.31 1%
Total Equity 50,949.31 49%
Total Liab + Equity 103,040.77 100%

A Simple Example of Vertical Analysis
47
Module 3
Easy to read the breakdown of relationships within the financial statement when expressed as percentages
Total Sales Revenues = 100% Income Statement Total Assets = 100% Balance Sheet

Benchmark Your Performance Module 3
48
Per the Arlington Public Library, two sources that can help you benchmark are:
RMA (Risk Management Association) Annual Statement Studies – Financial Ratios
2017 Almanac of Business and Industrial Financial Ratios, 48th Edition
1. Know your NAICS Code: 448110 = Men’s Clothing Retail 448120 = Women’s Clothing Retail 448140 = Family Clothing Retail 448150 = Clothing Accessories 448210 = Shoes Retail 448310 = Jewelry Retail 2. Know your size by total assets and total sales
1. Know your Industry Code: 315215 = Clothing Manufacturing 448115 = Clothing Retail Store 2. Know your size by total assets and total sales
http://www.bizstats.com/
Here are some online sources:
https://www.sba.gov/tools/sizeup
NOTE: Exercise 2 will show how to use both of these benchmark sources

Benchmark Your Results
49
Module 3
Do not get too internal when reviewing financial results – compare yourself to your respective industry and / or competition . . . .

Exercise 2 – Calculate Ratios
50
Module 3
Calculate two ratios per the Balance Sheet on this slide: Current Ratio = Current Assets / Current Liabilities Debt / Equity Ratio = Total Liabilities / Total Equity

Exercise 2 – Continued (Benchmark It)
51
Module 3
Now let’s benchmark our calculations – refer to handout: 1. NAICS Code = 448120 2. Size of Business = Under $ 500,000 in Assets
Ratio Your Company (prior slide)
Industry Average
Current Ratio
Debt to Equity
Recognize that key thresholds may apply when you apply for a bank loan: Current Ratio below 2.0 – May not qualify for a bank loan Debt to Equity Ratio above 4:1 – May not quality for a bank loan
Exercise 2 – Benchmark to Second Source
53
Module 3
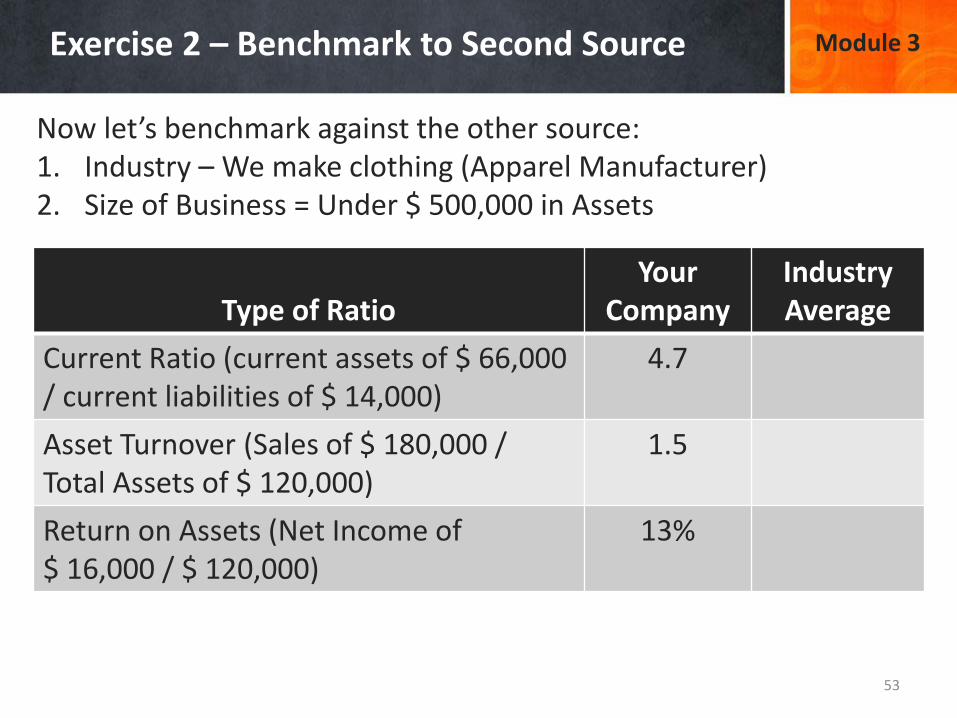
Now let’s benchmark against the other source: 1. Industry – We make clothing (Apparel Manufacturer) 2. Size of Business = Under $ 500,000 in Assets
Type of Ratio
Your Company
Industry Average
Current Ratio (current assets of $ 66,000 / current liabilities of $ 14,000)
4.7
Asset Turnover (Sales of $ 180,000 / Total Assets of $ 120,000)
1.5
Return on Assets (Net Income of $ 16,000 / $ 120,000)
13%

54
Recap – Morning Sessions
1. Must have an accounting process to create financial statements 2. Review financial statements at least quarterly – tax payments 3. Current Assets must turnover and go through Cash quickly! 4. Most businesses need a Gross Margin of 40% or higher 5. Three techniques to analyze financial statements:
1. Ratios – One number in relation to another number per the financials
2. Horizontal – Trends over Time 3. Vertical – Percentage breakdown of financials that can be
benchmarked
Breakeven Analysis, Return on Investment, Valuation, Ratio Models, Analyzing the Business
After Lunch:
Module 4 Additional Analysis
55
Additional concepts related to financial analysis

Important Relationships – Income Statement Module 4
56
Sales Revenues (1,645 units sold x $ 26.00 Sales Price) . . . . . . . . . . . . . $ 42,770 Less Direct Cost (1,645 units sold x $ 18.00 Unit Cost) . . . . . . . . . . . . . . . 29,610 Gross Profit or Margin . . . . . . . . . . . . . . . . . . . . . . . . . . . . . . . . . . . . . . 13,160 Less Indirect Cost: Sales and Marketing Expenses . . . . . . . . . . . . . . . . . . . . . . . . . . 2,350 Administrative Salaries . . . . . . . . . . . . . . . . . . . . . . . . . . . . . . . . . 3,450 Rent and Utilities . . . . . . . . . . . . . . . . . . . . . . . . . . . . . . . . . . . . . 1,780 Insurance and Legal Fees . . . . . . . . . . . . . . . . . . . . . . . . . . . . . . . 1,200 Depreciation Expense . . . . . . . . . . . . . . . . . . . . . . . . . . . . . . . . . . 900 Other Miscellaneous Expenses . . . . . . . . . . . . . . . . . . . . . . . . . . . 760 Profit or (Loss) . . . . . . . . . . . . . . . . . . . . . . . . . . . . . . . . . . . . . . . . . . . . . $ 2,720
Direct Cost varies with sales whereas Indirect Cost tend to
be fixed – same month to month regardless of what you
sell. Direct Cost tend to be Variable whereas Indirect Cost
tend to be Fixed

Cost Analysis Module 4
Sales Volume
Cost Variable
Fixed
Variable Cost – Varies or changes with changes in sales. Includes production labor, raw materials and various discretionary items such as advertising.
Fixed Cost – Remains the same regardless of activity levels. Tends to be long-term commitments or non-discretionary items such as Rent, Insurance, Interest, Depreciation and Senior Management Salaries.
A scalable business is one where you increase the volume sold and you see lower marginal cost. If your sales grow and your total cost continue to go up, you do not have a scalable business
57

Know Your Breakeven Point Module 4
Simple Concept: How much business do I have to do to breakeven (recover all of my costs)?
Breakeven Volume = Fixed Costs / (Sales Price – Variable Cost per Unit)
Breakeven Sales Amount = Fixed Costs / Contribution Margin Ratio
Contribution Margin Ratio = (Sales Price – Variable Cost) / Sales Price
EXAMPLE: Sales Price = $ 45.00 per shirt | Materials = $ 6.00 per shirt + Labor = $ 9 per shirt + Variable Overhead = $ 3 per shirt = Total Variable Cost per Unit of $ 18.00
$ 70,470 of costs are incurred no matter how much you sell
Breakeven Units = $ 70,470 / ($ 45.00 - $ 18.00) = 2,610 shirts must be sold
Contribution Margin = $ 27.00 / $ 45.00 = 60%
Breakeven Revenues = $ 70,470 / .60 = $ 117,450 (2,610 units x $ 45.00)
58
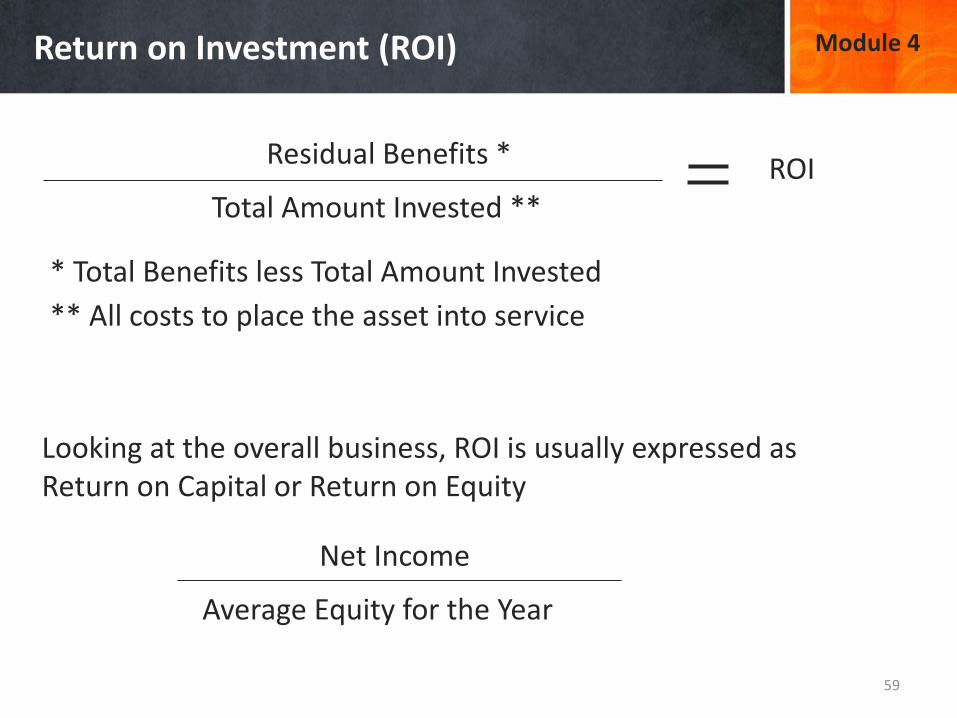
Return on Investment (ROI) Module 4
59
Residual Benefits *
Total Amount Invested **
Looking at the overall business, ROI is usually expressed as Return on Capital or Return on Equity
ROI
Net Income
Average Equity for the Year
* Total Benefits less Total Amount Invested
** All costs to place the asset into service

Quantify the Future Benefits Module 4
Organizational Benefits Builds company reputation Creates new customer opportunities Fosters company vision and mission Improves market position relative to competitors Improves the ability to serve customers Increases competitiveness Financial Benefits Creates additional/new revenue Creates cost savings through tax avoidance Enables cost avoidance Faster return on investments Increases cash flow Increases profitability of existing products/services Increases revenue of existing sources Increases stock price/shareholder value Lowers cost of production Lowers cost of servicing
Operational Benefits Decreases employee work loads for undesirable work Eliminates non-value added activities Improves employee morale / team spirit Improves internal communication Improves use of workspace Reduces cycle time Reduces cycle time of production/process Reduces external inputs to processes Reduces person-hours Reduces process steps
Information Technology Benefits Decreases maintenance/support costs Improves application/system performance Improves application/system utilization rate Increases efficiency of support activities Increases productivity through automation Reduces paper documentation requirements Strengthens application/system security
Identifying costs (outflows) is fairly straight-forward. Trying to quantify the benefits (inflows) can be very challenging. Examples of benefits include:
60

Simple Example of ROI Module 4
61
Proposed new marketing program cost $ 200,000. It will give the company much more exposure to new potential customers. Past programs have proven to increase a company’s revenues by 5% over a three year period. What is the Rate of Return for this investment?
Step 1 - Quantify the Benefits: Estimated Annual Revenues (next 3 years) are $ 1,600,000 x 5% = $ 80,000 benefits per year x 3 years = $ 240,000 Total Benefits (NOTE: Conservative Estimates are best used on the Benefit Side – Subjective and prone to error) Step 2 – Quantify all of the Costs: Total investment cost is up front, one time fee of $ 200,000 Step 3 – Calculate the ROI: Total Benefits of $ 240,000 - $ 200,000 costs = $ 40,000 residual benefits divided by $ 200,000 = 20% ROI

Returns Must Exceed Cost of Capital Module 4
62
All businesses have a cost of financing the business:
1. Cost of Debt – Interest Payments on Loans
2. Cost of Equity – Owners expect to get a return on what they’ve invested into the business
Cost of Capital = Cost of Debt + Cost of Equity
Cost of Capital Create Value
Destroy Value
Returns on Investment (ROI)
10%
12%
14%
16%
8%
6%

Exercise 3 – What is the ROI? Module 4
63
You are thinking about investing in a new vehicle to improve sales delivery for your food business. The initial investment required is $ 23,450 and you do expect some operating cost each year of about $ 3,150 per year for paying the driver, insurance, gas, and repairs. You have estimated that the delivery of food could really boost your sales each year over the next 5 years as follows: Year 1 - Increase in Sales $5,000 Year 2 - Increase in Sales $7,500 Year 3 - Increase in Sales $9,500 Year 4 - Increase in Sales $11,000 Year 5 - Increase in Sales $10,000
Add up all the money you have to pay out – Day 1 investment + all the cost each year. Compare to the total benefits (Sales). What is the residual benefit? Divide the Residual Benefit by the Total Investment = Return on Investment

Module 5 Evaluating Long Term
Investments
64
How to evaluate the economics of a long term
investment
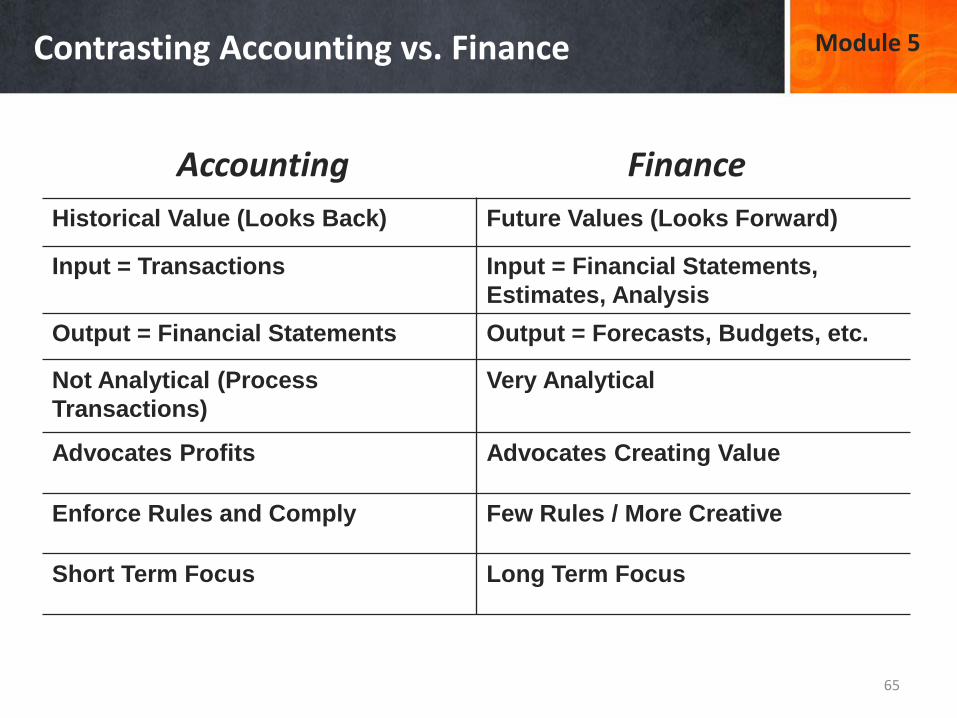
Contrasting Accounting vs. Finance Module 5
65
Accounting Finance
Historical Value (Looks Back) Future Values (Looks Forward)
Input = Transactions Input = Financial Statements,
Estimates, Analysis
Output = Financial Statements Output = Forecasts, Budgets, etc.
Not Analytical (Process
Transactions)
Very Analytical
Advocates Profits Advocates Creating Value
Enforce Rules and Comply Few Rules / More Creative
Short Term Focus Long Term Focus

What is the Value Today? Module 5
66
Accounting
Historical
Values
Constant Dollars –
does not change
over time
Why the differences in value (Accounting vs. Finance)?
1. Risk – I promise to pay you $ 100,000 five years from now!
2. Inflation - $ 100,000 five years from now will lose purchasing power!
3. Opportunity Cost – If you had $ 100,000 now (not five years from now), you could do something with it – lost opportunity!
Finance
Present
Values
What is the value
today?
Future
Values
What is the value
tomorrow?

67
Three Economic Criteria Module 5
Three important economic indicators in finance for evaluating long term investments:
1. Return on Investment – We discussed this earlier > Investors must earn a rate higher than the cost of capital; otherwise the investment is not attractive.
2. Net Present Value – Discount the cash flows of both the costs and the benefits of the investment. The more positive the value, the more attractive the investment.
3. Discounted Payback Period – How long does it take for the investor to recover his investment. The shorter the payback, the more attractive the investment.

68
Simple Example of Discounting Module 5
Three Important Steps:
1. Identify the cash inflows (benefits) and cash outflows (costs) over the useful life of the investment
2. Identify your cost of capital
3. Discount the cash inflows and outflows using your cost of capital
i = 8% Year 1 Year 2 Year 3 Totals
Inflows $ 120,000 $ 84,000 $ 36,000 $ 240,000
Outflows $ (200,000) $ - 0 - $ - 0 - $ (200,000)
Difference $ (80,000) $ 84,000 $ 36,000 $ 40,000
Discount .9259 .8573 .7938
Present Value $ ( 74,072) $ 72,013 $ 28,576 $ 26,517
Net Present Value

69
Discounted Pay Back Period Module 5
A simple economic indicator – when will I recover all of my costs?
Net
Present Cumulative
Year Value Value
1 (74,072)$ (74,072)$
2 72,013$ (2,059)$
3 28,576$ 26,517$
You reach pay back in Year 3 for this investment
Per the Previous Slide
Example 4 – Evaluate Long Term Investment Module 5
70
Let’s go back to our ROI example, but this time we will take into account “time value” to come up with a more accurate analysis. For all long term investments, try and document and forecast out both the cost and benefits of the investment over its useful life. Once we know the cost and benefits, discount the amounts to reflect risk. A positive Net Present Value indicates that this investment adds value. A negative Net Present Value indicates that the investment destroys value within the business.

71
Take a Break

Module 6 Some Advanced Concepts
72
A few advanced concepts related to financial
management

Manage Your Cash Flow Module 6
73
1. Put Emphasis on Selling – Sales cures all and you must capture
customers and convert them into sales to generate cash flow.
2. Forecast your cash inflows and outflows based on past history or what
you expect to incur month to month
3. Be aggressive in collecting money owed to you
4. Be aggressive in reducing your cash expenses:
a. Labor – Use temporary or part-time workers unless you can justify
full time employees
b. Office – Use your home or shared office spaces as opposed to a
formal expensive office
c. Purchases – Buy used as opposed to new and purchase only
minimum quantities until you can justify larger quantities
d. Insurance – Don’t over-insure the business, accept the risk until you
can afford complete insurance coverage
e. Bootstrap – Use free resources as much as possible such as social
media for marketing

Working Capital for Day to Day Operations Module 6
74
2016
Days in Receivables (per slide 25) 51
Days in Inventory (per slide 26) 59
Operating Cycle in Days 110
Less Accounts Payable (1) -33
Days to be Financed 77
(1) Days in Accounts Payables = 365 / Accts Payable Turnover
Accounts Payable Turnover = Total Purchases / Avg A/P Balance
A/R Held 1 Day (1/365 x Credit Sales for Year) 5,917$
Inv Held 1 Day (1/365 x Cost of Goods Sold for Yr) 22,575$
A/P Held 1 Day (1/365 x Purchases for Year) 3,150$
Most businesses cannot cover normal operating cycles. They must cover the short fall through high enough margins. In this example, if the company can turn the inventory over faster from 59 days to 55, this equates to $ 90,300 of more cash on hand for current operations ( 4 days x $ 22,575)
Working Capital represents the current funds to cover day to day operations and it comes from the excess of Current Assets over Current Liabilities
75
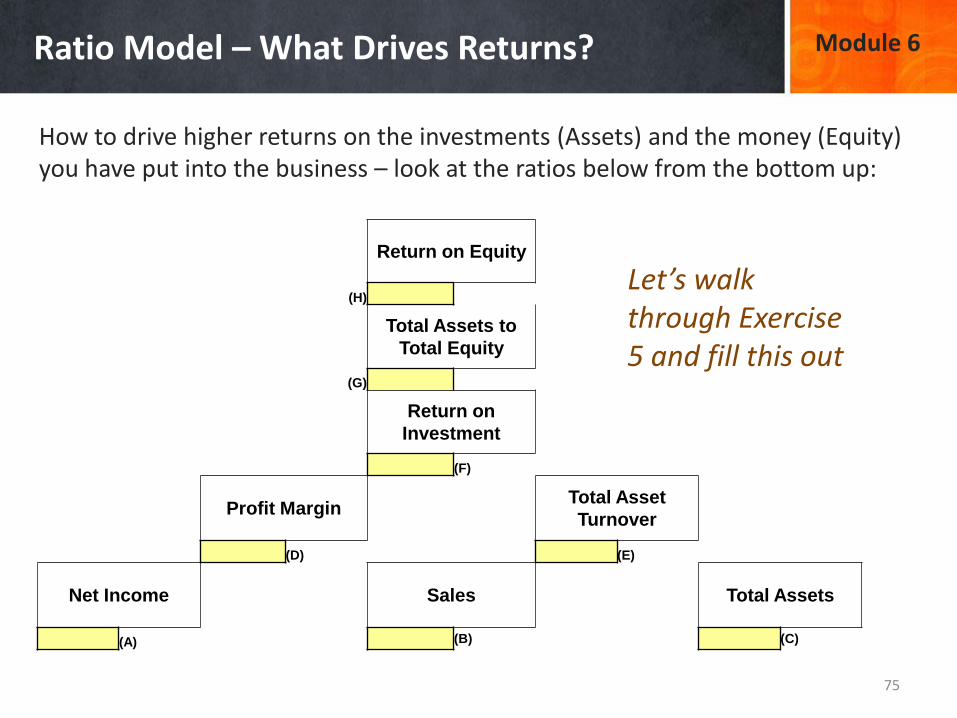
Ratio Model – What Drives Returns? Module 6
How to drive higher returns on the investments (Assets) and the money (Equity) you have put into the business – look at the ratios below from the bottom up:
Return on Equity
(H)
Total Assets to
Total Equity
(G)
Return on
Investment
(F)
Profit Margin Total Asset
Turnover
(D) (E)
Net Income Sales Total Assets
(A) (B) (C)
Let’s walk through Exercise 5 and fill this out

76
Ratio Model – Sustainable Growth Module 6

77
Ratio Model – Financial Distress Module 6
Very predictive of financial distress and bankruptcy:
Looking at Segments of the Business Module 6
78
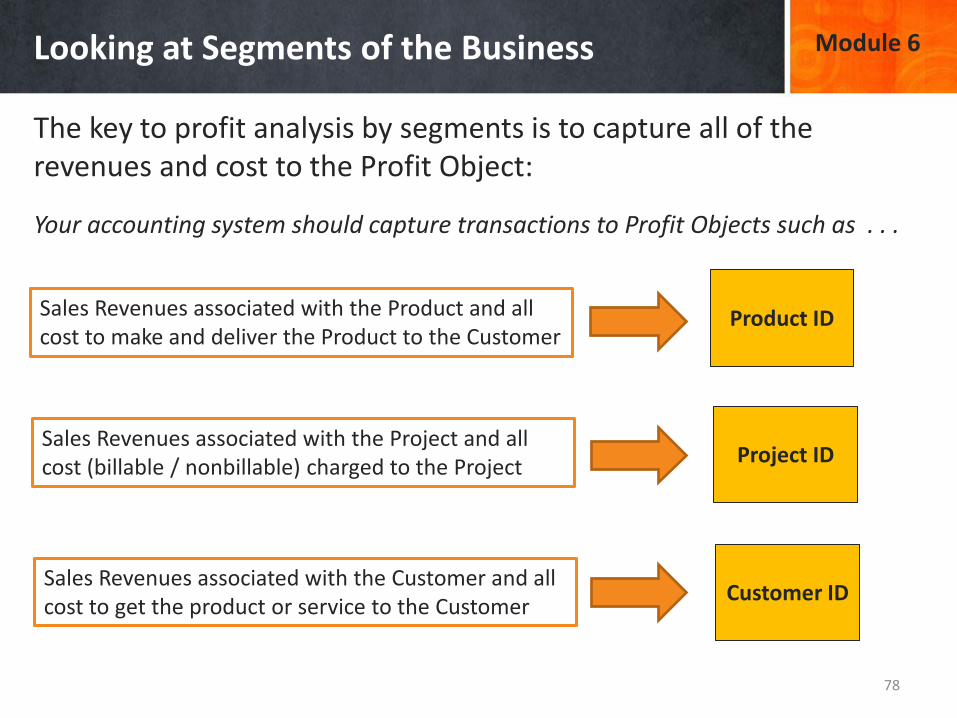
The key to profit analysis by segments is to capture all of the revenues and cost to the Profit Object:
Product ID
Project ID
Customer ID
Sales Revenues associated with the Product and all cost to make and deliver the Product to the Customer
Sales Revenues associated with the Project and all cost (billable / nonbillable) charged to the Project
Sales Revenues associated with the Customer and all cost to get the product or service to the Customer
Your accounting system should capture transactions to Profit Objects such as . . .

Financial Performance by Segments Module 4
Store A Store B Store C Store D
Sales 100% 100% 100% 100%
Cost of Goods Sold 46% 51% 42% 55%
Gross Margin 54% 49% 58% 45%
Operating Expenses 34% 27% 36% 31%
Operating Margin 20% 22% 22% 14%
Non Operating Expenses 7% 7% 9% 11%
Profit Margin 13% 15% 13% 3%
Your accounting system should be able to generate statements by location
You should be able to slice / dice sales a number of ways (product, customer, etc.)
Quarterly Sales Summarized by Type
Customer Type 2016-Q1 2016-Q2 2016-Q3 2016-Q4
Young Women (under 30) 1,159$ 1,089$ 965$ 1,105$
Young Men (under 30) 905$ 1,106$ 875$ 982$
Mid Women (31 - 55) 2,605$ 2,560$ 2,678$ 2,811$
Mid Men (31 - 55) 1,230$ 1,289$ 1,246$ 1,328$
Older Women (> 55) 633$ 606$ 584$ 621$
Older Men (>55) 455$ 460$ 403$ 479$ 79

Cost Reduction thru Process Improvement Module 6
80
Traditional approach to Cost Control – by General Ledger:
Better approach is to improve the Process!
General Ledger Account Balances
Year End Expense Accounts
Account Description Balance
4001 Cost of Goods Sold * 3,166,401.50
4003 Marketing & Promotion 377,560.00
4005 Salary Expense 474,906.82
4006 Payroll Tax Expense 86,089.15
4007 Equipment Maintenance 36,450.92
4009 Rent & Lease Expense 19,807.65
4011 Utilities Expense 11,050.86
4012 Insurance Expense 7,650.00
4014 Product Warranty Expense 6,672.00
4015 Depreciation Expense 22,880.00
4016 Interest Expense 26,404.20
4017 Tax Expense 101,678.89
Total Expenses 4,337,551.99
* consists of direct materials + direct labor + allocation of overhead
• Eliminate non-value added type activities (“Re” type activities)
• Compress hand-off’s in workflows
• Look for delays, wait times, waste, defects, holding inventory, etc.
• Too many manual processes – invest in technologies
• Look at how people spend their time – should be spent servicing an internal or external customer

Valuations – What is Your Business Worth?
81
Module 6
Most small businesses get valued based on the Operating Cash Flow – commonly calculated off the Income Statement as follows . . . . . . . .
Earnings or Net Income $ 1,850
Interest Expense (1) + 300
Taxes (1) + 420
Depreciation (2) + 160
Amortization (2) + 70
Earnings Before Interest Taxes
Depreciation Amortization or EBITDA
$ 2,800
(1)Not directly related to the actual operations of the business
(2)Not an actual disbursement of cash
Add Back

Valuations – Apply a Multiple
82
Module 6
Sales ($millions)
5 150 500 1,000
Small Lower Middle Upper Large
Businesses M I d d l e M a r k e t Companies
2-3x 4-7x 8-9x 10-11x >12x
5.4MM 300,000 2,000
Depending upon the size of the business (Total Annual Sales Revenues), the multiple will vary as applied to the Benefit Stream (EBITDA) and this is what your business is worth

Exercise 4 - Valuation
83
Module 6
Referring to the Income Statement to the right and with the assumption that a business of your size and your industry typically sells for 4 times its EBITDA number, what is your business worth?

Intellectual Capital
84
Module 6
Increasingly, the value or worth of a business is driven by assets that do not show up on the Balance Sheet – Intellectual Capital:

Keys to Growing Intellectual Capital (IC)
85
Module 6
Three major areas of Intellectual Capital that touch most businesses. Three M Rule: Measure, Manage, and Maximize your IC
Major IC
Category
IC Description Measure to Grow
(Appreciate IC)
Human Capital Value of a business that is
contained in the skills, abilities
and talents of its people.
Level of Competency,
Level of Experience,
Advanced Certifications
Organizational
Capital
Value of a business that is
contained in the processes,
systems, patents, trademarks,
reputation, innovation, etc.
Process Turn Around
Times, % of Innovative
Ideas Implemented, # of
Patents Licensed, etc.
Relational Capital Value of a business contained in
its relationships with customers,
suppliers, other businesses,
government, etc.
Customer Retention
Rate, Satisfaction
Surveys, Supply Chain
Metrics with Vendors,

Broader View of Metrics
86
Module 6
Measurement Area => Customer Service (Price, Delivery, Support, Satisfaction). Metric Examples => Price comparisons to competition, number of on-time deliveries, response times, customer complaints, number of product returns, customer survey results, service awards, etc.) Measurement Area => Internal Operations (Efficiency, Costs, Production, Inventories). Metric Examples => Cycle times, inventory turnovers, defect rates, plant utilization, targets met, unit cost compared to competition, overhead trends, etc. Measurement Area => Innovation (New Products, Technology, R & D). Metric Examples => Number of new products, number of patents, new technologies adopted, system improvements implemented, etc. Measurement Area => Financial (Profitability, Growth, Value). Metric Examples => Sales Growth Rate, Gross Margin, Operating Cash Flow, Return on Equity, Return on Investments in Assets
Measure the Non Financial Parts of the Business - Critical to driving Financial Results. This allows you to be more pro-active on performance issues:

Metrics for Different Business Models
87
Module 6

Recap and Key Points
88
Module 6
1. Once you understand Ratios, you can leverage this approach through Ratio Models to gain key insights on how to run the business. a. How many days do I have to finance the business? b. What is a sustainable growth rate for the business? c. Is this business bankrupt?
2. Segment your Customers, Products, Projects – What segment is the most and least profitable?
3. Cut cost through elimination of work, not the workers. Time is what drives cost – how can we do this with less effort?
4. All business owners should have some grounding in how their business gets Valued. This is your basis for Retirement!
5. Intellectual Capital is now critical to increasing the value of most businesses

89
Module 7 Business Analysis

Solving Business Problems Module 7
90
What are the most important issues? Pareto Analysis
How does my industry work?
What is our current situation?
What performance areas are weak?
Porter’s Five Forces
SWOT
Benchmarking
How well do we manage our products / services? Boston Growth Matrix
GE Business Screen How well do we manage our different businesses?
What is causing this problem? Root Cause Analysis
There are a wide range of analytical models that you can use to solve key business questions. Here are some examples:
Root Cause Analysis Module 7
91
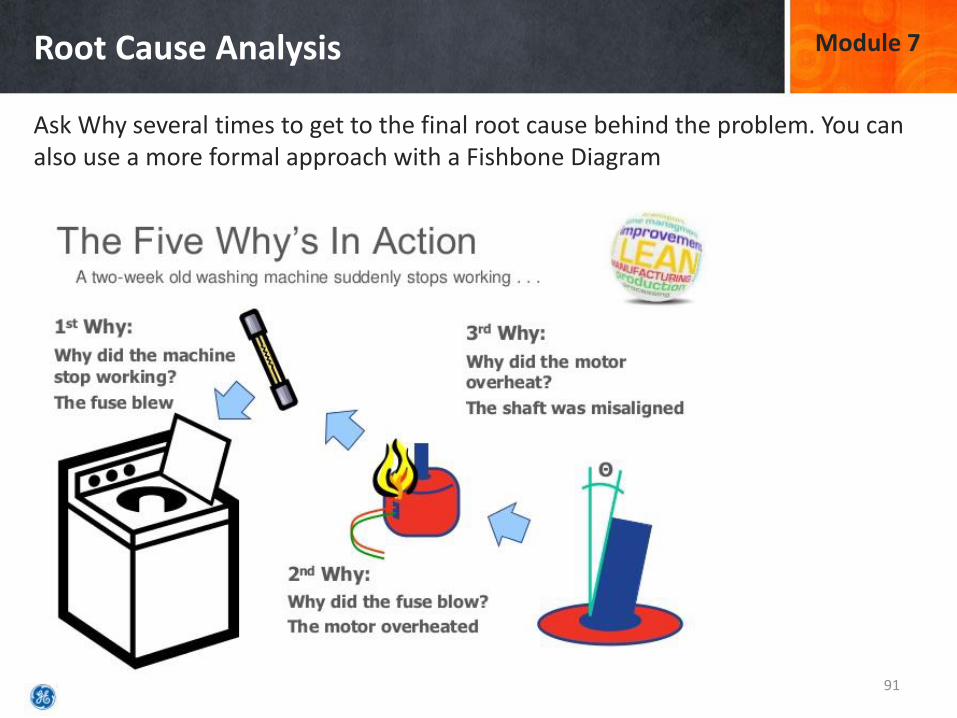
Ask Why several times to get to the final root cause behind the problem. You can also use a more formal approach with a Fishbone Diagram

Example of Root Cause Analysis
92
https://www.youtube.com/watch?v=BEQvq99PZwo
Module 7
The Jefferson Memorial shows how you might have to go through root cause analysis more than once to finally get to the source of your problem:

Most Popular Analytical Model - SWOT Module 7
93
Internal Assessment of the organization, its people, services, competencies, etc.
External Assessment of direct and indirect forces, social, economic, political, etc.
Client has a global infrastructure to
service all types of customers
Strengths Weaknesses
Services are in high demand in most
parts of the world
Client has limited resources for
expanding its global reach
Key processes are not very cost competitive
when compared to other service providers
Untapped demand exists in almost half
of the World
New Technologies make it possible to
expand service reach
Other clients are investing in newer
technologies
Some clients are entering into strategic
partnerships to expand their global
footprint
Threats Opportunities
It is important to periodically assess your current situation. This is best done using the SWOT Model
A very good instructional video: https://www.youtube.com/watch?v=I_6AVRGLXGA

Industry Analysis – Porter’s Five Forces Module 7
94
If you want to fully understand your industry, look at five different forces that define your industry:

Example – Porter’s Five Forces Module 7
95
McDonald’s (MCD) and the Fast Food Industry might look like this:
Categorize Your Products – Boston Matrix Module 7
96
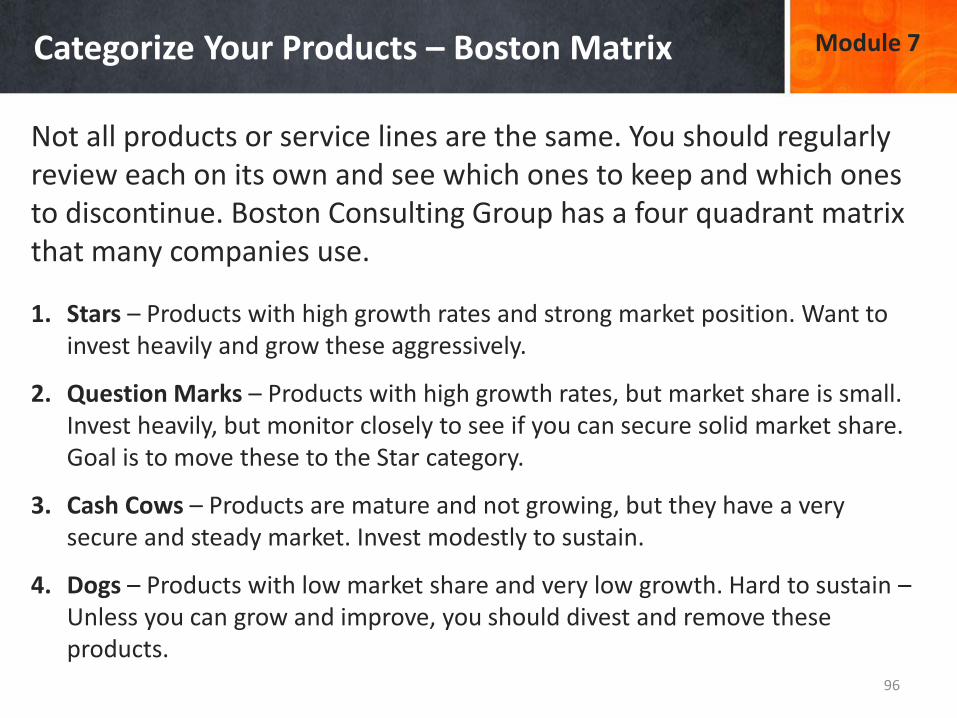
1. Stars – Products with high growth rates and strong market position. Want to invest heavily and grow these aggressively.
2. Question Marks – Products with high growth rates, but market share is small. Invest heavily, but monitor closely to see if you can secure solid market share. Goal is to move these to the Star category.
3. Cash Cows – Products are mature and not growing, but they have a very secure and steady market. Invest modestly to sustain.
4. Dogs – Products with low market share and very low growth. Hard to sustain – Unless you can grow and improve, you should divest and remove these products.
Not all products or service lines are the same. You should regularly review each on its own and see which ones to keep and which ones to discontinue. Boston Consulting Group has a four quadrant matrix that many companies use.

Example – Boston Matrix Module 7
97

Pareto Analysis – 80 / 20 Rule Module 7
98
Categories
Causes, Products, Mfg. Lines, Operators Machines, Defect Types, etc. D
ow
nti
me,
Err
ors
,
# o
f E
mp
loy
ees,
etc
.
Allocate your limited resources to the few items that represent the largest portion of the entire population
Spend your time and resources where it matters the most. Pareto Analysis forces you to apply a measure to a set of objects, helping you understand where to focus

Example of Pareto Analysis
99
Module 7
Where should we allocate our limited school budget in accordance with complaints submitted?
3 complaints (broken branches, fans not working and bad atmosphere) make up 57% of total complaints

Multiple Choice Question
100
Module 7
Every year, it is recommended that every business do an assessment where it stands and renew its strategy for the up coming year. Which of the following analytical models would you apply to address this task?
a. Porter’s Five Forces b. Root Cause Analysis c. SWOT Analysis d. Pareto Analysis

Recap – Business Analysis
101
Module 7
1. Be Proactive – Solve your problems BEFORE it shows up on the financial statements. This requires a very analytical approach to running the business.
2. Three Step Process: 1. Define the Problem 2. Select the right Analytical Model 3. Apply the Analytical Model
3. Non Financial Parts (Customer, Processes, etc.) drive financial results. Don’t just measure financial results – measure your non financial parts. Examples: 1. Customer Satisfaction Survey 2. Process Efficiency 3. Product Quality 4. Employee Turnover Rate

Wrap Up
102

Summarize Key Points
103
1. Someone must keep the books – you must do accounting to understand if you are losing or making money.
2. Generate and review your financial statements on a monthly or quarterly basis
3. Analyze the financial statements with ratios, horizontal and vertical analysis – be analytical in how you look at numbers
4. Current Assets must turn over and go through cash 5. Long Term Assets must generate a Return greater than the cost to finance the
investment 6. Benchmark the financials to evaluate your financial performance according to
your industry (NAICS) code 7. Evaluate your long term investments – does it generate benefits greater than
the cost and if the life cycle is several years, consider discounting at the cost of financing or required return to see what the investment is worth to the business. This is what big companies do when they make major investment decisions.

Summarize Key Points - continued
104
8. You can leverage the use of ratios within certain models to help manage key financial goals
9. It is helpful to assess profits by key segments of the business such as products, customers, locations, etc.
10. Business owners should ultimately try and increase the value of the business. Value is determined based on a benefit stream such as EBITDA with a multiple applied.
11. Increasingly it is the Intellectual Capital of the business that drives performance and value.
12. You can solve a wide range of business problems through the application of analytical models such as SWOT, Pareto Analysis, and Root Cause Analysis.
Some More Useful Links (More Advanced)
105
Finance and Accounting Seminars > https://www.seminarinformation.com/search.cfm?tp=7 Teach Me Finance > http://www.teachmefinance.com/ Finance World > http://web.utk.edu/~jwachowi/wacho_world.html Study Finance > http://www.studyfinance.com/ Principles of Finance > http://educ.jmu.edu//%7Edrakepp/principles/

106
DC SCORE Mentors with a Financial Background: Matt H. Evans – Silver Spring Library | Phone: 240-773-9420 [email protected] Len Briskman – Rockville Library | Phone: 240-777-0001 [email protected] Diane Starkey – Wheaton Library | Phone: 240-777-0678 [email protected] Mariann Zylstra – Gaithersburg, MD | Phone: 240-618-9263 [email protected] Mike Kipp – Ashburn, VA | Phone: 202-619-1000 [email protected]