


Languages
Pages
Legal


Revision of the Mbonambi IDP 2008/2009:
Mbonambi Municipality
July 2008 1
MBONAMBI MUNICIPALITY
IDP Review
2008/2009
July 2008

Revision of the Mbonambi IDP 2008/2009:
Mbonambi Municipality
July 2008 2
TABLE OF CONTENTS
A. EXECUTIVE SUMMARY .............................................................................. 7
1. OVERVIEW OF THE MBONAMBI MUNICIPALITY ...................................... 7
2. INFRASTRUCTURE AND THE ECONOMY .................................................... 9
2.1 INFRASTRUCTURE ................................................................................ 9
2.2 THE LOCAL ECONOMY .......................................................................... 10
3. KEY DEVELOPMENT ISSUES .................................................................... 10
4. PROCESS PLAN ....................................................................................... 12
B. BACKGROUND TO THE IDP ..................................................................... 14
1. INTRODUCTION ...................................................................................... 14
2. WHAT IS AN IDP ..................................................................................... 15
3. OVERVIEW OF THE LEGAL AND POLICY ENVIRONMENT ........................ 16
3.1 NATIONAL LEGISLATION ...................................................................... 16
3.2 PROVINCIAL ACTS ............................................................................... 17
C. SITUATIONAL ANALYSIS ........................................................................ 18
1 DEMOGRAPHIC OVERVIEW .................................................................... 18
1.1 REGIONAL CONTEXT ............................................................................ 18
1.2 ADMINISTRATIVE ENTITIES.................................................................. 19
1.3 LAND USE ............................................................................................ 19
1.4 DEMOGRAPHICS .................................................................................. 19
a) Population Distribution and Household Sizes ..................................................... 20
b) Gender Breakdown ......................................................................................... 20
c) Age Distribution ............................................................................................. 20
d) Pensioner Headed Households ........................................................................ 21
e) Education Levels ............................................................................................ 22
f) HIV/Aids Scenarios ......................................................................................... 23
2 ECONOMIC OVERVIEW ........................................................................... 24
2.1 Economic Indicators (2001 census).................................................................. 24
2.2 Economic Sectors ........................................................................................... 29
3 SOCIAL OVERVIEW ................................................................................. 31
3.1 ELECTRICITY ....................................................................................... 31
3.2 TRANSPORT NETWORK ........................................................................ 35
3.3 CEMETERIES / CREMATORIA ................................................................. 35
3.4 TELECOMMUNICATIONS ....................................................................... 36
3.5 ROLL-OUT OF FREE BASIC SERVICES ..................................................... 37
3.6 COMMUNITY FACILITIES AT SECONDARY NODES ................................... 38
3.7 COMMUNITY FACILITIES AT TERTIARY NODES ....................................... 39
3.8 TRAVEL TIME TO COMMUNITY FACILITIES ............................................. 40
3.9 EDUCATION FACILITIES ....................................................................... 41
3.10 HEALTH FACILITIES ............................................................................. 43
3.11 COMMUNITY CENTRES / HALLS ............................................................. 43
3.12 SPORTS FIELDS / FACILITIES ................................................................ 44
3.13 TRADITIONAL ADMINISTRATIVE CENTRES ............................................ 45

Revision of the Mbonambi IDP 2008/2009:
Mbonambi Municipality
July 2008 3
3.14 CEMETERIES ....................................................................................... 45
3.15 CRECHES ............................................................................................. 46
3.16 PENSION PAYOUT POINTS .................................................................... 47
3.17 DISTRIBUTION OF COMMUNITY FACILITIES .......................................... 48
3.18 HOUSING ............................................................................................ 51
3.19 LAND REFORM ..................................................................................... 52
3.20 ENVIRONMENTAL CONSIDERATIONS ..................................................... 53
3.20.1 Environmental Considerations .................................................................... 53
3.20.2 Land Capability Classification ..................................................................... 53
3.21 SOLID WASTE ...................................................................................... 54
4 ENVIRONMENT AND AGRICULTURE ....................................................... 60
4.1 THE NATURAL ENVIRONMENT ............................................................... 60
4.2 AGRICULTURE ..................................................................................... 64
4.3 WATER & SANITATION ......................................................................... 65
5 INITIATIVES WITHIN THE MUNICIPAL AREA ........................................ 68
5.1 SOKHULU FARM ...................................................................................... 68
5.2 N2 COMMERCIAL DEVELOPMENT.................................................................. 68
5.2.1 KwaMbonambi Country Estate ................................................................... 70
5.3 TOURISM............................................................................................... 71
6 ORGANISATIONAL .................................................................................. 72
6.1 INSTITUTIONAL ARRANGEMENTS ......................................................... 72
6.2 MUNICIPAL POWERS AND FUNCTIONS................................................... 77
6.3 MUNICIPAL POLICIES ........................................................................... 78
7 KEY ISSUES ............................................................................................ 79
7.1 KEY ISSUES EXTRACTED FROM UPDATED STATUS QUO .......................... 79
D. DEVELOPMENT STRATEGIES .................................................................. 81
1 VISION AND MISSION ............................................................................ 81
1.1 THE MUNICIPAL VISION ....................................................................... 81
1.2 MISSION AND FUNDAMENTALS ............................................................. 81
1.3 VALUE SYSTEM .................................................................................... 82
2 STRATEGIC DEVELOPMENT RATIONALE: FOCUS AREAS ........................ 83
2.1 EXPLANATION OF TERMINOLOGY .......................................................... 84
2.2 STRATEGIC STRUCTURE ....................................................................... 86
2.3 STRATEGIC FOCUS AREAS, DEVELOPMENT GOALS, STRATEGIES AND OBJECTIVES
......................................................................................................... 87
3 NATIONAL & PROVINCIAL POLICY PERSPECTIVE .................................. 92
3.1 NATIONAL SPATIAL DEVELOPMENT PERSPECTIVE .................................. 92
3.2 ACCELERATED AND SHARED GROWTH INITIATIVE FOR SOUTH AFRICA (ASGISA)
......................................................................................................... 93
3.3 KWAZULU-NATAL PROVINCIAL GROWTH AND DEVELOPMENT STRATEGY . 95
3.4 PROVINCIAL SPATIAL & ECONOMIC DEVELOPMENT STRATEGY ............... 98
E. OVERVIEW OF SPATIAL DEVELOPMENT FRAMEWORK ........................... 99
1 SPATIAL DEVELOPMENT FRAMEWORK ................................................... 99
1.1 THE LAND USE CONFIGURATION................................................................... 99

Revision of the Mbonambi IDP 2008/2009:
Mbonambi Municipality
July 2008 4
1.2 THE URBAN AND RURAL HIERARCHY ............................................................ 100
1.3 PROPOSED NODES ................................................................................. 101
1.4 DRAFT LAND USE MANAGEMENT (LUMS) .................................................... 103
F. SECTOR INVOLVEMENT ........................................................................ 106
1 OVERVIEW OF DLGTA DEVELOPMENT PROGRAMME ............................ 106
1.1 VISION .............................................................................................. 106
1.2 MISSION STATEMENT ........................................................................ 106
1.3 STRATEGIC OBJECTIVES .................................................................... 106
1.4 CORE FUNCTIONS .............................................................................. 107
1.5 TRANSFERS TO MBONAMBI MUNICIPALITY: MEDIUM-TERM ESTIMATES 107
2 DEPARTMENT OF TRANSPORT .............................................................. 108
3 ESKOM .................................................................................................. 108
4 DEPARTMENT OF EDUCATION .............................................................. 109
G. IMPLEMENTATION PLAN ...................................................................... 110
H. MUNICIPAL PROJECTS ......................................................................... 120
1 MIG PROJECTS ..................................................................................... 120
2 MAYORAL PROJECTS ............................................................................ 123
I. FINANCIAL PLAN AND SDBIP ............................................................... 126
1 INTRODUCTION .................................................................................... 126
1.1 THE FIVE YEAR CAPITAL INVESTMENT PROGRAMME ............................. 126
1.2 STRATEGIES ...................................................................................... 126
1.2.1 REVENUE RAISING STRATEGIES .............................................................. 126
1.2.2 FINANCIAL MANAGEMENT STRATEGIES ................................................... 127
1.2.3 ASSET MANAGEMENT STRATEGIES .......................................................... 127
1.2.4 CAPITAL FINANCING STRATEGIES ........................................................... 129
2 DRAFT SERVICE DELIVERY AND BUDGET IMPLEMENTATION PLAN
2008/9 (SDBIP) ................................................................................... 137
3 ANNUAL FINANCIAL REPORT ............................................................... 137
4 REPORTS OF THE AUDITOR GENERAL .................................................. 137
5 BUDGET ALIGNMENT WITH INTEGRATED DEVELOPMENT PLAN .......... 137
6 CONCLUSION ........................................................................................ 138
J. ORGANISATIONAL PERFORMANCE MANAGEMENT SYSTEM ................. 139
1 PERFOMANCE MANAGEMENT SYSTEM: BALANCE SCORECARDS .......... 139
K. APPENDICES ......................................................................................... 148
1 LOCAL ECONOMIC DEVELOPMENT PLAN .............................................. 148
2 DISASTER MANAGEMENT PLAN ............................................................ 150
2.1 DISASTER RISK MANAGEMENT PLAN ................................................... 150
2.2 OBJECTIVE ........................................................................................ 150
2.3 PURPOSE ........................................................................................... 150
2.4 BACKGROUND ................................................................................... 150
2.5 RISK REDUCTION PROJECTS IDENTIFIED BY DISASTER MANAGEMENT . 151

Revision of the Mbonambi IDP 2008/2009:
Mbonambi Municipality
July 2008 5
3 LOCAL ECONOMIC DEVELOPMENT PLAN .............................................. 152
L. ANNEXURES .......................................................................................... 154
MAPS
Regional Context
Administrative Entities
Population Density
Household Distribution
Low Income Households
Draft Spatial Development Framework
Education Facilities
Health Facilities
Community Centres / Halls
Sport Fields / Facilities
Courts
Cemeteries
Crèches
Pension Payout Points
Distribution of Community Facilities
Land Capability

Revision of the Mbonambi IDP 2008/2009:
Mbonambi Municipality
July 2008 6
TABLES
Table 1: Population and Household Size ......................................................................... 20
Table 2: Gender Breakdown .......................................................................................... 20
Table 3: Age Distribution .............................................................................................. 20
Table 4: Pensioner Headed Households .......................................................................... 22
Table 5: Education Levels ............................................................................................. 22
Table 6: Employment Status.......................................................................................... 24
Table 7: Occupation ..................................................................................................... 25
Table 8: Employment Sector ......................................................................................... 26
Table 9: Mbonambi � Employment Type by Economic Sector (2007) (%) .......................... 27
Table 10: Average Annual Household Income ................................................................. 27
Table 11: Main Expenditure Items ................................................................................. 28
Table 12: Dependents per Person Employed ................................................................... 28
Table 13: Involvement in the Informal Economy ............................................................. 29
Table 14: Prioritised LED Projects ................................................................................ 149
Table 15: Energy Source for Lighting (2001) ................................................................... 32
Table 16: Energy for Lighting as per Quality of Life Survey (2007) .................................... 33
Table 17: Energy Source for Cooking (2001) ................................................................... 33
Table 18: Energy for Cooking as per the Quality of Life Survey (2007) .............................. 34
Table 19: Telecommunications (2001) ............................................................................ 36
Table 20: Access to Communication Facilities as per Quality of Life Survey (2007) ............. 37
Table 21: Community Facilities at Secondary Nodes (3km radius) ..................................... 38
Table 22: Community Facilities at Tertiary Nodes (2km radius) ......................................... 39
Table 23: Community Facilities at Tertiary Nodes (2km radius) ......................................... 40
Table 24: Education Facilities ........................................................................................ 41
Table 25: Health Facilities ............................................................................................. 43
Table 26: Community Centres / Halls ............................................................................. 43
Table 27: Sport Fields / Facilities ................................................................................... 44
Table 28: Traditional Administrative Centres ................................................................... 45
Table 29: Cemeteries .................................................................................................... 45
Table 30: Creches ........................................................................................................ 46
Table 31: Pension Payout Points .................................................................................... 47
Table 32: Distribution of Community facilities (at Ward level) ........................................... 48
Table 33: Approved Housing Projects ............................................................................. 51
Table 34: Housing Projects in Packaging Phase or Awaiting Approval ................................ 52
Table 35: Housing Projects at Initiation Stage or Experiencing Blockages .......................... 52
Table 36: Refuse Removal (2001) .................................................................................. 54
Table 37: Refuse Removal as per the Quality of Life Survey (2007) .................................. 54
Table 38: Water Source (2001)...................................................................................... 65
Table 39: Water Services as per Quality of Life Survey (2007) .......................................... 65
Table 40: Sanitation Facilities (2001) ............................................................................. 66
Table 41: Sanitation Services as per the Quality of Life Survey (2007) .............................. 67
Table 42: Progress in Eradicating Water Backlogs ........................................................... 67
Table 43: Progress in Eradicating Sanitation Backlogs ...................................................... 67

Revision of the Mbonambi IDP 2008/2009:
Mbonambi Municipality
July 2008 7
A. EXECUTIVE SUMMARY
1. OVERVIEW OF THE MBONAMBI MUNICIPALITY
Mbonambi Municipality is situated within the uThungulu District Municipality in the north-east
of KwaZulu-Natal and covers an area of approximately 1,209km2. It is one of six
municipalities within the District Municipality. The N2 national road passes through the
Municipality which connects it to major towns such as Richards Bay and Durban. The
significance of this road to the Municipality is that it serves as the major economic corridor in
the area. The map below show the regional context of the municipality

Revision of the Mbonambi IDP 2008/2009:
Mbonambi Municipality
July 2008 8

Revision of the Mbonambi IDP 2008/2009:
Mbonambi Municipality
July 2008 9
The municipality has an estimated population size of 106, 943 of which 53% are women.
The average population density is estimated at 88 people per km2.
The Municipality is adjacent to Richards Bay and Empangeni Complex. Its borders are: the
Indian Ocean to the east; Umfolozi River to the north; Mhlana Tribal Authority to west and
UMhlathuze Municipality to the south. It is characterized by three geographical districts
portions which are: coastal: Sokhulu-Mbonambi Traditional Authorities; Commercial
Plantations along the N2 and Mhlana Traditional Authority to the west.
The following provides a summary of household related data for the Mbonambi Local
Municipality based on the 2001 Census data:
POPULATION 106,943
HOUSEHOLDS 20,437
AV. HH SIZE 5.23
The major town in the Mbonambi Municipality is KwaMbonambi town. It is primarily a
residential town with limited services and facilities and few employment opportunities. Plans
are in place to boost the retail sector of the town to cater for the needs of local people. A
number of emerging centres have been identified and added to the existing established
service and administrative centres, in order to improve service delivery to these towns and
their hinterlands, and to promote local economic development. The Municipality further
intends to establish and expand the administrative and service delivery functions of these
towns which hopefully will serve to attract other investment in response to the concentration
of facilities and people.
The District is well endowed with natural resources. Some of these include Dawson�s
Rock, Lake Nhlabane, and its terminus in Nhlabane estuary which are located in the north of
the District and south of Maphelane. This beautiful stretch of coastline is relatively unknown
and mostly inaccessible from the nearby N2, and has been identified as a potential coastal
destination. Mapelane Reserve is located at the southern extremity of the Greater St Lucia
Wetland Park, recently proclaimed as a World Heritage Site.
2. INFRASTRUCTURE AND THE ECONOMY
2.1 INFRASTRUCTURE
UThungulu District Municipality is the Water Services Provider for the District Municipality.
The roll-out of free basic services (i.e. 6kl of free water per household per month) is closely
linked to the roll-out of the UDM Water Services Development Plan. In the areas of the
municipality which are covered by water schemes and reticulation, free water is made
available to households at 6kl per household per month.
Electricity is supplied in bulk by Eskom who also provide the reticulation to informal
settlements. Most of the households in the traditional areas have inadequate access to
electricity. The UDM has prepared an Energy Sector Plan which has identified primary areas
for supply for the elimination of the electricity backlog on an incremental basis.

Revision of the Mbonambi IDP 2008/2009:
Mbonambi Municipality
July 2008 10
UThungulu District Municipality has prepared a Community Service Sector Plan. As part
of this IDP Review extensive analysis has been undertaken, and will continue to be
undertaken as information becomes available, on backlogs in the education and health
sectors in particular as well as on other community facilities available in the Municipal area.
2.2 THE LOCAL ECONOMY
The Mbonambi Locality is located near the Richards bay Empangeni cluster. The close
proximity of this Municipality to this significant cluster in Northern KZN allows the
Municipality to benefit from the trickle-down effects of development from this cluster.
The Municipality completed its LED Plan and through this document it has identified sectors
of the economy that need to be strengthened. Among other things noted:
The need to strengthen the private sector involvement in the economy of the area
especially in the tourism sector
Tourism must be used as a development instrument for the empowerment of
previously disadvantaged people.
Tourism should support the economic, social, and environmental goals of the
Municipality.
3. KEY DEVELOPMENT ISSUES
The following are some of the socio-economic development issues of the Municipality extracted
from the Status Quo document are:
N2: Municipality must tap more on the development potential presented by the N2 which
traverses the Municipal area
Employment and Poverty: employment in 2001 was 41% and unemployment 59%.
The poorest households reside in Wards 12 and 13. In these wards, more than 85% of
the households earned less than R1, 600 per month (in 2001). 78% of all households
earned less than R19,200 per annum in 2001. This situation has economic as well as
social impacts.
Lack of Diversity in the Employment Sector: most people are employed in the
primary sector. There is a need for diversification in the local economy.
Infrastructural Backlogs: More than 49% percent of households is living below the
RDP standard in terms of water, whilst more than 67% of households is living below the
RDP standard in terms of sanitation (UDM WSDP � 2004/2005 Actual percentages).
Lack of Social and Economic Investment:
o in the proposed SDF nodes;
o in Sokhulu and Mbonambi TA areas in respect of agriculture;

Revision of the Mbonambi IDP 2008/2009:
Mbonambi Municipality
July 2008 11
o commercial, industrial and residential development (particularly in the
Mbonambi urban node);
o health facilities in municipal area;
o community halls and sport facilities in Mhlana TA area;
o municipal cemetery/ies;
o land reform (complicated by TA setup);
o tourism development � particularly along coast line;
o housing backlog of 7,502 units; and
o 57% of population is less than 20 years of age � this component of the
municipality�s population require certain types of services and facilities e.g.
youth focused LED, education facilities, sport facilities, etc.
Poor infrastructure and Services delivery:
o dispersed settlement � high cost of infrastructure and service delivery;
o poor condition of rural access roads;
o no waste removal system in rural areas; and
o Inadequate provision of water, sanitation and electricity in rural areas.
The above vision strategic focus areas of the Mbonambi Local Municipality are:
o To facilitate the delivery of sustainable infrastructure and services
o To promote economic development
o To promote social development

Revision of the Mbonambi IDP 2008/2009:
Mbonambi Municipality
July 2008 12
4. PROCESS PLAN
The following is the process plan for the review of the Mbonambi IDP (2008/09):
STEP ACTIVITY TIME FRAME
1 Inception Meeting with Mbonambi Town Planner,
culminating in an Inception Report
By 1 November 2007
2 Revision of the Status Quo and Key Issues By 16 November 2007
3 One-on-one meeting with Mbonambi Town Planner
to Review Development Strategies and Objectives,
as well as the Status of Projects
By 23 November 2007
4 Review Strategic Focus Areas, Development
Strategies and Objectives
By 30 November 2007
5 IDP Steering Committee Meeting (SC) to present
and discuss the draft reviewed Status Quo, Key
Issues, Strategies and Objectives, as well as the
Status of Projects
3 December 2007
6 Combined Ward Committee Meeting (possibly split
into two geographic areas, hence 2 meetings) to
present and discuss the draft reviewed Status Quo,
Key Issues, Strategies and Objectives, as well as
the Status of Projects. The main focus being to
obtain the Wards Keys Issues.
By 15 February 2008
7 Local IDP Representative Forum Meeting to
present and discuss the draft reviewed Status Quo,
Key Issues, Strategies and Objectives, as well as
the Status of Projects. Main focus is to obtain
(preferably beforehand by written request) the Key
Issues faced by the Sector Departments and Other
Stakeholders, their respective Strategies to address
the Key Issues and the expected outcomes within
the next 5 years. Alignment between the
Municipality�s and the Sector Departments and
Other Stakeholders identified Key Issues,
Strategies and Objectives and the Sector
Departments Keys also needs to take place �
particularly how the Sector Departments and Other
Stakeholders intend to also address the
Municipality�s Key Issues
By 15 February 2008
8 Council Workshop: To present and workshop the
Key Issues, Development Strategies and
Objectives, as well as the Projects and Actions
By 29 February 2008
9 SC Meetings: Budget Alignment � culminating in a
3year Implementation Plan (with committed
human and financial resources), a 1year Detailed
Operational Plan (which will translate to the SDBIP)
and a Municipal Budget Overview together with a 3
year Financial Plan
By 28 March 2008
10 The above activities inform the compilation of the By 20 March 2008

Revision of the Mbonambi IDP 2008/2009:
Mbonambi Municipality
July 2008 13
STEP ACTIVITY TIME FRAME
draft IDP Review for 2008/2009
11 Adoption of Draft IDP Document By 28 March 2008
12 DLGTA Assessment of draft IDP Review for
2008/2009
By 27 April 2008
13 Advertisement of the draft IDP for comments (21
day comment period)
During May 2008
14 Local IDP Representative Forum Meeting to
present and discuss the draft IDP Review for
2008/2009
By 14 May 2008
15 IDP Road shows 15 to 18 May 2008
16 Incorporate comments (from DLGTA Assessment,
Local IDP Representative Forum and Road shows)
By 30 May 2008
17 Finalize IDP Review for 2008/2009 By 13 June 2008
18 Adoption of final IDP Review 2008/2009 by
Mbonambi Council
By 27 June 2008

Revision of the Mbonambi IDP 2008/2009:
Mbonambi Municipality
July 2008 14
B. BACKGROUND TO THE IDP
1. INTRODUCTION
In 2007/2008 Mbonambi Municipality prepared its second IDP for the 2007/2008-2011/2012.
IDPs are prepared according to Chapter 5 and Section 25 (1) of the Municipal Systems Act
(2000), which indicates that:
�Each municipal council must, within a prescribed period after the start of its elected term,
adopt a single, all inclusive and strategic plan for the development of the municipality which-
i. Links integrates and coordinates plans and takes into account proposals for the
development of the municipality;
ii. Aligns the resources and capacity of the municipality with the implementation of the
plan;
iii. Complies with the provisions of this Chapter; and
iv. Is compatible with national and provincial development plans and planning requirements
binding on the municipality in terms of legislation.�
The annual review of the IDP is a legislative requirement in terms of Section 34 of the
Municipal Systems Act No.32 of 2000. It stipulates that the �municipal council must review
its integrated plan annually in accordance with an assessment of its performance
measurements in terms of Section 41; and to the extent that changing circumstances so
demand; and may amend its integrated development plan in accordance with a prescribed
process.�
This report presents the first review (2008/09) of the second IDP prepared for the
Mbonambi Local Municipality for the period 2007/2008 � 2012/2013. The document is
structured as follows:
Section A provides an Executive Summary with an overview of the district, the
participatory mechanisms and the process and key timeframes for the review.
Section B provides background to the IDP and legal requirements of it.
Section C provides the Situation Analysis
Section D provides details on the Development Strategies for the Mbonambi Local
Municipality.
Section E provides overview of the Spatial Development Framework.
Section F provides inputs received from the respective sector departments.
Section G details the Three Year Implementation Plan.
Section H gives details on current Municipal Projects and planned projects.

Revision of the Mbonambi IDP 2008/2009:
Mbonambi Municipality
July 2008 15
Section I provides a Municipal Financial Plan and SDBIP.
Section J provides details on the Organizational Performance Management System.
Section K provides details on a number of Annexures.
Section L provides appendices to the document.
2. WHAT IS AN IDP
All municipalities, at both the district and the local level, are required by national legislation
(Municipal Systems Act, No. 32 of 2000) to prepare Integrated Development Plans (IDPs)
and review them annually. The above mentioned legislation specifies that the IDP should
reflect the community needs and the prioritized actions to address these needs, i.e. the
priority projects to be implemented.
The Municipal Systems Act (MSA) also prescribes that an extensive consultation process
must be undertaken as part of the IDP process to obtain the inputs from communities in
respect of their needs. Apart from specifying the needs of communities, the IDP should also
specify a Vision for the area, i.e. the desired future state of the community and its
surrounds and a plan to achieve it.
In terms of Section 26 of the Municipal Systems Act, a municipal IDP must reflect:
Councils Vision for long term development with emphasis on specific developmental and
transformation needs;
Status Quo Analysis indicating existing levels of development, with emphasis on
communities without access to basic municipal services;
Council�s Development Priorities
Council�s Development Strategies which are aligned to National and Provincial sector
plans
A Spatial Development Framework which provides a basis for land use management in
the Municipality
Operational Strategies to indicate how the IDP is to be implemented
A Disaster Management Plan/s
A Financial Plan, including budget projections for at least the next three years; and
KPI & targets determined through an OPMS based on priorities identified in the IDP

Revision of the Mbonambi IDP 2008/2009:
Mbonambi Municipality
July 2008 16
3. OVERVIEW OF THE LEGAL AND POLICY ENVIRONMENT
In the context of this project - an IDP - a number of national and provincial laws are
relevant. While some of these laws have broad application, many can be grouped sectorally
i.e. planning and development related, environmental and agricultural.
In addition, guidelines have also been prepared by various authorities to assist decision
makers with the interpretation of the legislation, in order to meet their legal responsibility of
complying with the respective laws.
This section of the report highlights the (1) national and provincial legislation and (2)
guidelines that are important for the spatial development component of the study.
3.1 NATIONAL LEGISLATION
The key legislation in terms of the preparation of IDPs is the Municipal Systems Act (Act
32 of 2000) (MSA). Section 26 of the MSA compels all municipalities to prepare an IDP as
the primary and overriding management tool. In terms of Section 26 of the MSA, some of
the core components that an integrated development plan must reflect are:
The municipal council�s vision for the long term development of the municipality.
An assessment of the existing level of development in the municipality, which must
include an identification of communities which do not have access to basic municipal
services.
The council�s development priorities and objectives, including its local economic
development aims and its internal transformation needs.
The council�s development strategies which must be aligned with any national or
provincial sectoral plans and planning requirements binding on the municipality in terms
of legislation.
A Spatial Development Framework which must include the provision of basic guidelines
for a land use management system for the municipality.
Key performance indicators and targets determined through an organizational
performance system based on the priorities identified in the IDP
Chapter 5 of the MSA gives guidance as to the preparation of IDPs by Municipalities. This is a
strategic plan for the municipality which aligns the development goals of the municipality
with the financial resources that the municipality has. As part of the IDP, the municipality
should assess the levels of existing development, formulate strategies for development and
align its strategies with the financial plan of the Municipality. The MSA provides that the
planning undertaken by a municipality must be aligned with, and complement, the
development plans and strategies of other affected municipalities and other organs of state
so as to give effect to the principles of co-operative government contained in section 41 of
the Constitution.
Another very important piece of legislation pertaining to development, per se, is the
Development Facilitation Act (DFA), No. 67 of 1995. The DFA contains general
principles for land development and decision making. Some of these principles, as contained
in section 3 of the Act, are summarized at overleaf.

Revision of the Mbonambi IDP 2008/2009:
Mbonambi Municipality
July 2008 17
1. Provision should be made for urban and rural land development � including the
development of formal and informal, existing and new settlements.
2. Illegal occupation of land should be discouraged.
3. Land development should take place effectively and in an integrated manner by:
a. Integrating social, economic, institutional, environmental and spatial aspects of
land development.
b. Developing urban and rural areas in support of each other.
c. Providing areas of residence and job opportunities close together or integrated
with each other.
d. Optimize the use of existing resources.
e. Permitting and encouraging diverse land uses.
f. Rectifying the distorted spatial patterns of the past.
g. Compaction of towns to discourage urban sprawl.
h. Ensuring a sustainable natural environment.
i. Promote conditions under which economic activities can flourish.
j. Create opportunities for small business at places of high accessibility and
economic agglomeration.
k. Provide the basics for survival to all existing settlement and focus on places with
economic potential to provide a higher level and wider range of services or
facilities.
4. Development within an area should take place within the limited resources, financial,
institutional and physical of the area in order to create a viable community and to protect
the natural environmental to enable economic growth.
3.2 PROVINCIAL ACTS
It is intended that the following two Acts be repealed by the draft KZN Development
Management / Land Use Bill:
The KwaZulu Land Affairs Act, Act No. 11 of 1992, is applicable in the former
KwaZulu areas, and applies to both urban and rural land. The Act provides for the
designation of land for settlement and development of both state and privately
owned land inside the administrative boundaries of the former KwaZulu.
The KZN Planning and Development Act, Act No. 5 of 1998, contains certain Planning
Principles applicable to development planning.
The Ingonyama Trust Act No. 3 of 1994, and subsequent Re-enactment Acts, transferred
some 3 million hectares of land to the KwaZulu king. The Act affects both rural and urban
land and is intended to protect traditional tenure and tribal areas. The Act provides for
township establishment procedures on rural land under the traditional leaders.

Revision of the Mbonambi IDP 2008/2009:
Mbonambi Municipality
July 2008 18
C. SITUATIONAL ANALYSIS
1 DEMOGRAPHIC OVERVIEW
This section of the report provides an overview of the Mbonambi Municipal area. It
comprises reference to the following:
Regional context
Administrative entities in the study area
Land use in the study area
Demographics of the study area and
The main economic characteristics of the study area
Maps attached at the end of this Section are:
Regional Context Map
Administrative Entities Map
Population Density Map
Household Distribution Map
Low Income Households Map
1.1 REGIONAL CONTEXT
(See Regional Context Map attached at the end of Section C)
Mbonambi Municipality is situated within the uThungulu District Municipality in the north-east
of KwaZulu-Natal and covers an area of approximately 1,209km2. It is one of six
municipalities within the District Municipality. The N2 national road passes through the
Municipality which connects it to major towns such as Richards Bay and Durban. The
significance of this road to the Municipality is that it serves as the major economic corridor in
the area.
The municipality has an estimated population size of 106, 943 of which 53% are women.
The average population density is estimated at 88 people per km2.
The Municipality is adjacent to Richards Bay and Empangeni Complex. Its borders are: the
Indian Ocean to the east; Umfolozi River to the north; Mhlana Tribal Authority to west and
UMhlathuze Municipality to the south. It is characterized by three geographical districts
portions which are: coastal: Sokhulu-Mbonambi Traditional Authorities; Commercial
Plantations along the N2 and Mhlana Traditional Authority to the west.
Mbonambi Municipality comprises a long flat coastal plain rising gently from the coast
towards the west where it reaches a height of approximately 200 masl (metres above mean
sea-level), the highest point being Kwamendo in the west at 381 masl. The coastal plain is
interspersed by high dunes and is further characterized by a number of short perennial rivers
that originate within the area and either drain northwards towards the Umfolozi River or

Revision of the Mbonambi IDP 2008/2009:
Mbonambi Municipality
July 2008 19
towards the coastal lakes in the vicinity of Richards Bay to the south. Two coastal lakes lie
within the area, Lake Nhlabane on the coast and Lake Eteza towards the north.�
1.2 ADMINISTRATIVE ENTITIES
(See Administrative Entities Map attached at the end of Section C)
The municipal area is divided into 13 Council Wards. Mbonambi Municipality comprises of 3
Traditional Authorities (TA) Areas. These are:
Mbonambi TA (8145 ha)
Sokhulu TA (14877 ha); and
Mhlana TA (51678 ha)
Land tenure within the Mbonambi Municipal area can be divided into six different categories:
KwaMbonambi � proclaimed urban settlement within the centre of the municipality
Sobukwe � informal settlement,
Privately owned land around KwaMbonambi
Lake Teza� formal conservation area
The Ingonyama Trust land � east and west of the privately owned land
Proclaimed mine lease
KwaMbonambi town is the only formal urban centre within the Mbonambi Municipality.
The area along the N2 in the Municipality is characterized by commercial
agricultural/plantations. Whereas the Traditional Authority areas characterized by scattered
settlement patterns with lack strong sense of nodal hierarchy. The disperse settlement
character remains problematic and when coupled with unfavorable physical conditions found
in these areas; it means that delivery of services and infrastructure to these areas will
remain expensive.
1.3 LAND USE
In terms of the Land Use Management Scheme (LUMS) for Mbonambi, Mbonambi
Municipality is characterized, in terms of land use, by:
o Fragmented Traditional Settlements;
o Small scale Traditional Agriculture;
o One formal urban centre, namely Mbonambi Town;
o Forestry plantations by big companies and commercial agriculture along the N2
o Lack of commercial agriculture in Traditional Authority areas
1.4 DEMOGRAPHICS
The 2001 census data has been used for the demographic and the economic information in
this section. In addition, extracts from the uThungulu Quality of Life Survey (QOLS) for the
2006/2007 year are also provided. Were reference has been made to the uThungulu QOLS
it will be indicated as such.

Revision of the Mbonambi IDP 2008/2009:
Mbonambi Municipality
July 2008 20
a) Population Distribution and Household Sizes
Table 1: Population and Household Size
POPULATION 106,943
HOUSEHOLDS 20,437
AV. HH SIZE 5.23
The uThungulu QOLS calculated the average households size for Mbonambi to be 6,55 in
2007.
The Mbonambi IDP 2006/2007 shows that population densities vary from 0 to 800 people
per km² with the average population density being less than 300 people per km². The
Population Density and Household Distribution Maps (see attached at the end of
Section C), clearly depicts that people are generally settled in Traditional Authority Areas and
in areas along the coast with Ward 2 of the Municipality being sparsely populated with
concentration of people around KwaMbonambi Town.
It is also interesting to note that Absentee Household members (according to the QOLS) in
Mbonambi are 22, 26% which is higher than the uThungulu District average of 17, and 71%.
This is indicative of people temporarily leaving the Mbonambi Municipal area for employment
and even higher order educational purposes.
b) Gender Breakdown
Table 2: Gender Breakdown
MALE 49893 47%
FEMALE 57050 53%
c) Age Distribution
Table 3: Age Distribution
Age Category Population Percentage
0-4 13414 13%
5-9 14810 15%
10-14 14638 15%
15-19 14047 14%
20-24 9910 8%
25-29 7981 5%
30-34 5787 4%
35-39 5572 4%
40-44 5242 4%
45-49 3809 3%

Revision of the Mbonambi IDP 2008/2009:
Mbonambi Municipality
July 2008 21
Age Category Population Percentage
50-54 2818 3%
55-59 2092 2%
60-64 2104 3%
65-69 1507 2%
70-74 1582 2%
75-79 740 1%
80+ 890 1%
TOTAL 106943 100%
The table above depicts the information contained in the 2001 census which shows that
Mbonambi has a large younger population, i.e. 57% of the total population in the
Municipality is younger than 20 years of age. This has a implication in terms of types of
services that might be needed to cater for this age group which impacts on the Municipal
budgeting thereof.
The above is confirmed by the QOLS that found that 56, 82% of the population is younger
than 19 years of age.
d) Pensioner Headed Households
The QOLS has for the last three years been investigating the extent of pensioner headed
households in the district. In the following table, a comparison is drawn between the extent
of pensioner headed households since 2004 between the Mbonambi Local Municipality and
the uThungulu District.
0% 5% 10% 15% 20%
0-4
15-19
30-34
45-49
60-64
75-79
Ag
e C
ate
go
ries
Age Distribution

Revision of the Mbonambi IDP 2008/2009:
Mbonambi Municipality
July 2008 22
Table 4: Pensioner Headed Households
Municipality % Pensioner Headed Households
2004 2005 2006
Mbonambi 38.41 32.68 22.30
uThungulu 35.60 31.45 32.43
From the above table it is clear that the occurrence of pensioner headed households has
remained stable at the district level while a decrease is observed in the Mbonambi Local
Municipality.
e) Education Levels
Table 5: Education Levels
LEVEL %
No Schooling 30%
Some Primary 22%
Completed Primary 6%
Some Secondary 27%
Grade 12/Std 12 13%
Higher 2%
TOTAL 100%
In 2001; 30% of the total adult population in the Municipality had no formal education and
only 2% of the adult population had higher education.
Level of Education for Adult Population
0%
5%
10%
15%
20%
25%
30%
35%
No
Schooling
Some
Primary
Completed
Primary
Some
Secondary
Grade
12/Std 12
Higher

Revision of the Mbonambi IDP 2008/2009:
Mbonambi Municipality
July 2008 23
f) HIV/Aids Scenarios
There are no clear statistics which can be reliably be used to determine the rate of HIV/AIDS
infection in Mbonambi Municipality. As a result thereof, a national ratio of 1:4 people that
are HIV positive is used. Relating this back to the number of people in the Municipality; it
can then be assumed that 26,735 are infected with HIV (based on a population size of
106,943� census 2001).
The QOLS indicated a very low awareness of HIV/Aids Campaigns in the Mbonambi
Municipality. The awareness decreased significantly from 67% in 2005 to only 5% in
2006/2007. A further concern is the overall decreased awareness at the district level from
63% in 2004 to 46% in 2006/2007.

Revision of the Mbonambi IDP 2008/2009:
Mbonambi Municipality
July 2008 24
2 ECONOMIC OVERVIEW
2.1 Economic Indicators (2001 census)
Table 6: Employment Status
STATUS NO %
Employed 12013 41%
Unemployed 17136 59%
TOTAL ECONOMICALLY ACTIVE 29149 49%
Not Economically Active 30540 51%
TOTAL 59689 100%
Of the Economically Active Population (48% of people residing in Mbonambi Municipality,
which is not of school-going age) only 41% is employed, meaning that the unemployment
rate is extremely high, i.e. 59%. The high number of people who are not economically active
can also be as a result of discouraged people who see no point in seeking work as their
previous attempts have been unsuccessful.
An interesting statistic from the QOLS is that the main place of employment for 51.35% of
the households in Mbonambi is Richards Bay/Empangeni. The second largest place of
employment for the Mbonambi Municipality is EThekwini that was found to be the place of
employment for 10, 81% of the households.
Employment Status
0%
10%
20%
30%
40%
50%
60%
70%
Employed Unemployed Not Economically Active
Revision of the Mbonambi IDP 2008/2009:
Mbonambi Municipality
July 2008 25
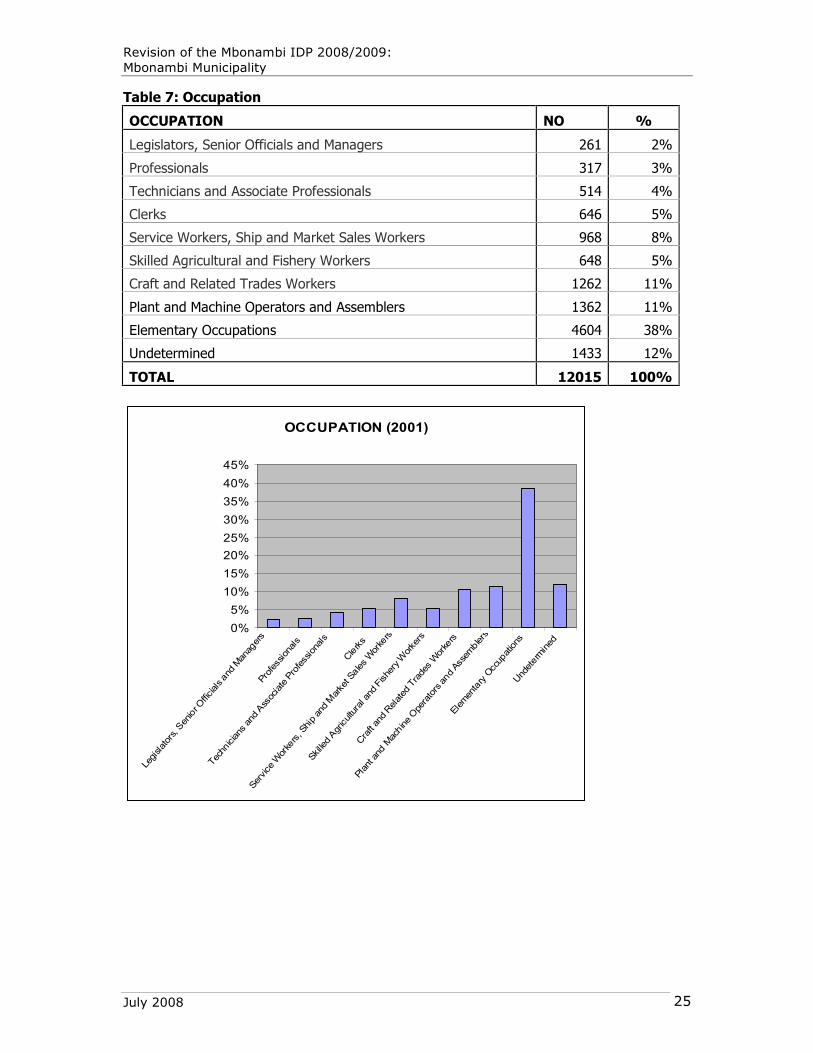
Table 7: Occupation
OCCUPATION NO %
Legislators, Senior Officials and Managers 261 2%
Professionals 317 3%
Technicians and Associate Professionals 514 4%
Clerks 646 5%
Service Workers, Ship and Market Sales Workers 968 8%
Skilled Agricultural and Fishery Workers 648 5%
Craft and Related Trades Workers 1262 11%
Plant and Machine Operators and Assemblers 1362 11%
Elementary Occupations 4604 38%
Undetermined 1433 12%
TOTAL 12015 100%
OCCUPATION (2001)
0%
5%
10%
15%
20%
25%
30%
35%
40%
45%
Legi
slato
rs, S
enio
r Officials a
nd M
anag
ers
Pro
fession
als
Tec
hnicians
and
Ass
ocia
te P
rofe
ssio
nals
Cle
rks
Ser
vice
Wor
kers
, Shi
p an
d M
arke
t Sales
Wor
kers
Skille
d Agr
icultu
ral a
nd F
ishe
ry W
orke
rs
Cra
ft an
d Rel
ated
Tra
des
Wor
kers
Pla
nt a
nd M
achine
Ope
rato
rs a
nd
Ass
emblers
Ele
ment
ary
Occ
upat
ions
Und
eterm
ined

Revision of the Mbonambi IDP 2008/2009:
Mbonambi Municipality
July 2008 26
Table 8: Employment Sector
SECTOR NO %
Agriculture/Hunting/Forestry/Fishing 3002 25%
Mining/Quarrying 505 4%
Manufacturing 1112 9%
Electricity/Gas/Water Supply 46 0%
Construction 587 5%
Wholesale and Retail Trade/Repairs/Hotels/Restaurants 1196 10%
Transport/Storage/Communication 663 6%
Financial Intermediation/Insurance/Real Estate/Business Services 621 5%
Community/Social/Personal Services 1235 10%
Private Households 1208 10%
Other/Not Adequately Defined 0 0%
Undetermined 1840 15%
TOTAL 12015 100%
The above table shows that most employed people are in the agriculture sector which is
characterized by long hours of work and low pay. Part of the reason for the dominance of
this sector can be attributed to low levels of education for the adult population in the
Municipality as it was shown earlier as well as to the labour intensiveness of this sector
through which it manages to absorb large quantities of labour.
The above tables shows that most employed people are in the agriculture sector which is
characterized by long hours of work and low pay. Part of the reason for the dominance of
EMPLOYMENT SECTOR (2001)
0%
5%
10%
15%
20%
25%
30%
Agr
icul
ture
/Hun
ting/
Fore
stry
/Fishing
Min
ing/
Qua
rrying
Man
ufa
ctur
ing
Ele
ctricity/G
as/W
ater
Sup
ply
Con
stru
ctio
n
Wholes
ale
and
Ret
ail T
rade
/Rep
airs
/Hot
els/Res
taur
ants
Tra
nspo
rt/S
tora
ge/C
omm
unicatio
n
Finan
cial Int
erm
ediatio
n/In
sura
nce/
Rea
l Est
ate/
Bus
ine.
.
Com
munity
/Soc
ial/P
erso
nal S
ervice
s
Priv
ate
Hou
seho
lds
Oth
er/N
ot A
dequa
tely D
efin
ed
Und
eterm
ined

Revision of the Mbonambi IDP 2008/2009:
Mbonambi Municipality
July 2008 27
this sector can be attributed to low levels of education for the adult population in the
Municipality as it was shown earlier. The labour intensiveness of this sector also allows for
high numbers of labour to be absorbed into it.
In addition to the data presented above, the QOLS provides information on the type of
employment in the respective sectors as well, i.e. full time, part time, self employed etc.
This information is presented hereunder:
Table 9: Mbonambi � Employment Type by Economic Sector (2007) (%)
Employment
Type
Agric Mining Manu
fac.
Electr./
Gas/W
ater
Constr. Whol
esale
/Reta
il
Bus.
Service
s
Comm.
Services
Pvt
HH
Other
Self Employed 0.00 0.00 0.00 6.25 0.00 6.25 0.00 0.00 6.25 81.25
Full Time 1.39 1.39 6.94 6.94 12.50 2.78 0.00 2.78 2.78 62.50
Part Time 7.14 0.00 0.00 0.00 14.29 0.00 0.00 0.00 0.00 78.57
The table on the previous page shows the significance of the construction sector in the
Mbonambi Municipality as well as the �other� economic sector.
Table 10: Average Annual Household Income
RANDS PER ANNUM NO %
No income 5170 25%
R1 - R4 800 1620 8%
R4 801 - R 9 600 5376 26%
R9 601 - R 19 200 3956 19%
R19 201 - R 38 400 2597 13%
R38 401 - R 76 800 987 5%
R76 801 - R153 600 423 2%
R153 601 - R307 200 149 1%
R307 201 - R614 400 54 0%
R614 401 - R1 228 800 16 0%
R1 228 801 - R2 457 600 63 0%
R2 457 601 and more 19 0%
Not Applicable (institutions) 3 0%
TOTAL 20433 100%

Revision of the Mbonambi IDP 2008/2009:
Mbonambi Municipality
July 2008 28
According to the Low Income Households Map (see attached at the end of Section C)
which depicts, at ward level, the percentage of households earning less than R1, 600 per
month (in 2001), the poorest households reside in Wards 12 and 13. In these wards, more
than 85% of the households earned less than R1, 600 per month.
Household expenditure patterns are interesting to consider in context of household income
levels. It is a known fact that low income earning households spend a larger percentage of
their income on fulfilling basic needs such as food, education, transport etc. The following
table shows the main household expenditure items as extracted from the QOLS (2007) to be
on the fulfillment of basic needs.
Table 11: Main Expenditure Items
Municipality Year Food Transport Education Clothing
and
Footwear
Medical
and
Dental
Mbonambi 2004 39.86 8.15 9.50 15.56 6.76
2005 34.37 12.09 12.75 15.56 3.55
2007 32.58 6.56 23.17 31.16 2.18
uThungulu 2004 33.75 8.21 19.94 8.34 4.61
2005 30.70 8.66 11.51 8.97 5.12
2007 41.21 8.45 13.48 12.00 4.26
The QOLS further investigated the number of dependents per person employed as well as
involvement in the informal economy. The following tables show the results for the
Mbonambi Municipality in relation to the uThungulu District Municipality.
Table 12: Dependents per Person Employed
Municipality Year Dependents per Person Employed
Mbonambi 2004 7.5
0%
5%
10%
15%
20%
25%
30%
No in
com
e
R1 - R
4 800
R4 8
01 - R
9 6
00
R9 6
01 - R
19
200
R19
201
- R 3
8 40
0
R38
401
- R 7
6 80
0
R76
801
- R15
3 60
0
R153
601
- R307
200
R307
201
- R614
400
R614
401
- R1 2
28 8
00
R1 2
28 8
01 - R
2 457
600
R2 4
57 6
01 a
nd m
ore
Not A
pplic
able
(institu
tions
)

Revision of the Mbonambi IDP 2008/2009:
Mbonambi Municipality
July 2008 29
2005 7.7
2007 6.4
uThungulu 2004 9.4
2005 5.8
2007 6.2
Table 13: Involvement in the Informal Economy
Municipality Year Involved in Informal Economy
Mbonambi 2004 15.24
2005 5.23
2007 18.84
uThungulu 2004 7.28
2005 2.79
2007 13.31
The above two tables show that Mbonambi Municipality has a slightly higher dependency
ratio than the average for the district while the percentage of households involved in
informal economic activity is also slightly higher than the district average.
2.2 Economic Sectors
Economic activity in the Mbonambi Municipality area is predominantly focused on agriculture
and mining. Richards Bay Minerals mine along the coastal dunes of the Mbonambi and
Sokhulu Traditional areas. Timber plantations of Sappi and Mondi are around KwaMbonambi
while commercial sugarcane and banana production is found around KwaMbonambi and the
Umfolozi Flats.
Agriculture
The Mbonambi and Sokhulu traditional areas have a high agricultural potential, but due to
traditional settlement patterns, customs, and the forced relocation of some communities, the
agricultural activity remains at a low intensity. The area straddling the N2 is intensely farmed
by Mondi, Sappi (plantations) and private farmers - in response to the high agriculture
potential of this area. Rainfall drops drastically from east (the coast) to the west (inland) and
as a result the agricultural potential of the Mhlana area is not as high. This situation
however, can be remedied to an extent by the introduction of sound agricultural
management and irrigation.

Revision of the Mbonambi IDP 2008/2009:
Mbonambi Municipality
July 2008 30
Mining, Forestry and Industry
RBM in the Mbonambi traditional authority is a major international player and generates
considerable economic activity and revenue. Mondi, SAFCOL and SAPPI do the same on a
smaller scale. These companies do not only create direct job opportunities, but also stimulate
the development of supporting service industries. RBM especially, has embarked on
extensive social upliftment programmes during it history as is evident in the many schools,
clinics, and social development programmes.
Tourism
The tourism sector is being promoted as a leading sector in KwaZulu-Natal, and it certainly
can be an important potential generator of economic growth. The Municipality is blessed with
some fine potential tourism sites such as: Nine Mile Beach, Dawson�s Rock development in
Sokhulu, and Lake Eteza Nature Reserve north of KwaMbonambi. A number of factors have
been hampering the development of these tourism resources:
- The lack of information about tourist attractions in the region
- The state of infrastructure in the rural and tribal areas, which restricts the
development of the tourist trade
- The lack of accommodation and related tourist facilities throughout the Mbonambi
- The neglect of local history and culture as possible auxiliary attractions to the
scenic features in the rural areas
- The lack of information, skills and business acumen to take advantage of possible
tourist markets in the rural areas
- The lack of adequate directional signage to tourist attractions
Transport Sector
The Municipality is very well serviced by the National Road N2 and other secondary roads
that run through it. However, the local road network is problematic. The road infrastructure
needs to be upgraded and certain roads need to be constructed. The lack of adequate roads
also has implications for access to transport, local economic development opportunities,
education and social facilities, etc. In order for this sector to be fully developed, it will need
for a holistic improvement of the road networks which will yield economics benefits for the
area.

Revision of the Mbonambi IDP 2008/2009:
Mbonambi Municipality
July 2008 31
3 SOCIAL OVERVIEW
This section of the report reflects on the following:
Community facilities at secondary and tertiary nodes
Travel Time to Community Facilities
Education Facilities
Health Facilities
Community Centres / Halls
Sports Fields / Facilities
Traditional Administrative Centres
Cemeteries
Crèches
Pension Payout Points
Distribution of Community Facilities
The facilities indicated in the tables below, have been identified through (1) fieldwork in the
preparation of the UDM Community Facilities Plan and (2) Databases of the Departments of
Health (2006) and Education (2000).
The following maps are included at the end of this Section:
Education Facilities
Health Facilities
Community Centres / Halls
Sport Fields / Facilities
Courts
Cemeteries
Crèches
Pension Payout Points
Distribution of Community Facilities
3.1 ELECTRICITY
Electricity is supplied in bulk by Eskom who also provide the reticulation to informal
settlements. Most of the households in the traditional areas have inadequate access to
electricity. The UDM has prepared an Energy Sector Plan which has identified primary areas
for supply for the elimination of the electricity backlog on an incremental basis.

Revision of the Mbonambi IDP 2008/2009:
Mbonambi Municipality
July 2008 32
Table 14: Energy Source for Lighting (2001)
ENERGY SOURCE (2001) NO %
Electricity 10617 52%
Gas 213 1%
Paraffin 220 1%
Candles 9157 45%
Solar 97 0%
Other 134 1%
Not Applicable (institutions) 0 0%
TOTAL 20438 100%
The information on the previous page is as per the 2001 Census. The following has been
extracted from the 2007 uThungulu QOLS:
ENERGY SOURCE FOR LIGHTING (2001)
0%
10%
20%
30%
40%
50%
60%
Electric
ityGas
Par
affin
Cand
les
Solar
Oth
er
Not A
pplic
able
(institu
tions
)

Revision of the Mbonambi IDP 2008/2009:
Mbonambi Municipality
July 2008 33
Table 15: Energy for Lighting as per Quality of Life Survey (2007)
Municipality Year Electricity
(Eskom/Local
Authority)
Electricity
(Solar)
Gas Paraffin Candles
Mbonambi 2004 32.93 0.00 0.00 1.22 60.98
2005 56.86 0.00 0.00 0.65 42.48
2007 50.72 0.72 0.00 0.72 47.83
UTHUNGULU 2004 39.16 0.25 0.58 3.97 43.87
2005 42.60 0.09 0.17 1.12 53.53
2007 48.53 0.23 0.39 1.70 48.46
The above table shows an increased use of Eskom power and a decrease in dependence of
candles for lighting in the Mbonambi Municipal Area.
Table 16: Energy Source for Cooking (2001)
ENERGY SOURCE (2001) NO %
Electricity 6870 34%
Gas 815 4%
Paraffin 2196 11%
Wood 10271 50%
Coal 102 0%
Animal Dung 85 0%
Solar 48 0%
Other 53 0%
Not Applicable (institutions) 0 0%
TOTAL 20440 100%
The following has been extracted from the 2007 uThungulu QOLS in respect of energy
sources for cooking.
ENERGY FOR COOKING (2001)
0%
10%
20%
30%
40%
50%
60%
Electric
ityGas
Par
affin
Wood
Coal
Anim
al D
ung
Solar
Oth
er
Not A
pplic
able
(institu
tions
)

Revision of the Mbonambi IDP 2008/2009:
Mbonambi Municipality
July 2008 34
Table 17: Energy for Cooking as per the Quality of Life Survey (2007)
Municipality Year Electricity
(Eskom/Local
Authority)
Gas Paraffin Wood
Mbonambi 2004 24.39 5.49 14.02 53.05
2005 47.71 1.31 9.15 41.83
2007 37.68 13.77 21.01 27.54
UTHUNGULU 2004 38.74 3.48 9.60 42.30
2005 31.30 6.10 10.21 51.21
2007 36.88 4.71 11.50 46.45
The above tables shows an increase in the use of Eskom power for cooking purposes as well
as a decreased dependence on wood for such purposes.
Projects which have commenced with electrification in 2006/2007 financial year are:
Shwashweni,
Nhlangwini
Dondotha
Gegede
The following projects have been assessed and stickers were attached to each and every
household, awaiting Eskom to appoint a contractor to provide electricity to them:
Mnqagayi,
Embabe,
Sobhuza,
Nxebeni,
Matholeni,
Nkanyezi,
The following projects have been assessed and stickers were attached to each and every
household, but the electrification of these projects is dependent on the construction of a mini
substation:
Hlanzeni,
Ndlabeliyandula,
Nhlanzini,
Nkunzebomvu,
Sokhulu,
Amalala,
A new project to be included in the Eskom list as a priority and also in the municipal IDP for
2008/2009:
Safari

Revision of the Mbonambi IDP 2008/2009:
Mbonambi Municipality
July 2008 35
3.2 TRANSPORT NETWORK
The Municipality has a well developed road network on a national, district, and local scale,
but the condition of the majority of the local roads are poor, and access is problematic in wet
conditions. The UDM has prepared an Integrated Transportation Plan which will designate
roads in need of upgrade thus hopefully improving local movement.
The Durban/Maputo/Gauteng railway line traverses the municipality and passes through
KwaMbonambi. It is mainly used for the transportation of freight, to Gauteng and
Mpumalanga, but a passenger service has been introduced between Durban and Maputo.
3.3 CEMETERIES / CREMATORIA
The UThungulu District Municipality is the designated service provider at a regional level, but
the local municipalities are responsible for municipal burial sites. The Mbonambi Municipality
does not have a municipal cemetery. Cemeteries will need to be provided in close proximity
to KwaMbonambi and in areas such as Dondotha, Nzalabantu, Cinci, and other emerging
nodes.
It should be noted that the Municipality has appointed Messrs. PD Naidoo & Associates to:
Meet with Councillors and the Tribal Authority for each development node, i.e.
Sokhulu, Mbonambi, Dondotha and Mabuyeni to discuss cemeteries and to request
the identification of 3 to 4 possible cemetery sites;
Field visits by the Project Team to the identified sites;
The Project Team will prepare cost estimates for Business Plans and Funding
Applications. These estimates will include:
o Social Facilitation with the beneficiary communities including establishment
and capacitating of a PSC and discussion of the proposed project;
o Geotechnical investigations including reconnaissance surveys for at least 2
sites per node followed by a detailed survey of the best site;
o Environmental investigations for the site deemed suitable geologically (basic
assessment report);
o A Feasibility Study for the best identified site;
o Public scoping meetings at the development node as well as at
KwaMbonambi;
o All necessary disbursements;
o Survey and land acquisition;
o Engineering design; and
o All engineering and building construction.
Drafting of the Business Plan and Funding Application for submission.

Revision of the Mbonambi IDP 2008/2009:
Mbonambi Municipality
July 2008 36
3.4 TELECOMMUNICATIONS
Table 18: Telecommunications (2001)
TELECOMMUNICATIONS (2001) NO %
Telephone in Dwelling and Cell-Phone 785 4%
Telephone in Dwelling Only 756 4%
Cell-Phone Only 3537 17%
At a Neighbour Nearby 1919 9%
At a Public Telephone Nearby 9715 48%
At Another Location Nearby 652 3%
At Another Location Not Nearby 946 5%
No Access to a Telephone 2121 10%
Not Applicable (institutions) 3 0%
TOTAL 20434 100%
TELECOMMUNICATIONS (2001)
0%
5%
10%
15%
20%
25%
30%
35%
40%
45%
50%
Teleph
one
in D
wel
ling
and C
ell-P
hone
Teleph
one
in D
wel
ling
Only
Cell-P
hone
Onl
y
At a
Nei
ghbou
r Near
by
At a
Pub
lic T
elepho
ne Nea
rby
At A
noth
er Loc
atio
n Nearb
y
At A
noth
er L
ocatio
n Not
Nea
rby
No
Acc
ess
to a
Tele
phon
e
Not
Appl
icab
le (i
nstit
utions
)

Revision of the Mbonambi IDP 2008/2009:
Mbonambi Municipality
July 2008 37
The following has been extracted from the 2007 uThungulu QOLS in respect of access to
communication facilities:
Table 19: Access to Communication Facilities as per Quality of Life Survey (2007)
Municipality Year Households with
Telephones
Households
with Cell
Phones
Households
with Access to
Public Phones
Mbonambi 2004 6.71 52.44 10.37
2005 9.80 78.40 1.40
2007 0.72 81.29 56.83
UTHUNGULU 2004 10.18 44.87 26.66
2005 11.40 60.60 21.70
2007 5.85 77.91 63.23
The above tables show that at both the local and district level there has been a decrease use
of telephones and an increase in use of cell phones and access to public phones. See chart
hereunder.
3.5 ROLL-OUT OF FREE BASIC SERVICES
The roll-out of free basic services (i.e. 6kl of free water per household per month) is closely
linked to the roll-out of the UDM Water Services Development Plan. In the areas of the
municipality which are covered by water schemes and reticulation, free water is made
available to households at 6kl per household per month. No figures are available from
uThungulu District Municipality at this stage with regards to the roll-out of free basic
services. Such will be provided once available.
uThungulu District: % Households with Access to Communication
Facilities
0
10
20
30
40
50
60
70
80
90
2004 2005 2007
Year
% o
f H
ou
se
ho
lds
HHs with Telephones HHs with Cell Phones HHs with Access to Public Phones

Revision of the Mbonambi IDP 2008/2009:
Mbonambi Municipality
July 2008 38
3.6 COMMUNITY FACILITIES AT SECONDARY NODES
Table 20: Community Facilities at Secondary Nodes (3km radius)
Secondary
Node
Ward Community Facility Name Community Facility Type
Dondotha Ward 8 Phembisizwe Crèche Crèche
Ward 9 Khayalethu Crèche Crèche
Ward 9 Dondotha Community Hall Hall
Ward 9 Dondotha Store (Pension Payout Point) Pension
Ward 9 Dondotha Sport field Sports
Emhlangeni Ward 1 Qhakaza Hall Hall
Ward 1 Mhlolini Sport field Sports
Ward 1 Sokhulu Centre (Crèche, Pension Payout Point, Tribal Court Tribal Court/Crèche/Pension Pay Point
Zonza Ward 8 Mbabe Mission Cemetery Cemetery
Ward 11 Mpumelelo-Nozambula Crèche Crèche
Ward 8 Mbabe Crèche Crèche
Ward 8 Intobeko Crèche Crèche
Ward 8 Mnqadi Crèche Crèche
Ward 8 Zonza Community Hall Hall
Ward 11 Empumelelo Store-Nozambula Pension Point Pension
Ward 8 Mbabe Pension Point Pension
Mabuyeni Ward 7 Mabuyeni Cemetery Cemetery
Ward 7 Mabuyeni Pre-Primary Crèche
Ward 7 Ziqalele Crèche Crèche
Ward 7 Mabuyeni Hall Hall
Ward 7 Liverpool Sports field Sports
Ward 7 Ganasi Sports field Sports
Nkuzebomvu Ward 3 Mbonambi Mission Cemetery Cemetery
Ward 3 Nkunzebomvu Crèche Crèche
Ward 3 Mbonambi Tribal Authority (Pension Payout Po Pension

Revision of the Mbonambi IDP 2008/2009:
Mbonambi Municipality
July 2008 39
3.7 COMMUNITY FACILITIES AT TERTIARY NODES
Table 21: Community Facilities at Tertiary Nodes (2km radius)
Tertiary Node Ward Community Facility Name Community Facility Type
Amala-Phezulu Ward 2 Esikalini Crèche Crèche
Ward 3 Qedusizi Bottle store (Pension Payout point) Pension
Ward 2 Sibululwane Sport field Sports
Cinci Ward 4 New Phathane Primary (Creche) Crèche
Ward 4 Phumelela Crèche Crèche
Ward 4 Salpine Primary (Creche) Crèche
Ward 4 Khayalethu Cash & Carry (Pension Payout Point) Pension
Fuyeni Ward 13 Ocilwane Primary (Creche) Crèche
Ward 13 Ocilwane Community Hall Hall
Makhwezini Ward 12 Makhwezini Cemetery 1 Cemetery
Ward 12 Nomusa CP School(Creche) Crèche
Ward 12 Makhwezini Store (Pension Payout Point Pension
Nhlabane Ward 3 Sekuyakhanya Crèche Crèche
Ward 3 Nhlabani Community Hall Hall
Nkiyankiya/Patane Ward 13 Soya Primary (Creche) Crèche
Ward 10 Patane Store (Pension Payout Point) Pension
Ntuthunga Ward 13 Kwabheka- Abezayo Cemetery Ntuthunga 1 Cemetery
Ward 13 Ntuthunga 1 Crèche Crèche
Nzalabantu Ward 5 Nzalabantu Cemetery Cemetery
Ward 5 Thembalethu Crèche Crèche
Ward 5 Sabokwe Crèche Crèche
Ward 5 Sizanani Store (Pension Payout Point) Pension
Ward 5 Nzalabantu Sport field Sports
Ward 5 Nzalabantu Sport Stadium Sports
Ward 5 Nzalabantu Sport field 1 & 2 Sports
Ward 5 Sabokwe Sport field 1 & 2 Sports

Revision of the Mbonambi IDP 2008/2009:
Mbonambi Municipality
July 2008 40
3.8 TRAVEL TIME TO COMMUNITY FACILITIES
The table below sets out the percentage of the Mbonambi Population that is less than 30 minutes, 31 to 60 minutes, 61 to 90 minutes and
more than 90 minutes traveling time by public transport from identified community facilities:
Table 22: Community Facilities at Tertiary Nodes (2km radius)
% OF TOTAL POPULATION PER TRAVEL TIME RANGE
FACILITY TOTAL NO
FACILITIES
TOTAL
POPULATION
(2001)*
<30
MINUTES
31 - 60
MINUTES
61 - 90
MINUTES
>90
MINUTES
Cemeteries 18
106930
61.97% 28.75% 6.83% 2.44%
Courts 1 10.64% 17.12% 36.01% 36.23%
Crèches 50 79.28% 16.61% 3.07% 1.04%
Community Centres/Halls 8 56.15% 35.68% 6.54% 1.62%
Pension Pay Points 28 77.48% 17.91% 3.50% 1.10%
Sports Fields/Facilities 25 69.22% 24.70% 4.83% 1.26%
% OF POPULATION <5 YEARS PER TRAVEL TIME RANGE
FACILITY TOTAL NO
FACILITIES
POPULATION
<5 YEARS
(2001)*
<30
MINUTES
31 - 60
MINUTES
61 - 90
MINUTES
>90
MINUTES
Crèches 50 13414 79.40% 16.68% 2.95% 0.97%
% OF POPULATION >64 YEARS PER TRAVEL TIME RANGE
FACILITY TOTAL NO
FACILITIES
POPULATION
>64 YEARS
(2001)
<30
MINUTES
31 - 60
MINUTES
61 - 90
MINUTES
>90
MINUTES
Pension Pay Points 27 4722 76.92% 17.98% 3.92% 1.17%

Revision of the Mbonambi IDP 2008/2009:
Mbonambi Municipality
July 2008 41
3.9 EDUCATION FACILITIES
Table 23: Education Facilities
Name of School School Type Classrooms
Homeleigh Intermediate Combined 10
Ugome Senior Primary Combined 17
Baqoqe P Primary 6
Bhubhubhu P Primary 12
Canaan P Primary 10
Cwaka P Primary 10
Efuyeni P Primary 14
Embabe Lower P Primary 18
Empumelelweni P Primary 15
Enhlabosini Sp Primary 11
Enhlanzini P Primary 12
Esigaganeni P Primary 4
Esigwaceni P Primary 8
Gegede P Primary 7
Kwanjeke P Primary 14
KwaMbonambi P Primary 7
Lubana P Primary 13
Luhlanga P Primary 12
Mabuyeni P Primary 11
Malanga P Primary 7
Emankwathini P Primary 17
Manzimpofu P Primary 8
Mbude Sp Primary 11
Mcuthungu Sp Primary 4
Mendu P Primary 10
Mgatshelwa P Primary 9
Mhawu P Primary 7
Mnqagayi P Primary 11
Mpemvu P Primary 5
Mphathiswana LP Primary 4
Mthwana P Primary 8
Mundi P Primary 2
Mzingazi P Primary 18
New Patane P Primary 17
Nhlabane P Primary 16
Nkanyezi P (KwaMbonambi) Primary 9
Nkiyankiya P Primary 10
Nomuwa P Primary 14
Novunula P Primary 9
Ntobozi P Primary 14
Ntuthunga P Primary 8
Nzalabantu P Primary 17

Revision of the Mbonambi IDP 2008/2009:
Mbonambi Municipality
July 2008 42
Name of School School Type Classrooms
Ocilwana P Primary 11
Ontingweni P Primary 5
Phoziphozi P Primary 17
Qedumona P Primary 14
Sabhuza P Primary 8
Saligna P Primary 5
Salpine P Primary 3
Shwashweni P Primary 8
Sibululwane P Primary 10
Sikhinjana P Primary 3
Siyokomana P Primary 10
Sokhulu P Primary 11
Somotha P Primary 8
Soya P Primary 10
Thembalimbe P Primary 13
Umbonambi P Primary 21
Velemseni P Farm Primary 2
Mvamanzi P Primary 12
Kwambonambi Timbers F Primary 2
Khishwa P Primary 4
Mabhodla P Primary 8
Balondo H Secondary 18
Dlemudlemu S Secondary 14
Dondotha H Secondary 17
Ekupheleni S Secondary 15
Elangeni S Secondary 15
Encutshini Js Secondary 5
Enhlangwini S Secondary 11
Ezigqizweni Secondary 11
Gijimana Js Secondary 7
Isiphephelo H Secondary 12
Langalibomvu H Secondary 17
Manqamu H Secondary 15
Mbusowabathethwa Ss Secondary 16
Mpephose S Secondary 5
Ndlabeyilandula S Secondary 13
Nomavovo Js Secondary 7
Ntongande H Secondary 13
Sibonokuhle H Secondary 17
Tshelamanzi S Secondary 3
Umbiya S Secondary 16
Uyengo S Secondary 18
Welabasha H Secondary 10

Revision of the Mbonambi IDP 2008/2009:
Mbonambi Municipality
July 2008 43
Sizakahle JP (Empangeni) Secondary 2
Emkhayideni H Secondary 12
Mfaniso S Secondary 5
SOURCE: KZN Dept of Education Database, 2000
Although the data compiled in this section does not mention the child to teacher ratio and
the ratio of children per classroom as well as the quality of schools; it can be concluded that
schools are well distributed throughout the Municipal area (See Education Facilities Map
attached at the end of Section C).
3.10 HEALTH FACILITIES
Table 24: Health Facilities
Institution Authority
Cinci Clinic Provincial
Dondotha Clinic Provincial
Ethembeni Care Center Clinic Private
KwaMbonambi Clinic Provincial
Nhlabane Clinic Provincial
Ocilwane Clinic Provincial
Sappi (Umbonambi) Clinic Provincial
Sokhulu Clinic Provincial
Umbonambi Clinic Provincial
Source: KZN Department of Health Database, 2006
As can be seen from the Health Facilities Map attached at the end of Section C, health
facilities are not well distributed throughout the municipal area, particularly the eastern
portion of the municipal area.
3.11 COMMUNITY CENTRES / HALLS
Table 25: Community Centres / Halls
Ward Name Type
Ward 1 Qhakaza Hall Community Hall
Ward 3 Zazi Crèche Community Hall
Ward 3 Ndlabeyilandula Community Hall Community Hall
Ward 3 Nhlabani Community Hall Community Hall
Ward 6 Mzingazi Community Center Community Hall
Ward 7 Mabuyeni Hall Community Hall
Ward 8 Zonza Community Hall Community Hall
Ward 9 Dondotha Community Hall Community Hall
Ward 10 Nhlabosini Community Hall Community Hall
Ward 13 Ocilwane Community Hall Community Hall
According to the Community Centres / Halls Map (see attached at the end of Section C),
community halls / centres are generally well distributed throughout the municipal area, with
the exception of the Mhlana Traditional Authority area.

Revision of the Mbonambi IDP 2008/2009:
Mbonambi Municipality
July 2008 44
3.12 SPORTS FIELDS / FACILITIES
Table 26: Sport Fields / Facilities
Ward Name Type
Ward 1 Mhlolini Sport field Sports
Ward 2 KwaXaba Sport field Sports
Ward 2 Sibululwane Primary School Sports
Ward 2 Sibululwane Sport field Sports
Ward 2 Dumisane Sport filed Sports
Ward 4 Mawombe Sport field Sports
Ward 5 Nzalabantu Sport field Sports
Ward 5 Nzalabantu Sport Stadium Sports
Ward 5 Elanjeni Sport field Sports
Ward 5 Nzalabantu Sport field 1 Sports
Ward 5 Nzalabantu Sport field 2 Sports
Ward 5 Sabokwe Sport field 1 Sports
Ward 5 Sabokwe Sport field 2 Sports
Ward 5 Dumisane Sports field Sports
Ward 5 Nzalabantu Sport field Sports
Ward 5 Nzalabantu Sport Stadium Sports
Ward 5 Elanjeni Sport field Sports
Ward 5 Nzalabantu Sport field 1 Sports
Ward 5 Nzalabantu Sport field 2 Sports
Ward 5 Sabokwe Sport field 1 Sports
Ward 5 Sabokwe Sport field 2 Sports
Ward 6 Mzingazi Sport field 1 Sports
Ward 6 Mzingazi Sport field 2 Sports
Ward 7 Oqazwini Sports field Sports
Ward 7 Mgatshelwa Sports field Sports
Ward 7 Thina Sobabili Sports field Sports
Ward 7 Hlangamhlathi Sports field Sports
Ward 7 Liverpool Sports field Sports
Ward 7 Ganasi Sports field Sports
Ward 9 Dondotha Sport field Sports
Ward 13 Shwasheni Sport field Sports
Ward 10 Nhlabosini Sport field Sports
Ward 10 Mphathiswane Sport field Sports
Ward 10 Kwantombo Sport field Sports
Sport Facilities are well distributed in the Sokhulu and Mbonambi Traditional Authority areas,
but poorly distributed in the Mhlana Traditional Authority area (particularly in the northern
portion thereof). (See Sport Fields / Facilities Map at the end of Section C).

Revision of the Mbonambi IDP 2008/2009:
Mbonambi Municipality
July 2008 45
3.13 TRADITIONAL ADMINISTRATIVE CENTRES
Table 27: Traditional Administrative Centres
Ward Name Type
Ward 1 Sokhulu Traditional Administrative
Centre
Ward 3 Mbonambi Traditional Administrative
Centre
Ward 9 Mhlana Traditional Administrative
Centre
As can be seen from the Courts Map attached at the end of Section C, the Mbonambi and
Sokhulu Traditional Administrative Centres are relatively accessible to communities within
these two Traditional Authority areas. Mhlana Traditional Administrative Centre is generally
further than 60 minutes traveling time, by public transport, away from communities in this
Traditional Authority area.
3.14 CEMETERIES
Table 28: Cemeteries
Ward Name Type
Ward 3 Kwanjeke Cemetery Cemetery
Ward 3 Ndlabeyilandula Sport field Cemetery
Ward 3 Mbonambi Mission Cemetery Cemetery
Ward 3 Njeke Cemetery Cemetery
Ward 5 Nzalabantu Cemetery Cemetery
Ward 5 Nzalabantu Cemetery Cemetery
Ward 6 Mkhayideni Cemetery
Ward 6 Mzingazi Cemetery
Ward 7 Mabuyeni Cemetery Cemetery
Ward 7 Lamula Cemetery Cemetery
Ward 8 Mbabe Mission Cemetery
Ward 12 Shayamoya Cemetery Cemetery
Ward 12 Makhwezini Cemetery 1 Cemetery
Ward 12 Makhwezini Cemetery 2 Cemetery
Ward 13 Thabethe Church Cemetery
Ward 12 Fuyeni (Esitezi Cemetery) Cemetery
Ward 12 Mfolozane Cemetery Cemetery
Ward 12 Nhlangwini Cemetery Cemetery
Ward 12 Kwamkhuthali Cemetery Cemetery
Ward 12 Kwamkhuthali Cemetery Cemetery
Ward 13 Novunula Cemetery Cemetery
Ward 13 Mqizweni Cemetery Ntuthunga 2 Cemetery
Ward 13 Kwabheka-Abezayo Cemetery Ntuthunga 1 Cemetery
Ward 13 Cemetery Ntuthunga 2 Cemetery

Revision of the Mbonambi IDP 2008/2009:
Mbonambi Municipality
July 2008 46
From the Cemeteries Map (see attached at the end of Section C), it would appear that
rural cemeteries are mainly located in the north-eastern portion of the Mhlana Traditional
Authority area.
3.15 CRECHES
Table 29: Crèches
Ward Name Type
Ward 2 Sokhulu Centre Crèche
Ward 1 Sokhulu Centre Crèche
Ward 2 Sibululwane Primary School Crèche
Ward 2 Esikalini Crèche Crèche
Ward 2 Dumisane Crèche Crèche
Ward 3 Nkunzebomvu Crèche Crèche
Ward 3 Sekuyakhanya Crèche Crèche
Ward 3 Ontingweni Primary School Crèche
Ward 4 New Phathane Primary Crèche
Ward 4 Maqoqo Primary (Crèche) Crèche
Ward 4 Phumelela Crèche Crèche
Ward 4 Salpine Primary Crèche
Ward 5 Thembalethu Crèche Crèche
Ward 5 Sabokwe Crèche Crèche
Ward 5 Dumisane Crèche Crèche
Ward 5 Thembalethu Crèche Crèche
Ward 5 Sabokwe Crèche Crèche
Ward 6 Sibusisiwe Crèche Crèche
Ward 6 Sele Usile Zulu Crèche Crèche
Ward 6 Sibusisiwe Crèche Crèche
Ward 6 Sele Usile Zulu Crèche Crèche
Ward 7 Somotha crèche at school Crèche
Ward 7 Mgatshelwa Crèche Crèche
Ward 7 Cwaka Crèche Crèche
Ward 7 Mabuyeni Pre-Primary Crèche
Ward 7 Ziqalele Crèche Crèche
Ward 8 Mbabe Crèche Crèche
Ward 8 Intobeko Crèche Crèche
Ward 8 Mnqadi Crèche Crèche
Ward 8 Mfolozane Crèche Crèche
Ward 8 Nhlabosini Crèche Crèche
Ward 9 Phembisizwe Crèche Crèche
Ward 9 Khayalethu Crèche Crèche
Ward 9 Sabhuza Primary Crèche
Ward 9 Mnqagayi School (Zizamele Crèche) Crèche
Ward 10 Soya Primary Crèche
Ward 10 Nqolobane Crèche Crèche
Ward 10 Mendu Primary Crèche
Ward 10 Mundi Primary Crèche
Ward 10 Siyathuthuka Crèche Crèche
Ward 10 Skhanyisele Crèche Crèche
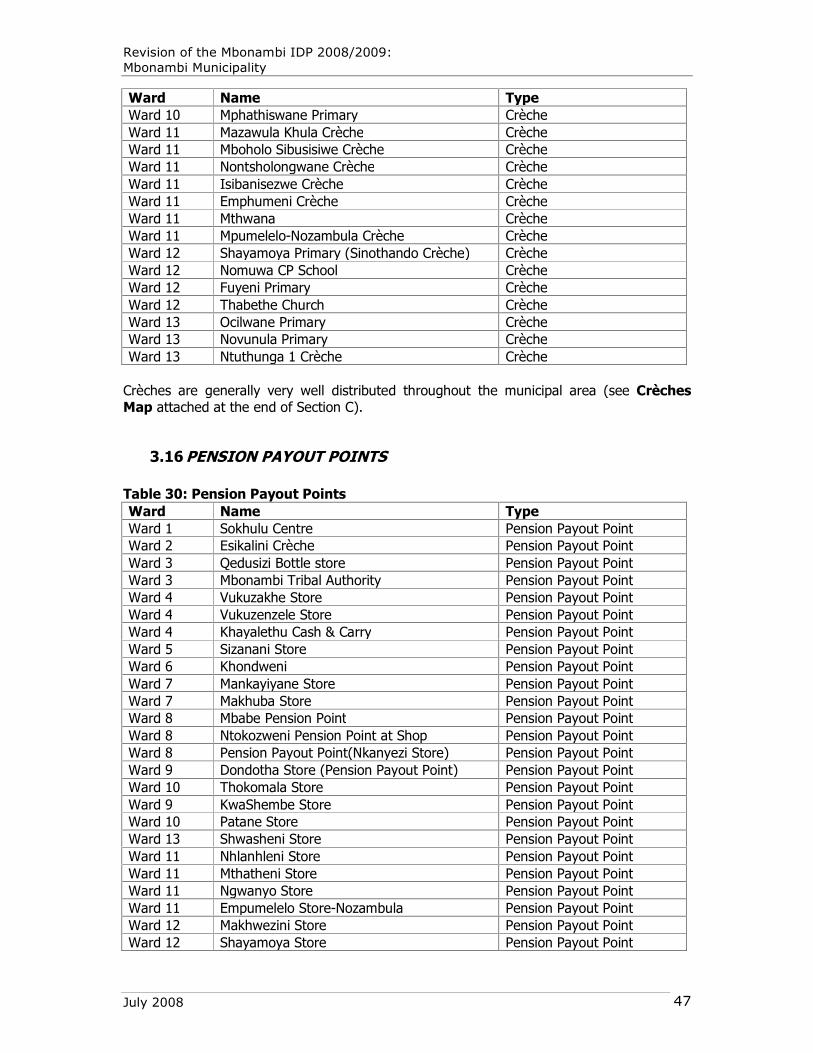
Revision of the Mbonambi IDP 2008/2009:
Mbonambi Municipality
July 2008 47
Ward Name Type
Ward 10 Mphathiswane Primary Crèche
Ward 11 Mazawula Khula Crèche Crèche
Ward 11 Mboholo Sibusisiwe Crèche Crèche
Ward 11 Nontsholongwane Crèche Crèche
Ward 11 Isibanisezwe Crèche Crèche
Ward 11 Emphumeni Crèche Crèche
Ward 11 Mthwana Crèche
Ward 11 Mpumelelo-Nozambula Crèche Crèche
Ward 12 Shayamoya Primary (Sinothando Crèche) Crèche
Ward 12 Nomuwa CP School Crèche
Ward 12 Fuyeni Primary Crèche
Ward 12 Thabethe Church Crèche
Ward 13 Ocilwane Primary Crèche
Ward 13 Novunula Primary Crèche
Ward 13 Ntuthunga 1 Crèche Crèche
Crèches are generally very well distributed throughout the municipal area (see Crèches
Map attached at the end of Section C).
3.16 PENSION PAYOUT POINTS
Table 30: Pension Payout Points
Ward Name Type
Ward 1 Sokhulu Centre Pension Payout Point
Ward 2 Esikalini Crèche Pension Payout Point
Ward 3 Qedusizi Bottle store Pension Payout Point
Ward 3 Mbonambi Tribal Authority Pension Payout Point
Ward 4 Vukuzakhe Store Pension Payout Point
Ward 4 Vukuzenzele Store Pension Payout Point
Ward 4 Khayalethu Cash & Carry Pension Payout Point
Ward 5 Sizanani Store Pension Payout Point
Ward 6 Khondweni Pension Payout Point
Ward 7 Mankayiyane Store Pension Payout Point
Ward 7 Makhuba Store Pension Payout Point
Ward 8 Mbabe Pension Point Pension Payout Point
Ward 8 Ntokozweni Pension Point at Shop Pension Payout Point
Ward 8 Pension Payout Point(Nkanyezi Store) Pension Payout Point
Ward 9 Dondotha Store (Pension Payout Point) Pension Payout Point
Ward 10 Thokomala Store Pension Payout Point
Ward 9 KwaShembe Store Pension Payout Point
Ward 10 Patane Store Pension Payout Point
Ward 13 Shwasheni Store Pension Payout Point
Ward 11 Nhlanhleni Store Pension Payout Point
Ward 11 Mthatheni Store Pension Payout Point
Ward 11 Ngwanyo Store Pension Payout Point
Ward 11 Empumelelo Store-Nozambula Pension Payout Point
Ward 12 Makhwezini Store Pension Payout Point
Ward 12 Shayamoya Store Pension Payout Point

Revision of the Mbonambi IDP 2008/2009:
Mbonambi Municipality
July 2008 48
Ward Name Type
Ward 12 Hlakanyane Store Pension Payout Point
Ward 13 Ngomane Store Pension Payout Point
Ward 13 Ocilwane Store Pension Payout Point
Ward 13 Velangezinyo Store Pension Payout Point
Pension Payout Points are well distributed along main transport routes within the municipal
area. (See Pension Payout Points Map attached at the end of Section C).
3.17 DISTRIBUTION OF COMMUNITY FACILITIES
The Distribution of Community Facilities Map (see attached at the end of Section C)
indicates the distribution of schools, health facilities and other community facilities
throughout the Mbonambi Municipal area.
The Table below indicates, at a Ward level, the distribution of community facilities:
Table 31: Distribution of Community facilities (at Ward level)
Ward Community Facility Name Type
Ward 1 Edlemdleni Sport field Sports
Ward 1 Sokhulu Centre Traditional Administrative
Centre/Crèche/Pension Payout
Point
Ward 1 Mhlolini Sport field Sports
Ward 1 Qhakaza Hall Community Hall
Ward 1 Sokhulu Centre Crèche & Clinic
Ward 2 KwaXaba Sport field Sports
Ward 2 Sibululwane Primary School Crèche & Sports
Ward 2 Sibululwane Sport field Sports
Ward 2 Kwanjeke Cemetery Cemetery
Ward 2 Esikalini Crèche Crèche & Pension Payout Point
Ward 2 Dumisane Crèche Crèche
Ward 2 Dumisane Sport field Sports
Ward 3 Qedusizi Bottle store Pension Payout Point
Ward 3 Zazi Crèche Hall
Ward 3 Ndlabeyilandula Community Hall Hall
Ward 3 Ndlabeyilandula Sport field Cemetery
Ward 3 Mbonambi Mission Cemetery Cemetery
Ward 3 Nkunzebomvu Crèche Crèche
Ward 3 Mbonambi Tribal Authority Traditional Administrative Centre &
Pension Payout Point
Ward 3 Nhlabani Community Hall Hall
Ward 3 Sekuyakhanya Crèche Crèche
Ward 3 Ontingweni Primary School Crèche
Ward 4 Mawombe Sport field Sports
Ward 4
New Phathane Primary Crèche
Vukuzakhe Store Pension Payout Point
Maqoqo Primary (Crèche) Crèche
Phumelela Crèche Crèche
Vukuzenzele Store Pension Payout Point

Revision of the Mbonambi IDP 2008/2009:
Mbonambi Municipality
July 2008 49
Ward Community Facility Name Type
Khayalethu Cash & Carry Pension Payout Point
Salpine Primary Crèche
Ward 5
Nzalabantu Sport field Sports
Thembalethu Crèche Crèche
Nzalabantu Sport Stadium Sports
Nzalabantu Cemetery Cemetery
Elanjeni Sport field Sports
Sizanani Store Pension Payout Point
Nzalabantu Sport field 1 Sports
Nzalabantu Sport field 2 Sports
Sabokwe Sport field 1 Sports
Sabokwe Crèche Crèche
Sabokwe Sport field 2 Sports
Ward 6
Sibusisiwe Crèche Crèche
Khondweni Pension Payout Point
Mzingazi Sport field Sports
Sele Usile Zulu Crèche Crèche
Mandosi Crèche Crèche
Mzingazi Community Center Hall
Sibusisiwe Crèche Crèche
Mzingazi Sport field Sports
Sele Usile Zulu Crèche Crèche
Mandosi Crèche Crèche
Mzingazi Community Center Hall
Dumisane Crèche Crèche
Dumisane Sports field Sports
Ward 7
Somotha crèche at school Crèche
Oqazwini Sports field Sports
Mgatshelwa Sports field Sports
Mgatshelwa Crèche Crèche
Thina Sobabili Sports field Sports
Hlangamhlathi Sports field Sports
Cwaka Crèche Crèche
Liverpool Sports field Sports
Ganasi Sports field Sports
Ward 7
Mabuyeni Cemetery Cemetery
Mabuyeni Hall Hall
Mabuyeni Pre-Primary Crèche
Mankayiyane Store Pension Payout Point
Makhuba Store Pension Payout Point
Lamula Cemetery Cemetery
Ziqalele Crèche Crèche
Ward 8
Zonza Community Hall Hall
Mbabe Mission Cemetery
Mbabe Crèche Crèche
Mbabe Pension Point Pension Payout Point
Intobeko Crèche Crèche
Mnqadi Crèche Crèche
Mfolozane Crèche Crèche

Revision of the Mbonambi IDP 2008/2009:
Mbonambi Municipality
July 2008 50
Ward Community Facility Name Type
Ntokozweni Pension Point at Shop Pension Payout Point
Ward 9
Dondotha Community Hall Hall
Dondotha Store (Pension Payout Point) Pension Payout Point
Dondotha Sport field Sports
Phembisizwe Crèche Crèche
Khayalethu Crèche Crèche
Mnqagayi School (Zizamele Crèche) Crèche
KwaShembe Store Pension Payout Point
Ward 10
Patane Store Pension Payout Point
Soya Primary Crèche
Shwasheni Store Pension Payout Point
Shwasheni Sport field Sports
Nhlanhleni Store Pension Payout Point
Nqolobane Crèche Crèche
Mendu Primary Crèche
Nhlabosini Community Hall Hall
Nhlabosini Sport field Sports
Mundi Primary Crèche
Siyathuthuka Crèche Crèche
Skhanyisele Crèche Crèche
Mphathiswane Primary Crèche
Mphathiswane Sport field Sports
Kwantombo Sport field Sports
Pension Payout Point(Nkanyezi Store) Pension Payout Point
Sabhuza Primary Crèche
Thokomala Store Pension Payout Point
Nhlabosini Crèche Crèche
Ward 11
Mazawula Khula Crèche Crèche
Mboholo Sibusisiwe Crèche Crèche
Mthatheni Store Pension Payout Point
Ngwanyo Store Pension Payout Point
Nontsholongwane Crèche Crèche
Mthwana-Mazawala Z (Isibanisezwe
Crèche)
Crèche
Mthwana/Emphumeni Crèche Crèche
Empumelelo Store-Nozambula Pension Payout Point
Mpumelelo-Nozambula Crèche Crèche
Ward 12
Makhwezini Store Pension Payout Point
Shayamoya Primary (Sinothando
Crèche)
Crèche
Shayamoya Store Pension Payout Point
Shayamoya Cemetery Cemetery
Makhwezini Cemetery 1 Cemetery
Nomusa CP School Crèche
Makhwezini Cemetery 2 Cemetery
Fuyeni Primary Crèche
Thabethe Church Crèche/Cemetery
Fuyeni (Esitezi Cemetery) Cemetery
Mfolozane Cemetery Cemetery

Revision of the Mbonambi IDP 2008/2009:
Mbonambi Municipality
July 2008 51
Ward Community Facility Name Type
Hlakanyane Store Pension Payout Point
Nhlangwini Cemetery Cemetery
Kwamkhuthali Cemetery Cemetery
Kwamkhuthali Cemetery Cemetery
Ward 13
Ocilwane Community Hall Hall
Ocilwane Primary Crèche
Ngomane Store Pension Payout Point
Novunula Cemetery Cemetery
Novunula Primary Crèche
Ocilwane Store Pension Payout Point
Mqizweni Cemetery Ntuthunga 2 Cemetery
Kwabheka Abezayo Cemetery Ntuthunga
1
Cemetery
Ntuthunga 1 Crèche Crèche
Cemetery Ntuthunga 2 Cemetery
Velangezinyo Store Pension Payout Point
3.18 HOUSING
The municipality faces a housing backlog of 7,502 of which most are rural housing. Currently
the focus is on the eradication of slums in the Municipality with a housing project being
implemented in Slovas (Ward 2) targeting 507 households.
Table 32: Approved Housing Projects
Project
No
Project Name Type Sites Ward Comment
1 Slovas slums clearance
housing project
Slums
clearance
507
2
In implement
2 Mhlana/Masakhisane rural
housing project
Rural 1000
8
T1 Approved
Projects in later stages of packaging or projects that have already been submitted but, have
not as yet been approved have been listed below.

Revision of the Mbonambi IDP 2008/2009:
Mbonambi Municipality
July 2008 52
Table 33: Housing Projects in Packaging Phase or Awaiting Approval
Project
No
Project Name Type Sites Ward Comment
3 Cwaka rural housing
project
Rural 1000
7
T1 app submitted
4 Dondotha Rural Housing
Project
Rural 1000
9
T1 app submitted
5 Mvamanzi rural housing
project
Rural 1000
10
T1 app not yet
submitted
6 Hlanzeni Rural Housing
Project
Rural 1000
1
T1 submitted
The projects that are either only at the early initiation stage, or projects that are currently
experiencing land problems, specifically relating to the problem of mineral rights for projects
affected by Richards Bay Minerals (RBM) have been listed below.
Table 34: Housing Projects at Initiation Stage or Experiencing Blockages
Project
No
Project Name Type Sites Ward Comment
7 Nzalabantu Rural Sub
Housing Project
Rural 1000 5 RBM
8 Mzingazi Rural Housing
Project
Rural 1000 6 RBM
9 Sabokwe Rural Housing
project
Rural 1000 5 Initial stage
10 Ndlabeyilandula Rural
Housing Project
Rural 1000 3 Initial stage
11 Sibululwane Rural 1000 2 Initial stage
It is expected that only two of the above mentioned projects at the initiation stage will be
implemented in the five year time horizon of the housing sector plan. These two projects will
be selected based on their progress achieved and/or success in resolving the blockages that
they currently experience. Housing projects selected have also been evaluated in relation to
the housing demand assessment above.
3.19 LAND REFORM
The main components of land reform are that:
Land reform must contribute to economic development and poverty alleviation,
particularly in rural areas;
The substantial increase of black ownership of commercial agriculture must be
promoted;
The importance of an integrated approach to land reform in close collaboration with
other departments (particularly the Department of Agriculture and Housing), and the
other spheres of government;
The Department of Land Affairs must actively work with Provincial Government and
District Municipality to build the capacity of the latter to undertake land reform and
land development planning;
The importance of national spatial planning for sustainable development;

Revision of the Mbonambi IDP 2008/2009:
Mbonambi Municipality
July 2008 53
In addition to the above the following points can be added which are of specific
reference to the Mbonambi Municipal area:
o A strategy for the distribution of information on of land reform to stakeholders
and possible beneficiaries. It is anticipated that existing representative
structures such as the Farmers Associations, Chambers of Business and the
larger commercial land owners should remain the focus for this exercise from
where the information can filter down to grassroots levels; and
o The primary role-players such as the Department of Land Affairs, the District
Municipality, individual local authorities, and the Ingonyama Trust Board
should establish a joint Land Reform Forum in order to prepare an integrated
strategy, outlining responsibilities, with regard to the implementation of land
reform in the sub-region, along similar lines as the Service Providers Forum.
As most of the areas in Mbonambi are under the control of Tribal Authorities, therefore land
reform becomes complicated. The Land Reform Legislation does not cater for the land
extension within the sub-region. Land Reform will contribute to the increased opportunities
for commercial farming thus aiding in the economic development of Mbonambi.
3.20 ENVIRONMENTAL CONSIDERATIONS
3.20.1 Environmental Considerations
The following has been extracted from the UDM Integrated Environmental Program (IEP),
prepared by SiVEST SA (Pty) Ltd (October 2004, pg. 36):
�The majority of the Mbonambi area can be regarded as having low species sensitivity. The
indigenous coastal forests are regarded as moderately sensitive and should be protected.
The wetland areas just inland of these indigenous forests should also be protected due to
the current threatened status of wetlands. A small area alongside Lake Nhlabane has
however been regarded as highly sensitive.
Dawson�s Rock, Lake Nhlabane, and its terminus in Nhlabane estuary are located in the
north of the District and south of Maphelane. This beautiful stretch of coastline is relatively
unknown and mostly inaccessible from the nearby N2, and has been identified as a potential
coastal destination. Mapelane Reserve is located at the southern extremity of the Greater St
Lucia Wetland Park, recently proclaimed as a World Heritage Site.
Buffer zones around conservation areas including Lake Eteza and the Hluhluwe�
Umfolozi Park should be regarded as sensitive environments ��
3.20.2 Land Capability Classification
In terms of the Land Capability Classification Map (see map at the end of Section C), a
small area to the east of Mbonambi Town is classified as �High Potential� agricultural land
(Class 2). �Good Potential� agricultural land (Class 3) is evident in the area to the east of the

Revision of the Mbonambi IDP 2008/2009:
Mbonambi Municipality
July 2008 54
N2, whilst �Moderate� to �Restricted� agricultural land (Class 4 and 5, respectively) is evident
in the western part of the Mhlana Traditional Authority area.
Generally, Mbonambi has good potential agricultural land, which is evident in the extensive
monoculture activities on both sides on the N2.
3.21 SOLID WASTE
Table 35: Refuse Removal (2001)
REFUSE REMOVAL (2001) NO %
Removed by Local Authority at least once a week 1746 9%
Removed by Local Authority less often 479 2%
Communal Refuse Dump 793 4%
Own Refuse Dump 14312 70%
No Rubbish Disposal 3109 15%
Not Applicable 0 0%
TOTAL 20439 100%
The uThungulu QOLS provides the following insights into refuse removal in the Mbonambi
Municipal area:
Table 36: Refuse Removal as per the Quality of Life Survey (2007)
Municipality Year LA
Removal
Service
once a
week
LA
Removal
service less
than once a
week
Communal
Refuse
Dump
Own
Refuse
Dump
Burnt or
Buried
near
property
No
Refuse
Removal
Mbonambi 2004 0.00 0.61 0.61 0.00 95.12 0.61
2005 0.00 3.30 0.70 22.20 59.50 13.70
2007 0.00 0.00 0.00 31.88 68.12 0.00
UTHUNGULU 2004 11.34 0.50 0.33 0.08 63.08 12.25
2005 1.50 16.60 1.30 4.50 67.40 8.40
2007 20.23 0.15 0.15 25.17 52.97 1.31
REFUSE REMOVAL (2001)
0%
10%
20%
30%
40%
50%
60%
70%
80%
Removed
by Local
Authority
at least
once a
week
Removed
by Local
Authority
less often
Communal
Refuse
Dump
Own
Refuse
Dump
No
Rubbish
Disposal
Not
Applicable

Revision of the Mbonambi IDP 2008/2009:
Mbonambi Municipality
The concerning fact from the above table is the high percentage of households in the
Mbonambi Local Municipality (as well as the district) that burn/bury household refuse near
their properties or have their own refuse dumps. See district chart hereunder:
The following status quo information in respect of solid waste was extracted from the
uThungulu District Municipality�s Integrated Waste Management Plan (prepared by SiVEST
SA (Pty) Ltd, August 2005):
Waste Quantities and Characteristics
In the table below, the following are indicated: the waste types produced in the
municipality; the associated volumes (in m3); and which waste is stored.
Waste Types Produced Volumes (in m3) Waste Storage
Domestic
No
Business No
Industrial No
Garden Waste No
Building Waste No
Street Sweepings No
Medical Not produced in the
municipality
-
Hazardous Waste Not produced in the
municipality
-
The area within the municipality where the wastes are generated and which is
covered by a waste collection and a removal service is Kwambonambi Town only.
The final waste disposal site for wastes generated within Kwambonambi Town, with
the exception of garden waste, is the uThungulu Regional Landfill Site at Empangeni,
via Transfer Station at Kwambonambi Town.
uThungulu District: % of Households who have
own Refuse Dumps
0
5
10
15
20
25
30
2004 2005 2007
Year
% o
f H
ou
se
ho
lds
9m3 per day
16m3 per week

Revision of the Mbonambi IDP 2008/2009:
Mbonambi Municipality
July 2008 56
Waste Management, Prevention and Minimization Strategies, Systems and
Practices
A Transfer Station has been built at Kwambonambi Town for the transfer of
wastes (with the exception of garden waste) to the uThungulu Regional Waste
Site at Empangeni. This should be in operation by the end of April 2005. A
recycling facility has also been built at the Transfer Station (4x 12m3 Skips)
Informal Collection of Waste is taking place at the unregistered Mbonambi Landfill
Site, inter alia, paper and glass. The market for paper is Mondi in Richards Bay
Town and the marker for glass is a private company in Empangeni Town.
Waste Collection and Transportation
Currently 100% of urban households within the Municipality are covered by a waste
collection system, whilst 0% of rural households are not covered.
Method of waste collection:
Waste Type Collection Method
Domestic Kerb Site Collection
Business Kerb Site Collection
Industrial Kerb Site Collection
Garden Waste Kerb Site Collection
Building Waste Kerb Site Collection
Street Sweepings Kerb Site Collection
Medical Waste -
Hazardous Waste -
Frequency of municipal waste collection:
Residential areas X2 per week
Business areas X2 per week
Municipal Waste Transportation Equipment:
Vehicle Description Number of vehicles Average number of
crew per vehicle
Compactor (10m3) X1 4
Flat Bed Truck X1 4
Private Waste Collection companies:
Name of Company Type of Waste Waste Disposed at

Revision of the Mbonambi IDP 2008/2009:
Mbonambi Municipality
July 2008 57
Removed
Maxim Security Garden Waste Mbonambi Landfill Site
Recycling Facilities
Recycling Facility Principal Material
Recycled
Location of Recycling
Facility
Mbonambi Transfer
Station
Paper
Glass
Metal
Plastic
At Mbonambi Transfer
Station
Waste Treatment Facilities
None
Waste Transfer Station Facilities
Name of
Transfer Station
Size of
Station
(capacity in
m3)
Type of
Transfer
Station
Waste
Measured
per Month at
the Station
(in Kg or m3)
Weighing
Systems
used?
Mbonambi 2x 30m3 Bins
4x 12m2 Skips
for waste
recycling
purposes
General Solid
Waste
Not yet
Measured
To measure
in m3

Revision of the Mbonambi IDP 2008/2009:
Mbonambi Municipality
July 2008 58
Mbonambi Transfer Station
Waste Disposal Facilities
Name of Disposal
Site:
Mbonambi Landfill
Site
Geographic
Location of
Landfill Site:
S 28.60858
E 32.08640
Area covered by
Landfill Site:
+/- 12has
Year of
construction:
+/- 1976
Resources
available on Site:
1x TLB
1x Driver
Precautions
in place to
Control
Nuisances on
Site:
Fly�s � Poison as and
when required
Litter is collected by
hand
Facility registered
with DWAF?
No Surrounding
Land Use:
Industrial Area
Slova�s Informal
Settlement
Forestry
Condition of
Access Road to
Site:
Poor Condition
Gravel (1km) �
Only accessible by
tractor after heavy
rains
Type of
Access
Control at the
Gate:
None

Revision of the Mbonambi IDP 2008/2009:
Mbonambi Municipality
July 2008 59
Is Waste covered
daily?
Yes Method of
land filling:
Spread and Cover
Is Cover Material
excavated on Site?
Yes � However,
reached its capacity
Is there any
Waste
Reclamation
on Site?
Yes � Informal Pickers
from the nearby Slova�s
Informal Settlement
Does Leachate and
Gas Management
occur on Site?
No. Neither
Leachate or gas
have been
identified at the
site.
Is there
Public
Participation
in the
Management
of the Site?
No
Are there Plans to
Extend the Site?
No Are there
Plans to
Close the
Site?
Yes � once Mbonambi
Transfer Station is in
operation (end of April
2005), the Mbonambi
Landfill Site will capped
and rehabilitated
Is there any Waste
Disposal occurring
at illegal Sites? If
�Yes�, indicate the
location
Yes � on a small
scale
Are Waste
Disposers
charged for
waste
disposal at
the Gate?
No

Revision of the Mbonambi IDP 2008/2009:
Mbonambi Municipality
July 2008 60
4 ENVIRONMENT AND AGRICULTURE
4.1 THE NATURAL ENVIRONMENT
Geology
The rocks in the western sections of the Mbonambi area belong to the Karoo Sequence and
are represented by the Dwyka Formation of glacial deposits at the base followed by a
conformable sequence of sandstones, mudstones and shales of the Ecca Group and roofed
by basaltic lavas. A thick succession of basaltic lava of the Letaba Formation covers most of
the western area with the shales and mudstones of the Ecca Group and alternating shales
and sandstones of the Emakhwezini Formation and the fine grained sandstones and
mudstones of the Nyoka Formation.
There is a widespread quaternary deposit of white windblown sand blanketing the coastal
plain. Alluvium is also common in low-lying areas such as river valleys and lakes. The coastal
plain is separated from the basalts in the west by granite and granite gneiss intrusions.
Soils
The soils within the area can be generally described as moderate to deep in the coastal
floodplain area becoming clayey loam to the west with a high erodibility potential. Soils in
the eastern section of the area are typical of an emergent coastline. Deep grey sands of the
Fernwood form are a predominant feature covering most of the area.
The western sections in the Mhlana Traditional Area consist of reddish, clayey soils
associated with the Basalt of the Letaba Formation, Lebombo Group. The extreme western
portions of the area consist of shallow soils originating from weathered rock predominantly
belonging to the Glenrosa or Mispah forms. Lime is generally present in lowland soils located
in valley bottoms.
Clay to sandy loam soils predominate the plains of the Umfolozi River, sections of which are
evident in the northern parts of the study area and also found associated with Lake Eteza.
These alluvial soils are well drained with high percentage silts.
Topography
The study area comprises a long flat coastal plain rising gently from the coast towards the
west where it reaches a height of approximately 200 masl (metres above mean sea-level),
the highest point being Kwamendo in the west at 381 masl. The coastal plain is interspersed
by high dunes and is further characterized by a number of short perennial rivers that
originate within the area and either drain northwards towards the Umfolozi River or towards
the coastal lakes in the vicinity of Richards Bay to the south. Two coastal lakes lie within the
area, Lake Nhlabane on the coast and Lake Eteza towards the north.
Climate
The climate is humid with one to two months experiencing very little or no rain. Rain falls
mainly in summer but the Kwambonambi area may receive up to 40% of its rainfall in
winter.

Revision of the Mbonambi IDP 2008/2009:
Mbonambi Municipality
July 2008 61
The mean annual rainfall range for the area is approximately 800mm to 1 400mm. Summers
are hot, while winters are mild with an average temperature of 20°C.
Surface Water
The northern sections drain towards the Umfolozi River while the southern sections drain
towards the coastal lakes Nhlabane, Nsezi and Mzingazi that form part of the Mhlathuze
catchment. Several perennial rivers occur within the north western sections, including the
Ntutunga, Mvamanzi and the Ntinkulu which form part of the Umfolozi catchment.
The Msunduzi, the Mbabe and Ntobozi feed Lake Eteza. The coastal plain has a number of
non-perennial rivers. The Mvuya and the Mokana are tributaries of the Msunduzi which join
with the Umfolozi at its mouth. The Mpungase feeds Lake Nhlabane. This system is
characterized by wetlands that lie behind the coastal forest. Other small water bodies within
this system are the Lakes Ozwanini and Igwenyeni.
The UThungulu District Municipality is the bulk water supplier in the area and envisages the
formulation of Catchment Management Agencies (CMAs) in the next five years that are
lawful entities of the National Water Act. The many rivers in the system generally supply
adequate water for domestic and stock use. The Mfolozi and the Mhlathuze Rivers offer
potential for irrigation. There are currently great demands on the Mhlathuze Supply System
due to water demands in Empangeni and Richards Bay, with Richards Bay Minerals placing
the greatest demand on water resources including water from Lake Nhlabane which lies
within the Mbonambi area.
Groundwater
Consisting predominantly of sandstones, the western sections of the Mbonambi area has a
high potential for groundwater aquifers. The basalts of the Letaba Formation are essentially
fine-grained crystalline variety with extremely low porosity and permeability. Surface
weathering, faulting and fracturing play an important role in targeting groundwater sources
within this rock. The water to the west is generally of a poor quality, being suitable for
emergency use (Class 2) or for short-term use (Class 2) only.
The quantity of water is largely dependent on the depth of saturated sand, grain size and
recharge events. The water table is however expected to be shallow and boreholes are likely
to give moderate yields of 0.5 to 3 litres per second over most of the study area with the
greatest yields being in the extreme west where yields of greater than 3 litres per second
can be expected. Although the presence of brackish water containing a high percentage
dissolved salts is likely, the groundwater quality in the area is generally regarded as being of
a good quality (Class 0).

Revision of the Mbonambi IDP 2008/2009:
Mbonambi Municipality
July 2008 62
Aesthetics (Visual, noise and air quality)
The aesthetics in the Mbonambi area can generally be regarded as good as a result of the
absence of large development or industry in the area meaning that the air quality and noise
levels in the area are good. Sugar cane and veld burning are the most important source of
air pollution within the area. Major sources of visual intrusion are likely to be large expanses
of monocultures including plantations and fields of sugar cane which would disrupt the
natural views. The presence of litter in traditional authority areas due to the lack of formal
waste disposal sites as well as dongas and barren lands created by improper farming
practices and overgrazing also decrease the aesthetic appeal of the area.
Natural Vegetation
The natural vegetation is characterized by Moist Coastal Forest, Thorn and Palm Veld
(Bioresource Group 2) along the coastal plain with Moist Zululand Thornveld (Bioresource
Group 19) found to the west at higher altitudes.
Moist Coastal Forest, Thorn and Palm Veld
The vegetation on the coastal plain is generally restricted to sandy soils and is influenced by
salt spray, fire and grazing. The water table plays a crucial role in defining plant communities
on the geologically young substratum. Most of the natural vegetation in the area has been
removed and replaced by exotic commercial forestry plantations forming the KwaMbonambi
State Forests.
Remnants of forests vegetation occurs along the coast line. Millettia grandis (Umzimbeet),
Protorhus longifolia (Red Beech), Strelitzia nicolai (Natal Strelitzia), Croton sylvaticus (Forest
Croton), Macaranga capensis (Wild Poplar), Schefflera umbellifera (Bastard Cabbage Tree)
and Syzigium cordatum (Umdoni) are generally present in these forests that are generally
restricted to deep sandy soils. Common dune forest trees are Mimusops caffra (Coast Red
Milkwood), Eugenia capensis (Myrtle), Deinbollia oblongifolia (Dune Soap Berry), Brachlaena
discolor (Wild Silver Oak) and Allophys natalensis (Dune allophylus).
Secondary woody vegetation is patchy and is likely to be characterized by acacias including
Acacia karoo (Sweet Thorn), A. niErfica (Scented Thorn) and A. robusta (Splendid Thorn).
The grassy matrix includes Aristida junctiformis (Ngongoni Grass), Eragrostis spp.,
Sporobolus spp., Hyparrhenia spp., Digitaria spp. and occasionally Themeda triandra
(Rooigras).
Wetland vegetation predominates in the area surrounding Nhlabane Lake surrounded by
indigenous forest to the east and thickets and bushveld to the west. The vegetation to the
west of the study area is predominantly natural, but it has transformed by lands cultivated
both for commercial and subsistence farming.
Moist Zululand Thornveld
Moist Zululand Thornveld (Bioresource Group 19) occurs naturally along the north western
parts of the municipal area. Most of the natural vegetation in the area has been destroyed
due to commercial and subsistence farming. The vegetation patterns vary considerably as
open grassland with patches of scrub forest, bushed grassland and bushland thicket.
Riverine bushland thickets occur along drainage lines.
Dominant grass species that naturally occur include Themeda traindra (Rooigras), Eragrostis
capensis (Heart Seed Love Grass), E. racemosa (Narrow Heart Love Grass), Tristachya
leucothrix (Hairy Trident Grass), Heteropogon contortus (Spear Grass), Trachpogon spicatus

Revision of the Mbonambi IDP 2008/2009:
Mbonambi Municipality
July 2008 63
(Giant Spear Grass) and Schizachyrium sanguineum (Red Autumn Grass). Eragrostis spp and
Sporobolus pyramidalis (Catstail Dropseed) are grasses dominant in overgrazed veld.
Trees species are dominated by Acacia spp including A. karoo, A. niErfica , A. caffra, A.
tortilis and A. sieberana.
Fauna
Little information is available on the animal species within the area. Game species that are
suitable or occurring along the coastal plain include bushbuck, common duiker, red duiker,
impala, reedbuck, blue wildebeest, nyala, zebra and bushpig. While the average potential
grazing capacity for the area is1.8 ha/Au, the area is largely overstocked with a current
grazing capacity of 1.0 ha/Au.
Species Sensitivity
The majority of the Mbonambi area can be regarded as having low species sensitivity. The
indigenous coastal forests are regarded as moderately sensitive and should be protected.
The wetland areas just inland of these indigenous forests are defined as being marginally
sensitive. A small area alongside Lake Nhlabane has however been regarded as highly
sensitive. Buffer zones around conservation areas including Lake Eteza and the Hluhluwe �
Umfolozi Park should also be regarded as being sensitive environments.
Land Potential
The relic sands along the coastal plain have little water holding capacity and consequently
are also limited in plant nutrients. The area has thus been used for the establishment of
exotic plantations of the Kwambonambi Forests. The vegetation is generally unsuitable for
grazing with an average grazing capacity is 3.0 ha per animal unit and animals will generally
require supplementation during the winter months.
The clayey soils to the west have moderate agricultural potential and are used extensively by
local communities for subsistence agriculture. The rolling terrain with moderate slopes
together with the soils mean that the western part of the site can generally considered
suitable for field crops and subtropical fruits. The grazing potential of the area is moderate at
approximately 1.9 ha per animal unit. Beef, goat and game farming in the area are suited to
this area.
Marine Environment
The coastal strip is not limited to the seashore, i.e. between the continental shelf and the
high-tide mark, but is linked to the hinterland via rivers, catchments and physical
infrastructure, i.e. road and rail. Hence, the coastal strip can generally be confined to the
area between the coastline and the N2, the average distance of which is between 5 to 30
kilometres. The coastal strip is rich in natural assets, i.e. long, sandy beaches, rivers, lakes
and estuaries and indigenous forests, all of which support and abundance of fauna and flora
and as such, has the potential to be developed into an area of national and international
significance. Dune mining also contributes to the value of the area�s coastal zone in terms of
production, exports and job creation. The development of the region should be approached
from an integrated perspective bearing in mind the need to balance development with the
protection of the environment.
Economic and urban activity in the Mbonambi Municipal area is focused in areas with suitable
soils and climate for forestry and cultivation of sugar cane.

Revision of the Mbonambi IDP 2008/2009:
Mbonambi Municipality
July 2008 64
4.2 AGRICULTURE
The Mbonambi and Sokhulu traditional areas have a high agricultural potential, but due to
traditional settlement patterns, customs, and the forced relocation of some communities, the
agricultural activity remains at a low intensity. The area straddling the N2 is intensely farmed
by Mondi, Sappi (plantations) and private farmers - in response to the high agriculture
potential of this area. Rainfall drops drastically from east (the coast) to the west (inland) and
as a result the agricultural potential of the Mhlana area is not as high. This situation
however, can be remedied to an extent by the introduction of sound agricultural
management and irrigation.

Revision of the Mbonambi IDP 2008/2009:
Mbonambi Municipality
July 2008 65
4.3 WATER & SANITATION
Table 37: Water Source (2001)
WATER SOURCE (2001) NO %
Piped (tap) Water to Community Stand < 200m from Dwelling 1542 8%
Piped (tap) Water to Community Stand > 200m from Dwelling 1104 5%
Piped (tap) Water Inside Yard 2730 13%
Piped (tap) Water inside Dwelling 1495 7%
No Access to Piped Water 13566 66%
TOTAL 20437 100%
In 2001, 66% of households indicated that they had no access to piped water. Thus
meaning that water was mostly likely obtained from streams, dams, boreholes, etc.
The annual uThungulu Quality of Life Survey also provides an indication of progress in
respect of water backlog eradication. Hereunder the results of the 2007 QOLS in respect of
water provision are presented:
Table 38: Water Services as per Quality of Life Survey (2007) Municipality Piped
Water in
Dwelling
Piped
Water in
Yard
Piped
Water
<200m
Piped
Water
>200m
Boreh
ole
Rainwater
Tank
River/
Stream
Water
Vendor
WATER SOURCE (2001)
0%
10%
20%
30%
40%
50%
60%
70%
Piped (tap)
Water to
Community
Stand <
200m from
Dwelling
Piped (tap)
Water to
Community
Stand >
200m from
Dwelling
Piped (tap)
Water Inside
Yard
Piped (tap)
Water inside
Dwelling
No Access to
Piped Water

Revision of the Mbonambi IDP 2008/2009:
Mbonambi Municipality
July 2008 66
Mbonambi 2.16 14.39 20.86 4.32 48.2 0.72 3.60 3.60
UTHUNGULU 17.72 20.51 14.32 8.20 11.53 1.93 12.54 1.70
From the above table it is noted that more households in Mbonambi are within 200m from
piped water than the district as a whole. However, the situation is reversed for piped water
in dwelling and piped water in yard. The Mbonambi Municipality also has a higher
dependency on boreholes than the district.
Table 39: Sanitation Facilities (2001)
SANITATION FACILITIES (2001) NO %
Flush Toilet (connected to sewerage system) 2434 12%
Flush Toilet (with septic tank) 1009 5%
Chemical Toilet 2160 11%
Pit Latrine with Ventilation (VIP) 1672 8%
Pit Latrine without Ventilation 4574 22%
Bucket Latrine 640 3%
None 7950 39%
Not Applicable 0 0%
TOTAL 20439 100%
In Kwambonambi, disposal of sewerage is effected through septic tanks. In the traditional
areas, informal towns and settlements there are no formal service of sewerage disposal. The
disposal of sewerage effluent is of great concern as it could pollute the underground water
system. Where groundwater is used for human consumption by borehole extraction the risk
in the spread of disease becomes unacceptably high. The introduction of appropriate
sanitation system is being addressed through the UDM Water Service Development Plan.
SANITATION FACILITIES (2001)
0%5%
10%
15%
20%
25%
30%
35%
40%45%
Flus
h To
ilet (
conn
ecte
d to
s...
Flus
h To
ilet (
with
sept
ic ta
nk)
Che
mical T
oile
t
Pit Lat
rine w
ith V
entilatio
n (V
IP)
Pit La
trine
with
out V
entilatio
n
Buc
ket La
trine
Non
e
Not
App
licab
le

Revision of the Mbonambi IDP 2008/2009:
Mbonambi Municipality
July 2008 67
The annual uThungulu Quality of Life Survey also provides an indication of progress in
respect of sanitation backlog eradication. Hereunder the results of the 2007 QOLS in respect
of sanitation provision are presented:
Table 40: Sanitation Services as per the Quality of Life Survey (2007)
Municipality Year Full
Waterborne
Flush Toilet
Septic
Tank
Ventilated
Improved Pit
Latrine (VIP)
Basic Pit
Latrine
None
Mbonambi 2004 1.20 11.00 0.00 75.00 9.80
2005 2.00 19.00 22.20 5.20 51.00
2007 0.00 0.00 21.74 65.94 12.32
UNTHUNGULU 2004 12.80 2.00 0.00 36.30 22.10
2005 15.60 3.70 10.40 45.70 16.10
2007 17.76 1.46 8.03 42.09 27.25
uThungulu District Municipality is the Water Services Authority and Water Services Provider,
in terms of the Municipal Structures Act, Schedule 84(1)(b) and the Water Services Authority
Act 108 of 1997, for the Mbonambi Municipal area.
The information in the table below, in respect of water and sanitation backlogs for Mbonambi
Municipal area, has been extracted from the uThungulu Water Services Development Plan
(2006):
Table 41: Progress in Eradicating Water Backlogs Total No of
Rural
Households
WATER BACKLOG - NO OF HOUSEHOLDS BELOW RDP STANDARD
ACTUAL PREDICTED
2001/02 2002/03 2003/04 2004/05 2005/06 2006/07 2008/09 2008/09 2009/10
% % % % % % % % %
18,845 97.5 69.3 70.8 66.6 56.8 49.8 45.4 38.4 31.2
Table 42: Progress in Eradicating Sanitation Backlogs Total No of
Rural
Households
SANITATION BACKLOG - NO OF HOUSEHOLDS BELOW RDP STANDARD
ACTUAL PREDICTED
2001/02 2002/03 2003/04 2004/05 2005/06 2006/07 2008/09 2008/09 2009/10
% % % % % % % % %
18,845 88.8 82.4 79.5 75.9 67.5 61.3 54.8 48.2 41.7
In terms of the uThungulu Water Services Development Plan (2006), the estimated funds
required to address the total water backlog in the Mbonambi Municipal Area is estimated at
R129,319,887 and for sanitation backlog it is R90,087,553.
Please note that updated information in respect of the uThungulu Water Services
Development Plan should be available during December 2007 for inclusion in this document.

Revision of the Mbonambi IDP 2008/2009:
Mbonambi Municipality
July 2008 68
5 INITIATIVES WITHIN THE MUNICIPAL AREA
5.1 Sokhulu Farm
It is situated at Sokhulu traditional area in ward 1 and 2 and is a sugarcane production
project. The extent of the project is 600 ha and 141ha is under operation at the moment.
The Department of Agriculture in conjunction with KwaShukela Mill (formerly known as
Umfolozi Mill) allocated R10 000 000 for this development. A total of 210 people are
involved in this project.
UThungulu District Municipality has initiated the Sokhulu Community Farm project some
4 years ago to create sustainable employment within the local community, and budgeted R
1,370,000.00 on Account no. 7100 1016 00003 for the same. New developments have taken
place whereas Umfolozi Mill has budgeted R 10,000,000.00 over the next three years for the
same project.
5.2 N2 Commercial Development
Commercial Development
The project includes the rezoning of the portion of land located at the corner of the N2 and
MR 232 from Agriculture and Parkway to a Special Zone: General Commercial 2.
The project will consist of the following:
petrol filling station;
tourism arts and craft centre;
conference centre;
retail facilities;
government and institutional offices;
banking facilities; and
a truck stop.
This project is to be developed in phases. Phase 1 will consist of the petrol filling station,
arts and craft centre and the conference centre.
A rezoning application has been prepared, approved by Council and is awaiting a final
decision/opinion from the Provincial Planning and Development Commission.
A proposed site development plan is provided overleaf:

Revision of the Mbonambi IDP 2008/2009:
Mbonambi Municipality
July 2008 69

Revision of the Mbonambi IDP 2008/2009:
Mbonambi Municipality
July 2008 70
KwaMbonambi Distribution Centre
KwaMbonambi Distribution centre is to be located along the N2 opposite the proposed N2
commercial development. The developers are currently undertaking a market analysis and the
overall feasibility study of the project.
The project is being funded by ASGISA and it is intended to uplift the local SMME�s in terms of
supply and retailing of goods. The project is still at a preliminary phase but its intended purpose
will be for it to serve as a regional distribution centre.
5.2.1 KwaMbonambi Country Estate
KwaMbonambi Country Estate involves the proposed extension of the existing golf course in
KwaMbonambi from a six hole to an 18 hole golf course. It will also consist of boutique hotel,
medium and high income housing, indoor sports facilities and other recreational facilities, as well
as open areas.
The project is being undertaken through the DFA route. The application has already been
submitted and has gone through the pre-hearing stage which was held in December 2006. The
hearing and site inspection was held towards the end of January 2007. At the hearing, the
Development Tribunal decided to postpone its final decision due to objections received from the
National Department of Agriculture. The hearing was postponed to March 2007.
The development proposed1 includes:
388 Special Residential 800 to 1000m2 erven;
3 Medium Density Residential Erven comprising approximately 144 residential
opportunities;
60 Low Density Special Residential Erven;
2 General Residential Oval Village Development Erven comprising approximately 118
residential opportunities;
37 Community Village and association Medium Density Residential Erven comprising
approximately 100 residential opportunities;
1 Sport Village Erf with associated club-house and recreational facilities;
2 Hotel and Golf Club House Erven including 60 tourist accommodation apartments /
suites;
An 18-hole Golf Course with driving range;
Private Open Spaces and landscaped areas, including ponds, pedestrian walkways and golf
cart tracks; and
An Electricity Sub-station Erf and 1 Services and Maintenance Erf.
1 Extracted from the DFA Application, September 2006, pg 4
Revision of the Mbonambi IDP 2008/2009:
Mbonambi Municipality
July 2008 71
5.3 Tourism
Mapelane Tourism project
The proposed project is situated at Sokhulu traditional area in Ward 1.
Through public participation and meetings with the ward councilor of the Sokhulu area, a tourism
project was identified as due to the lack of tourism facilities in the area, for which uThungulu
District Municipality has agreed to contribute R670,000.
Mbonambi Municipality must undertake the following actions:
Apply for rezoning of the land;
Do a full EIA scoping report;
Acquire heritage permits if necessary;
Acquire planning permissions; as well as a
Market analysis and viability study.
Besides these obvious steps, the municipality must adhere to the guidelines set out in the
Responsible Tourism Manual published by the Department of Environmental Affairs and Tourism in
November, 2004.
This is necessary to:
1. Stimulate/strengthen local economy
2. Create opportunities for direct and indirect employment
3. Create opportunities for entrepreneurial activity
4. Stimulate local business growth, directly and indirectly
5. Generate investment in social and economic infrastructure (e.g. schools, clinics, roads)
6. Increase tax revenues
7. Improve public services and amenities (e.g. transport, shopping, entertainment)
8. Improve quality of police protection
9. Improve living standards
10. Stimulate skills development
11. Diversify livelihoods
A co-operative has already been established with Twenty-Four (24) participants within Ward 1,
Mthiyane Tribal Authority which will form part of the Project Steering Committee. The Municipal
Manager and three employees of Mbonambi Municipality will also form part of the committee.
Specialist consultants are to be employed for the various studies and applications to be conducted.

Revision of the Mbonambi IDP 2008/2009:
Mbonambi Municipality
July 2008 72
6 ORGANISATIONAL
6.1 INSTITUTIONAL ARRANGEMENTS
The UThungulu District Council currently fulfills certain functions on behalf of the municipality such
as water and sanitation and waste management due to limited local capacity.
The structure established to manage all aspects of the Municipality is summarized as follows:
The Council Executive/Committee served by the Municipal Manager who inter alia is
responsible for Integrated Development Planning.
Three main departments, namely:
Engineering / technical services which include Project Development and Maintenance
and Municipal Works divisions;
Financial Services; and
Corporate Services with Administrative Services and Management Services as the two
major divisions.
The Mbonambi Municipality�s Organogram is shown overleaf:

Revision of the Mbonambi IDP 2008/2009:
Mbonambi Municipality
July 2008 73
OFFICE OF THE MUNICIPAL MANAGER

Revision of the Mbonambi IDP 2008/2009:
Mbonambi Municipality
July 2008 74
CORPORATE SERVICES

Revision of the Mbonambi IDP 2008/2009:
Mbonambi Municipality
July 2008 75
FINANCIAL SERVICES

Revision of the Mbonambi IDP 2008/2009:
Mbonambi Municipality
July 2008 76
TECHNICAL SERVICES
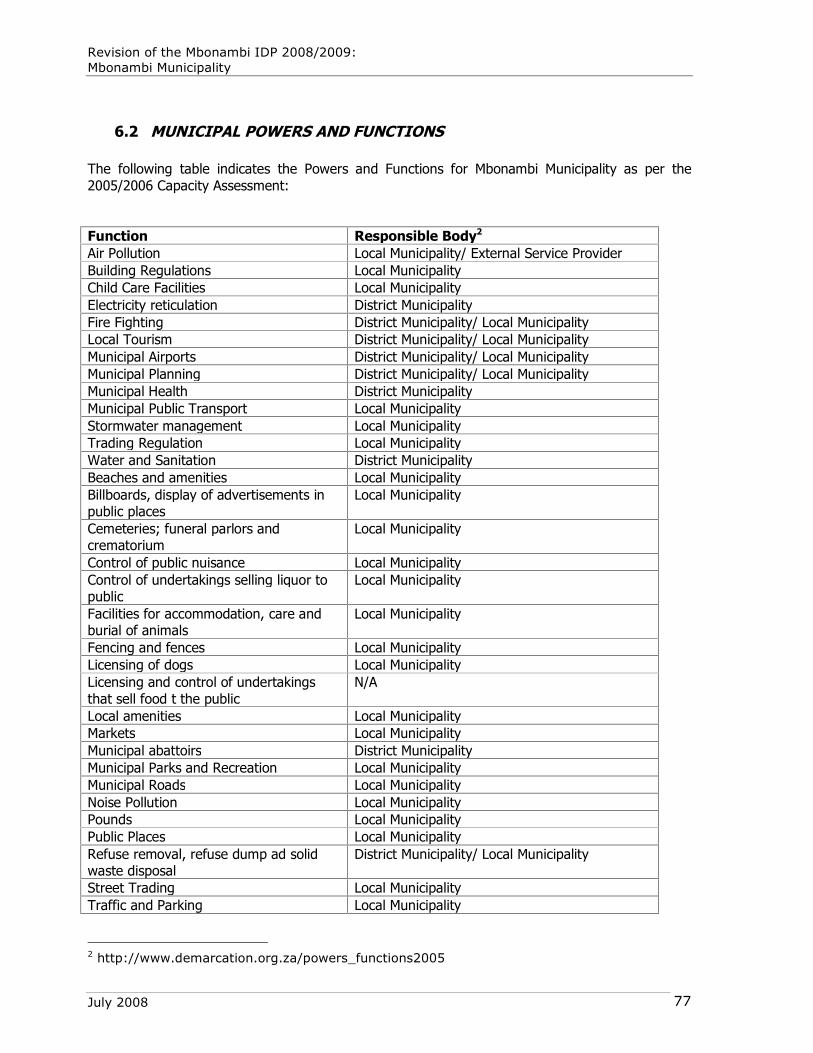
Revision of the Mbonambi IDP 2008/2009:
Mbonambi Municipality
July 2008 77
6.2 MUNICIPAL POWERS AND FUNCTIONS
The following table indicates the Powers and Functions for Mbonambi Municipality as per the
2005/2006 Capacity Assessment:
Function Responsible Body2
Air Pollution Local Municipality/ External Service Provider
Building Regulations Local Municipality
Child Care Facilities Local Municipality
Electricity reticulation District Municipality
Fire Fighting District Municipality/ Local Municipality
Local Tourism District Municipality/ Local Municipality
Municipal Airports District Municipality/ Local Municipality
Municipal Planning District Municipality/ Local Municipality
Municipal Health District Municipality
Municipal Public Transport Local Municipality
Stormwater management Local Municipality
Trading Regulation Local Municipality
Water and Sanitation District Municipality
Beaches and amenities Local Municipality
Billboards, display of advertisements in
public places
Local Municipality
Cemeteries; funeral parlors and
crematorium
Local Municipality
Control of public nuisance Local Municipality
Control of undertakings selling liquor to
public
Local Municipality
Facilities for accommodation, care and
burial of animals
Local Municipality
Fencing and fences Local Municipality
Licensing of dogs Local Municipality
Licensing and control of undertakings
that sell food t the public
N/A
Local amenities Local Municipality
Markets Local Municipality
Municipal abattoirs District Municipality
Municipal Parks and Recreation Local Municipality
Municipal Roads Local Municipality
Noise Pollution Local Municipality
Pounds Local Municipality
Public Places Local Municipality
Refuse removal, refuse dump ad solid
waste disposal
District Municipality/ Local Municipality
Street Trading Local Municipality
Traffic and Parking Local Municipality
2 http://www.demarcation.org.za/powers_functions2005
Revision of the Mbonambi IDP 2008/2009:
Mbonambi Municipality
July 2008 78
6.3 MUNICIPAL POLICIES
Municipal Indigent Policy
In terms of Local Government Municipal Systems Act of 2000; Section 74 Municipalities must adopt
and implement a Tariff Policy. In terms of the same section, the Council should take into
consideration the extent of subsidization of tariffs for the poor households who cannot afford the
cost of full provision by the Municipality.
Being �indigent� means a household earning a combined total monthly income of R1500 or less.
The basic services to be offered to the indigent include:
Rental
Rates
Sewage
Refuse
Water
Electricity
From time to time; Council may decide to include the following services subject to the
availability of funds and compliance with prescribed criteria:
Recreation facilities
Public transportation
Funeral cost
Museums
Hall hire
Fire protection
At the moment the Municipality has prepared a draft Indigent policy which is yet to be adopted
by Council. The policy addresses issues as detailed above.
Employment Equity
Mbonambi Municipality underwrites and subscribes to the principles if the Employment Equity
Act (Act 55 of 1998). The Municipality has finalizing its Employment Plan and it is attached as
an Annexure to this report. What is to follow is an establishment of the Employment Equity
Committee/ Labour Forum.

Revision of the Mbonambi IDP 2008/2009:
Mbonambi Municipality
July 2008 79
7 KEY ISSUES
7.1 KEY ISSUES EXTRACTED FROM UPDATED STATUS QUO
The following Key Issues have been extracted:
N2: is a major Provincial corridor which passes through the Municipality although there
are planned projects along the N2, there is still room for further development to along
this corridor.
Education and Skills Development: the Municipal area has a shortage of highly
skilled people (52% of the population falls in the categories �no education� and �some
primary�) � a factor often considered by investors. There is also a lack of tertiary
institutions in the municipal area.
HIV/Aids: using a national ratio of 1:4 people that are HIV positive is, it can then be
assumed that 26,735 are infected with HIV in the Mbonambi Municipal Area (based on a
population size of 106,943� census 2001). This will have severe impacts with regards to
for e.g. health facilities and services, local economy, orphan centres, etc.
Employment and Poverty: employment in 2001 was 41% and unemployment 59%.
The poorest households reside in Wards 12 and 13. In these wards, more than 85% of
the households earned less than R1, 600 per month (in 2001). 78% of all households
earned less than R19,200 per annum in 2001. This situation has economic as well as
social impacts.
Lack of Diversity in the Employment Sector: most people are employed in the
primary sector. There is a need for diversification in the local economy.
Infrastructural Backlogs: More than 49% percent of households is living below the
RDP standard in terms of water, whilst more than 67% of households is living below
the RDP standard in terms of sanitation (UDM WSDP � 2004/2005 Actual percentages).
Lack of Social and Economic Investment:
o in the proposed SDF nodes;
o in Sokhulu and Mbonambi TA areas in respect of agriculture;
o commercial, industrial and residential development (particularly in the
Mbonambi urban node);
o health facilities in municipal area;
o community halls and sport facilities in Mhlana TA area;
o municipal cemetery/ies;
o land reform (complicated by TA setup);
o tourism development � particularly along coast line;
o housing backlog of 7,502 units; and
o 57% of population is less than 20 years of age � this component of the
municipality�s population require certain types of services and facilities e.g.
youth focused LED, education facilities, sport facilities, etc.

Revision of the Mbonambi IDP 2008/2009:
Mbonambi Municipality
July 2008 80
Poor infrastructure and Services delivery:
o dispersed settlement � high cost of infrastructure and service delivery;
o poor condition of rural access roads;
o no waste removal system in rural areas; and
o Inadequate provision of water, sanitation and electricity in rural areas.
Institutional:
o Lack of funding to fulfill certain Municipal Functions, e.g. cemeteries, beaches,
solid waste, disaster management, etc.
Financial:
o Lack of finances to implement the full scope of the IDP efficiently and
effectively to really have an impact upon the quality of life of communities in
the short to medium term. This would require a careful revision of key
programmes, strategies and projects.

Revision of the Mbonambi IDP 2008/2009:
Mbonambi Municipality
July 2008 81
D. DEVELOPMENT STRATEGIES
1 VISION AND MISSION
1.1 THE MUNICIPAL VISION
The Vision is seen as the ultimate destination in terms of the IDP Process, with the
development programmes, strategies, objectives and projects being the steps required to
reach the vision or destination. The vision is the overall developmental aim for the
municipality and performance management will also be measured against the vision.
The vision for the Mbonambi is as follows:
1.2 MISSION AND FUNDAMENTALS
The Mbonambi Municipality has set the following mission for itself:
VISION:
�To improve the quality of life of all people of
Mbonambi Municipality by creating an economically
viable development�
MISSION:
The Mbonambi Municipality will strive towards
providing services that will meet the needs of all
people by:
Promoting social and economic development;
Providing and maintaining affordable services;
Efficient and effective utilization of resources;
Marketing the Municipality locally and
globally; and
Establishing the Municipality as a tourist
destination.
Revision of the Mbonambi IDP 2008/2009:
Mbonambi Municipality
July 2008 82
The vision and mission continues to provide direction in the planning process and ensures
that the process is focused. In terms of the vision and the mission, there are certain
fundamentals or non-negotiables that provide guidelines for decision-making. These
guidelines form the basis for any decision made by the Mbonambi Municipality, stakeholders,
interested and affected parties and potential investors. The following fundamentals for
development were identified:
Recognize the following Nodal Hierarchy:
o Primary Node � KwaMbonambi Town;
o Secondary Nodes � ; and
o Tertiary Nodes � .
Protect and promote public and private investment.
Preserve and protect natural resources and sensitive environmental areas.
Support the Strategic Development Rationale and the identified Focus Areas.
Consistency in policies, strategies, land use management and by-laws.
The development Programmes, Strategies, Objectives and Projects forthcoming from the IDP
should support the vision, mission and fundamentals, while the spatial development
framework should be a spatial reflection of the vision and should give effect to the principles
and fundamentals by guiding spatial development in the area.
1.3 VALUE SYSTEM
Driven by the aspiration of the people, and respecting and upholding the Constitution of
South Africa, the Municipality is committed to:
The Code of Conduct;
Sound Financial Management; and
Service provision to the Council and Communities.
Values
Citizens will be consulted about services levels;
Citizens will be informed about quality of services to be expected;
Citizens will be treated with courtesy and consideration;
All citizens will have equal access to services;
Citizens will receive full and accurate information on services;
Citizens will receive a report once a year reflecting actual performance compared to
targeted performance;
Citizens will receive an apology, explanation and remedial action when the need
arise; and
Every effort will be made to provide best value services to the citizens.

Revision of the Mbonambi IDP 2008/2009:
Mbonambi Municipality
July 2008 83
2 STRATEGIC DEVELOPMENT RATIONALE: FOCUS AREAS
The Strategic Development Rationale provides the overall approach to the Development of
the Mbonambi Municipal Area. This Rationale forms the premise for the Spatial Development
Framework. The rational has both physical and institutional components, i.e. it focuses on
the structuring of the urban form to overcome developmental problems and address key
priorities and needs as well as the institutional requirements in terms of resourcing (human
and financial) to attain the aforesaid.
More specifically the physical components of the structure are:
Focus Areas;
Nodes;
The movement network; and
Open spaces.
The above physical components cannot be developed without specific institutional
components, i.e.:
Financing; and
Organizational support.
The linkages between the physical and institutional components are described hereunder.
Municipal form is expressive through a range of major land uses, services, land form, spatial
structuring elements and key focal points. The key aspect to the Strategic Development
Rationale is therefore to focus on those components, elements or areas that will provide the
highest impact in terms of sustainable development contributing towards local economic
development and in a substantial increase in the living standard of people residing in the
municipal area, as well as the financial viability of the municipality itself. This cannot be
attained without financial inputs while the effective use of such financial inputs cannot be
done without a Council that is empowered to make efficient and effective use of scarce
resources.
The Strategic Development Rationale for Mbonambi is supported through the development of
a hierarchy of nodes (as proposed through the revised SDF). These nodes will form the
focal points for development and service provision, to ensure access to social and economic
opportunities for the entire area. The concentration of activities in and around nodes will
stimulate a higher order of activities and development. Access to social and economic
opportunities at such nodal areas will have to be managed and supported to ensure its
efficiency. In addition, the nodal system supported by linkages between nodes will provide
impetus for an effective movement network and passenger transport system at sub-
regional level. This nodal system will ensure functional integration of the area and create
connectivity, which stimulates economic and social interaction. The principle of concentrating
activities in nodes recognizes that access enables empowerment.
The Nodes should become the focal points for social and economic interaction and activities,
to enable access to all these services and opportunities. The nodes will also form the specific
intervention areas in terms of the IDP, where projects and actions will be initiated. To attain
this, financing has to be secured. Social and economic activities in these nodes should enjoy

Revision of the Mbonambi IDP 2008/2009:
Mbonambi Municipality
July 2008 84
first priority in terms of the provision of new infrastructure and upgrading of existing
infrastructure.
The protection of sensitive areas is an essential intervention as part of the Strategic
Development Rationale. It is thus imperative that the Municipality prepare its Environmental
Management Plan and subsequently implement the same.
The Strategic Development Rationale puts forward an incremental development
approach, where the upgrading of existing services and provision of new services is focused
in specific areas according to settlement and nodal classification.
The Strategic Development Rationale also recognizes the need for the Municipality to build
strong public � public (between local, district, provincial and national
government) and public � private partnerships (e.g. with RBM). This component is
essential to ensure that obstacles are identified and dealt with � procedural, human resource
as well as financial.
Proposed Focus areas are:
Development of the beach area along the coastal strip. (proposed Mapelane beach
development)
Revitalization of the Sokhulu Farm Project.
Supporting the N2 Commercial Development Project.
Supporting the N2 Distribution Project.
Supporting the proposed Kwambonambi Country Estate Development.
Finalizing the Nodal Frameworks for Secondary Nodes and adhering to and
implementing the resultant Rollout Plan.
Upgrading of key transport routes (where required).
2.1 EXPLANATION OF TERMINOLOGY
Strategic Focus Area: A broad goal statement providing strategic and focused
direction to the municipality, taking cognizance of the
development mandate of the municipality and the need
to use scarce resources (human, financial, equipment)
effectively and efficiently. The municipality cannot be
and do everything for everyone. It needs to be
strategically focused and only do what it should be
doing, within the context of its available resources, to
deliver successfully on its development mandate.
Development Goal: A statement of what the municipality is striving to
achieve in the future. It provides more detail to the
Strategic Focus Area Statement. A goal is generally not
attainable nor measurable. In the IDP context, goal
setting is informed by the Status Quo Analysis and the
resultant key / priority issues.
Development Strategy: The path or direction taken to strive towards achieving
the goal/s and ultimately the Vision. Strategies

Revision of the Mbonambi IDP 2008/2009:
Mbonambi Municipality
July 2008 85
establish broad themes for future actions and should
reflect reasoned choices among alternative paths.
Development Objective: A clear �milepost� or a �marker� along the strategically
chosen path or direction (the Development Strategy)
towards striving to achieve the goal/s. Its purpose is
hence to ensure that you are on the right path or that
you have chosen the right direction to your goal/s. An
Objective is specific, measurable, actionable (or
attainable), realistic (do-able) and timely (achievable
within

Revision of the Mbonambi IDP 2008/2009:
Mbonambi Municipality
July 2008 86
2.2 STRATEGIC STRUCTURE
PROJECTS
ACTIONS
STRATEGIC FOCUS AREA
DEVELOPMENT GOAL/S
DEVELOPMENT
STRATEGIES
DEV OBJ 1
DEV OBJ 2
DEV OBJ 3
INFORMS
OPMS

Revision of the Mbonambi IDP 2008/2009:
Mbonambi Municipality
July 2008 87
2.3 STRATEGIC FOCUS AREAS, DEVELOPMENT GOALS, STRATEGIES
AND OBJECTIVES
Strategic Focus Area 1: To promote Social and Economic
Development Development Goals
To promote socio-economic development and provide support to assist communities
throughout the Municipality to cope with the combined impact of poverty and HIV/AIDS;
and
To strengthen the local economy with particular emphasis on tourism, agriculture and
commercial development.
Development Strategies Development Objectives
To reduce the impact of
HIV/AIDS on communities
Implement an HIV/AIDS Strategy for Mbonambi
Municipal area, revise the policy and ensure it is in line
with the UDM AIDS Integrated Development Strategy
Ensure ongoing involvement of all relevant role players,
education programmes for HIV/AIDS awareness and
prevention
Mobilise farmers in rural areas to develop a strategy for
their own group of workers
To minimize the effect of
natural and other disasters on
communities
Review and implement Mbonambi Municipal Disaster
Management Plan
Defining types of disaster incidents and their possible
effects
Identify weakness in capacity to deal with possible
disaster.
Develop a Municipal protocol by roles and
responsibilities inclusive of communication channels.
To implement the Disaster Management Action Plan for
disaster response and relief
Establish fire fighting section in the municipality
Ensure ongoing awareness campaigns in terms of
Koyoto Protocol resolutions
To cater for the economic and
social development needs of
youth, women, the disabled and
the aged members of
communities
Prepare and implement a Youth, Women, Disabled and
Aged Development Plan that is in line with National
Youth Strategy
Prepare and implement a Participation Strategy for
youth, women, the disabled and the aged (inclusive of
government departments, NGOs, local municipalities
and other relevant stake holders)
Ensure that the Municipality employs its Procurement
Policy in a manner that is sensitive to gender, youth
and the disabled employs its Employment Equity Plan
in a manner that is sensitive to gender, youth and the
disabled
Ensure that the Municipality employs its Employment
Equity Plan in a manner that is sensitive to gender,
youth and the disabled

Revision of the Mbonambi IDP 2008/2009:
Mbonambi Municipality
July 2008 88
To facilitate economic growth
and development within the
municipal area
Implement Mbonambi�s Local Economic Development
(LED) Plan and ensure that the plan is reviewed every
three years
Identify and promote agricultural development for rural
communities
Prepare and implement Municipal Agricultural
Development Plan
In line with the Supply Chain Management Policy,
ensure that the Municipality employs service providers
from the local communities
Support industrial and commercial initiatives at suitable
locations within the municipality.
Investigate the feasibility of establishing skills-based
tertiary facilities at Secondary Nodes in conjunction
with the Department of Education
To market Mbonambi Municipal
area to attract investment
Prepare and implement a Municipal Marketing and
Communication Strategy
To promote Mbonambi as a
tourism destination
Prepare and implement a Municipal Tourism Plan
Identify, promote and support Municipal Tourism
Initiatives
To promote SMME development
in the Municipality
To ensure that SMME development is catered for in the
Mbonambi LED Plan and that recommendations in this
regard are implemented. This would include the
investigation of strategies of ensuring ongoing
establishment new businesses in Kwambonambi town
and retaining the existing ones
Prepare and implement a Business Skills Development
Plan for entrepreneurs and communities
To create a safe and secure
environment for all residents in,
and visitors to, the Municipality
Prepare and Implement a Municipal Crime Prevention
Strategy (involvement of all relevant stakeholders) and
ensure that the Strategy is reviewed form time to time
Develop Traffic Management Services of the
municipality

Revision of the Mbonambi IDP 2008/2009:
Mbonambi Municipality
July 2008 89
Strategic Focus Area 2: To facilitate the Delivery of Sustainable
Infrastructure and Services Development Goal
To facilitate the delivery of infrastructure and services, such as water, sanitation,
electricity, access roads, telephones, postal services, clinics, schools, community halls,
sport fields and facilities, pension payout points, police stations, housing, etc. in a
sustainable manner
Development Strategies Development Objectives
To ensure the provision, upgrading and
maintenance of Infrastructure and Services to
address Backlogs
To ensure continuous communication
between the UDM and Mbonambi so that
the water and sanitation needs of the
Municipality are catered for in the UDM
Water and Sanitation Development Plan
(WSDP) and that its roll-out is
programmed accordingly (including
operation and maintenance)
To ensure, through ongoing liaison with
ESKOM and UDM, that Mbonambi�s
residents receive free basic electricity,
and that the UDM Energy Sector Plan as
it relates to Mbonambi is implemented
To ensure that all municipal infrastructure
is properly maintained through the
preparation and implementation of a
Municipal Service Maintenance Plan
Implement the Municipal Integrated
Waste Management Plan. To finalize the
ongoing identification of municipal roads
which needs to be constructed or
upgraded and accordingly prepare and
implement a Municipal Roads Programme
To ensure the provision of sustainable,
affordable and suitably-located housing
development
Implement the Mbonambi Housing Sector
Plan
To ensure co-ordinate service delivery from
all service providers
To prepare and implement an
Infrastructure and Services Provision
Communication Strategy which details the
roles and responsibilities of all service
providers in the municipality, as well as
assist with the co-ordination of such
service delivery
To ensure that all required Sector Plans
are prepared / revised and implemented
To ensure the provision of sustainable
community facilities
Prepare and Implement a Municipal
Community Facilities Plan
To finalize the Cemetery Plan document
and prepare Business Plans and Funding
Applications for the development of
cemeteries at Sokhulu, Mbonambi,
Dondotha and Mabuyeni Nodes
Continue the engagement with the

Revision of the Mbonambi IDP 2008/2009:
Mbonambi Municipality
July 2008 90
Department of Health through the District
Environmental Health Forum to ensure
co-ordination in the implementation of
health facilities needs in the UDM
Strategic Focus Area 3: To ensure an Enabling Environment for
Development Development Goal
To ensure that an enabling environment for development in the Municipality is created;
and
To ensure the sustainable use of land and the natural environment
Development Strategies Development Objectives
To ensure that integrated development
planning occurs within the Municipality as a
whole
To review the Mbonambi IDP annually
To ensure the appropriate and effective use
of land through spatial planning initiatives
and the implementation of the outcomes
thereof
Finalize and implement LUMS process
Revise the Mbonambi Spatial
Development Framework and implement
it
Finalize the Municipal Nodal Framework
Plan and implement
Ensure that Land Reform is incorporated
into local municipal planning
Ensure the sustainability and protection of
the Municipality�s Natural Resources
Prepare and implement a Municipal
Environmental Management Plan

Revision of the Mbonambi IDP 2008/2009:
Mbonambi Municipality
July 2008 91
Strategic Focus Area 4: To promote Organizational Development Development Goal
To build capacity among officials and councilors to lead and manage development
throughout the Municipality
Development Strategies Development Objectives
To develop staff skills to ensure effective
service delivery
Ensure ongoing identification of staff and
councilor training needs
Prepare and implement a Workplace Skills
Development Plan
To align the organizational structure to the
IDP
Ensure that organizational structure is
aligned with the IDP
Ensure that Municipal Bylaws are aligned
with the IDP where applicable
To improve effective and efficient
communication between internal staff and
councilors
Finalize the Strategic Communications
Plan and implement it
To improve productive and accountable staff
through and effective Municipal Performance
Management System
Draft KPI�s and job descriptions for all
staff
Develop staff monitoring and evaluation
system
Develop incentives for productivity
Strategic Focus Area 5: To ensure Sound Financial Management Development Goal
To ensure sound Financial Management that will ensure alignment with the Municipality�s
IDP, in order to ensure efficient, effective and sustainable development
Development Strategies Development Objectives
Improve debt management processes Identify all debtors and prepare and
implement a Debt Coverage Plan
Ensure that financial resources are efficiently
and effectively allocated
Develop and implement Municipal
Financial Plan
Ensure regular budget meetings and
adjustments by HODs
Ensure active participation by all relevant
stakeholders in the budget process
Ensure that the Budget (capital and
operational) is aligned to the IDP through
the preparation and implementation of
the SDBIP
To ensure ongoing implementation of a
supply chain management system that
complies with the MFMA and Supply
Chain Management

Revision of the Mbonambi IDP 2008/2009:
Mbonambi Municipality
July 2008 92
3 NATIONAL & PROVINCIAL POLICY PERSPECTIVE
3.1 NATIONAL SPATIAL DEVELOPMENT PERSPECTIVE
The Policy Co-ordination and Advisory Services (PCAS) in the Presidency produced a
National Spatial Development Perspective (NSDP) that was endorsed by Cabinet in
March 2003. The four principles of the NSDP are as follows:
Economic growth is a prerequisite for the achievement of other policy
objectives, key among which would be poverty alleviation.
Government spending on fixed investment, should therefore be focused on
localities of economic growth and/or economic potential in order to attract
private-sector investment, stimulate sustainable economic activities and/or
create long-term employment opportunities.
Efforts to address past and current social inequalities should focus on people
not places. In localities where there are both high levels of poverty and
development potential, this could include fixed capital investment beyond basic
services to exploit the potential of those localities. In localities with low
development potential, government spending, beyond basic services, should
focus on providing social transfers, human resource development and labour
market intelligence.
In order to overcome the spatial distortions of apartheid, future settlement and
economic development opportunities should be channeled into activity corridors
and nodes that are adjacent to or link the main growth centres.
Strategic Focus Area 6: To promote Democracy and Corporate
Development
Development Goal
To ensure that the developmental mandate of the municipality is understood by all the
municipality�s residents, role players and stakeholders; and
To ensure that the Municipality, as an organization, operates effectively and efficiently in
a transparent manner
Development Strategies Development Objectives
To fast-track development in a effective and
efficient manner
To ensure that decision making is
streamlined with implementation
To utilize GIS as a tool for decision
making in the Municipality
To facilitate community development and
involvement in all aspects of local governance
Involve Ward Committees and
Community Development Workers
(CDW�s) in the IDP processes
Involve Traditional leadership in the IDP
processes
Conduct IDP Road Shows
To promote active participation of all political
role players
Ensure attendance of councilors at all
officials meetings

Revision of the Mbonambi IDP 2008/2009:
Mbonambi Municipality
July 2008 93
The NSDP places a lot of emphasis on the presence of institutional capacity to realize
the developmental impact of any given area or identified resource that has
developmental potential. As such, it distinguishes between the following categories of
potential: (1) innovation and experimentation, (2) the production of high-value
differentiated goods, (3) labour intensive mass-production, (4) public service and
administration, (5) tourism and (6) commercial services and retail.
APPLICATION:
Apart from improved service delivery and ensuring a basic standard of living for all in
the Municipality, a summary of the aim of the Municipal Key Performance Areas clearly
links with the principles of the NSDP:
The Local Economic Development Key Performance Area aims to establish
economic growth and development in all economic sectors and to promote
social development and community empowerment. It also focuses on the
strengthening of the nodes in the Municipality while ensuring the equitable
development of the rural areas through land reform, housing and service
delivery.
The spatial development vision for the Municipality is based on a hierarchy of
functions for centres and nodes.
The spatial implications of the NSDP has been addressed through the Review of
the Spatial Development Framework
3.2 ACCELERATED AND SHARED GROWTH INITIATIVE FOR SOUTH
AFRICA (ASGISA)
This government instituted initiative is aimed at promoting a growth for all strategy for
South Africa that is intended to halve poverty and unemployment by 2014. Maintaining
a steady growth in GDP of above 4.5% in the short term, and then adopting envisaged
growth of 6% between 2010 and 2014 is a cornerstone of the initiative. Developing
labour absorbing industries that generate value added activities is at the core of the
initiative. Investment in infrastructure, education and skills development are significant
components of the initiative. The elimination of the second economy by enhancing
access to micro-finance, SMME support and the reduction of gender inequality issues in
conjunction with government�s macro-economic and good governance strategy
focusing on the role of local government and service delivery forms the remainder of
the initiatives outline.
The ASGISA initiative has identified the following focus areas in order to attain its
objective of accelerated and shared growth:
Economic opportunities that are labour intensive
Economic sectors that are growing
Sectors that provide opportunities for BBEEE
Small business development
APPLICATION:
This national initiative is routed in local level implementation, specifically through the
Mbonambi LED Plan. This shared growth strategy has been designed to help eradicate

Revision of the Mbonambi IDP 2008/2009:
Mbonambi Municipality
July 2008 94
inequality and poverty, which are the desired outcomes of the LED Strategy process.
The emphasis on the infrastructure and skills development also speaks to the LED Plan,
and the development of LED Strategies, within the LED Plan, needs to be considered
within the ASGISA initiative framework.
The following table provides a summary of alignment between ASGISA
initiatives/actions and the Development Strategies underpinned by the Mbonambi Local
Municipality�s Key Performance Management Areas:
Table 43: ASGISA & Mbonambi�s Development Strategies Alignment
MBONAMBI DEVELOPMENT
STRATEGIES
ASGISA INITIATIVES
o Ensure that Financial Resources
are efficiently and effectively
allocated
ASGISA has identified the need to monitor
budget expenditure of departments in that
some departments overspend while others
under spend. National Treasury is proposing
the implementation of a Capital Expenditure
Management Information System.
o To promote KwaMbonambi as a
tourism destination
ASGISA has identified the need to increase the
contribution of tourism to the GDP. Also, a
number of strategies are focused on
eliminating the 2nd
economy.
o To facilitate economic growth
and development within the
municipal area
o To ensure the provision,
upgrading and maintenance of
Infrastructure and Services to
address Backlogs
LED is a critical contributor towards halving
unemployment by 2014. Also, ASGISA moots
the need to increase infrastructure investment
in order to address backlogs.
o To promote SMME development
in the Municipality
o To facilitate economic growth
and development within the
municipal area
ASGISA has identified the need to support and
introduce more labour absorbing economic
activities.
o To ensure the appropriate and
effective use of land through
spatial planning initiatives and
the implementation of the
outcomes thereof
o Ensure the sustainability and
protection of the Municipality�s
Natural Resources
o To facilitate economic growth
and development within the
municipal area
It is crucial that the planning and management
of land use (in terms of zoning) does not
prevent the timeous development of land.
Similarly, environmental procedures should be
expedited for developments to obtain approvals
faster.
o To cater for the economic and
social development needs of
youth, women, the disabled and
the aged members of
communities
Need to work closely with women and youth in
order to halve poverty.
o To promote SMME development
in the Municipality
The national skills shortage is considered as the
largest impediment to sustained economic

Revision of the Mbonambi IDP 2008/2009:
Mbonambi Municipality
July 2008 95
MBONAMBI DEVELOPMENT
STRATEGIES
ASGISA INITIATIVES
growth.
o To ensure the provision of
sustainable community facilities
Improve electronic communication
3.3 KWAZULU-NATAL PROVINCIAL GROWTH AND DEVELOPMENT
STRATEGY
The KwaZulu-Natal Provincial Growth and Development Strategy (PGDS) has as its
purpose the provision of strategic direction for development and planning in the
Province. The following six provincial priorities that address a number of
developmental challenges related to economic and social needs of the province provide
the focus of the PGDS:
Strengthening governance and service delivery
Integrating investments in community infrastructure
Sustainable economic development and job creation
developing human capability
Developing a comprehensive response to HIV/Aids
Fighting poverty and protecting vulnerable groups in society

Revision of the Mbonambi IDP 2008/2009:
Mbonambi Municipality
July 2008 96
The link between the PGDS goals and programmes and the Mbonambi is illustrated
hereunder:
Table 44: Alignment with KZN PGDS
PGDS MBONAMBI DEVELOPMENT
STRATEGIES P
GD
S G
OA
LS
Build a People
Focused and
Effective,
Efficient
Government
Programme 1:
Good Governance
o To facilitate community
development and involvement in all
aspects of local governance
o To promote active participation of
all political role players
Programme 2:
Transformation
o To develop staff and councilor skills
to ensure effective service delivery
o To improve effective and efficient
communication between internal
staff and councilors
o To improve productive and
accountable staff through an
effective Municipal Performance
Management System
Build the
Economy
Programme 3:
Competitive
Investment
o To facilitate economic growth and
development within the municipal
area
o To market KwaMbonambi Municipal
area to attract investment
Programme 4:
Local Economic
Development
o To facilitate economic growth and
development within the municipal
area
o To market KwaMbonambi Municipal
area to attract investment
o To promote KwaMbonambi as a
tourism destination
Reduce Poverty
and Create
Sustainable
Communities
Programme 5:
Sustainable
Communities
o To facilitate economic growth and
development within the municipal
area
o To cater for the economic and
social development needs of youth,
women, the disabled and the aged
members of communities
o To ensure the provision, upgrading
and maintenance of Infrastructure
and Services to address Backlogs
Programme 6:
Basic Income
Opportunities
o To facilitate economic growth and
development within the municipal
area
o To promote SMME development in
the Municipality
Cro
ss
Cu
ttin
g
Issu
es HIV and Aids o To reduce the impact of HIV/AIDS
on communities

Revision of the Mbonambi IDP 2008/2009:
Mbonambi Municipality
July 2008 97
PGDS MBONAMBI DEVELOPMENT
STRATEGIES
BEE o Preferential Procurement
o To promote SMME development in
the Municipality
Environmental
Management
o Ensure the sustainability and
protection of the Municipality�s
Natural Resources
o To ensure the appropriate and
effective use of land through spatial
planning initiatives and the
implementation of the outcomes
thereof
Human Rights
and AA
o To facilitate community
development and involvement in all
aspects of local governance
o To cater for the needs of human
resources within the municipality
Integration o Ward Committees and
Development
o To facilitate community
development and involvement in all
aspects of local governance
Capacity Building o To facilitate community
development and involvement in all
aspects of local governance
o To promote SMME development in
the Municipality
Science and
Technology
o Utilise GIS as a tool for decision
making

Revision of the Mbonambi IDP 2008/2009:
Mbonambi Municipality
July 2008 98
3.4 PROVINCIAL SPATIAL & ECONOMIC DEVELOPMENT STRATEGY
The Provincial Spatial & Economic Development Strategy aims to:
Provide spatial context to the PGDS;
Address spatial imbalances, curb urban sprawl and ensure sustainable
interventions;
Identify priority areas and types of development;
Align to municipal spatial development frameworks;
Guide budgeting processes of the province and municipalities;
Influence investment decisions of the private sector;
The PSEDS is intended as a guide to service delivery within the cluster to achieve the
goals set in ASGI-SA: Halve poverty & unemployment by 2014. Principles of
development and growth underpinning PSEDS:
Government has a constitutional obligation to provide basic services to all
citizens. Basic services include health, education, housing, transport
All areas of the province require development
Certain areas of the province will drive economic growth
The PSEDS attempts to indicate where different types of investment should be
directed in order to achieve development and/or economic growth
Four key sectors have been identified as drivers of economic growth in the
province, namely:
o The Agricultural sector (including agri-processing and land reform )
o The Industrial sector (Including Manufacturing)
o The Tourism sector
o The Service sector (including government services)
The logistics and transport sector (including rail) underpin growth in all four
sectors.
Sustainable and affordable water and energy provision is crucial to economic
growth & development.
Application
Through the Municipal Strategies and the SDF, the municipality seeks to align it
development priorities with the PGDS.

Revision of the Mbonambi IDP 2008/2009:
Mbonambi Municipality
July 2008 99
E. OVERVIEW OF SPATIAL DEVELOPMENT
FRAMEWORK
1 SPATIAL DEVELOPMENT FRAMEWORK
Mbonambi Local Municipality finalized it Spatial Development Framework in 2006. The
Spatial Development Framework (see SDF Map attached at the end of Section E for
the Mbonambi Municipality comprise of a plan depicting the various land use categories
in a linear and nodal format. Areas are generally divided into zones in which a
particular type of activity, for instance agriculture or conservation, dominates. Linear
areas designate either natural or political borders or aim to maintain channels of
natural movement, and nodes refer to concentrations of activity and people in towns.
1.1 The land use configuration
The broad land use configuration devised for the municipal area, was basically derived
from the existing land use pattern incorporating the need to link certain areas to
promote or ensure natural movement between systems. These include:
Agriculture, as one of the main economic activities and principal land user
within the Municipal area. Main commercial agricultural activities are focused in
the Kwambonambi district, and particularly the area bounded by Sokhulu and
Mbonambi in the east, the Umfolozi River in the north, and Mhlana in the west.
Agriculture development in the Traditional authorities are generally of a smaller
scale, scattered and less market driven, Sokhulu and Mbonambi generally has
the highest potential agricultural potential, but it is not sufficiently exploited due
to the system of tenure, lake of financial support, and expertise.
Tourism and recreation such as areas of the Mbonambi and Sokhulu which is
accessible for fisher folk, the Mapelane reserve, and areas such as Moba dam.
The Mbonambi Municipal area has an envious choice of potential tourism sites,
but to date not much has materialized in terms of pursuing development
options for these. The Municipality, in association with the UThungulu District
Municipality, has introduced plans to develop the Nhlabane Lake area and
selected nodes along the coast.
Special management areas which would include the entire coast line, and
primary dune area, river courses such as the Umfolozi, the Iteza and Nhlabane
Lakes, and other areas of environmental influence.
Urban development with Kwambonambi as only proclaimed town where the
full array of urban development, albeit at a smaller scale, are fund such as low
density residential, parks, schools, commercial areas, industrial activity,
churches, and offices. A primary scheme needs to be prepared for this area.
Spatial development initiatives as with tourism these initiatives can be
reflected in the form of overlays in recognition thereof.
Infrastructure such as main transportation corridors such as the N2 and
railway line, provincial and district roads are the glee that holds the area
together by providing internal as well as external access.

Revision of the Mbonambi IDP 2008/2009:
Mbonambi Municipality
July 2008 100
Some developments such as clinics, schools, shops especially in the
Traditional areas can only be depicted as symbols in the absence of a cadastral
base. However, accurate GPS coordinates areas available for these
developments.
The control of development within these zones are addressed are addressed via a land
use management scheme, with the main purpose being to:
Indicate a minimum level of regulatory response;
Offer the municipal authority some guidelines about land use decisions, and to,
Provide a simple mechanism to assist in making rational and consistent
decisions in response to development applications.
1.2 The urban and rural hierarchy
In terms of the need to balance growth, a number of emerging centres have been
identified and added to the existing established service and administrative centres, in
order to improve service delivery to these towns and their hinterlands, and to promote
local economic development. It is further the intention to establish and expand the
administrative and service delivery functions of these towns which hopefully will serve
to attract other investment in response to the concentration of facilities and people.
Despite the new municipal order, service provision is still concentrated in the urban
centres where economies of scale, rates recovery and local authority control renders
sustainable service provision a viable option. Limited budgets, historical bias, costs and
rates recovery have militated against the provision of services in the municipality, but
the establishment of a hierarchy will provide guidance for the gradual eradication of
the imbalance.
The balancing of development throughout the municipal area should not be restricted
to services only, but opportunities should also be created in the employment and
production fields. It is the expressed government policy that the development of small
towns should be encouraged in order to improve service provision and opportunities to
rural areas thereby providing a disincentive for people to migrate to urban areas where
the quality of life is much lower, and the burden on the authorities unmanageable.
The Provincial Growth and Development Strategy has identified the need to support
growth in small towns to inter alia improve the delivery of services to rural areas. This
strategy was refined in the Integrated Rural Development Policy (IRDP) which, through
a set of guidelines, will act as the mechanism to achieve this aim.
The idea then is to establish and promote the development of existing and emerging
towns through public investment which will focus spatial development whilst providing
basic services as a fundamental right.
On a municipal scale the nodal hierarchy, functions and service standards have been,
to a large extent, based on criteria as outlined in a report entitled �A Rural Service
Centre Initiative for KwaZulu-Natal� and the IRDP. These are:
Location; as primary criterion requires that a node should enjoy good
accessibility and linkages to other nodes and target service areas.

Revision of the Mbonambi IDP 2008/2009:
Mbonambi Municipality
July 2008 101
Population; the existing population numbers and prospects for future growth
are important as service delivery should reach as many people as possible.
Status; nodes with established local authority control have an advantage over
emerging towns where structures still have to be established and a culture of
payment for services developed.
Infrastructure; The existing level of physical and social services as a means
to facilitate further development is important.
Economic considerations; the current level of economic activity and future
growth prospects should sustain development and the designation of a node as
primary or secondary should be a prerequisite for sustained economic growth.
Public participation; the identification and selection of nodes should bear in
mind stakeholder input.
1.3 Proposed Nodes
The preferred hierarchy of nodes and their typical roles are outlined hereafter.
Primary Nodes (Administrative and service centre)
These towns generally have a wide range of public and private sector activities
and Kwambonambi fits this category well. In terms of the functions assigned to
this category Kwambonambi will have to:
o continue to serve as municipal administrative centre;
o provide services and opportunities to areas such as Sokhulu, Mhlana
and Mbonambi;
o contain residential accommodation, financial services, health services,
communication facilities and SMME facilities;
o serve as a transportation mode, specifically geared towards passenger
services; and
o serve as the locality for the establishment of infrastructure such as
sports facilities, cemeteries, landfill sites, and so forth.
Secondary Nodes (Rural Nodes)
These are small dynamic places that have developed as a result of their
location at an important junction for instance, the existence of a clinic, shops,
bus and taxi stops and informal and formal business. Dondotha can serve as
good example. The level of service supply anticipated includes:
o the provision of services to the surrounding rural areas such as basic
engineering services, administration facilities, markets,
telecommunication;
o education and transportation facilities; and
o the provision of periodic mobile services.
The following Secondary Nodes have been proposed:
o Zonza
o Dondotha
o Nkunzebomvu
o Mabuyeni

Revision of the Mbonambi IDP 2008/2009:
Mbonambi Municipality
July 2008 102
o Emhlangeni
o Phathane
The following community facilities have been identified in a 3km radius
surrounding the secondary nodes and are depicted in the table overleaf:
Tertiary Nodes (Emerging rural centre)
These centres are typically characterized by an accessible location, postal
services and public phones, limited economic activity, a pension payout point
and educational facilities.
The following Tertiary Nodes have been proposed:
o Nzalabantu
o Nhlabane
o Manzamyana
o AmalalaPhansi
o Fuyeni
o Nkiyankiya
o Cinci
o Makhwezini
o Ntuthunga
Emerging urban settlement
Many settlements are emerging on the periphery and close proximity to
Richards Bay, Mbonambi in this instance. These areas predominantly function
as dormitory areas and should thus be seen as functionally linked to their urban
cores. The recognition of these settlements is thus primarily to facilitate
integration rather than to create an additional level in the hierarchy.
Scattered settlements and sparsely populated areas
These areas are characterized by low population densities i.e. between 200 and
800 people per km2 and less than 200 people per km2 respectively. These
areas cannot economically justify a comprehensive range of service provision,
and thus service provision will be restricted to the essential services required
only.
It is clear from the above that every attempt was made to stay clear from an urban
bias, and to misdirect any service provision from the hard core rural areas.
It must be noted the Municipality is currently in the process of preparing Nodal
Framework Plans for primarily its Secondary Nodes and more detailed land use plans
for its tertiary nodes.

Revision of the Mbonambi IDP 2008/2009:
Mbonambi Municipality
July 2008 103
1.4 Draft Land Use Management (LUMS)
Consultants were appointed in March 2006 to prepare a Land Use Management
System for the Mbonambi Municipality as a whole.
To date the following has been achieved, namely:
A broad LUMS for the Municipal area as a whole;
A detailed LUMS for the town of Kwambonambi; and
Elementary schemes for the following nodes, namely:
o Amalalaphansi
o Cinci
o Dondotha
o Emhlangeni
o Fuyeni
o Mabuyeni
o Makhwezini
o Manzamnyama
o Nhlabane
o Nkiyankiya
o Nkunzebomvu
o Ntuthunga
o Nzalabantu
o Patane
o Zonza

Revision of the Mbonambi IDP 2008/2009:
Mbonambi Municipality
July 2008 104
Revision of the Mbonambi IDP 2008/2009:
Mbonambi Municipality
July 2008 105

Revision of the Mbonambi IDP 2008/2009:
Mbonambi Municipality
July 2008 106
F. SECTOR INVOLVEMENT
Ideally this section of the report should provide an outline of the key issues to be addressed
by each sector department, which operates within the Mbonambi Municipal Area, its
strategies to address these issues and what the expected are within the 5-year IDP term.
The information contained below was gathered during the District Alignment meetings. It
should be noted that although information on projects to be implemented on during the
2008/2009 was provided by most Departments consulted, to date, only the Department of
Local Government and Traditional Affairs (DLGTA) and the Department of Transport provided
the municipality with its MTEF. This despite the fact that sector department have been
engagement in the IDP process via District Representative Forum meetings, as well as a
Local Representative Forum meeting which took place early in December 2007 to which
sector departments were invited.
1 OVERVIEW OF DLGTA DEVELOPMENT PROGRAMME
1.1 VISION
The vision of the department is: People-centred sustainable local governance, which
focuses on effective service delivery responsive to the needs of the communities.
1.2 MISSION STATEMENT
The department will promote people-centred, accountable and viable local governance that
accelerates service delivery and ensures sustainable communities.
1.3 STRATEGIC OBJECTIVES
The strategic objectives of the department for 2008/09 are aligned to the strategic goals of
the five-year local government agenda.
The goal: Mainstreaming hands-on support to local governance to improve governance,
performance and accountability, will be achieved through the following objectives:
Management of institutional development;
Facilitation of basic service delivery;
Promotion of local economic development;

Revision of the Mbonambi IDP 2008/2009:
Mbonambi Municipality
July 2008 107
Facilitation of good governance and public participation;
Oversight of municipal transformation and organizational development; and
Facilitation of financial viability and financial management.
The goal: Addressing the structure and governance arrangements of the state, in order to
better strengthen, support and monitor local governance has as its objectives:
Monitoring of inter-governmental relations; and
Supporting and monitoring institutional empowerment.
The objectives in respect of the goal: Refining and strengthening the policy, regulatory and
fiscal environment for local governance and giving greater attention to enforcement
measures, are as follows:
Review of the two tier system of local government; and
Facilitate legislative amendments.
The goal: Client-oriented, economical, efficient and effective management of its resources,
will be achieved by the following objectives:
Provision of an effective and efficient service to the MEC; and
Provision of sound corporate services.
1.4 CORE FUNCTIONS
The department is responsible for carrying out the following core functions:
The provision of corporate services;
The facilitation of accountable and sustainable local governance;
The facilitation of accountable and sustainable traditional institutions;
The promotion of integrated development and planning;
The promotion of sustainable urban and rural development; and
The development of systems for capacity support and monitoring and evaluation
processes.
1.5 TRANSFERS TO MBONAMBI MUNICIPALITY: MEDIUM-TERM
ESTIMATES

Revision of the Mbonambi IDP 2008/2009:
Mbonambi Municipality
July 2008 108
In terms of the DLGTA MTEF, the Department has budgeted for a transfer of R100,000 to
the Mbonambi Municipality for the 2008/2009 Financial Year, in respect of the Provincial
Management Assistance Programme.
2 DEPARTMENT OF TRANSPORT
The table below shows the projects that were approved for the 2007/2008 financial year.
Mbonambi Municipality
Betterment and Regravelling 2,200,000
Causeway Construction 1,200,000
New Gravel Road 750,000
Blacktop Pitching 255,000
Blading 220,000
Reseal 2,000,000
6,625,000
3 ESKOM
The projects in the table below were submitted by ESKOM in November 2007. It should
however be mentioned that ESKOM has recently notified Municipalities that it has put all
projects on hold due to the national power crisis.
Mbonambi
Project Name No. of
Connections
Cost per
Connection
(R)
Total Project Cost
Reserve 530 3 000 1 590 000
Embambe (Special) 850 6 095 5 181 031
Mngqagayi Sabhuza
Mxebeni
1 595 7 537 12 022 259
Hlazeni Malala 1 010 7 097 7 168 208
Gegede Dondotha
Shasweni Nhlangeni
625 4 588 2 872 088
Lamula #2 Mbabe 361 4 550 1 624 450
Sub-Total 4 611 28 833 586
Mbonambi Municipality
TA Local Roads Structures Regravelling
Mbonambi
Mankwathini &
Ezindabeni
Ezindabeni,
Nhlanzini
D2198 & Mzingazi,
P515 & Nhlanzini
Sokhulu A2212 & Mhlanga Mhlanga, Shoba P232 & Shoba
Mthethwa
Danyini & Nkenzo Zulu
home D873 & D1670 P497 & P494

Revision of the Mbonambi IDP 2008/2009:
Mbonambi Municipality
July 2008 109
4 DEPARTMENT OF EDUCATION
The Department of Education has four types of projects:
Curriculum upgrades
New Schools
Upgrades and Additions and
Water and Sanitation Projects
The table below show projects planned by the Department to be implemented in
KwaMbonambi Municipal area in 2008-2010:
Project Name Project Type Estimated Cost
Ekupheleni High
School Curriculum Upgrade R160, 000.00
KwaMbonambi
Timbers New School R7, 370, 000.00
Umkhosi High
School Upgrades and Additions R3, 684, 000.00
Emkhayideni
Technical High
School Upgrade and Additions R5, 580, 000.00
Mabhodla
Primary School Water and Sanitation R0
Enhlanzini
Primary School Water and Sanitation R0

Revision of the Mbonambi IDP 2008/2009:
Mbonambi Municipality
July 2008 110
G. IMPLEMENTATION PLAN
The 3-year Implementation Plan is based on the Municipal Key Performance Areas, Development Goals, Development Strategies and
Objectives. The plan contains Key Performance Indicators (KPIs) for each Development Objective, a Budget Estimate to meet the meet the
KPI, the Responsible Department, as well as the Target Date by which the KPI must be met.
Strategic Focus Area 1: Social and Economic Development
Development Goals
To promote socio-economic development and provide support to assist communities throughout the Municipality to cope with the combined
impact of poverty and HIV/AIDS; and
To strengthen the local economy with particular emphasis on tourism, agriculture and commercial development.
Development
Strategies
Development Objectives Budget
Estimate
KPIs Responsible
Department
Target
Date
To reduce the
impact of
HIV/AIDS on
communities
Develop an HIV/AIDS Strategic Plan
for Mbonambi Municipal area, revise
the plan annually and ensure it is in
line with the UDM AIDS Integrated
Development Strategy
Ensure ongoing involvement of all
relevant role players, education
programmes for HIV/AIDS
awareness and prevention
R100 000
Finalized HIV/AIDS
Strategic Plan and
Implementation Plan
Broad awareness
and prevention
strategies for
HIV/AIDS within the
LM
Corporate
Services
Corporate
Services
30/06/2010
30/06/2011

Revision of the Mbonambi IDP 2008/2009:
Mbonambi Municipality
July 2008 111
Mobilise farmers in rural areas to
develop a strategy for their own
group of workers
R50 000
Active role of farmers
in the fight against
HIV/AIDS
Corporate
Services
30/06/2011
To minimize the
effect of natural
and other
disasters on
communities
Review and implement Mbonambi
Municipal Disaster Management
Plan as well as the Action Plan that
goes with it
Develop a Municipal protocol by
roles and responsibilities inclusive of
communication channels.
Establish fire fighting section in the
municipality
R100 000
R100 000
R4 mill
Annual Review of the
Disaster Management
Plan that is in line
with the District Plan
Clearly defined roles
and responsibilities
as well as
communication
strategies in terms of
disaster management
Full-fledged fire
department in the
Municipality with
necessary capacity to
operate
Corporate
Services
Corporate
Services
Corporate
Services/
Municipal
Manager
30/06/2009
30/06/2009
30/06/2012

Revision of the Mbonambi IDP 2008/2009:
Mbonambi Municipality
July 2008 112
To cater for the
economic and
social
development
needs of youth,
women, the
disabled and
the aged
members of
communities
Implement a Women, Disabled and
Aged Development Plan as well as
Youth Policy that is in line with
National Youth Strategy
Ensure that the Municipality
employs its Procurement Policy in a
manner that is sensitive to gender,
youth and the disabled employs its
Employment Equity Plan in a
manner that is sensitive to gender,
youth and the disabled
R100 000
R0
A final
Implementation
Strategy of the
document proposals
Municipality to reach
National target for
employment of
disabled and women
and carrying out
programmes that are
aimed at developing
the youth
Corporate
Services
Corporate
Services
30/06/2009
30/06/2010
To facilitate
economic
growth and
development
within the
municipal area
Implement Mbonambi�s Local
Economic Development (LED) Plan
and ensure that the plan is
reviewed every three years
In conjunction with the Department
of Agriculture prepare and
implement Municipal Agricultural
Development Plan
Investigate the feasibility of
establishing skills-based tertiary
facilities at Secondary Nodes in
conjunction with the Department of
R150 000
R100 000
R150 000
Revised LED Plan
Complete Municipal
Agricultural Plan
Feasibility Study
Completed
Technical
Services
Technical
Services
Corporate
Services
30/06/2010
30/06/2009
30/06/2012

Revision of the Mbonambi IDP 2008/2009:
Mbonambi Municipality
July 2008 113
Education
To market
Mbonambi
Municipal area
to attract
investment
Prepare and implement a Municipal
Marketing and Communication
Strategy
R50 000 Completed Municipal
Marketing and
Communication
Strategy
Corporate
Services
30/06/2011
To promote
Mbonambi as a
tourism
destination
Prepare and implement a Municipal
Tourism Plan, and thereafter
support tourism initiatives within
the Municipality
R200 000
Completed Municipal
Tourism Plan
Technical
Services
30/06/2009
To promote
SMME
development in
the Municipality
To ensure that SMME development
is catered for in the LED Plan; and
that recommendations are
implemented. This would include
the investigation of strategies of
ensuring ongoing establishment
new businesses in Kwambonambi
town and retaining the existing
ones
R0 Increased
establishment of
SMMEs in the
Municipality
Facilitating the
provision of advise,
training and funding
to SMMEs
Corporate/
Technical
Services
30/06/2012
Create a safe &
secure
environment for
all residents and
visitors to the
Municipality
Prepare and Implement a Municipal
Crime Prevention Strategy
(involvement of all relevant
stakeholders) and ensure that the
Strategy is reviewed form time to
time
R150 000
Completed Municipal
Crime Prevention
Strategy
Corporate
Services/
Municipal
Manager
30/06/2012

Revision of the Mbonambi IDP 2008/2009:
Mbonambi Municipality
July 2008 114
Strategic Focus Area 2: Delivery of Sustainable Infrastructure and Services Development Goal
To facilitate the delivery of infrastructure and services, such as water, sanitation, electricity, access roads, telephones, postal services,
clinics, schools, community halls, sport fields and facilities, pension payout points, police stations, housing, etc. in a sustainable manner
Development
Strategies
Development Objectives Budget
Estimate
KPIs Responsible
Department
Target
Date
To ensure the provision,
upgrading and
maintenance of
Infrastructure and
Services to address
Backlogs
Ensure communication
between the UDM and LM
so that the water and
sanitation needs of the
LM are catered for in the
UDM WSDP and that its
roll-out is programmed
accordingly (including
operation and
maintenance)
To ensure that all
municipal infrastructure is
properly maintained
through the preparation
and implementation of a
Municipal Infrastructure
Service Maintenance Plan
Implement the Municipal
Integrated Waste
Management Plan.
R0
R150 000
R0
UDM takes
consideration of
water and sanitation
needs raised by the
LM
Complete Municipal
Infrastructure
Services Maintenance
Plan
Waste Management
Services in the LM is
done according to
recommendations of
Technical
Services/
Municipal
Manager
Technical
Services
Technical
Services
30/06/2009
30/06/2009
30/06/2009

Revision of the Mbonambi IDP 2008/2009:
Mbonambi Municipality
July 2008 115
To finalize the
identification of
municipal roads that need
to be constructed or
upgraded and prepare
and implement a
Municipal Roads
Programme
R350 000
the Plan
Complete Municipal
Roads Programme
Technical
Services
30/06/2010
To ensure the provision of
sustainable, affordable
and suitably-located
housing development
Implement the Mbonambi
Housing Sector Plan
R0 Delivery of 2 priority
projects by 2011
Corporate
Services
30/06/2011
To ensure co-ordinate
service delivery from all
service providers
To prepare and
implement an
Infrastructure Services
Provision Communication
Strategy with roles and
responsibilities of service
providers in the LM, assist
with the co-ordination of
such service delivery
R75 000 Completed
Infrastructure and
Services Provision
Communication
Strategy
Technical
Services
30/06/2010
To ensure the provision of
sustainable community
facilities
Prepare and Implement a
Municipal Community
Facilities Plan
To finalize the Cemetery
Plan document and
prepare Business Plans and
Funding Applications for
the development of
cemeteries at Sokhulu,
Mbonambi, Dondotha and
Mabuyeni Nodes
R250 000
R0
Completed
Community Facilities
Plan
Completed Cemetery
Plan
Technical
Services
Technical
Services
30/06/2010
30/06/2009

Revision of the Mbonambi IDP 2008/2009:
Mbonambi Municipality
July 2008 116
Strategic Focus Area 3: Enabling Environment for Development Development Goal
To ensure that an enabling environment for development in the Municipality is created; and
To ensure the sustainable use of land and the natural environment
Development
Strategies
Development Objectives Budget
Estimate
KPIs Responsible
Department
Target
Date
To ensure that integrated
development planning
occurs within the
Municipality as a whole
To review the Mbonambi
IDP annually
R150 000 Reviewed IDP
document that is in
line with the budget
Technical
Services
30/06/2009
To ensure the appropriate
and effective use of land
through spatial planning
initiatives and the
implementation of the
outcomes thereof
Finalize and implement
LUMS process
Revise the Mbonambi
Spatial Development
Framework and implement
it
Finalize the Municipal
Nodal Framework Plan and
implement
R0
R180 000
R0
LUMS process
completed
Revised SDF
document
Nodal Framework
Plans Completed
Technical
Services
Technical
Services
Technical
Services
30/06/2009
30/06/2010
30/12/2008
Ensure the sustainability
and protection of the
Municipality�s Natural
Resources
Prepare and implement a
Municipal Environmental
Management Plan
R100 000 Complete
Environmental
Management Plan
Technical 30/12/2009

Revision of the Mbonambi IDP 2008/2009:
Mbonambi Municipality
July 2008 117
Strategic Focus Area 4: Organizational Development Development Goal
To build capacity among officials and councilors to lead and manage development throughout the Municipality
Development Strategies Development Objectives Budget
Estimate
KPIs Responsible
Department
Target Date
To develop staff skills to
ensure effective service
delivery and to improve staff
turnover
Prepare and implement a
Workplace Skills
Development Plan
Prepare and implement a
Human Resources and
Staff Retention Plan
R100 000
R100 000
Completed Workplace
Skills Development
Plan
Completed Human
Resources and Staff
Retention Plan
Corporate
Services
Corporate
Services
30/06/2010
30/06/2009
To align the organizational
structure to the IDP
Ensure that organizational
structure is aligned with
the IDP
Ensure that Municipal
Bylaws are aligned with the
IDP where applicable
R0
R0
Alignment Achieved Corporate
Services
30/06/2009
To improve effective and
efficient communication
between internal staff and
councilors
Develop the Strategic
Communications Plan and
implement it
R100 000 Completed Strategic
Communication Plan
Corporate
Services
30/06/2010
To improve productive and
accountable staff through
and effective Municipal
Performance Management
System
Draft KPI�s and job
descriptions for all staff
and implement monitoring
and evaluation system
Develop incentives for
productivity
R0
R0
KPIs for all Staff, and
implement
monitoring and
evaluation system
Rewarding of
outstanding
employees
Corporate
Services
Corporate
Services
30/06/2010
30/06/2011

Revision of the Mbonambi IDP 2008/2009:
Mbonambi Municipality
July 2008 118
Strategic Focus Area 5: Sound Financial Management Development Goal
To ensure sound Financial Management that will ensure alignment with the Municipality�s IDP, in order to ensure efficient, effective and
sustainable development
Development Strategies Development Objectives Budget
Estimate
KPIs Responsible
Department
Target Date
Improve debt management
processes
Identify all debtors and
prepare and implement a
Debt Coverage Plan
R100 000 75% of all debt
collected
Financial
Services
30/06/2009
Ensure that financial
resources are efficiently and
effectively allocated
Develop and implement
Three Year Municipal
Financial Plan
Ensure active participation
by all relevant stakeholders
in the budget process
Ensure that the Budget
(capital and operational) is
aligned to the IDP through
the preparation and
implementation of the
SDBIP
Develop Integrated Capital
Investment Plan
R0
R0
R0
R50 000
Full Alignment of the
Municipal Budget
with the IDP
Public awareness of
the people about the
Municipal budgeting
process
Alignment Achieved
Integrated capital
investment achieved
Financial
Services
Financial
Services
Financial
Services
Financial
Services/Techni
cal Services
30/06/2009
30/06/2009
30/06/2009
30/06/2009

Revision of the Mbonambi IDP 2008/2009:
Mbonambi Municipality
July 2008 119
Strategic Focus Area 6: Democracy and Corporate Development
Development Goal
To ensure that the developmental mandate of the municipality is understood by all the municipality�s residents, role players and stakeholders; and
To ensure that the Municipality, as an organization, operates effectively and efficiently in a transparent manner
Development
Strategies
Development Objectives Budget
Estimate
KPIs Responsible
Department
Target Date
To fast-track development in
a effective and efficient
manner
To ensure that decision
making is streamlined with
implementation
R0 Ensure that decision
making does not
hinder
implementation of
plans
All 30/06/2009
To facilitate community
development and
involvement in all aspects of
local governance
Involve Tribal Authority,
Ward Committees and
Community Development
Workers (CDW�s) in the
IDP processes
Conduct IDP Road Shows
Develop Community
Participation Strategy
R25 000
R50 000
R50 000
Quarterly Combined
Ward Committee
Meetings and on-
going consultation
with Amakhosi
Road shows
conducted
Finalized Community
participation Strategy
Corporate
Technical
Services
Corporate
30/06/2009
30/06/2009
30/06/2010

Revision of the Mbonambi IDP 2008/2009:
Mbonambi Municipality
July 2008 120
H. MUNICIPAL PROJECTS
1 MIG PROJECTS
The table below sets out the MIG priority projects for Mbonambi Municipality for 2008-2009
to 2011-2012:
MIG 2008 - 2009
Agent Project Title MOA
KZ 281 - Mbonambi
Ward 11 - Buhubhubhu Community Hall
(230m2) 1,029,400.00
KZ 281 - Mbonambi Ward 12 - Makhwezini Community Hall (230m2) 1,029,400.00
KZ 281 - Mbonambi
Ward 13 - Shwashweni Community Hall
(230m2) 1,029,400.00
KZ 281 - Mbonambi
Ward 06 - Tshingimpisi Community Hall
(230m2) 1,029,400.00
KZ 281 - Mbonambi Ward 08 - Welawela Pension Pay Shelter 627,550.00
KZ 281 - Mbonambi
Ward 10 - Phathane Pension Pay Shelter (50
m2) 627,550.00
KZ 281 - Mbonambi Ward 05 - Sizanani Pay Point Shelter 627,550.00
KZ 281 - Mbonambi Ward 09 - Dondotha Pay Point Shelter 627,550.00
KZ 281 - Mbonambi Ward 10- Mnqagayi Pay Point Shelter 627,550.00
7,255,350.00
MIG 2009 - 2010
KZ 281 - Mbonambi Ward 01 - Manzamnyama Library 732,000.00
KZ 281 - Mbonambi Ward 01-Ediphini Small play ground 154,000.00
KZ 281 - Mbonambi Ward 02 - Isibonelo Creche 625,000.00
KZ 281 - Mbonambi Ward 02 - Amala phansi Community Hall 1,245,000.00
KZ 281 - Mbonambi Ward 03- Nkunzebomvu Multy Purpose Centre 1,900,000.00
KZ 281 - Mbonambi Ward 03 - Ezikhonkwaneni creche 625,000.00
KZ 281 - Mbonambi Ward 04 - Hlezane Creche 625,000.00
KZ 281 - Mbonambi Ward 04 - Cinci Pension Payout Shelter 690,000.00
KZ 281 - Mbonambi Ward 05 - Sizanani Small Playground 154,000.00
KZ 281 - Mbonambi Ward 05 - Emankhwaneni Creche 625,000.00
KZ 281 - Mbonambi Ward 06 - Sibusisiwe Creche 625,000.00
KZ 281 - Mbonambi Ward 06 - Mkhayideni Library 732,000.00
KZ 281 - Mbonambi Ward 07 -Makhuba Creche 625,000.00
KZ 281 - Mbonambi Ward 07 - Bhekizenzo Small Play Ground 154,000.00
KZ 281 - Mbonambi Ward 08 - Ntobeko Creche 625,000.00
KZ 281 - Mbonambi Ward 08 - Mbabe Road 907,500.00
KZ 281 - Mbonambi Ward 09 - Phembisizwe Creche 625,000.00
KZ 281 - Mbonambi Ward 09 - Simamise Creche 625,000.00
KZ 281 - Mbonambi Ward 10 - Sabhuza road 907,500.00
KZ 281 - Mbonambi Ward 10 - Nkiyankiya road 907,500.00
KZ 281 - Mbonambi Ward 11 - Msunduze to Mthwana Road 907,500.00

Revision of the Mbonambi IDP 2008/2009:
Mbonambi Municipality
July 2008 121
KZ 281 - Mbonambi Ward 11 - Nontshongolwane Creche 625,000.00
KZ 281 - Mbonambi Ward 12 - Mvamanzi Small Play Ground 154,000.00
KZ 281 - Mbonambi Ward 12 -Nhlangwini road 907,500.00
KZ 281 - Mbonambi Ward 13 - Ntuthunge childcare centre 625,000.00
KZ 281 - Mbonambi Ward 13 - Novunula pension payout shelter 690,000.00
18,017,500.00
MIG 2010 - 2011
KZ 281 - Mbonambi Ward 01 - Ngome Road 690,000.00
KZ 281 - Mbonambi Ward 01 - Hlawini Creche 690,000.00
KZ 281 - Mbonambi Ward 02 - Amalala phezulu Small Playground 170,000.00
KZ 281 - Mbonambi Ward 02 - Amalala phezulu Bus Shelter 25,000.00
KZ 281 - Mbonambi Ward 03 - Mabhodla Markert Stalls 150,000.00
KZ 281 - Mbonambi Ward 03 - Ontinqweni Pension payout point 760,000.00
KZ 281 - Mbonambi Ward 04 - Nodumo Small Playground 170,000.00
KZ 281 - Mbonambi Ward 04 - Bulimeni Library 805,200.00
KZ 281 - Mbonambi Ward 05 - Sabokwe Road 1,000,000.00
KZ 281 - Mbonambi Ward 05 - Nzalabantu Community Hall 1,370,000.00
KZ 281 - Mbonambi Ward 06 - Khondweni Road 1,000,000.00
KZ 281 - Mbonambi Ward 06 - Small Play Ground 170,000.00
KZ 281 - Mbonambi Ward 07 - Makhuba creche 690,000.00
KZ 281 - Mbonambi Ward 07 - Muntukangiwa Community Hall 1,370,000.00
KZ 281 - Mbonambi Ward 08 - Mbabe Pay poiont Shelter 760,000.00
KZ 281 - Mbonambi Ward 08 - Wela wela Small Playground 170,000.00
KZ 281 - Mbonambi Ward 09 - Mafusini Road 1,000,000.00
KZ 281 - Mbonambi Ward 09 - Luhlanga Small Play Ground 170,000.00
KZ 281 - Mbonambi Ward 10 - Zilahle road 1,000,000.00
KZ 281 - Mbonambi Ward 10 - Khishwa Creche 690,000.00
KZ 281 - Mbonambi Ward 11 - Siyaphambili Library 805,200.00
KZ 281 - Mbonambi Ward 11 - Mpumeni Small Play Ground 170,000.00
KZ 281 - Mbonambi Ward 12 - Shayamoya small play ground 170,000.00
KZ 281 - Mbonambi Ward 12 - Makhwezini bus shelter 25,000.00
KZ 281 - Mbonambi Ward 13 - Ocilwane payout shelter 760,000.00
KZ 281 - Mbonambi Ward 13 - Nkwalini Small Ground 170,000.00
14,950,400.00
MIG 2011 - 2012
KZ 281 - Mbonambi Ward 01 -
KZ 281 - Mbonambi Ward 01 -
KZ 281 - Mbonambi Ward 02 - Bukela Pension pay point 836,000.00
KZ 281 - Mbonambi Ward 02 - Creche 760,000.00
KZ 281 - Mbonambi Ward 03 - Nhlabane Tourism Project
KZ 281 - Mbonambi Ward 03 - Holinyoka Umhambi Elawini
KZ 281 - Mbonambi Ward 04 - Nodumo creche 760,000.00
KZ 281 - Mbonambi Ward 04 - Mdongadlovu Road 1,100,000.00
KZ 281 - Mbonambi Ward 05 - sabokwe community hall 1,369,500.00
KZ 281 - Mbonambi Ward 05 - Nhlanzini Creche 760,000.00
KZ 281 - Mbonambi Ward 06 - Skhangane Creche 760,000.00

Revision of the Mbonambi IDP 2008/2009:
Mbonambi Municipality
July 2008 122
KZ 281 - Mbonambi Ward 06 - Mzingaze bus shelter 1,100,000.00
KZ 281 - Mbonambi Ward 07 - Makhuba pension pay point 836,000.00
KZ 281 - Mbonambi Ward 07 - Mankayiyane road 1,100,000.00
KZ 281 - Mbonambi Ward 08 - Mfolozane Creche 760,000.00
KZ 281 - Mbonambi Ward 08 - Mbabe Creche 760,000.00
KZ 281 - Mbonambi Ward 09 - Ngunezi Creche 760,000.00
KZ 281 - Mbonambi Ward 09 - Mtinya Road 1,100,000.00
KZ 281 - Mbonambi Ward 10 - Mpathiswane community hall 1,369,500.00
KZ 281 - Mbonambi Ward 10 - Esitezi creche 760,000.00
KZ 281 - Mbonambi Ward 11 - Mboholo Road 1,100,000.00
KZ 281 - Mbonambi Ward 11 - Mthane Creche 760,000.00
KZ 281 - Mbonambi Ward 12 - Fuyeni Hall 1,369,500.00
KZ 281 - Mbonambi Ward 12 - Mgunya small play ground 180,000.00
KZ 281 - Mbonambi Ward 13 - Ntuthunga child care centre 760,000.00
KZ 281 - Mbonambi Ward 13 - Shwashweni child care centre 760,000.00
19,820,500.00

Revision of the Mbonambi IDP 2008/2009:
Mbonambi Municipality
July 2008 123
2 MAYORAL PROJECTS
MAYORAL PROJECTS 2008 / 2009
WARD PROJECTS TYPE OF PROJECT
Ward 1 Hlawini poultry Poultry
Hlawi beaders Beads work
Ntongonya / mapute Blockmaking Blockmaking
Thukwini Poultry Poultry
Hlanzeni knitters Knitting
Ntongonya Sewing Sewing
Ward 2
Thubalethu Beading Beading
Sokhulu cooperative Garden Fencing
Sokhulu cooperative Blockmaking
Ezolimo Cooperative Garden Fencing
Bukela cooperative Garden Fencing
Amalalaphansi Poultry Poultry
Ward 3
Sisonke farming Goats Production
Bafana's fencing Factory Fence making material
Zizameleni Garden Garden
Nyonikayiphumuli Garden Garden Fencing
Ward 4 Mdungandlovu Sewing Sewing
Zithuthukise Poultry Poultry
Ziqoqele poultry Poultry
Inhloso Blockmaking Blockmaking
Sifanele Sewing Sewing
Othandweni Garden Garden
Mpumeni Youth Goats farmers Goats
Mpumeni Garden Garden
Bulimeni Poultry Poultry
Nyonini Blockmaking Blockmaking
Nyonini Bakery Baking
Hlanaganisani Sewing Sewing
Nodumo A & B Poultry Poultry
Ward 5 Qalakancane Garden Fencing
Nhlanzini Garden Fencing
Phathisizwe garden Tools
Siyaphumelela Poultry Poultry
Emankwathini Blockmaking Blockmaking
Umthombo Craft& Sewing Sewing & craft
Shobeni Sewing Sewing & craft
Masibumbane Poultry Poultry
Siyazama garden Tools
Vukuzithathe Garden Tools

Revision of the Mbonambi IDP 2008/2009:
Mbonambi Municipality
July 2008 124
Ward 6 Mabhodla Poultry Poultry
Mhlengeni Garden Fencing Fencing
Sikhangane Sewing Sewing
Mkhayideni Garden Tools Tools
Mzingazi goat farming Goat Farming
Mbomvu Garden Tools
Zamokuhle Garden Garden
Makhosazana Sewing Sewing
Zakhele Blockmaking Sand and Crusher
Vukuzenzele Blockmaking Sand and Crusher
Ward 7 Ubumbano Blockmaking Blockmaking
Mzamo Blockmaking Blockmaking
Hlanganani Blockmaking Blockmaking
Nkunzenhle Blockmaking Blockmaking
Vukani blockmaking Blockmaking
Sakhokuhle Garden Garden Tools
Ukuthula Garden Garden Tools
Siyazama blockmaking Blockmaking
Qedusizi garden Fencing
Ngcedomhlophe garden Garden Tools
Phobobo Carpentry Carpentry
Ward 8 Bongumenzi goat Goat farming
Mnqadi Sewing Sewing
Mnqadi Blockmaking Blockmaking
Danyini Goat farming Goat farming
Siyazama Sewing Sewing
Makhandeni Beading Beading
Bumbaneni goat farming Goat farming
Qedindlala Poultry Poultry
Seeds Beans & Maize
Mfolozana garden Fencing Fencing
Welawela Poultry Poultry
Gcoba Poultry Poultry
Mfolozana Poultry Poultry
Ward 9 Qedindlala field Project Planting phase 2
Mzini Community Garden Garden
Yizivalo Goat farming Goat farming
Senzokuhle craft Craft
Sizanani Leather works Leatherworks
Vukani Craft & Beaders Craft and Beading
Mazibuye emasisweni Traditional food producers

Revision of the Mbonambi IDP 2008/2009:
Mbonambi Municipality
July 2008 125
Ward 10 Khishwa Craft Craft
Eqheleni sewing Sewing
Mthiya blockmaking Blockmaking
Zilahle crafters Craft
204 garden Garden
Gegede Blockmaking Blockmaking
Manzi Goat farming Goat farming
Siyeluka Project Craft
Sizanani Furniture Furniture
Mzila metal makers Metal markers
Vulamehlo Mendu Sewing Sewing
Kwazini Farmers association Field Crops
Ward 11 Celinhlakanipho Beading
Vuthisa Irrigation
Qothela Irrigation
Gwatshi Irrigation
Siyazisebenzela Caters Catering
WARD
12 Amanxusa Goats farmers Goats farming
Injobo Beaders Beading
Zamani Sewing Sewing
Makhezini sewing Sewing
Socoboyi sewing Sewing
Vukusebenze Blockmaking Blockmaking
Mgunya Beaders Beading
Shayamoya Blockmaking Blockmaking
Othini sewing Sewing
Ward 13 Abaphumeleli Goat farmers Goat production
Masakhane sewing Sewing
Ntuthunga no 2 Craft Craft
Ntuthunga no 1 Garden
Siyazama Makhasi garden Fencing
Ocilwane garden Fencing
Elangeni Goat Farming Farming

Revision of the Mbonambi IDP 2008/2009:
Mbonambi Municipality
July 2008 126
I. FINANCIAL PLAN AND SDBIP
1 INTRODUCTION
The main sources of external funding for the Municipality are:
Equitable Share
MIG
MSIG and
Funding from the Province
More than 90% of the Municipality�s projected expenditure for 2008/09 Financial Year is
allocated to committed expenses which include:
Salaries, wages and allowances which amounts to 32.3% of total expenditure
General expenses such as printing, licensing advertising make up to 17.7% of total
expenditure, and,
Contribution to projects is estimated at 40.5% of the total projected expenditure
The remaining 10% is allocated to the repairs and maintenance of existing municipal assets,
contributions to capital outlay and contributions to reserves and provisions.
1.1 THE FIVE YEAR CAPITAL INVESTMENT PROGRAMME
The Municipality has not prepared its five year capital investment plan. However,
plans are in place to prepare one during 2008/2009.
1.2 STRATEGIES
1.2.1 REVENUE RAISING STRATEGIES
The municipality approves once per annum at the annual budget meeting the rates tariff
for the ensuing financial year in terms of the provisions of Section 105 of the Local
Authorities Ordinance, 1974 (Ordinance 25 of 1974).
The municipality approves once per annum at the annual budget meeting the increases
in the service tariffs for the ensuing financial year.
Accounts for refuse removal are sent out monthly, with payment dates clearly reflected
thereon.

Revision of the Mbonambi IDP 2008/2009:
Mbonambi Municipality
July 2008 127
Rates are payable by 30 November of the financial year and outstanding rates accounts
are dealt with in terms of the provisions of Section 172 of the Local Authorities
Ordinance, 1974 (Ordinance 25 of 1974).
Cashiers are available during normal business hours at the Mbonambi Municipal Offices
All monies received are collected by a security company and deposited into the current
account of the municipality. Monthly bank reconciliation is done to balance the cash
books of the municipality.
The Municipality implements its policies relating to Credit Control And Debt Collection
Policy
The implementation of the Municipality�s Indigent Policy ensures that households that
cannot afford to pay services are identified and receive services accordingly
1.2.2 FINANCIAL MANAGEMENT STRATEGIES
The financial matters of the municipality are managed by the Chief Financial Officer
(CFO) of the Municipality.
The Council of the municipality approves the Financial Regulations applicable to all
financial transactions of the municipality.
The Revenue Section in the Financial Department is responsible for all the revenue
accounts of the municipality and consists of Chief Financial Officer, (Budget Control
Officer), Accountant, Assistant Accountant-Revenue, and Cashier.
The Expenditure Section in the Financial Department is responsible for salaries, stores
and the payment of creditor accounts. In terms of the Financial Regulations of the
municipality, this section also acts as the buyer for the municipality. The section consists
of Chief Financial Officer who is the accounting financial office, Budget Control Officer,
Accountant, and Procurement Officer.
The CFO is responsible for the compilation of the municipality�s Capital and Operating
Budget and this is based on the information provided by the departments of the
municipality (Municipal Manager, Manager Corporate Services, Manager Technical
Services, and Mayoral Office).
The CFO recommends to the Council of the municipality the tariffs that will enable the
municipality to balance the annual budget.
In terms of the provisions of Section 10G of the Local Government Transition Act, 1993
(Act 209 of 1993) as well as the Local Authorities Ordinance, 1974 (Ordinance 25 of
19974), the CFO is responsible for the balancing of the Financial Statements of the
municipality within 3 months from the end of a financial year which ends on 30 June.
1.2.3 ASSET MANAGEMENT STRATEGIES
All the departmental managers take charge of the assets in his/her department.

Revision of the Mbonambi IDP 2008/2009:
Mbonambi Municipality
July 2008 128
Each manager is charged with the responsibility of indicating the maintenance costs
within his/her department�s operating budget in order to ensure cost effectiveness in
terms of the use of assets.
The Council has adopted a policy in terms of which the life span of assets is determined
and replacement takes place only when such a date is reached.
Assets having reached the pre-determined life span are sold in terms of the provisions of
Section 189 of the Local Authorities Ordinance, 974 (Ordinance 25 of 1974).
The CFO is responsible for the insurance cover of all the assets of the municipality.
The development and implementation of a fixed asset register and asset control system
as well as the maintenance thereof

Revision of the Mbonambi IDP 2008/2009:
Mbonambi Municipality
July 2008 129
1.2.4 CAPITAL FINANCING STRATEGIES
The basic capital projects of the municipality are funded from internal funds in term of
the provisions of Section 109 of the Local Authorities Ordinance, 1974 (Ordinance 25 of
1974).
Capital projects are mostly funded from grant funding and implementation of capital
project commences only when the grant funding has been received.
Smaller capital projects are funded from the internal funds of the municipality, where
possible.

Revision of the Mbonambi IDP 2008/2009:
Mbonambi Municipality
July 2008 130
Below is the Medium Term Budget for the Municipality. The budget below is a draft budget for 2008/2009 to 2009/2010 which was prepared
with the approved budget for 2007/2008:
BUDGET FOR 2008/09 FINANCIAL YEAR
VOTENUMBER DESCRIPTION 2008/09 2009/10 2010/11
OPERATING INCOME
PROPERTY RATES
0000/00/2/20/0001 ASSESSMENT RATES - RESIDENTIAL (2,429,073.00) (6,366,181.50) (8,041,378.50)
(2,429,073.00) (6,366,181.50) (8,041,378.50)
PEN, IMPOSED & COLL. RATES
0000/00/2/21/1010 PEN, IMPOSED & COLL.CHARON RATES (100,000.00) (100,000.00) (700,000.00)
(100,000.00) (100,000.00) (700,000.00)
SERVICE CHARGES
0000/00/2/22/1700 REFUSE REMOVAL - BUILDING MATERIAL (157,500.00) (166,950.00) (176,967.00)
0000/00/2/22/1701 WATER
(157,500.00) (166,950.00) (176,967.00)
OPERATING GRANTS & SUBSIDIES
0000/00/2/'25/0001 DEV.ADMIN CAPACITYBUILDING
0000/00/2/25/0301 EQUITABLE SHARE (17,000,000.00) (19,992,000.00) (25,115,000.00)
0000/00/2/25/0302 EQUITABLE SHARE -COUNCIL ALLOWANCE (1,233,000.00) (1,289,000.00) (1,347,000.00)
0000/00/2/25/0402 INDIRECT GRANT ELECTRIFICATION (5,870,000.00) (7,247,000.00) (8,413,000.00)
0000/00/2/25/0501 MFMA (500,000.00) (750,000.00) (1,000,000.00)
0000/00/2/25/0502 MIG (7,686,000.00) (10,190,000.00) (11,499,000.00)
0000/00/2/25/0600 MSIG (735,000.00) (735,000.00) (735,000.00)
0000/00/2/25/0401 HOUSING GRANT (3,000,000.00) (3,000,000.00) (3,000,000.00)
0000/00/2/25/0605
PROVINCIAL MANAGEMENT ASSISTANT
PROGRAMME (100,000.00) (160,000.00) (170,000.00)
0000/00/2/25/0403 INFRASTRUTURE (500,000.00) 0.00 0.00

Revision of the Mbonambi IDP 2008/2009:
Mbonambi Municipality
July 2008 131
(36,624,000.00) (43,363,000.00) (51,279,000.00)
INTEREST
0000/00/2/26/0805 INTEREST RECEIVED (100,000.00) (100,000.00) (100,000.00)
(100,000.00) (100,000.00) (100,000.00)
OTHER INCOME
0000/00/2/37/2082 RENT (74,000.00) (78,440.00) (83,146.40)
0000/00/2/41/2134 CLEARANCE CERTIFICATE (600.00) (600.00) (600.00)
0000/00/2/41/2160 MISCELLANEOUS INCOME (50,000.00) (50,000.00) (50,000.00)
0000/00/2/41/2170 TENDER MONIES (100,000.00) (100,000.00) (100,000.00)
0000/00//2/41/2171 TRAFFIC FINES (7,261,911.50) (8,000,000.00) (8,480,000.00)
0000/00/2/41/2174 TELEPHONE COST RECOVERED (10,000.00) (10,000.00) (10,000.00)
(7,496,511.50) (8,239,040.00) (8,723,746.40)
TOTAL OPERATING INCOME (46,907,084.50) (58,335,171.50) (69,021,091.90)
EMPLOYEE SALARIES AND ALLOWANCES
0000/00/1/01/1014 BARGAIN 2,827.20 3,025.10 3,236.86
0000/00/1/01/1012 BONUS 535,218.16 572,683.43 612,771.27
0000/00/1/01/1041 CELLPHONE ALLOWANCE 6,857.14 7,337.14 7,850.74
0000/00/1/01/1015 HOUSING SUBSIDY 63,000.00 67,410.00 72,128.70
0000/00/1/01/1021 RELIEF & OVERTIME 495,955.78 530,672.68 567,819.77
0000/00/1/01/1025 SALARIES & WAGES 7,914,200.22 8,468,194.24 9,060,967.83
0000/00/1/01/1026 SDL 66,043.86 70,666.93 75,613.62
0000/00/1/01/1024 SUBSISTENCE & RE-IMBURSEMENT ALLOWANCE 151,646.31 162,261.55 173,619.86
0000/00/1/01/1029 TRAVEL CLAIM 63,381.27 67,817.96 72,565.22
0000/00/1/01/1027 VEHICLE ALLOWANCE 735,575.75 787,066.05 842,160.68
0000/00/1/01/1028 VEHICLE ALLOWANCE-ASS.MANAGER 400,000.00 428,000.00 457,960.00
NIGHT ALLOWANCE 16,570.00 17,729.90 18,970.99
10,451,275.69 11,182,864.99 11,965,665.54
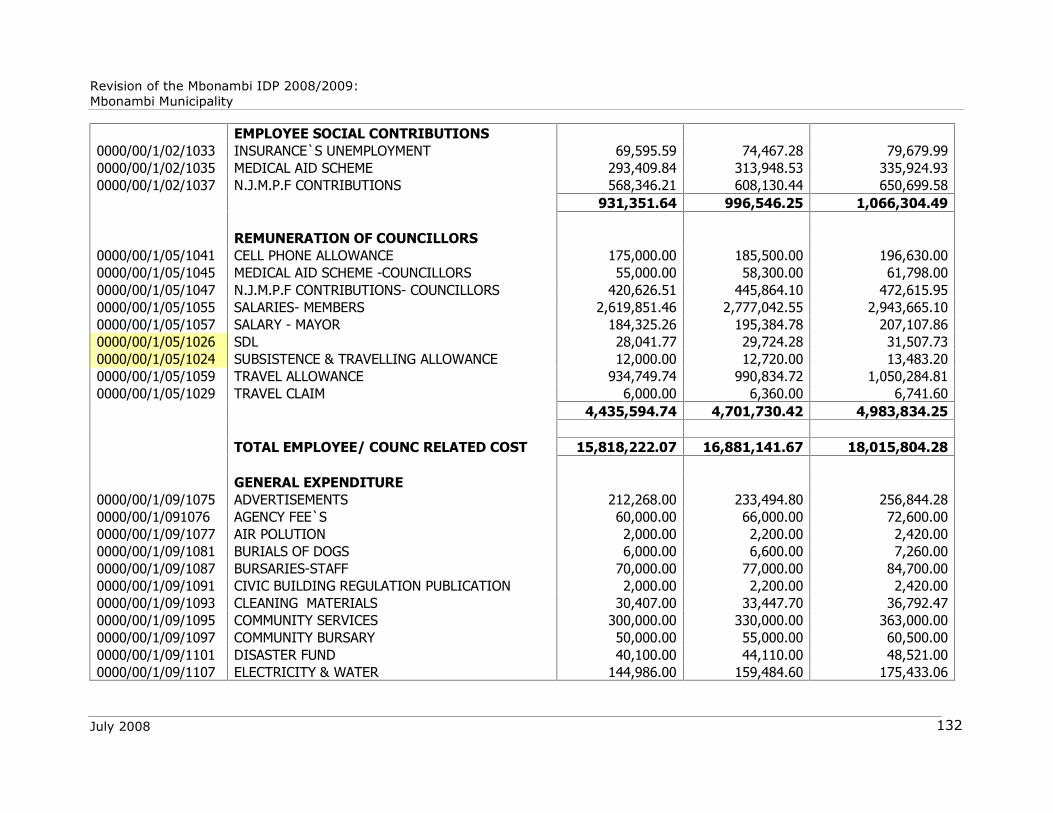
Revision of the Mbonambi IDP 2008/2009:
Mbonambi Municipality
July 2008 132
EMPLOYEE SOCIAL CONTRIBUTIONS
0000/00/1/02/1033 INSURANCE`S UNEMPLOYMENT 69,595.59 74,467.28 79,679.99
0000/00/1/02/1035 MEDICAL AID SCHEME 293,409.84 313,948.53 335,924.93
0000/00/1/02/1037 N.J.M.P.F CONTRIBUTIONS 568,346.21 608,130.44 650,699.58
931,351.64 996,546.25 1,066,304.49
REMUNERATION OF COUNCILLORS
0000/00/1/05/1041 CELL PHONE ALLOWANCE 175,000.00 185,500.00 196,630.00
0000/00/1/05/1045 MEDICAL AID SCHEME -COUNCILLORS 55,000.00 58,300.00 61,798.00
0000/00/1/05/1047 N.J.M.P.F CONTRIBUTIONS- COUNCILLORS 420,626.51 445,864.10 472,615.95
0000/00/1/05/1055 SALARIES- MEMBERS 2,619,851.46 2,777,042.55 2,943,665.10
0000/00/1/05/1057 SALARY - MAYOR 184,325.26 195,384.78 207,107.86
0000/00/1/05/1026 SDL 28,041.77 29,724.28 31,507.73
0000/00/1/05/1024 SUBSISTENCE & TRAVELLING ALLOWANCE 12,000.00 12,720.00 13,483.20
0000/00/1/05/1059 TRAVEL ALLOWANCE 934,749.74 990,834.72 1,050,284.81
0000/00/1/05/1029 TRAVEL CLAIM 6,000.00 6,360.00 6,741.60
4,435,594.74 4,701,730.42 4,983,834.25
TOTAL EMPLOYEE/ COUNC RELATED COST 15,818,222.07 16,881,141.67 18,015,804.28
GENERAL EXPENDITURE
0000/00/1/09/1075 ADVERTISEMENTS 212,268.00 233,494.80 256,844.28
0000/00/1/091076 AGENCY FEE`S 60,000.00 66,000.00 72,600.00
0000/00/1/09/1077 AIR POLUTION 2,000.00 2,200.00 2,420.00
0000/00/1/09/1081 BURIALS OF DOGS 6,000.00 6,600.00 7,260.00
0000/00/1/09/1087 BURSARIES-STAFF 70,000.00 77,000.00 84,700.00
0000/00/1/09/1091 CIVIC BUILDING REGULATION PUBLICATION 2,000.00 2,200.00 2,420.00
0000/00/1/09/1093 CLEANING MATERIALS 30,407.00 33,447.70 36,792.47
0000/00/1/09/1095 COMMUNITY SERVICES 300,000.00 330,000.00 363,000.00
0000/00/1/09/1097 COMMUNITY BURSARY 50,000.00 55,000.00 60,500.00
0000/00/1/09/1101 DISASTER FUND 40,100.00 44,110.00 48,521.00
0000/00/1/09/1107 ELECTRICITY & WATER 144,986.00 159,484.60 175,433.06

Revision of the Mbonambi IDP 2008/2009:
Mbonambi Municipality
July 2008 133
0000/00/1/09/1110 ENTERTAINMENT & RECEPTIONS 155,000.00 170,500.00 187,550.00
0000/00/1/09/1113 FUEL & OIL 191,166.00 210,282.60 231,310.86
0000/00/1/09/1117 GRANTS & DONATION 150,000.00 165,000.00 181,500.00
0000/00/1/09/1118 HIV AWARENESS CAMPAIGN 200,000.00 220,000.00 242,000.00
0000/00/1/09/1125 INTERNAL AUDIT 150,000.00 165,000.00 181,500.00
0000/00/1/09/1129 KWANALOGA GAMES 107,430.00 118,173.00 129,990.30
0000/00/1/09/1131 LED 180,000.00 198,000.00 217,800.00
0000/00/1/09/1135 LEGAL FEES 90,000.00 99,000.00 108,900.00
0000/00/1/09/1137 LEVIES / MEMBERSHIP FEES 10,000.00 11,000.00 12,100.00
0000/00/1/09/1139 LICENCES 100,000.00 110,000.00 121,000.00
0000/00/1/09/1145 MAYORAL CUP 75,000.00 82,500.00 90,750.00
0000/00/1/09/1146 MEDICAL EXAMINATIONS 3,000.00 3,300.00 3,630.00
0000/00/1/09/1149 NOISE POLLUTION 5,000.00 5,500.00 6,050.00
0000/00/1/09/1159 POSTAL SERVICES 6,818.00 7,499.80 8,249.78
0000/00/1/09/1162 PRINTING & STATIONERY 181,000.00 199,100.00 219,010.00
0000/00/1/091169 PUAPER BURIAL 40,000.00 44,000.00 48,400.00
0000/00/1/09/1172 PUBLICITY 259,429.04 285,371.94 313,909.14
60,050.00 66,055.00 72,660.50
0000/00/1/09/1175 PURCHASE OF BOOKS 14,000.00 15,400.00 16,940.00
0000/00/1/09/1180 REFRESHMENTS 160,640.00 176,704.00 194,374.40
0000/00/1/09/1183 REFRESHMENTS COUNCIL 120,000.00 132,000.00 145,200.00
0000/00/1/09/1187 RENT-COPIER 57,600.00 63,360.00 69,696.00
0000/00/1/09/1189 RENT-PLANT & VEHICLES 100,000.00 110,000.00 121,000.00
0000/00/1/09/1191 SANITATION 95,400.00 104,940.00 115,434.00
0000/00/1/09/1192 SERMINARS & CONFERENCES 30,000.00 33,000.00 36,300.00
0000/00/1/09/1193 SMALL TOOLS 30,000.00 33,000.00 36,300.00
0000/00/1/091195 STAFF YEAR END FUNCTION 30,000.00 33,000.00 36,300.00
0000/00/1/09/1197 STORES & MATERIAL 140,000.00 154,000.00 169,400.00
0000/00/1/09/1198 STREET LIGHTNING 10,000.00 11,000.00 12,100.00
0000/00/1/09/1200 SUBSUSTENCE & TRAVELLING 250,000.00 275,000.00 302,500.00
0000/00/1/09/1202 SUNDRIES 46,770.00 51,447.00 56,591.70
0000/00/1/09/1204 TELEPHONE 200,000.00 220,000.00 242,000.00

Revision of the Mbonambi IDP 2008/2009:
Mbonambi Municipality
July 2008 134
0000/00/1/09/1205 TRAFFIC MANAGER SERVICES 1,195,821.14 1,324,528.61 1,466,745.63
0000/00/1/09/1206 TRAINING 376,800.00 414,480.00 455,928.00
0000/00/1/09/1214 UNIFORMS AND PROTECTIVE CLOTHING 130,691.00 143,760.10 158,136.11
0000/00/1/09/1230 YOUTH SKILLS DEVELOPMENT 120,000.00 132,000.00 145,200.00
5,989,376.18 6,597,439.16 7,266,947.22
GENERAL EXPENSES - FINANCIAL SERV.
0000/00/1/10/1255 BANK CHAGRES 10,000.00 11,000.00 12,100.00
0000/00/1/10/1257 EXTERNAL AUDIT FEES 60,000.00 66,000.00 72,600.00
0000/00/1/10/1259 INSURANCE 356,796.00 392,475.60 431,723.16
0000/00/1/10/1261 INSURANCE - W.C.A 94,712.00 104,183.20 114,601.52
521,508.00 573,658.80 631,024.68
GENERAL EXPENSES -CONTRACTED SER.
0000/00/1/12/1272 AGENCY FEES 0.00 0.00 0.00
0000/00/1/12/1274 AUDIT COMMITTEE 74,000.00 81,400.00 86,284.00
0000/00/1/12/1276 CLEANING SERVICES 240,000.00 264,000.00 279,840.00
0000/00/1/12/1278 CONTRACT SERVICES (housing) 3,000,000.00 3,300,000.00 3,498,000.00
0000/00/1/12/1284 SECURITY 700,000.00 770,000.00 816,200.00
4,014,000.00 4,415,400.00 4,680,324.00
TOTAL GENERAL EXPENSES 10,524,884.18 11,586,497.96 12,578,295.90
REPAIRS AND MAINTENANCE
0000/00/1/20/1430 R & M- BUILDINGS 705,000.00 775,500.00 822,030.00
0000/00/1/20/1434 R & M -COMPUTERS 55,000.00 60,500.00 64,130.00
0000/00/1/20/1440 R & M - FURNITURE & EQUIPMENT 30,000.00 33,000.00 34,980.00
0000/00/1/20/1452 R & M - ROADS & STORMWATER 895,924.44 1,138,491.07 1,574,243.19
0000/00/1/20/1454 R & M - VEHICLES 250,000.00 275,000.00 291,500.00
0000/00/1/20/1456 R & M - WASTE TRANSFER STATION 111,384.00 122,522.40 129,873.74

Revision of the Mbonambi IDP 2008/2009:
Mbonambi Municipality
July 2008 135
2,047,308.44 2,405,013.47 2,916,756.93
CONTIBUTION TO CAPITAL OUTLAY
0000/00/1/23/1560 PLANT & EQUIPMENT 265,000.00 291,500.00 308,990.00
0000/00/1/23/1562 COMPUTERS 248,000.00 272,800.00 289,168.00
0000/00/1/23/1563 COMPUTER SOFTWARE 60,000.00 66,000.00 69,960.00
0000/00/1/23/1564 FURNITURE & FITTINGS 155,600.00 171,160.00 181,429.60
0000/00/1/23/1566 VEHICLES 797,069.81 581,040.39 474,334.34
1,525,669.81 1,382,500.39 1,323,881.94
0.00
CONTRIBUTION TO RESRV. AND PROVIS.
0000/00/1/24/1666 CONTRIBUTION TO LEAVE PROVISION 300,000.00 300,000.00 300,000.00
0000/00/1/24/1667 STORMWATER CONTRIBUTIONS 200,000.00 200,000.00 200,000.00
CONTRIBUTION TO RESERVE 0.00 5,748,018.01 11,369,352.84
500,000.00 6,248,018.01 11,869,352.84
CONTRIBUTION TO PROJECT FUNDS
0000/00/1/25/1706 INDIRECT GRANT 5,870,000.00 7,247,000.00 8,413,000.00
0000/00/1/25/1709 MAYORAL PROJECTS 1,600,000.00 1,500,000.00 1,500,000.00
0000/00/1/25/1720 MIG 7,686,000.00 10,190,000.00 11,499,000.00
0000/00/1/25/1723 MSIG 735,000.00 735,000.00 735,000.00
PROVINCIAL MANAGEMENT ASSISTANT
PROGRAMME 100,000.00 160,000.00 170,000.00
INFRASTRUTURE 500,000.00 0.00 0.00
16,491,000.00 19,832,000.00 22,317,000.00
0000/00/1/28/9998 TOTAL EXEPENDITURE ( NET ) 46,907,084.50 58,335,171.50 69,021,091.90
(SURPLUS)/DEFICITY 0.00 (0.00) (0.00)

Revision of the Mbonambi IDP 2008/2009:
Mbonambi Municipality
July 2008 136
From the above budget breakdown, it is evident that:
Grants and subsidies constitute 77.9% of the budget income of the Municipality�s
2008/2009 financial year budget with assessment rates only contributing 9.97% towards
the total income. It is interesting to note that of the latter 8.5% of the total Municipal
Income is to be derived from traffic fines (R4 000 000)
In terms of budgeted expenses for 2008/2009 financial year, contributions to project
funds totaled R16, 391,000.00 (or 37% of the total budgeted expense

Revision of the Mbonambi IDP 2008/2009:
Mbonambi Municipality
July 2008 137
2 DRAFT SERVICE DELIVERY AND BUDGET
IMPLEMENTATION PLAN 2008/9 (SDBIP)
The draft SDBIP includes monthly projections of revenue by source, monthly projections of
revenue and expenditure by vote, quarterly projections for service delivery targets and other
performance indicators, a detailed capital plan, a capital plan by GFS classification, monthly
cash flows by source and equitable share monthly cash flows.
The Municipality, as required by legislation, has the following Policies in place which are
being implemented. Further, these Policies are revised as and when required:
Credit Control And Debt Collection Policy
Debt Management Policy
Investment And Cash Management Policy
3 ANNUAL FINANCIAL REPORT
The Municipality is busy preparing the Annual Report for 2005/2006 to 2007/2008. This will
contain information on income statements, cash flow statement and notes to the financial
statements. The Audited financial statements for 2004/2005 onward are not part of the
Annual Financial Report as the Auditor General has not finalized these audits. The Annual
Report is expected to be finalized by the end of July 2008.
4 REPORTS OF THE AUDITOR GENERAL
The document for 2005 to 2007 will be included with the Annual Report. It contains a
number of issues that were raised therein. As of date, the Auditor General has not finalized
his Audit Reports for financial years 2004/2005 to 2006/2007.
5 BUDGET ALIGNMENT WITH INTEGRATED
DEVELOPMENT PLAN
The alignment of the draft budget with the Mbonambi Integrated Development Plan is
partially demonstrated in the Implementation Plan of the Municipality. However, full
alignment over the 5-year period has not yet been achieved. This alignment will be achieved
during the preparation of the 2009/10 Budget (as allowed for the Development Objectives).
Revision of the Mbonambi IDP 2008/2009:
Mbonambi Municipality
July 2008 138
6 CONCLUSION
In terms of the way forward with regards to finalizing the 2007/2008 IDP Review, the
following components still needs to be included:
Project details for 2008/2009 needs to be included in the IDP Review, once obtained
from Council, communities, government and other stakeholders in the Municipal Area.
Consultation has taken place with the Municipality, ward committees and some
government departments and service providers. At the moment, the Municipality is
awaiting the METF programmes of Government Departments, State Owned Enterprises,
and Other Stakeholders
Once the Municipal Projects for 2008/2009 have been confirmed, Performance
Management Output Indicators and Key Projects need to be confirmed.
Certain aspects within the 2008/2009 IDP Review would require workshopping, such as
the proposed Development Rationale: Focus Areas (see Section 17 of this report) and the
proposed Project Prioritization Model (see Section 21 of this report).
The draft Capital Budget needs to be finalized and accordingly reflected in the IDP
Review. Further, the Operational Budget also needs to be included in the IDP Review.
Both the Capital and Operational Budget needs to be aligned with the IDP�s Programmes,
Strategies, Objectives and Projects.
The Balanced Scorecards for 2007/2008 needs to be included in the final document
submitted to the Department. This needs to be linked to the IDP�s Programmes,
Strategies, Objectives and Projects.
The SDBIP and the Municipal Annual Report needs to be reviewed and included in the
final IDP Review 2008/2009 document.

Revision of the Mbonambi IDP 2008/2009:
Mbonambi Municipality
July 2008 139
J. ORGANISATIONAL PERFORMANCE
MANAGEMENT SYSTEM
1 PERFOMANCE MANAGEMENT SYSTEM: BALANCE
SCORECARDS
Ideally he IDP should focus on the Revision of the IDP and the Establishment of Balance
Scorecards. This is to ensure and to reflect that the Performance Management System that�s
being developed for the municipality is in line with the IDP in terms of its Vision, Mission,
Programmes, Sub-Programmes, Strategies, Objectives and Projects and its associated Key
Performance Indicators (KPIs).
The reflection of Balance Score sheets in the IDP could not be achieved. The reason for this
is that Balanced Score sheets for the coming financial year, i.e. 2008/2009 (which is also this
IDP Review�s applicable year), will only be in place by June 2008 (which is a requirement of
the MFMA). Since this draft IDP needs to be submitted to the KZN Department of Traditional
Affairs and Local Government prior to the aforementioned date, the Balanced Score sheets
are hence not reflected in this draft IDP Review. It will only be incorporated in this IDP
Review towards the end of June 2008.

The table below sets out the Mbonambi Municipality�s Performance Management System: Balanced Scorecard for the 2008/2009 Financial Year:
KPA OBJECTIVE KPI ACTIVITY PERFORMANC
E TARGET FREQUENCY BASELINE CHAMPION
Ba
sic
Se
rvic
e D
eli
ve
ry
1. To ensure that all
projects within the IDP
under MIG funding and
Project Consolidate are
implemented
Developed
Business Plan
for MIG
Funding
Develop the
Business Plans
for MIG projects
for the
municipality
7 projects
implemented
with MIG
funding by
30/06/09
Quarterly
The
Municipality
has a
project list
for all MIG
projects
MM & M:TS
2. To promote spatial
development and
appropriate land use
management.
Review
plans: LUMS
and Town
Planning
Scheme
Implement
LUMS and Town
Planning
Scheme
Review LUMS
30/06/09 Quarterly
LUMS &
SDF in place M:TS
3. To promote Integrated
Capital
Investment.
Developed
Integrated
Capital
Investment
Plan
Provide
information on
integration
process and
remedial
action to ensure
delivery
regarding the
Capital
Investment
Plan.
Integrated
Capital
Investment Plan
included in the
IDP by 30/06/09
Quarterly
Integrated
Capital
Investment
Plan in
place
MM

Revision of the Mbonambi IDP 2008/2009: Draft Report
Mbonambi Municipality
Inhloso Planning cc
June 2008
141
4. To ensure that all
municipal infrastructure is
properly maintained.
Revised
Service
Maintenance
Plan
Identify
municipal
infrastructure
that needs
maintenance,
provide budget
for maintenance
services and
implement the
plan.
Service
maintenance
plan revised by
30/03/09
Quarterly
Maintenanc
e schedule
is in
existence
M:TS
Revision of the Mbonambi IDP 2008/2009: Draft Report
Mbonambi Municipality
Inhloso Planning cc
June 2008
142
Mu
nic
ipa
l In
sti
tuti
on
al
De
ve
lop
me
nt
& T
ra
nsfo
rm
ati
on
1. To develop and ensure
relevancy of all posts are
in line with powers &
functions organogram of
the municipality
All posts in
line with
powers &
functions
Review of the
Organizational
Structure and
Job Descriptions
Reviewed
Organizational
Structure and
Reviewed Job
Descriptions
Quarterly
Revised
organization
al structure
M:CS
2. To improve productive
and accountable
staff through an effective
Municipal
Performance Management
System
Performance
Management
System and
SDBIP
developed
Develop PMS
Action Plan, with
KPA's,
Objectives and
performance
targets
PMS developed
and reviewed
for
implementation
by 30/06/09
Quarterly
PMS and
SDBIP is
being
reviewed
M: CS & MM
compile SDBIP
and submit it to
Council for
approval
SDBIP compiled
and submitted
within 14 days
after approval of
the Budget
Quarterly MM & CFO
3.To
review an HR Plan and
develop a staff retention
strategy and , incorporate
it into the
IDP
Review HR
Plan and
Develop Staff
Retention
Strategy
developed
Review the HR
Plan
HR Plan
developed
by30/06/09
Quarterly
Approved
by council
30/06/2008
M:CS
Revies the
Retention
Strategy
Retention
Strategy
reviewed by
30/06/09
Quarterly
Approved
by council
30/06/2008
M:CS
HR Plan and
Retention
Strategies of the
municipality
submitted for
approval to
Council
HR Plan and
Retention
Strategy
implemented
and approved
by 30/06/09
Quarterly
HR Plan &
Retention
strategy in
place
M:CS
4. To develop new and
review existing municipal
systems, policies and
Developed,
workshopped
and adopted
Develop new
and review
existing
90% of
municipal
systems, policies
Quarterly
Policies and
Procedures
reviewed
MM,MCS,MTS
& CFO
Revision of the Mbonambi IDP 2008/2009: Draft Report
Mbonambi Municipality
Inhloso Planning cc
June 2008
143
procedures municipal
systems
policies and
procedures
municipal
systems, policies
and procedures
and procedures
developed by
30/06/09
5. To Develop a policy on
youth,
gender and people with
disabilities.
Policy on
youth,
gender and
people with
disabilities in
place
Develop the
policy on youth,
gender and
people with
disabilities
Policy on youth,
gender and
people with
disabilities
Implemented
by30/06/09
Quarterly
Policy
approved
by Council
M:CS

Revision of the Mbonambi IDP 2008/2009: Draft Report
Mbonambi Municipality
Inhloso Planning cc
June 2008
144
So
cia
l &
Eco
no
mic
Deve
lop
me
nt
1. To strengthen the local
economy with particular
emphasis on
tourism,agriculture and
commercial development.
Developed
Tourism and
Agricultural
Strategy
Appoint service
provider to
develop the
Agriculture and
Tourism
strategies
Agriculture and
Tourism
Strategies
developed
by30/06/09
Quarterly
LED
strategy is
currently
being
developed
M:TS
Approve and
Implement the
Agriculture and
Tourism
strategies
Agriculture and
Tourism
Strategies
approved and
implemented by
30/06/2009
Quarterly
2. To Align advantages of
the analysis of the
competitive and
comparative of economic
sectors with ASGISA
Economic
Sector Plans
linked with
ASGISA
Align the Sector
Plans with
ASGISA
Sector plans
aligned with
ASGISA
Quarterly
Sector Plan
with
ASGISA in
place
M:TS
3. To promote socio-
economic development
and provide support to
assist
communities throughout
the Municipality to cope
with the combined impact
of
poverty and HIV/AIDS;.
HIV/AIDS
Awareness
Campaigns
Establish and
Launch AIDS
Council
AIDS Council
launched by
30/06/09
Quarterly
HIV/AIDS
Strategy in
place
M:CS
Ensure that the
HIV/AIDS
Awareness
Programme is
done combined
with 3 Amakhosi
Clusters
HIV/AIDS
Strategy
implemented
and adopted by
30/06/09
Quarterly M:CS
4. To Identify skills
shortages for
economy and
interventions, and
based on this develop
Skills
Development
in line with
ASGISA
Identify skills
shortages for
economy and
interventions.
Skills shortages
for economy
and
interventions
reviewed
Quarterly M:TS

Revision of the Mbonambi IDP 2008/2009: Draft Report
Mbonambi Municipality
Inhloso Planning cc
June 2008
145
skills
development strategy in
line
with ASGISA.
Develop a
strategy in line
with ASGISA.
Skills
development
Strategy in line
with ASGISA
Quarterly
Skills
developmen
t Strategy in
line with
ASGISA in
place
5. To cater for the
economic and social
development needs of
youth, women,
disabled & aged members
of
communities
Participation
Strategy
developed
Review
Procurement
Policy to
address SMME
development
Procurement
Policy that
incorporates
gender
sensitivity
developed and
implemented by
30/06/09
Quarterly
Procuremen
t Policy in
place
CFO & MM
Introduce a
procurement
policy which is
ring-fenced for
women, youth
and disabled
Quarterly CFO & MM
Ensure that
Municipal
Employment
Equity Plan is
gender sensitive
EE Plan
Reviewed and
implemented by
30/06/09
Quarterly
EE Plan to
be
submitted
to DOT
M: CS
Revision of the Mbonambi IDP 2008/2009: Draft Report
Mbonambi Municipality
Inhloso Planning cc
June 2008
146
Fin
an
cia
l M
an
ag
em
en
t
1. To ensure that the budget is
aligned with the IDP.
100% of LED
budget spent on
projects
identified in the
IDP.
Develop a 5 year
financial plan.
100% of LED
budget spent on
IDP projects.
Quarterly
Report on
budget
expenditur
e to date
CFO
Adopted
Financial Plan
Financial Plan
adopted as per
legislative
requirement by
15/03/09
Quarterly
Financial
Plan in
place.
CFO
2. Implementation of the
revenue
management and billing plan
with clear time frames and
also
to reflect the financial
management plan.
Three year
financial plan
developed as
well as adopted
Financial
Management
Systems,
policies and
procedures
Developed three
year plan, policies
and procedures
80% Policies
having been
developed by
30/06/09
Quarterly Policies in
place CFO
3. To ensure that the
municipality is financially viable
by consolidating debt
management processes.
Reduction of
book debtors to
a maximum of
90 days.
Implementing
debt coverage
plan.
60% reduction
of debtors to a
maximum of 90
days by
30/06/09
Quarterly
Debt
coverage
plan in
place
CFO

Revision of the Mbonambi IDP 2008/2009: Draft Report
Mbonambi Municipality
Inhloso Planning cc
June 2008
147
Go
od
Go
ve
rn
an
ce
& C
om
mu
nit
y P
arti
cip
ati
on
1. To promote active
participation of all political role
players
Attendance of
all official
meetings:
Minutes of all
official meetings
Attend official
council meetings
80% attendance
of all official
council and
committee
meetings
Quarterly
Attendanc
e
Registers
and
apologies
forms in
place
MCS
2. To review the Municipality�s
IDP in accordance with the
requirements of the Municipal
Systems Act 2000
Adoption of
reviewed
document
Review of the IDP Adoption of IDP
reviewed Quarterly
Last year's
IDP in
existence
and needs
to be
reviewed
MM &
M:TS
3. To facilitate community
development and involvement
in all aspects of local
governance.
IDP Road Shows
Conduct road
shows in all
municipal wards
and 3 Izimbizos
and Submit
reports to full
Council
IDP road shows
conducted
annually and
Izimbizos
conducted 3
times in a year
Quarterly
Road
Shows are
conducted
quarterly
MM &
M:TS
4.To ensure the existing of the
Community participation
Programme
Reports on 3
Izimbizos
Ensure that 3
izimbizos are held
to Mhlana,
Sokhulu and
Mthethwa
Clusters
Submitted
reports on
izimbizos
Quarterly
iZimbizo's
finalized,
report to
Council
MM

Revision of the Mbonambi IDP 2008/2009: Draft Report
Mbonambi Municipality
Inhloso Planning cc
June 2008
148
K. APPENDICES
1 LOCAL ECONOMIC DEVELOPMENT PLAN
In 2006 Mbonambi Municipality finalized it�s a Local Economic Development Plan.
The report identifies economic opportunities in line with strategic considerations and thereafter projects are prioritized. From the development
principles listed below it is clear that tourism is identified as one of the key economic sectors in the Municipal area:
- Tourism should be private sector driven.
- Tourism must be used as a development instrument for the empowerment of previously disadvantaged people.
- Tourism should support the economic, social, and environmental goals of the Municipality.
- Municipalities should provide an enabling environment for all types of businesses.
- The municipality does have the hospitality resources for tourism and this should encourage people to develop bed and breakfast
establishments.
- The municipality should establish a Tourism Committee and the people serving in the said committee should be committed to the
promotion of tourism. Fluency in English would be a definite advantage.
- Opportunities relating to the Informal Sector should be identified and a conducive environment should be created by the Municipality
for the development of this sector.
The table overleaf indicates the prioritized projects.

Revision of the Mbonambi IDP 2008/2009:
Mbonambi Municipality
July 2008 149
Table 45: Prioritized LED Projects
Sector
Goal Project Implementation Plan
Agriculture To provide job opportunities for the local
people of Mbonambi, and to improve the
economy of Mbonambi, and combat the small
non-continual projects which promise to
alleviate poverty while they are not
sustainable. To develop local skill base and
keep project finances circulating in the local
economy.
Vegetable
Production
(Proposed)
The vegetable projects can establish a co-operative
that will supply local wholesalers, shops, hospitals
and schools. From the survey conducted with these
potential clients of cooperative, we find that they are
ready to buy from them provided the quality products
is good and there is constant supply.
Poultry
(Proposed)
From the findings of the study it was discovered that
poultry could be viable in Mbonambi if it could be well
managed by people who have good knowledge about
the project and capacity to maintain the supply.
Manufacturing To provide job opportunities of the local
people of Mbonambi, and to improve the
economy of Mbonambi
Sewing The sewing projects can become more established
and become a clothing firm within Mbonambi which
provides chain stores with the top of the range
clothing and can also supply schools with school
wear. There is also an opportunity of supplying local
hospitals and clinics with bed sheets, pillowcases and
curtains if they form a co-operative. With proper
training in sewing, fashion design, and marketing,
this co-operative / clothing firm can be one of the
most successful businesses within Mbonambi.
Tourism: Craft To provide job opportunities of the local
people of Mbonambi, and to improve the
economy of Mbonambi Tourism alone cannot
provide the full impetus needed to alleviate
poverty and unsustainable pressures on the
natural resources at Mbonambi, but it can
provide a catalyst for socio-economic
development.
Mbonambi
Craft
Emporium
Project
Cultural Village
A craft emporium project has potential in Mbonambi
area if local crafters are provided with necessary
support i.e. equipment, proper material and
establishment of a craft centre to accommodate
them. This project is currently non-existent, but it
could improve the economy of Mbonambi and also
create jobs for the unemployed.

Revision of the Mbonambi IDP 2008/2009:
Mbonambi Municipality
July 2008 150
2 DISASTER MANAGEMENT PLAN
2.1 DISASTER RISK MANAGEMENT PLAN
To comply with the Disaster Management Act each municipality should develop
risk reduction plans. The risks that have to be addressed should be identified
based on historic, current as well forecasted information and through
consultation with the municipality, stakeholders and the community. The risks
should be prioritized by looking at the vulnerability and the capacity to cope with
an incident as well as the likelihood and severity of such and event. The outputs
of the risk reduction planning process are project orientated and should be
integrated into municipal IDP.
2.2 OBJECTIVE
The objectives of the risk reduction plans are to identify projects to reduce the
vulnerability of the community and increase the current capacity to ultimately
reduce the risk of a disaster. These projects should be budgeted for and
subsequently implemented in the municipality.
2.3 PURPOSE
The purpose of this document is to submit to the Mbonambi Municipal I.D.P.
Forum, the Disaster Management Sector Plan of the municipality for
consideration as possible Risk Reduction projects.
2.4 BACKGROUND
Mbonambi Municipality shares a common boundary to the south with Umhlathuze
Municipality which is the industrial hub of the Uthungulu District Municipality.
The N2 National Road cuts through the centre of the Mbonambi Municipal area of
responsibility, and is the main route for the transportation of both export and
import goods between Johannesburg and the Richards Bay Harbor.
The N2 also serves as the main access route to the vast tourism industry of
Uthungulu District and Umkhanyakude District to the North of Mbonambi.

Revision of the Mbonambi IDP 2008/2009:
Mbonambi Municipality
July 2008 151
2.5 RISK REDUCTION PROJECTS IDENTIFIED BY DISASTER
MANAGEMENT
There are two prime areas of concern from a Disaster Management point of view:
3.5.1 High Density Informal Settlements
The high density informal settlements have been established in Wards 5 and 6 at
Mzingazi and Nzalabantu. There are approximately 10,000 people occupying
informal types� houses in these two settlements. The occupants of these two
settlements are primarily migrant laborers from other parts of South Africa who
are either employed or are seeking employment in the Industrial Sites of
Richards Bay.
There is a serious Fire Hazard in both settlements, especially during the winter
months, however, irrespective of the fact that the Mbonambi Municipality does
have a Fire Brigade service, the lack of infrastructure in these settlements makes
it almost impossible for the vehicles of the Fire Services to gain effective access
to most of the structures. The lack of infrastructure and services creates an
environment that is an extreme health hazard.
The development of a Low Cost Housing project in the area, together with the
provision of the required infrastructure and services (roads, sewerage and water)
recommended. This will serve to reduce the threat to the communities who are
presently at risk.
3.5.2 High Frequency of Roads Accidents
High frequency of road accidents at the intersection of the N2 and the P 495 has
been observed. This intersection which is the main entrance, from the N2, into
the town of Kwambonambi is renowned for the high rate of horrific motor
accidents that have claimed several lives over recent times. The intersection is
controlled by standard Stop Signs on the P 495 and by Speed Limit Signs on the
N2. Although Speed Limits have been imposed and Law Enforcement is
periodically carried out, the high rate of accidents have not been reduced or
affected. The three main causal factors of the accidents are: speed, visibility and
pedestrians
The following are recommended to reduce the high frequency of road accidents:
- Traffic calming � Rumble strips and effective Speed Bumps should be
installed on the N2 over a sufficient distance on both sides of the
intersection to force speed control;
- The installation of effective street lighting would enhance visibility.
Further,sufficient Flashing Lights should be installed to warn motorists
on the N2 of speed limits, dangerous intersections and traffic control;
- The building of a pedestrian bride over the N2 would dramatically reduce
the number of accidents;

Revision of the Mbonambi IDP 2008/2009:
Mbonambi Municipality
July 2008 152
- The installation of permanent Speed Control Cameras would enhance
Law Enforcement as well as act as a speed deterrent.
3 LOCAL ECONOMIC DEVELOPMENT PLAN
The Municipality has finalized its Housing Development Plan and through the process, a
number of housing developments have been identified. The document identified housing
backlog in terms of slum clearance; rural housing backlog as well as families residing in living
quarters. All these combined, it was concluded that housing backlog in the Municipal area is
at 7, 502. At the moment; only two housing projects were approved by the Department of
Housing with four in packaging phase and five more in initiation phase.
In order to develop a roll out plan for housing in the area, feasibility of projects, areas of
greatest need based on slums clearance, economic factors and finally the service backlogs
based on rural housing project needed to be determined. This resulted in a five year roll-out
programme as shown in the table overleaf:
It should be noted, whilst not included in the report, that it is the municipality�s intention to,
at a minimum level, provide 1,000 houses in each municipal ward, i.e. 13,000 housing units.

Revision of the Mbonambi IDP 2008/2009:
Mbonambi Municipality
July 2008
153

Revision of the Mbonambi IDP 2008/2009:
Mbonambi Municipality
July 2008 154
L. ANNEXURES
Document Available Status
L.1 Land Use Management System Yes In
preparation
L.2 Spatial Development Framework Yes Completed
L.3 Housing Plan Yes Completed
L.4 Disaster Management Plan Yes Under Review
L.5 Local Economic Development Plan Yes Completed
L.6 Municipal Roads Operation Program Yes Completed
L.7 Waste Management Plan Yes To be
reviewed
L.8 Human Resources Plan Yes Completed
L.9 Employment Equity Plan Yes Completed
L.10 Children�s Rights Policy Yes Completed
L.11 Gender Policy Yes Completed
L.12 HIV /AIDS Policy Yes Completed
L.13 Policy for People living with Disability Yes Completed
L.14 Communication Plan
Yes Draft
Completed
L.15 Indigent Policy Yes Draft policy in
place
L.16 Coastal Zone Management Plan No Rely on the
District Plan
L.17 HIV/AIDS Strategic Plan No
L.18 Youth Policy No
L.19 Marketing Strategy No
L.20 Crime Prevention Strategy No
L.21 Municipal Community Facilities Plan No
L.22 Community Participation Strategy No
L.23 A. Water Service Development Plan (all
WSAs)
No District
Function

Revision of the Mbonambi IDP 2008/2009:
Mbonambi Municipality
July 2008 155
LAND USE MANAGEMENT SYSTEM

Revision of the Mbonambi IDP 2008/2009:
Mbonambi Municipality
July 2008 156
WASTE MANAGEMENT PLAN

Revision of the Mbonambi IDP 2008/2009:
Mbonambi Municipality
July 2008 157
HIV/AIDS POLICY
Revision of the Mbonambi IDP 2008/2009:
Mbonambi Municipality
July 2008 158
MUNICIPAL HOUSING PLAN

Revision of the Mbonambi IDP 2008/2009:
Mbonambi Municipality
July 2008 159
LOCAL ECONOMIC DEVELOPMENT STRATEGY

Revision of the Mbonambi IDP 2008/2009:
Mbonambi Municipality
July 2008 160
SPATIAL DEVELOPMENT FRAMEWORK

Revision of the Mbonambi IDP 2008/2009:
Mbonambi Municipality
July 2008 161
DISASTER MANAGEMENT PLAN

Revision of the Mbonambi IDP 2008/2009:
Mbonambi Municipality
July 2008 162
GENDER POLICY

Revision of the Mbonambi IDP 2008/2009:
Mbonambi Municipality
July 2008 163
CHILDREN�S POLICY

Revision of the Mbonambi IDP 2008/2009:
Mbonambi Municipality
July 2008 164
COMMUNICATION PLAN

Revision of the Mbonambi IDP 2008/2009:
Mbonambi Municipality
July 2008 165
POLICY FOR PEOPLE WITH DISABILITIES

Revision of the Mbonambi IDP 2008/2009:
Mbonambi Municipality
July 2008 166
RURAL ROADS OPERATION PLAN

Revision of the Mbonambi IDP 2008/2009:
Mbonambi Municipality
July 2008 167
INDIGENT POLICY

Revision of the Mbonambi IDP 2008/2009:
Mbonambi Municipality
July 2008 168
HUMAN RESOURCES PLAN

Revision of the Mbonambi IDP 2008/2009:
Mbonambi Municipality
July 2008 169
EMPLOYMENT EQUITY PLAN
Top Related