


Languages
Pages
Legal

1
FEEDBACK STRUCTURE OF CLIFF AND SHORE PLATFORM MORPHODYNAMICS
ABSTRACT
It has been suggested that studies of geomorphological systems should identify potential system feedbacks,
determine their direction of influence, and assess their relative importance. In this paper we show how a core set
of processes and feedback loops can be distilled from existing literature on rock coast morphodynamics. The
structure has been represented using Causal Loop Diagrams and a methodology to estimate the strength of a
single feedback loop is presented. The backwearing erosion rate (cliff horizontal erosion) has been found to be
controlled by at least four feedback loops; three balancing (cliff toe wave energy depletion, ground-water pore
pressure diminution and cliff deposit protection) and one positive loop (abrasion enhancement). The
downwearing erosion rate (vertical erosion) has been found to be controlled by at least three balancing feedback
loops (weathering limited, shear depletion, cover-protection). Mean sea level directly influences the
downwearing rate, through the water depth relative to the wave base, and indirectly influences the backwearing
erosion rate through the wave energy dissipation that determines the amount of energy reaching the cliff toe.
The offshore wave non-linearity parameter is proposed to capture the complex interaction between waves and
shore platform geometries. The strength of the cliff toe energy depletion loop is assessed by reasoning on its
causal pathway and found to be O(-10-10
to -10-4
) for poorly lithified rock coasts. By understanding how the
individual and overall feedback strengths are influenced by different future environmental and human
intervention scenarios we could provide better assessment at the time scales needed for coastal management.
Keywords: framework, causality analysis, causal loops diagrams, feedback factor
2
1 INTRODUCTION
Stakeholders worldwide need to anticipate how shorelines will respond to accelerated sea level rise at time
scales as large as 50yrs to 100yrs. As coastal evolution models for rocky coasts become increasingly complex, it
is important to have a basic theoretical framework of how different processes interact with each other and
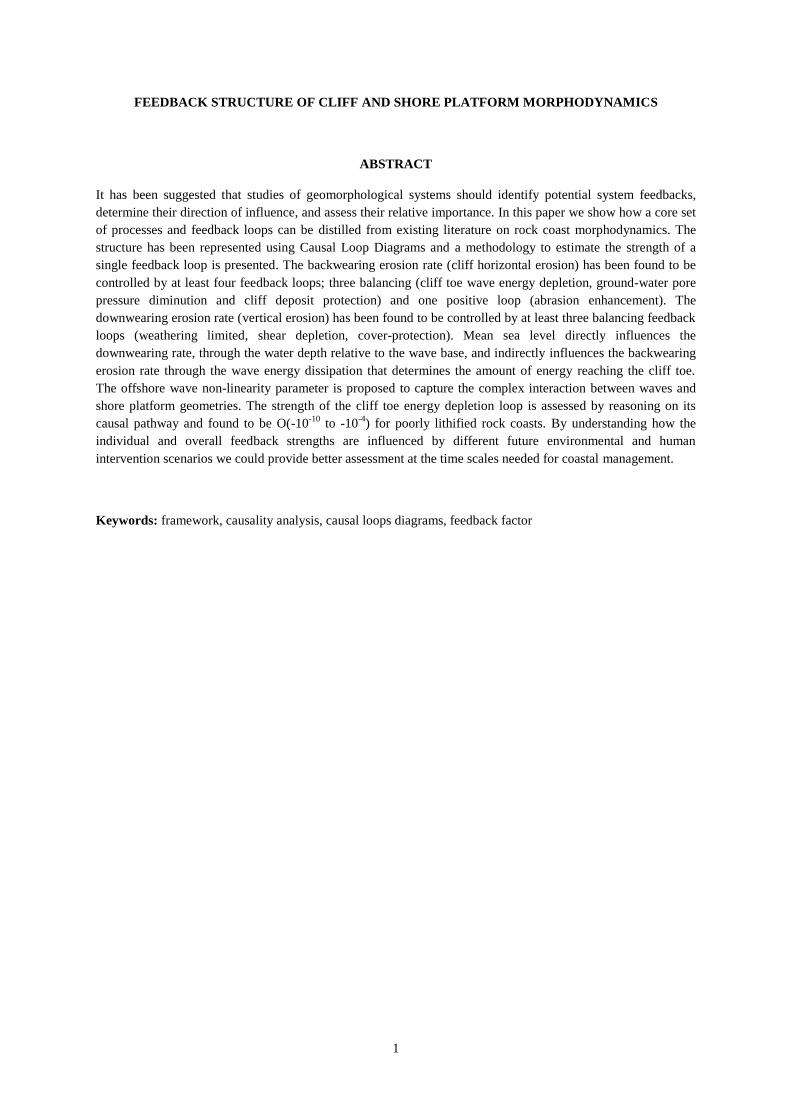
influence the changes and responses to interventions at different stages of development. Ashton et al. (2011)
have provided a general theoretical framework for the response of a wide range of cliffed rocky shores to sea
level rise by studying equilibrium conditions, and normalizing posterior recession rate and sea-level rise with
prior conditions (see Figure 1). They noted that the general type of response to sea-level rise will be determined
by the coast type, environmental drivers, and dominant processes, such as sediment flux, wave-driven erosion,
and weathering dominated systems in which exposure time is crucial. They concluded that the most common
behaviour of cliffed coasts is likely to be that of a ‘damped system’ in where negative feedbacks reduce the rate
of cliff recession as shore profiles are exposed to waves over time. However, this response characterises
equilibrium conditions, whereas at decadal timescales cliffed coasts will be responding to sea-level rise in ways
that are far from equilibrium. Hence, further work is needed to characterize the transient stage to improve the
information available to coastal managers. Here we use the Causal Loop approach as a structured means of
synthesising knowledge of processes to reason about long term geomorphic development.
Figure 1.- The response of rocky coastal systems to sea level change will depend on the main processes involved and
the rate of sea level rise Panels 1 to 11 shown different types of rock coasts around UK: (1-3) cliffs fronted by shore
platforms of varied width; (4) extensive shore platform; (5) cliff fronted by sandy beach and shore platform; (6)
sandy beach between cliffed headlands; (7) chalk cliff fronted by shore platform; (8) cliff fronted by small beach and
shore platform; (9) cliff fronted by sandy beach; (10) landslide complex fronted by mixed sand/gravel beach; (11) clay
cliff fronted by sandy beach and unconsolidated shore platform. Four different responses proposed by Ashton et al.,
(2011)(right), where ε1/ε2 and S1/S2 are the ratios of future and prior recession rates and sea level rise respectively.
The rate of cliff retreat will depend not only on the absolute sea level change, but also the rate of sea level change and
dominant coastal processes. Figure modified from (Masselink and Russell 2010).

3
To identify the likely response of cliffed coasts to sea-level rise during the transient stage there is a need to
understand which processes are dominant. Feedback process analysis is a valuable tool in this respect. Phillips
(2009) proposed ‘4Rs’ (recursion, response, resilience, resistance) as a theoretical framework to understand
change in geomorphic systems by identifying potential feedbacks, determining their signs, and assessing their
relative importance. Lane (2013), by analogy with lessons learned from climate modelling, argued that in
geomorphology there is the need for a great number of feedbacks to be identified and appreciated. Since the
comprehensive review of Stephenson (2000) more effort has been dedicated to understanding shore platform
dynamics. As a result, while linking processes at different scales with cliff and platform erosion is still a field of
active research, it is now possible to identify a key set of feedback processes from existing literature (Naylor et
al. 2010), which are formalized and expanded upon in this paper.
In this paper a causal loop analysis is proposed to (1) describe the overall feedback structure that controls the
cliff and shore platform system, and (2) provide a methodology for the assessment of the strength of a given
feedback loop. First, the feedback structure is derived from pre-existing literature on the dynamics of rocky
coasts, whether strongly or poorly lithified. The causal loop diagram (CLD) convention is used to represent the
loop structure. This provides an evidence-linked map of our current process understanding and remaining
knowledge gaps. In the second part of the paper, we investigate the strength of the feedback loop between
platform widening and cliff-backwearing by reasoning on the processes involved in the loop. This provides a
worked example of how the feedback framework can be used both as a conceptualization tool, and also to assess
how improved process understanding might be translated in better informed coastal management.
2 METHODOLOGY
2.1 Causal loop analysis
The feedback structure of cliff dynamics is distilled from the literature and represented using CLD convention
(Lane 2000). In this paper the main processes related to shore platform rates of erosion (see Figure 2) are
synthesized. Erosion is understood in broader terms as the decrease of consolidated shore platform and cliff
mass (i.e. sub aerial or submerged) as talus, beach material, or suspended sediment. To simplify the problem
space, and retain consistency with the literature, erosion is described in its horizontal (backwearing) and vertical
(downwearing) components. Shore platform width and slope are emergent properties of an eroding rocky coastal
system. Both sub-aerial weathering and erosive marine process may be important, the relative efficacy of which
depends on various local factors (Trenhaile 2008).
Figure 2.- Decrease of cliff and shore platform mass is expressed as backwearing and downwearing rates which are
understood as measurable components of the overall erosion. Cliff failure might be either induced by wave
4
undercutting (toppling) or shear-induced (landsliding). Both failures contribute to overall erosion through the
backwearing erosion rate.
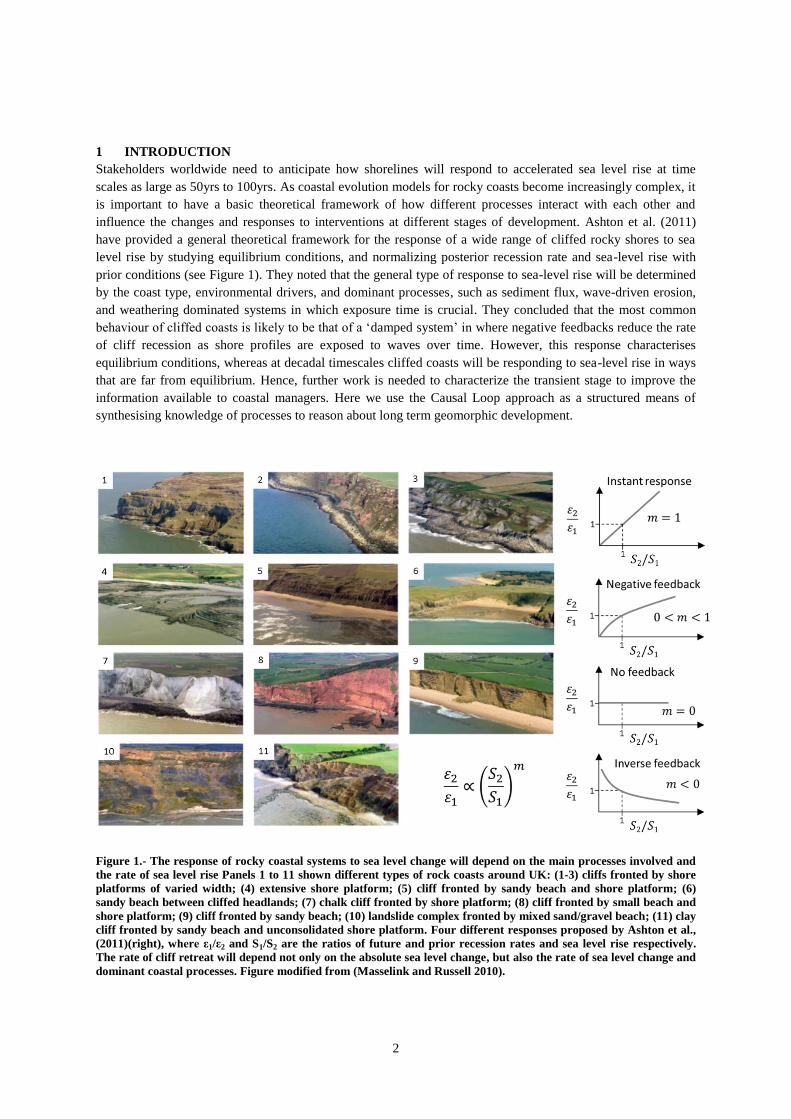
The symbolic convention used in this review is presented in Figure 3. For the sake of clarity, a minimal set of
symbols is used to capture causality and feedback loop structure. These include:
Two types of variables: (1) state variables (stocks, levels, attributes) (e.g., beach width, sea level,
sediment size, threshold wind velocity for initiating sediment transport), (2) rate variables (flows) (e.g.
rate of shoreline change, sediment transport rate).
Positive (+), negative (-) or influence (+/-) links. Links connect two variables (e.g. XY) and
represent the answer to the question if X increases, would this cause Y to increase or decrease? Links
are positive if dy/dx > 0 or negative if dy/dx<0. When the answer to this question is unknown or
ambiguous it is represented as an influence link.
Causal pathways. We can reason about the influence of one variable on another variable indirectly
connected to it by examining the signs along their causal pathway (e.g., two negatives, whether
adjacent or not, will act to reverse each other). Loops in a causal loop diagram indicate feedback in the
system being represented. In this case, changes cascade through other factors so as to either amplify
(reinforcing feedback; products of signs positive) or damp the original change (balancing feedback;
products of signs negative).
Figure 3.- Convention used to represent the causal loop diagrams in this paper. (a) Symbol convention and (b)
example with two positive and one negative feedback loop. In this example, the behaviour of state variable X2 will
depend on the strength of the positive feedback loop with p1 and the negative feedback loop with p2.
2.2 Feedback factor assessment
The concept of feedbacks has proved helpful in the idealized model domain, but extrapolation to the real world
is complicated. For example in the area of climate modelling Klocke et al. (2013) provides a review of different
metrics for physical climate feedbacks and strength assessment methods. The assessment of the feedback
strength involves the assessment of partial derivatives between pair-wise linked variables. In climate modelling,

5
partial derivatives can hardly be obtained from observations, due to many interfering processes that are difficult
to separate from the background variability and also difficult to isolate in a model. In geomorphology examples
of qualitative stability assessment of the system based on the feedback loop structure go back to at least the early
1980s (Phillips 2006; Slingerland 1981). The stability of the system (or conditions under which it is stable) can
be determined if historical reconstructions or field observations, identify the key system components and the
positive, negligible, or negative links between them. This often takes the form of a signed digraph, network
model, or box-and-arrow diagram. These can be translated into an interaction matrix, and the stability may be
determined based only on the qualitative (+, -, 0) links.
In absence of feedback, the total change in the state variable is just the initial change (Total effect = Direct
Effect). If there is a feedback process then, with one pass around the feedback loop, the direct effect will be
enhanced or damped by a feedback factor g such that Total Effect = Direct Effect+(g)(Direct Effect). If g is
positive, then the feedback is reinforcing the initial disturbance, whereas if g is negative, the feedback tends to
reduce (balance) the initial change. In practice, there will be infinitely many passes around the feedback loop,
and each leads to another factor of g multiplying the input: Total Effect = (Direct Effect)(1+g+g2+g
3+⋯) =
(Direct Effect)/(1-g) if g<1 (Harte 2001). Given a dynamic model that incorporates a feedback mechanism, and
assuming that either the state equation F is linear or the incremental change is small relative to the unperturbed
value, the overall feedback factor g can be calculated as the summation of the partial feedback factors of each
loop as shown in Figure 4, where X is a variable whose state depends on a set of variables pi. This functional
relationship is given by F. For the example shown, X is controlled by two feedback loops (g1, reinforcing and g2
balancing) and the direct effect of another variable (p4). Since p4 has only a direct effect on X, it does affect the
change of X but not the overall feedback strength, g. The overall feedback factor can be estimated as a linear
addition of the feedback factor for the i-nth feedback loop, gi.
Figure 4.- Causal Loop Diagrams provide a formal framework to assess the relative and absolute strength of
feedback loops on a given state variable. A reinforcing and balancing loop influencing the state variable X is shown in
a. The relative strength of the feedback loops is represented by g1, and g2. The overall feedback strength can be
estimated as the sum of these two feedbacks as shown in b. The total effect of a change given change in X is inversely
related to the overall feedback factor strength.
6
3 RESULTS
3.1 Feedback loop structure of cliff dynamics
From the literature reviewed, the main processes and feedback loops that determine cliff erosion and shore
platform evolution are summarized below. How each of these processes is represented using CLDs is first
individually presented (see Figure 5, Figure 6) and at the end of the section collapsed into an overall feedback
loop structure (see Figure 7).
The main processes and feedback loops considered are:
Lithology, mechanical strength, discontinuities. Backwearing and downwearing erosion rates are
influenced by rock resistance, which depends on rock lithology, mechanical strength, and the presence
of discontinuities (Naylor and Stephenson 2010; Sunamura 1994)
Shear depletion loop. Wave energy dissipation on a shore platform is mostly controlled by the water
depth (Thornton and Guza 1982). An increase in the water depth due to downwearing, reduces the
energy dissipation rate and therefore the downwearing erosion rate. A change on the energy dissipation
rate over the platform indirectly influences the energy reaching the cliff toe.
Cliff toe energy depletion. Backwearing of the cliff toe precludes further erosion by widening the shore
platform that dissipates energy more effectively.
Feedback between wetting-drying cycles and platform downwear. Higher numbers of wetting and
drying cycles on platform surfaces have been linked to increased downwearing rates (Stephenson and
Kirk 2000). With other factors held constant, a vertically eroding platform increases its water depth,
which reduces the number of wet-dry cycles, balancing back the erosion rate.
Cover protection loop. Fine sediment eroded from the cliff and platform may be removed from the
system as suspended sediment, whereas beach-grade sediment may be deposited at the cliff toe. Beach
sediments might impede direct wave attack, reducing backwearing rates, and cover the shore platform
reducing downwearing rates (Castedo et al. 2012; Trenhaile 2005; Walkden and Hall 2005).
Abrasion enhancement loop. Beach material may also increase the abrasive capacity of the incoming
waves, both at the cliff toe (Robinson 1977; Trenhaile 2005) increasing the backwearing rate, and also
on the platform surface increasing the downwearing rate (Walkden and Hall, 2005).
Feedback loop between pore pressure release and backwearing erosion rate. The build-up and release
of pore pressure has been identified (measured and modelled) as a balancing feedback of backwearing
rate (Castedo et al. 2012; Fort et al. 2000). The associated zone of depressed pore pressure to cliff
backwearing prevents the pore pressure build-up over time.

7
Figure 5.- Initial conceptualization of the feedback structure of cliff and shore platform evolution. Panel (a) shows the
three main types of shore platform after Sunamura (1992). Platform width is represented for the sloping and near
horizontal platforms. Panel (b) shows the feedback structure. The influence of lithology, fatigue and discontinuities
on the erosion rates is acknowledged with a dashed line arrow (influence link) to illustrate that these factors have
some influence, but their sign (positive or negative) is not shown.
Figure 5 represents an initial subset of the processes that have been identified from existing literature. By
definition, an increase of both backwearing and downwearing erosion rates decreases the cliff and shore
platform mass content and is therefore represented as a negative influence link. To avoid cluttering the diagram,
the influence of lithology, mechanical strength and discontinuities on the erosion rates is acknowledged as an
influence link (dashed line), but their sign (positive or negative) is not shown in the diagram. This implies that,
well-known processes such as fatigue due to temperature (frost/defrost cycles) are not explicitly represented in
the diagram but implicitly included within this influence link. Platform downwearing due to weathering can be
accomplished by a variety of mechanisms, but the general efficacy of platform-weathering processes is often
modulated by tidal wetting and drying cycles (Trenhaile 2005). This is represented as a positive link between
intertidal exposure time and weathering rate. Downwearing of the intertidal platform, in the absence of abrasive
material and bioerosional organisms, has been attributed generally to weathering and removal of the fine-
grained debris by waves (Porter et al. 2010). Most of the mechanical downwearing of the submerged platform is
due to breaking waves, the downwearing erosion rate has been often conceptualized as a decaying function of
water depth (Sunamura 1992; Trenhaile 2005). Since the exponential decay with depth is controlled by the wave
energy dissipation rate, the influence of wave breaking is represented as a positive link between wave energy
dissipation rate and downwearing. An increase in the energy reaching the cliff toe increases the backwearing
rate (positive influence) by increasing undercutting. The influence of the debris at the toe of the cliff on the
backwearing erosion rate is lately included within the overall feedback loop structure. The rainfall accumulated
as groundwater increases the pore pressure eventually triggering the shear failure of the cliff (Castedo et al.
2012). Fort et al. (2000) found that the associated unloading resulted in a zone of the depressed pore pressures
which temporarily prevent deep-seated instability of the over-steepened cliff. This is represented as negative
link between backwearing and pore pressure resulting in a balanced loop between backwearing erosion rate and
pore pressure. The backwearing erosion rate is balanced back by widening the platform. Platform width is
understood as the horizontal distance between the cliff toe and the sea edge at which offshore waves start to be
transformed by interaction with the bottom. Given that the wave energy at the gravity band frequency decreases
shoreward from the platform sea edge (Sunamura 1992) an increase of platform width will have a negative
influence in the energy reaching the cliff toe. The cliff toe energy depletion loop is further explained in the next
section.
8
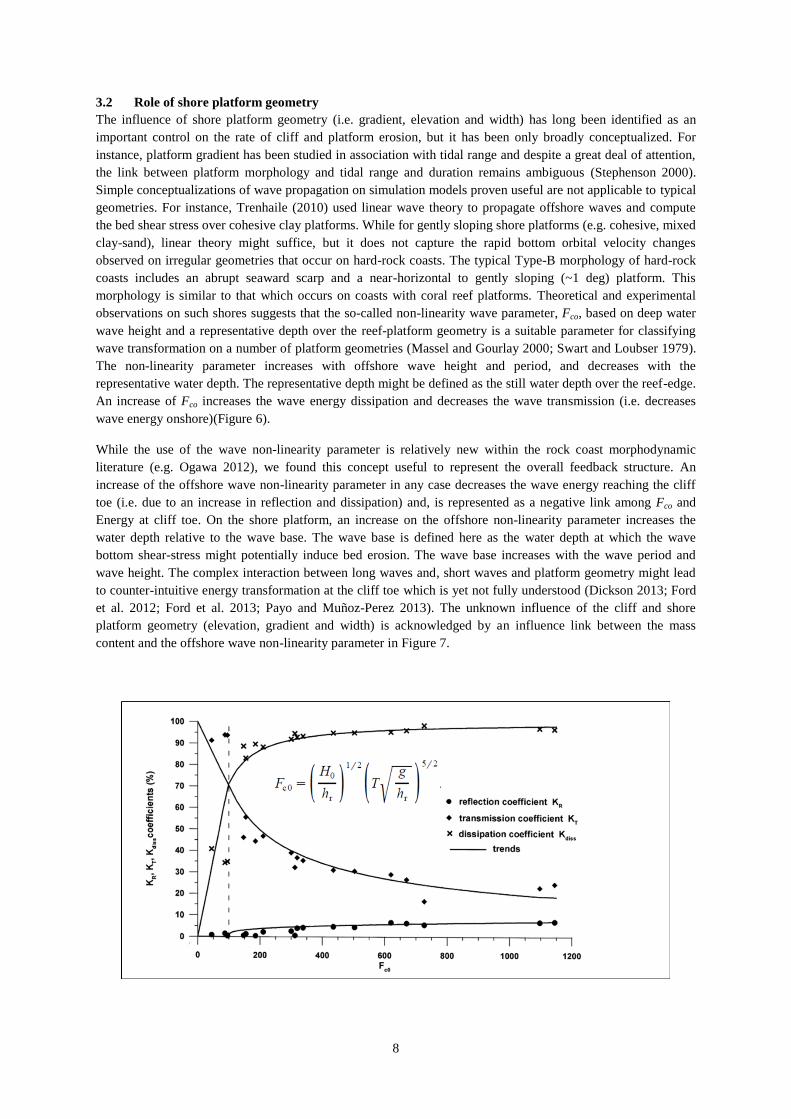
3.2 Role of shore platform geometry
The influence of shore platform geometry (i.e. gradient, elevation and width) has long been identified as an
important control on the rate of cliff and platform erosion, but it has been only broadly conceptualized. For
instance, platform gradient has been studied in association with tidal range and despite a great deal of attention,
the link between platform morphology and tidal range and duration remains ambiguous (Stephenson 2000).
Simple conceptualizations of wave propagation on simulation models proven useful are not applicable to typical
geometries. For instance, Trenhaile (2010) used linear wave theory to propagate offshore waves and compute
the bed shear stress over cohesive clay platforms. While for gently sloping shore platforms (e.g. cohesive, mixed
clay-sand), linear theory might suffice, but it does not capture the rapid bottom orbital velocity changes
observed on irregular geometries that occur on hard-rock coasts. The typical Type-B morphology of hard-rock
coasts includes an abrupt seaward scarp and a near-horizontal to gently sloping (~1 deg) platform. This
morphology is similar to that which occurs on coasts with coral reef platforms. Theoretical and experimental
observations on such shores suggests that the so-called non-linearity wave parameter, Fco, based on deep water
wave height and a representative depth over the reef-platform geometry is a suitable parameter for classifying
wave transformation on a number of platform geometries (Massel and Gourlay 2000; Swart and Loubser 1979).
The non-linearity parameter increases with offshore wave height and period, and decreases with the
representative water depth. The representative depth might be defined as the still water depth over the reef-edge.
An increase of Fco increases the wave energy dissipation and decreases the wave transmission (i.e. decreases
wave energy onshore)(Figure 6).
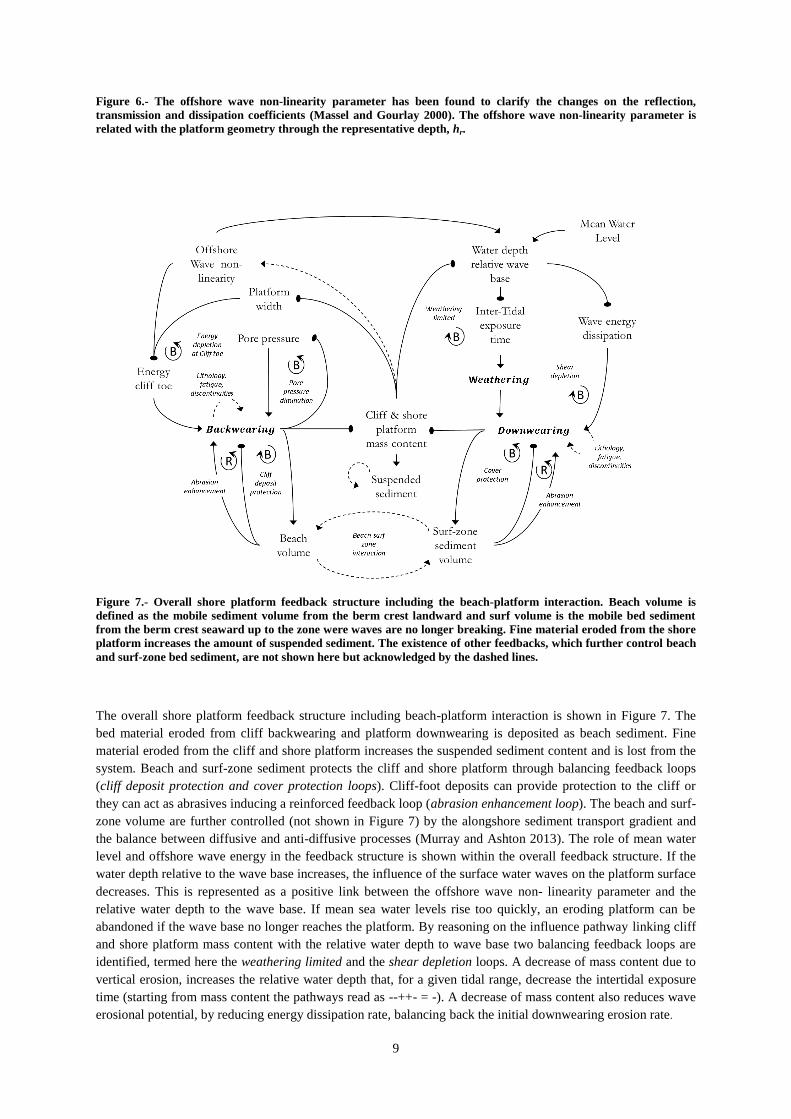
While the use of the wave non-linearity parameter is relatively new within the rock coast morphodynamic
literature (e.g. Ogawa 2012), we found this concept useful to represent the overall feedback structure. An
increase of the offshore wave non-linearity parameter in any case decreases the wave energy reaching the cliff
toe (i.e. due to an increase in reflection and dissipation) and, is represented as a negative link among Fco and
Energy at cliff toe. On the shore platform, an increase on the offshore non-linearity parameter increases the
water depth relative to the wave base. The wave base is defined here as the water depth at which the wave
bottom shear-stress might potentially induce bed erosion. The wave base increases with the wave period and
wave height. The complex interaction between long waves and, short waves and platform geometry might lead
to counter-intuitive energy transformation at the cliff toe which is yet not fully understood (Dickson 2013; Ford
et al. 2012; Ford et al. 2013; Payo and Muñoz-Perez 2013). The unknown influence of the cliff and shore
platform geometry (elevation, gradient and width) is acknowledged by an influence link between the mass
content and the offshore wave non-linearity parameter in Figure 7.
9
Figure 6.- The offshore wave non-linearity parameter has been found to clarify the changes on the reflection,
transmission and dissipation coefficients (Massel and Gourlay 2000). The offshore wave non-linearity parameter is
related with the platform geometry through the representative depth, hr.
Figure 7.- Overall shore platform feedback structure including the beach-platform interaction. Beach volume is
defined as the mobile sediment volume from the berm crest landward and surf volume is the mobile bed sediment
from the berm crest seaward up to the zone were waves are no longer breaking. Fine material eroded from the shore
platform increases the amount of suspended sediment. The existence of other feedbacks, which further control beach
and surf-zone bed sediment, are not shown here but acknowledged by the dashed lines.
The overall shore platform feedback structure including beach-platform interaction is shown in Figure 7. The
bed material eroded from cliff backwearing and platform downwearing is deposited as beach sediment. Fine
material eroded from the cliff and shore platform increases the suspended sediment content and is lost from the
system. Beach and surf-zone sediment protects the cliff and shore platform through balancing feedback loops
(cliff deposit protection and cover protection loops). Cliff-foot deposits can provide protection to the cliff or
they can act as abrasives inducing a reinforced feedback loop (abrasion enhancement loop). The beach and surf-
zone volume are further controlled (not shown in Figure 7) by the alongshore sediment transport gradient and
the balance between diffusive and anti-diffusive processes (Murray and Ashton 2013). The role of mean water
level and offshore wave energy in the feedback structure is shown within the overall feedback structure. If the
water depth relative to the wave base increases, the influence of the surface water waves on the platform surface
decreases. This is represented as a positive link between the offshore wave non- linearity parameter and the
relative water depth to the wave base. If mean sea water levels rise too quickly, an eroding platform can be
abandoned if the wave base no longer reaches the platform. By reasoning on the influence pathway linking cliff
and shore platform mass content with the relative water depth to wave base two balancing feedback loops are
identified, termed here the weathering limited and the shear depletion loops. A decrease of mass content due to
vertical erosion, increases the relative water depth that, for a given tidal range, decrease the intertidal exposure
time (starting from mass content the pathways read as --++- = -). A decrease of mass content also reduces wave
erosional potential, by reducing energy dissipation rate, balancing back the initial downwearing erosion rate.

10
3.3 Strength of cliff toe energy depletion loop
In the following the strength of the cliff toe energy depletion loop is estimated by reasoning on the current
understanding of the causal pathway. Based on the feedback structure identified in the previous section and the
methodology proposed, three main quantities need to be estimated to assess the strength of this balancing loop
(Figure 8): (1) how the backwearing erosion rate (E) increases with the energy reaching the cliff toe; (2) how the
platform width (W) increases with the backwearing erosion rate; (3) how the energy at the cliff toe decreases
with the platform width. The way these estimates are obtained is described below. Ultimately, the feedback
factor strength is then obtained from the product of these three quantities.
Figure 8.- Assessing the strength of the balancing (g<0) cliff-toe energy depletion loop is reduced to three main
questions. Left panel shows the conceptual model of platform widening where cliff and shore platform mass wasting
(dM/dt) is represented by the backwearing component (E). Right panel shows the three main questions that need to
be estimated.
Influence of incident wave energy on backwearing erosion rate.
Hackney et al. (2013), proposed and validated with field data a simple relationship between soft cliff erosion
rate and wave energy. Based on the premise that an ‘Accumulated Excess Energy’ (AEE) parameter can be used
to represent the process of hydraulic erosion at the base of the cliff, the relationship between backwearing
erosion rate and wave energy is given by;
(1)
Where E = the amount of erosion (m) during the time interval t, Ω = applied wave energy (J/m3), Ωc = threshold
wave energy (J/m3) required to initiate erosion, and c2 is a calibration coefficient. The average energy of a wave
per unit surface area, Ω, is;
(2)
Where Ω is energy (J/m3), ρ is the density of sea water (kg/m
3), g is the gravitational potential energy of the
wave (m2/s) and Hs is the significant wave height (m). The time interval is bounded to the underlying theoretical
concept of Basal End Point Control (BEPC). The principal implication of BEPC, that the rate of retreat is
governed by hydraulic activity at the toe, applies over time scales encompassing multiple cycles of slumping

11
and toe erosion. Accordingly, it is important to ensure that the calibration of any model based on the principles
of BEPC is conducted over a large enough temporal scale (i.e., multiple cycles of hydraulically controlled
undercutting, mass wasting, and removal of the slumped debris) to ensure that hydraulic activity at the toe is the
dominant factor controlling slope retreat. For a time scale of about 10yrs, and for the different wave
environments and geologies around the Isle of Wight and Suffolk coast in UK, Hackney et al. (2013) found that
Eq. (1) is best fitted by;
(3)
Where c1 is a fitted constant of the order of 10-6
to 10-7
for the predominantly clay-cliff study sites. They further
notice that the failure of Eq. (1) to produce significant relationships in the more resistant units may indicate that
the ~10-year timeframe employed may be too short. The change of erosion rate with changes on the energy
reaching the cliff toe can be then estimated as
(4)
Influence of erosion rate on platform width.
Platform width is defined after Sunamura (1992) for the two main types of shore platforms, namely sloping
platforms and near-horizontal platforms. Sloping platforms, which most notably occur in meso to macro-tidal
areas, slope continuously (1° to 10° slope) from the cliff toe beneath sea level. Near horizontal platforms (<1°
slope), mainly occur in micro-tidal and low meso-tidal environments and which are characterized by an abrupt
scarp at their outer edge. In either case the platform width is defined as the horizontal distance between the sea-
edge of the platform and the cliff toe as shown in Error! Reference source not found.. At any instant of time
the platform width can be estimated as the sum of the initial platform width and the added platform due to
backwearing erosion as: . The change of platform width relative to erosion rate is
obtained from this relationship as: .
Influence of width platform on energy reaching the cliff toe.
The simple analytical solution developed by Gerritsen (2011) that relates the wave energy with the distance to
the seaward limit of the shore platform is used here (eq. 5). This solution is valid for platforms of about constant
water depth and at the region where bottom friction can be neglected.
(5)
Where H(0) is the reference wave height at a reef-edge, x is the distance from the reef-edge and the coefficients
A and B are;
(6)
(7)
Coefficient ξ is of an order of magnitude one and is given by
(8)
in which
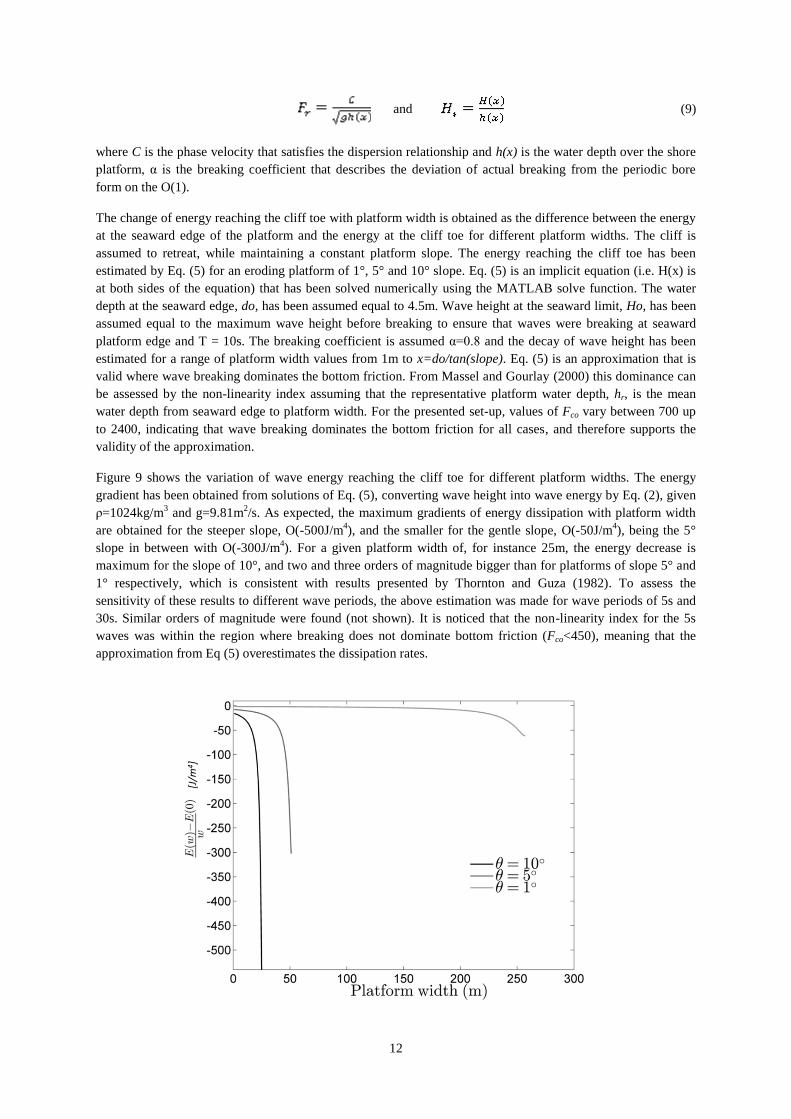
12
and (9)
where C is the phase velocity that satisfies the dispersion relationship and h(x) is the water depth over the shore
platform, α is the breaking coefficient that describes the deviation of actual breaking from the periodic bore
form on the O(1).
The change of energy reaching the cliff toe with platform width is obtained as the difference between the energy
at the seaward edge of the platform and the energy at the cliff toe for different platform widths. The cliff is
assumed to retreat, while maintaining a constant platform slope. The energy reaching the cliff toe has been
estimated by Eq. (5) for an eroding platform of 1°, 5° and 10° slope. Eq. (5) is an implicit equation (i.e. H(x) is
at both sides of the equation) that has been solved numerically using the MATLAB solve function. The water
depth at the seaward edge, do, has been assumed equal to 4.5m. Wave height at the seaward limit, Ho, has been
assumed equal to the maximum wave height before breaking to ensure that waves were breaking at seaward
platform edge and T = 10s. The breaking coefficient is assumed α=0.8 and the decay of wave height has been
estimated for a range of platform width values from 1m to x=do/tan(slope). Eq. (5) is an approximation that is
valid where wave breaking dominates the bottom friction. From Massel and Gourlay (2000) this dominance can
be assessed by the non-linearity index assuming that the representative platform water depth, hr, is the mean
water depth from seaward edge to platform width. For the presented set-up, values of Fco vary between 700 up
to 2400, indicating that wave breaking dominates the bottom friction for all cases, and therefore supports the
validity of the approximation.
Figure 9 shows the variation of wave energy reaching the cliff toe for different platform widths. The energy
gradient has been obtained from solutions of Eq. (5), converting wave height into wave energy by Eq. (2), given
ρ=1024kg/m3 and g=9.81m
2/s. As expected, the maximum gradients of energy dissipation with platform width
are obtained for the steeper slope, O(-500J/m4), and the smaller for the gentle slope, O(-50J/m
4), being the 5°
slope in between with O(-300J/m4). For a given platform width of, for instance 25m, the energy decrease is
maximum for the slope of 10°, and two and three orders of magnitude bigger than for platforms of slope 5° and
1° respectively, which is consistent with results presented by Thornton and Guza (1982). To assess the
sensitivity of these results to different wave periods, the above estimation was made for wave periods of 5s and
30s. Similar orders of magnitude were found (not shown). It is noticed that the non-linearity index for the 5s
waves was within the region where breaking does not dominate bottom friction (Fco<450), meaning that the
approximation from Eq (5) overestimates the dissipation rates.

13
Figure 9.- Variation of wave energy derived from solving Eq. (5) for eroding platforms with slopes of 10, 5 and 1 deg.
The rate of energy dissipation per unit of platform width is estimated as the ratio between the difference between the
energy at a given distance from the seaward edge and the energy at the seaward edge divided by the platform width.
Figure 10 summaries the feedback factor strength of the cliff toe energy depletion loop derived from the above
estimates. A range of g values from ~-10-10
to ~-10-4
is obtained as the product of all partial derivatives that
determines the loop strength. The six order of magnitude difference between the minimum and maximum
estimated values is mostly due to the geometry of the retreating platform. A nearly horizontal retreating platform
(1° slope) presents the minimum absolute g value of -10-10
, which corresponds with a total effect of about 1 (i.e.
total effect is equal to the direct effect). A sloping platform (10° slope) presents the maximum absolute value of
g of -10-4
which corresponds to a total effect of about 0.9999 (i.e. total effect is slightly smaller than the direct
effect). The important of these differences for modelling cliff toe position over decades and longer is discussed
in the following section.
Figure 10.- Feedback factor strength, g, of a widening platform. A sloping platform has an absolute g value up to six
orders of magnitude bigger than a nearly horizontal shore platform but always less than |1|.
4 DISCUSSION
Based on a literature review, we have described the morphodynamic feedback structure of eroding rocky shores
with a cliff and shore platform (Figure 7). The backwearing erosion rate (i.e. cliff horizontal erosion) has been
found to be controlled by at least four feedback loops, three balancing (cliff toe energy depletion, ground water
pore pressure diminution and cliff deposit protection) and one positive loop (abrasion enhancement loop). The
downwearing erosion rate (i.e. vertical erosion) has been found to be controlled by at least three balancing

14
feedback loops (weathering limited, shear depletion, cover-protection) and one positive loop (abrasion
enhancement loop). Mean sea level influences the downwearing rate through the water depth relative to the
wave base, and indirectly the backwearing erosion rate through the wave energy dissipation that determines the
amount of energy reaching the cliff toe. The influence of platform geometry (elevation, gradient) is
acknowledged by the links among the offshore wave non-linearity parameter and the energy at cliff toe and
water depth relative to wave base. The knowledge gap on our understanding of how cliff and shore platform
geometry influences the morphodynamic is acknowledged by an influence link between the mass content and
the offshore wave non-linearily parameter.
If mean sea level remains unchanged, the dominance of balancing feedbacks on the overall feedback structure
suggest that mass wasting erosion rate is unlikely to increase but similar, or even smaller, erosion rates are
anticipated to be observed in the future. This is consistent the conclusions of Ashton et al. (2011) suggesting that
the damped feedback system is the most likely cliff and shore platform behaviour. A negative feedback system
only requires that, if sea level were to stay constant, the erosion rate would slow down over time. How much
will be slow down over time is controlled by the strength of the overall feedback factor. An exception to this
behaviour is anticipated when the abrasion enhancement loop is dominant. In this scenario, the erosion rate will
increase over time rather than remaining similar or decreasing. Eroded material from the cliff increases the
abrasion capacity further increasing the erosion. In cliffed environments, such as response could occur at a
location where the profile is covered by mobile sediment in amounts not enough to protect the cliff and shore
platform such a cliff fronted by narrow platforms (Figure 1, panel 2).
If mean sea level rises, both the geometry of cliff and shore platform and rate of sea level will determine the
overall negative or positive feedback on the mass wasting erosion rate. A steeper cliff and shore platform
elevation gradient will induce an increase on the downwearing due to an increase on the wave energy dissipation
rate. A steeper shore platform is more effective dissipating wave energy which could reduce the energy reaching
the cliff toe. An increase on mean sea level could also reduce the downwearing rate by increasing the water
depth relative to the wave base. Arguably, the overall dominance of these two effects will be determined by the
change on the offshore wave non-linearilty parameter, which remains largely unknown.
The characterization of cliff and shore platform mass wasting rate into an horizontal and vertical component is
not a clear cut in the processes space (i.e. energy dissipation influences both local downwearing but also
backwearing) but provides a convenient picture of main loops at different stages of development. For example,
Dickson (2006) and Trenhaile and Kanyaya (2007) suggested that backwearing due to waves is likely to be
dominant at early stages of platform development, whereas weathering processes may become more dominate at
latter stages (i.e. function of intertidal exposure time). Accordingly, the strength of the feedback loops that
control the two erosion rate components will be different at different stages of development. Anticipating how
the strength of different loops varies with the geometry and environmental conditions is then critical to capture
this dynamical shift and transient response.
We have estimated the strength of the cliff toe energy depletion loop which, due to the assumptions and data
used, represents only a sub-set of all possible cliffed environments. In particular the estimated feedback strength
would represent any coast where slope retreat is controlled by the wave activity at the toe. This applies over
time scales encompassing multiple cycles of slumping and toe erosion. As noted by Hackney et al. (2013) the
decrease of correlation for the harder material within their dataset might indicate that the ten years’ time used to
compute the erosion rates might be too short. We have assumed that the cliff retreats while keeping the platform
slope constant. This is usually the case for near horizontal shore platforms. For sloping shore platforms it will be
valid after the first cycles of slumping and toe erosion where shore platform slope quickly decreases until
dynamic equilibrium is reached (i.e. toe retreat but keeping the platform width constant) (Dickson 2013).
The strength of the platform widening loop has been found to be O(-10-4
to -10-10
) which corresponds to a total
effect within O(0.9999 to ~1). To assess the importance of this feedback on the future erosion rates, an order of
magnitude of the time scales at which the difference between a model with and without the feedback included
can be estimated. The erosion rates ranges from 0.34 m.a-1
to 0.75 m.a-1
with an uncertainty of O(±0.01m.a-1
to
±0.16m.a-1
) (see Table 1, from Hackney et al., 2013). The difference between the erosion rates with and without

15
the feedback is O[0.75(1-0.999) ~10-4
] which is well within the uncertainty of the erosion rates. Since this
decrease is not randomly distributed but consistent over time, by taking into account the cliff toe energy
depletion loop, a systematic reduction of the erosion will eventually occur over large time scales. The
differences between the estimated erosion with and without the feedback will be bigger than the actual position
uncertainty, (O(±1.5m) from Table 2 in Hackney et al. 2013), by times scales on the order of 2000 to 4500
years. Other feedback loops, such as the beach cover protection loop have been found to have shorter associated
time scales, suggesting stronger feedback strengths. For example, Figure 18 of Walkden and Hall (2011) shows
how different beach volumes have a long term effect on recession rate appreciable over time scales of less than
1000 years.
The strength of the cliff toe energy depletion loop has been estimated assuming that the wave energy in the
gravity frequency band decays exponentially shoreward of the seaward edge which might not be always the
case. Dickson et al. (2013) proposed four potential mechanisms through which infragravity waves might
contribute to cliff recession on micro-tidal and lower meso-tidal coasts. Infragravity waves could potentially
influence the cliff erosion rate by increasing the water elevation at the cliff toe and along the platform and
therefore affecting both the wetting and drying but also the amount of gravity wave energy that could reach the
cliff toe. These effects could be included into the feedback structure shown in Figure 7 through the offshore
wave non-linearity state variable. Both, the energy dissipation due to wave breaking and the wave set-up have
been found to increase with the offshore wave non-linearity index (Massel and Gourlay 2000). While the effect
of infragravity waves may drive cliff retreat over much greater distances than by gravity waves alone, this
remains to be proven. Likewise, whether the strength of the cliff toe energy depletion loop could be either
reinforced or counterbalanced by the interaction between infragravity and gravity waves remains to be fully
understood.
5 CONCLUSIONS
As coastal evolution models for rocky coasts become increasingly complex, it is important to have a basic
theoretical framework of how different processes interact with each other and influence the changes and
responses to interventions at different stages of development. Here we have shown how a core set of processes
and feedback loops can be already distilled from the existing literature. This provides an evidence linked map of
how rock coast morphodynamics is being conceptualized and where the knowledge gaps remain. We have
explicitly shown how mass wasting of the cliff and shore platform is the result of a few balanced feedback loops
(cliff toe energy depletion, pore pressure diminution loop, weathering limited, shear depletion, cliff and platform
protection loop) but also reinforcing loops (i.e. abrasion enhancement). The changes and responses to
interventions and accelerated sea level rise of a rocky coast will vary with the strength of the different feedback
loops at different time epochs. While feedback strength metrics have become customary in other fields, such as
global climate modelling, they remain under early stages of development in coastal geomorphology. To
continue this development, the strength of a single feedback loop (cliff toe energy depletion loop) has been
estimated by reasoning on the current understanding of its causal pathway. In particular, the strength of this loop
under dynamical balance (i.e. where the cliff retreats while keeping the platform slope constant) with waves at
the gravity frequency band has been found to be O(-10-4
to -10-10
). The absolute feedback strength increases
with the platform slope, being about two orders of magnitude bigger for sloping platforms than for nearly-
horizontal eroding platforms but always much smaller than |-1|. If dominant, the time scale at which the
influence of the feedback would be identifiable, based on the current cliff toe measurement uncertainty and
limited field data, is O(>2000yrs) suggesting that other feedbacks, such as the beach cover protection, might be
more important for a cliff retreating with constant slope.
The analyses presented here builds on other existing theoretical frameworks (i.e. Basal End Point Control,
Accumulated Excess Energy, offshore non-linearity, cliff behaviour) of often separated disciplines on an
exercise of synthesis and acts as an aid for better informed quantitative morphodynamic modelling. By
understanding how the individual and overall feedback strengths are influenced by different future

16
environmental and human intervention scenarios we could provide better assessment at the time scales needed
for coastal management.
6 APPENDIX: LIST OF SYMBOLS
g Feedback factor value between –α and 1, representing how much times the direct effect is reduced/amplified by
a negative/positive feedback loop
Fco Offshore non-linearity wave
parameter
non dimensional number named after Swart and Loubser (1979) representing the dominance
of wave reflection over transmission/dissipation over a given platform geometry
E Cliff backwearing erosion rate amount of erosion (m) during the time interval t
Ω Wave energy applied averaged wave energy (J/m3) per unit of surface area
Ωc Threshold wave energy minimum wave energy (J/m3) required to initiate cliff erosion
w(t) Platform width time dependent representative platform width
θ Platform slope Platform slope (degrees)
7 REFERENCES
Ashton AD, Walkden MJA, Dickson ME (2011) Equilibrium responses of cliffed coasts to changes in the rate of
sea level rise Marine Geology 284:217-229 doi:http://dx.doi.org/10.1016/j.margeo.2011.01.007
Castedo R, Fernández M, Trenhaile AS, Paredes C (2012) Modeling cyclic recession of cohesive clay coasts:
Effects of wave erosion and bluff stability Marine Geology doi:10.1016/j.margeo.2012.11.001
Dickson ME (2013) Sea‐cliff retreat and shore platform widening: steady‐state equilibrium? Earth Surface
Processes and Landforms 38:1046
Ford MR, Becker JM, Merrifield MA (2012) Reef Flat Wave Processes and Excavation Pits: Observations and
Implications for Majuro Atoll, Marshall Islands Journal of Coastal Research 29:545-554
doi:10.2112/JCOASTRES-D-12-00097.1
Ford MR, Becker JM, Merrifield MA (2013) Reply to: Payo, A. and Muñoz-Perez, J.J., 2013. Discussion of:
Ford, M.R.; Becker, J.M., and Merrifield, M.A., 2013. Reef Flat Wave Processes and Excavation Pits:
Observations and Implications for Majuro Atoll, Marshall Islands, Journal of Coastal Research,
29(3):545554; Journal of Coastal Research, 29(5), 12411246 Journal of Coastal Research 29:1243-
1246 doi:10.2112/13A-00001.1
Fort D, Clark A, Cliffe D (2000) The investigation and monitoring of coastal landslides at Barton-on-Sea,
Hampshire, UK. In: EN Bromhead NDaM-LI (ed) Landslides: in research, theory and practice. pp 557-
572
Gerritsen F Wave attenuation and wave set-up on a coastal reef. In: Coastal Engineering Proceedings, 2011. vol
17. doi:10.9753/icce.v17
Hackney C, Darby SE, Leyland J (2013) Modelling the response of soft cliffs to climate change: A statistical,
process-response model using accumulated excess energy Geomorphology
doi:10.1016/j.geomorph.2013.01.005
Harte J (2001) Consider a cylindrical cow : more adventures in environmental problem solving. Sausalito, Calif.
: University Science Books, Sausalito, Calif.
Klocke D, Quaas J, Stevens B (2013) Assessment of different metrics for physical climate feedbacks
Observational, Theoretical and Computational Research on the Climate System 41:1173-1185
doi:10.1007/s00382-013-1757-1
Lane DC (2000) Diagramming Conventions in System Dynamics The Journal of the Operational Research
Society 51:241-245
Lane SN (2013) 21st century climate change: where has all the geomorphology gone? Earth Surface Processes
and Landforms 38:106-110 doi:10.1002/esp.3362
Massel SR, Gourlay MR (2000) On the modelling of wave breaking and set- up on coral reefs Coastal
Engineering 39:1-27 doi:10.1016/S0378-3839(99)00052-6

17
Masselink G, Russell P (2010) Coastal Erosion in MCCIP Annual Report Card 2010-11, MCCIP Science
Review.
Murray AB, Ashton AD (2013) Instability and finite-amplitude self-organization of large-scale coastline shapes
Philosophical transactions Series A, Mathematical, physical, and engineering sciences 371:20120363
Naylor LA, Stephenson WJ (2010) On the role of discontinuities in mediating shore platform erosion
Geomorphology 114:89-100 doi:10.1016/j.geomorph.2008.12.024
Naylor LA, Stephenson WJ, Trenhaile AS (2010) Rock coast geomorphology: Recent advances and future
research directions Geomorphology 114:3-11 doi:10.1016/j.geomorph.2009.02.004
Ogawa H (2012) Wave Characteristics and Transformations on Sub-horizontal (type B) Shore Platforms on the
East Coast of the North Island, New Zealand. Geography)--University of Auckland,
Payo A, Muñoz-Perez JJ (2013) Discussion of Ford, M.R.; Becker, J.M., and Merrifield, M.A. 2013. Reef Flat
Wave Processes and Excavation Pits: Observations and Implications for Majuro Atoll, Marshall
Islands. Journal of Coastal Research, 29(3), 545554 Journal of Coastal Research 29:1236-1242
doi:10.2112/JCOASTRES-D-13-00051.1
Phillips JD (2006) Deterministic chaos and historical geomorphology: A review and look forward
Geomorphology 76:109-121 doi:10.1016/j.geomorph.2005.10.004
Porter NJ, Trenhaile AS, Prestanski KJ, Kanyaya JI (2010) Shore platform downwearing in eastern Canada:
Micro-tidal Gaspé, Québec Geomorphology 116:77-86 doi:10.1016/j.geomorph.2009.10.010
Robinson L (1977) Erosive processes on the shore platform of northeast Yorkshire, England Marine Geology
23:339-361
Slingerland R (1981) Qualitative stability analysis of geologic systems, with an example from river hydraulic
geometry Geology 9:491-493
Stephenson WJ (2000) Shore platforms: a neglected coastal feature? Progress in Physical Geography 24:311-
327 doi:10.1177/030913330002400301
Stephenson WJ, Kirk RM (2000) Development of shore platforms on Kaikoura Peninsula, South Island, New
Zealand: Part One: The role of waves Geomorphology 32:21-41 doi:10.1016/S0169-555X(99)00061-6
Sunamura T (1992) Geomorphology of rocky coasts. Coastal morphology and research Y. Chichester : Wiley,
Chichester
Sunamura T (1994) Rock control in coastal geomorphic processes vol 15. Transactions — Japanese
Geomorphological Union. doi:10.1016/0148-9062(95)90026-2
Swart D, Loubser C (1979) Vocoidal wave theory, Vol. 2: verification Coastal Engineering and Hydraulics
Division, National Research Institute for Oceanology, Council for Scientific and Industrial Research,
Republic of South Africa, Research Report
Thornton EB, Guza RT (1982) Energy saturation and phase speeds measured on a natural beach Journal of
Geophysical Research: Oceans 87:9499-9508 doi:10.1029/JC087iC12p09499
Trenhaile AS (2005) Modelling the effect of waves, weathering and beach development on shore platform
development Earth Surface Processes and Landforms 30:613-634 doi:10.1002/esp.1166
Trenhaile AS (2008) Modeling the role of weathering in shore platform development Geomorphology 94:24-39
doi:10.1016/j.geomorph.2007.04.002
Trenhaile AS (2010) Modeling cohesive clay coast evolution and response to climate change Marine Geology
277:11-20 doi:10.1016/j.margeo.2010.08.002
Trenhaile AS, Kanyaya JI (2007) The Role of Wave Erosion on Sloping and Horizontal Shore Platforms in
Macro- and Mesotidal Environments Journal of Coastal Research 23:298-309 doi:10.2112/04-0282.1
Walkden MJ, Hall JW (2011) A Mesoscale Predictive Model of the Evolution and Management of a Soft- Rock
Coast Journal of Coastal Research 27:529-543 doi:10.2112/JCOASTRES-D-10-00099.1
Walkden MJA, Hall JW (2005) A predictive Mesoscale model of the erosion and profile development of soft
rock shores Coastal Engineering 52:535-563 doi:10.1016/j.coastaleng.2005.02.005
Top Related