


Languages
Pages
Legal


Factors Affecting the Financial Performance Of
Commercial Banks Listed On the Nairobi Securities Exchange
BY
CARELLE KANEZA
UNITED STATES INTERNATIONAL UNIVERSITY -
AFRICA
SPRING 2016
FACTORS AFFECTING THE FINANCIAL PERFORMANCE OF
COMMERCIAL BANKS LISTED ON THE NAIROBI SECURITIES
EXCHANGE
BY
CARELLE KANEZA

A Research Project Report Submitted to the Chandaria School of
Business in Partial Fulfillment of the Requirement for the Degree of
Masters in Business Administration (MBA)
UNITED STATES INTERNATIONAL UNIVERSITY –
AFRICA
SPRING 2016

ii
STUDENT’S DECLARATION
I, the undersigned, declare that this is my original work and has not been submitted to any
other college, institution or university other than the United States International University
in Nairobi for academic credit.
Signed: ________________________ Date: _____________________
Carelle Kaneza (ID: 632063)
This research project has been presented for examination with my approval as the appointed
supervisor.
Signed: ________________________ Date: _____________________
Dr. George O. Achoki
Signed: _______________________ Date: ____________________
Dean, Chandaria School of Business
COPYRIGHT
© Copyright by Carelle Kaneza 2016

iii
All rights reserved. No part of this project may be produced or transmitted in any form or
by any means, electronic, mechanical, including photocopying, recording or any
information storage without prior written permission from the author.

iv
ABSTRACT
The purpose of the study was to examine the factors affecting financial performance of
commercial banks listed on the Nairobi Stock Exchange (NSE). The study sought to address
the following research questions: How does Capital Adequacy affect the financial
performance of commercial banks in Kenya? How does Asset Quality affect the financial
performance of commercial banks in Kenya? and How does Management affect the
financial performance of commercial banks in Kenya?
A descriptive research design was applied to a population of 10 commercial banks listed on
the NSE. This design is appropriate when the researcher wishes to provide an accurate
representation of situations and make inferences about the target population. This study
targeted all the banks quoted on the NSE and used secondary data obtained from financial
statements found on the websites of the relevant banks and the Central Bank of Kenya
(CBK). This study used descriptive and inferential statistics to establish the relationship
between the 3 independent variables and the dependent variables – Return on Assets (ROA)
and Return on Equity (ROE). Regression and correlation analyses were used and based on
the association between two (or more) variables. The Statistical Package for Social Sciences
(SPSS) and Excel were the analysis tools used in this study.
The study found that Capital Adequacy, Asset Quality and Management each have different
effects on the financial performance of commercial banks listed on NSE. The study found
capital adequacy had a positive effect on both ROA and ROE. The findings showed a very
weak and negative association between asset quality and ROA, however a strong and
negative association was found between asset quality and ROE. Management efficiency had
a positive effect or association with both ROA and ROE.
The study concluded that an increase in capital adequacy would result in a positive increase
in both ROA and ROE of commercial banks. Similarly, an increase in management
efficiency would lead to an increase in both ROA and ROE. However, asset quality affected
the financial performance of banks negatively implying that an increase in the asset quality,
in terms of non-performing loans, would lead to a decrease in both ROA and ROE of
commercial banks.
The study makes the following recommendations: First, the government and the regulatory
body, CBK, should encourage banks through effective policies to regularly raise their capital

v
and provide the environment necessary for the banking sector as well as the economy to grow.
Second, banks operating in Kenya must identify and reduce the effects of factors that can
deteriorate asset quality because non-performing loans, unless well-managed, are a big threat
to banks and the banking industry. Third, commercial banks should set up policies that guide
decisions with the aim of maximizing returns and devise effective mechanisms to reduce or
control operational expenses. Finally, this study suggests that future researchers examine the
effects of all CAMEL factors – including Earnings and Liquidity – on the financial
performance of commercial banks.

vi
ACKNOWLEDGEMENT
I wish to express my deepest gratitude to everyone who supported me throughout the course
of this MBA project. Foremost, I would like to thank God Almighty for without His grace,
favour and blessings, this research project would not have become a reality. I extend my
special gratitude to my supervisor, Dr. George Achoki, for his encouragement, constructive
criticism and friendly advice. I express also my warm thanks to my friends and family,
especially my parents, for always believing in me.

vii
DEDICATION
I dedicate this research project to my dearest mother, who is and will always be my role
model. Thank you for the sacrifices you made so that I could get the best education. I
appreciate you and God bless you.

viii
TABLE OF CONTENTS
STUDENT’S DECLARATION .............................................................................................
ii
COPYRIGHT ................................................................................................................... ......
iii
ABSTRACT ............................................................................................................................
iv
ACKNOWLEDGEMENT .....................................................................................................
vi
DEDICATION.......................................................................................................................
vii
TABLE OF CONTENTS ....................................................................................................
viii
LIST OF TABLES ..................................................................................................................
x
LIST OF FIGURES ...............................................................................................................
xi
CHAPTER ONE ................................................................................................................. ....
1
1.0 INTRODUCTION.......................................................................................... ................... 1
1.1 Background of the Problem ................................................................................................ 1
1.2 Statement of the Problem .................................................................................................... 4
1.3 Purpose of the Study ........................................................................................................... 6
1.4 Research Questions ............................................................................................................. 6
1.5. Significance of the Study ................................................................................................... 6
1.6 Scope of the Study .............................................................................................................. 7
1.7 Definition of Terms............................................................................................................. 8
1.8 Chapter Summary ............................................................................................................... 9
CHAPTER TWO ..................................................................................................................
10
2.0 LITERATURE REVIEW .............................................................................................. 10
2.1 Introduction ....................................................................................................................... 10
2.2 The Effect of Capital Adequacy on Financial Performance of Commercial Banks ......... 10
2.3 The Effect of Asset Quality on Financial Performance of Commercial Banks ................ 16

ix
2.4 The Effect of Management Efficiency on Financial Performance of Commercial
Banks....................................................................................................................................... 20
2.5 Chapter Summary ............................................................................................................. 25
CHAPTER THREE ..............................................................................................................
26
3.0 RESEARCH METHODOLOGY ..................................................................................
26
3.1 Introduction ....................................................................................................................... 26
3.2 Research Design................................................................................................................ 26
3.3 Population and Sampling Design ...................................................................................... 26
3.4 Data Collection Methods .................................................................................................. 28
3.5 Research Procedures ......................................................................................................... 28
3.6 Data Analysis Methods ................................................................................................... .. 28
3.7 Chapter Summary ........................................................................................................ ..... 29
CHAPTER FOUR .................................................................................................................
30
4.0 RESULTS AND FINDINGS ..........................................................................................
30
4.1 Introduction ....................................................................................................................... 30
4.2. General Information ..................................................................................... .................... 30
4.3 Effect of Capital Adequacy on Financial Performance of Commercial Banks ................ 35
4.4 Effect of Asset Quality on Financial Performance of Commercial Banks ....................... 39
4.5 Effect of Management Efficiency on Financial Performance of Commercial Banks ...... 42
4.6 Joint Effects of Capital Adequacy, Management Efficiency and Asset Quality on
Financial Performance of Commercial Banks ....................................... ................................. 46
4.7 Chapter Summary ............................................................................................................. 50
CHAPTER FIVE .................................................................................................................. 51
5.0 DISCUSSIONS, CONCLUSIONS AND RECOMMENDATIONS ...........................
51
5.1 Introduction ....................................................................................................................... 51
5.2 Summary of the Study ...................................................................................................... 51
5.3 Discussions ....................................................................................................................... 52
5.4 Conclusions ............................................................................................................. .......... 56
x
5.5 Recommendations ............................................................................................................. 57
REFERENCES ......................................................................................................................
60
APPENDIX A ........................................................................................................................
65 LIST OF TABLES
Table 3.1: Sample Size Distribution Table ............................................................................. 28
Table 4.1: Descriptive Statistics ............................................................................................. 34
Table 4.2: Capital Adequacy and Financial Performance Correlations .................................. 35
Table 4.3: Regression Model Summary – Capital Adequacy and ROA................................. 36
Table 4.4: ANOVA – Capital Adequacy and ROA ................................................................ 36
Table 4.5: Regression Coefficients – Capital Adequacy and ROA ........................................ 37
Table 4.6: Regression Model Summary – Capital Adequacy and ROE ................................. 37
Table 4.7: ANOVA – Capital Adequacy and ROE ................................................................ 38
Table 4.8: Regression Coefficients – Capital Adequacy and ROE ........................................ 38
Table 4.9: Asset Quality and Financial Performance Correlations......................................... 39
Table 4.10: Regression Model Summary – Asset Quality and ROA ..................................... 40
Table 4.11: ANOVA – Asset Quality and ROA ..................................................................... 40
Table 4.12: Regression Coefficients – Asset Quality and ROA ............................................. 40
Table 4.13: Regression Model Summary – Asset Quality and ROE ...................................... 41
Table 4.14: ANOVA – Asset Quality and ROE ..................................................................... 41
Table 4.15: Regression Coefficients – Asset Quality and ROE ............................................. 42
Table 4.16: Management Efficiency and Financial Performance Correlations ...................... 42
Table 4.17: Regression Model Summary – Management Efficiency and ROA ..................... 43
Table 4.18: ANOVA – Management Efficiency and ROA .................................................... 43
Table 4.19: Regression Coefficients – Management Efficiency and ROA ............................ 44
Table 4.20: Regression Model Summary – Management Efficiency and ROE ..................... 44
Table 4.21: ANOVA – Management Efficiency and ROE..................................................... 45
Table 4.22: Regression Coefficients – Management Efficiency and ROE ............................. 45
Table 4.23: Regression Model Summary - ROA .................................................................... 46
Table 4.24: ANOVA – Independent Variables and ROA....................................................... 46
Table 4.25: Regression Coefficients – Independent Variables and ROA ............................... 47
Table 4.26: Regression Model Summary - ROE .................................................................... 48
Table 4.27: ANOVA – Independent Variables and ROE ....................................................... 48

xi
Table 4.28: Regression Coefficients – Independent Variables and ROE ............................... 49
LIST OF FIGURES
Figure 4.1: Return on Assets ................................................................................................... 30
Figure 4.2: Return on Equity .................................................................................................. 31
Figure 4.3: Capital Adequacy ................................................................................................ . 32
Figure 4.4: Asset Quality ........................................................................................................ 33
Figure 4.5: Management Efficiency ....................................................................................... 34

1
CHAPTER ONE
1.0 INTRODUCTION
1.1 Background of the Problem
Commercial banks, mainly due to their intermediation function play a crucial role in the
financial sector of any country in the world. In the past twenty years, the banking sector
worldwide has undergone significant changes in its operating environment, especially in
terms of its structure and financial performance (Athanasoglou, Brissimis, & Delis, 2008).
Despite the increasing trend toward bank disintermediation, the effective mobilization of
funds from depositors to investors or productive projects is still a prime requirement for a
country’s economic development (Athanasoglou et al., 2008). Good financial performance
of commercial banks, according to Ongore and Kusa (2013), contributes to a sound and
profitable banking sector as well as a stronger financial system which is better able to
endure negative shocks. Poor performance can lead to bank runs, bank crises and result in
a major financial crisis.
Nimalathasan (2008) suggests that research and discussions on performance may positively
impact financial performance leading to improved functions and activities of the firms,
which may explain the increased research on bank performance from both scholars and
industry specialists. Financial ratio analysis, benchmarking, and measuring performance
against budgets are some of the tools which are widely used in measuring financial
performance of financial institutions (Echeboka et al. 2014). Research on bank performance
mainly considers return on assets (ROA), return on equity (ROE), and net interest margin
(NIM) as the primary measures of profitability and focuses on various variables or
determinants to explain differences in financial performance of banks (Flamini, McDonald
& Schumacher, 2009).
Literature categorises these determinants into internal and external factors which influence
bank performance. According to Athanasoglou et al. (2008), the internal determinants
originate from a bank’s financial statements and are thus referred to as bank-specific
determinants of profitability, whereas external determinants are factors that are not directly
linked to bank management, but which reveal details of the economic and legal
environment that affect the operation and performance of financial institutions.

2
Many variables have been determined for both classifications according to the purpose of
each study.
This study highlighted the variables that constitute the CAMEL (Capital adequacy, Asset
Quality, Management, Earnings, Liquidity) model as they too are associated with the
financial performance of commercial banks, mainly focusing on Capital Adequacy, Asset
Quality and Management. The CAMEL rating system is often used by regulatory bodies,
such as the Central Bank of Kenya to evaluate the operations of banks (Ogilo, 2012) and
details the 5 aforementioned factors related to banking operations (Nimalathasan, 2008).
Recently, many researchers have shown interest in the determinants of bank performance
and investigated the relationship between these factors and the profitability of banks
(Nouaili, Abaoub & Ochi, 2015).
Seelanatha (2010) conducted a study on how bank efficiency and market structure affect
the overall performance of banking firms in Sri Lanka, using net interest margin and return
on asset as performance measures as well as Structure-Conduct-Performance (SCP)
literature. The study findings reveal that traditional SCP hypothesis does not apply in the
banking industry in Sri Lanka and that bank profitability does not depend on either market
concentration or market power of individual firms but rather that the level of efficiency of
the institutions is crucial for improved bank performance.
Jaber and Al-khawaldeh (2014) studied banks in Jordan to identify the determinants of
profitability on commercial banks and examine the extent to which bank performance is
influenced by internal and external factors. They find that internal factors in general have
a significant impact, however capital adequacy, liquidity and size are found not to be
significant. With regards to the external factors, inflation, Gross Domestic Product (GDP)
and stock market capitalization to total assets have a significant impact on performance.
In Japan, Nasserinia, Ariff and Fan-Fah (2014) studied how some bank-specific
characteristics and several market and macroeconomic factors impact the financial
performance of banks. Results indicate that net interest margin (NIM) is an important
performance variable and that negative relationships exist between credit risk, capital
adequacy and NIM while a positive association is found between liquidity risk, asset
quality, management efficiency and NIM. Bank concentration has a positive influence on
banks in Japan but though the effects of income diversification and size are positive they

3
are not significant. The macro-economic factors, GDP growth and money supply have
negative and significant relationships on performance however their effects are not as
strong as those of bank-specific variables.
A study by Lipunga (2014) aimed to evaluate the determinants of profitability of listed
commercial banks in developing countries, focusing on Malawi for the period 2009-2012.
Return on Assets (ROA) and Earnings Yield (EY) were used as measures of profitability.
The study applied correlation and multivariate regression analysis which revealed that bank
size, liquidity and management efficiency have a statistically significant impact on ROA
but this was not the case for capital adequacy. In terms of Earnings Yield however, bank
size, capital adequacy and management efficiency had a significant influence on bank
performance but not liquidity.
Echeboka et al. (2014) performed a study attempting to determine the effect of CAMEL
elements on the profitability of Nigerian banks for the period 2001-2010. Ordinary Least
Square (OLS) method using The Statistical Package for Social Sciences (SPSS) estimated
the model for the study. The ratios of the CAMEL system are considered the independent
variables while Return on Assets (ROA) is the profitability ratio used as the dependent
variable. The results of the study based on the CAMEL model, revealed that only the
liquidity of the banks under consideration had a significant impact on bank profitability
whereas capital adequacy, asset quality, management efficiency and earnings did not. These
findings are contradictory to those of the study by Uzhegova (2015) which indicated that
all CAMEL components had a significant influence on bank profitability (ROE and ROA).
Ongore and Kusa (2013), in their study, also found that capital adequacy, liquidity and asset
quality were the most important determinants of a bank’s financial performance.
Ongore and Kusa (2013) used the CAMEL model to study the determinants of financial
performance of commercial banks in Kenya. Linear multiple regression model and
Generalized Least Square on panel data were used to estimate the data collected from
financial statements of the commercial banks and the profitability ratios of ROA, ROE and
NIM were used as measures of financial performance. The study found that capital
adequacy and management efficiency both have a positive relationship with bank
performance but asset quality and bank performance have a negative relationship.
Liquidity was found to have no significant influence on bank performance.
4
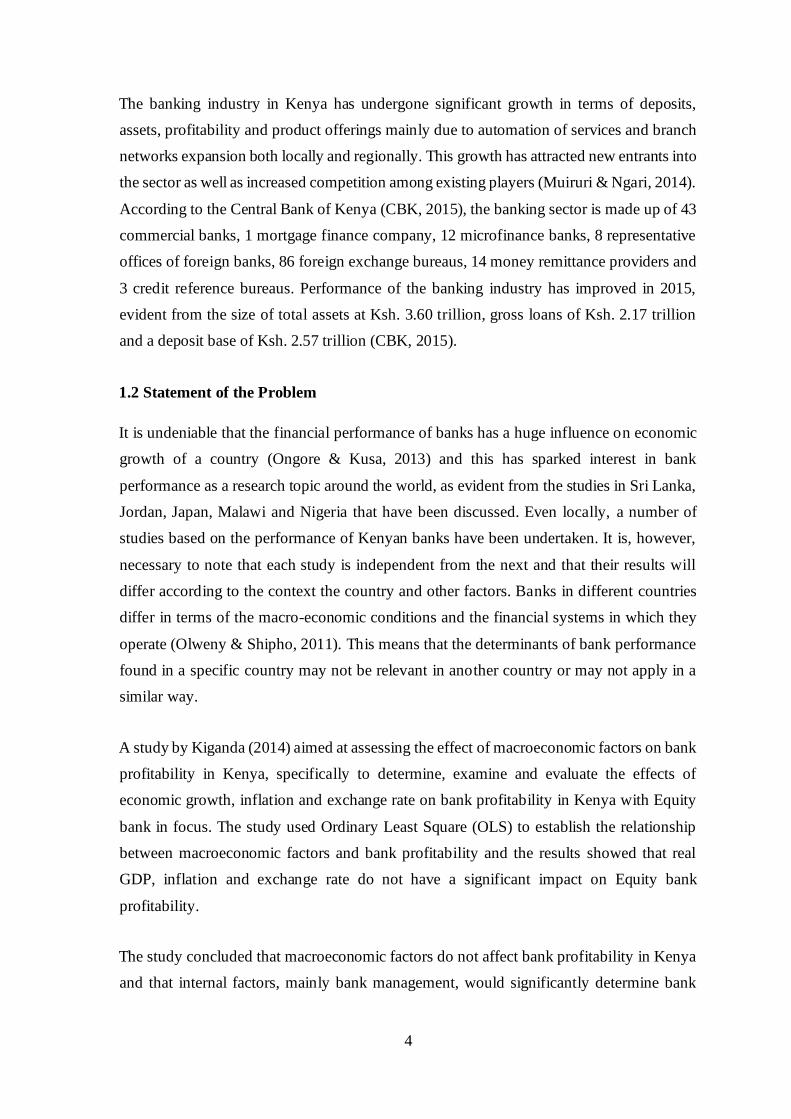
The banking industry in Kenya has undergone significant growth in terms of deposits,
assets, profitability and product offerings mainly due to automation of services and branch
networks expansion both locally and regionally. This growth has attracted new entrants into
the sector as well as increased competition among existing players (Muiruri & Ngari, 2014).
According to the Central Bank of Kenya (CBK, 2015), the banking sector is made up of 43
commercial banks, 1 mortgage finance company, 12 microfinance banks, 8 representative
offices of foreign banks, 86 foreign exchange bureaus, 14 money remittance providers and
3 credit reference bureaus. Performance of the banking industry has improved in 2015,
evident from the size of total assets at Ksh. 3.60 trillion, gross loans of Ksh. 2.17 trillion
and a deposit base of Ksh. 2.57 trillion (CBK, 2015).
1.2 Statement of the Problem
It is undeniable that the financial performance of banks has a huge influence on economic
growth of a country (Ongore & Kusa, 2013) and this has sparked interest in bank
performance as a research topic around the world, as evident from the studies in Sri Lanka,
Jordan, Japan, Malawi and Nigeria that have been discussed. Even locally, a number of
studies based on the performance of Kenyan banks have been undertaken. It is, however,
necessary to note that each study is independent from the next and that their results will
differ according to the context the country and other factors. Banks in different countries
differ in terms of the macro-economic conditions and the financial systems in which they
operate (Olweny & Shipho, 2011). This means that the determinants of bank performance
found in a specific country may not be relevant in another country or may not apply in a
similar way.
A study by Kiganda (2014) aimed at assessing the effect of macroeconomic factors on bank
profitability in Kenya, specifically to determine, examine and evaluate the effects of
economic growth, inflation and exchange rate on bank profitability in Kenya with Equity
bank in focus. The study used Ordinary Least Square (OLS) to establish the relationship
between macroeconomic factors and bank profitability and the results showed that real
GDP, inflation and exchange rate do not have a significant impact on Equity bank
profitability.
The study concluded that macroeconomic factors do not affect bank profitability in Kenya
and that internal factors, mainly bank management, would significantly determine bank
5
profitability in Kenya. This study however did not directly investigate the influence of
CAMEL factors on bank performance.
In another study, Olweny and Shipho (2011) studied the effects of bank-specific factors
such as capital adequacy, asset quality, liquidity, operational cost efficiency and income
diversification on the profitability of commercial banks in Kenya, as well as the effects of
market structure factors; foreign ownership and market concentration on performance
banks in Kenya. Using the multiple linear regressions method, their analysis revealed that
all the bank specific factors had a statistically significant impact on profitability, while none
of the market factors had a significant impact. This study focused on some bankspecific
factors and did not assess the impact of external factors on financial performance of banks.
A number of studies, such as those by Ogilo (2012), Uzhegova (2015), Ongore and Kusa
(2013) and Echeboka et al. (2014), investigating the relationship between CAMEL
components and the financial performance of commercial banks, have had contradicting
conclusions. Some of these studies find that all components of the model have a significant
influence on bank performance, whereas others find that only one component shows a
strong relationship with performance or just a few CAMEL elements impact bank
performance. For instance, Ogilo (2012) used the CAMEL approach to study how credit
risk management affects the financial of commercial banks in Kenya. Using multiple
regression analysis, the findings showed that CAMEL elements had a strong influence on
bank performance. It was concluded that capital adequacy, asset quality, management
efficiency and liquidity had weak relationships with financial performance represented by
ROE, and that earnings was the only component with a strong relationship with the financial
performance of commercial banks. These findings seem to contradict those of studies by
Uzhegova (2015), Ongore and Kusa (2013) and Echeboka et al. (2014).
While the above studies provide valuable information on bank performance, some lack
consensus on the influence on bank performance, others omit certain important factors.
To the best of the researcher’s knowledge, these studies have not highlighted the factors
affecting the performance of commercial banks listed on the NSE, focusing on the elements
of the CAMEL model – specifically Capital Adequacy, Asset Quality and
Management, hence the research gap that the current study sought to fill (Kiganda, 2014,
Olweny & Shipho, 2011, Ongore & Kusa, 2013, Ogilo, 2012, Uzhegova, 2015, Echeboka
et al., 2014).
6
1.3 Purpose of the Study
The purpose of this study was to examine the factors affecting financial performance of
commercial banks listed on the Nairobi Securities Exchange.
1.4 Research Questions
The following research questions were used for the study:
1.4.1 How does Capital Adequacy affect the financial performance of commercial banks in
Kenya?
1.4.2 How does Asset Quality affect the financial performance of commercial banks in
Kenya?
1.4.3 How does Management affect the financial performance of commercial banks in
Kenya?
1.5. Significance of the Study
The study filled in the knowledge gap on some of the factors affecting financial
performance of commercial banks listed on the Nairobi Securities Exchange. The findings
will be beneficial to the banking industry as a whole and especially to the following key
stakeholders in the sector:
1.5.1 Commercial Banks
To commercial banks in Kenya, the study identified various internal, external and CAMEL
factors which affect the performance of banks. The study informs bank managers on how
these factors individually influence bank performance. The banks can thus use this
information to improve overall financial performance by focusing and monitoring these
factors.
1.5.2 Investors
To investors in Kenya, the study provided insight on the variables that can help them
forecast the profitability of financial institutions in the future by looking at trends. In the
study, asset quality, management efficiency and capital adequacy are among the factors

7
examined and this information can be useful when deciding whether or not the industry is
worth investing in.
1.5.3 Regulatory Bodies and the Government
To the government and regulatory bodies, the study can add value to bank supervision as it
provides insight on the factors which are directly related to banking activities and which
determine the financial soundness of banks in Kenya. The financial health of the banking
industry directly influences the state of the country’s economy making it important to the
government. This information can assist the regulator in confirming the banks’ compliance
with regulations and guidelines and in forming strategies aimed at improving the sector’s
performance and growth.
1.5.4 Researchers
To researchers and academia, the study contributed to the body of research on bank
performance and addresses the existing knowledge gap on the effects of capital adequacy,
asset quality and management efficiency on the financial performance of commercial banks
listed on NSE. The study also provided information for use in future academic research on
bank performance which is beneficial to researchers.
1.6 Scope of the Study
This study was carried out in Kenya, with a focus on the commercial banks listed on the
NSE from 2010 to 2014, namely Barclays Bank, CFC Stanbic Holdings, Co-operative Bank
of Kenya, Diamond Trust Bank Kenya, Equity Group Holdings, HF Group Limited, Kenya
Commercial Bank, National Bank of Kenya, NIC Bank, Standard Chartered Bank.
The study was conducted from January 2016 to April 2016 using secondary data. The study
was limited to the above-mentioned commercial banks in Kenya.

8
1.7 Definition of Terms
1.7.1 Capital Adequacy
Olalekan and Adeyinka (2013) define capital adequacy as the portion of a financial
institution’s assets (loans and investments) which makes up its primary capital. This ratio
is used to gauge the financial strength and stability of the financial institution.
1.7.2 Asset Quality
Asset quality of a commercial bank refers to its ability to recover outstanding loans and
advances when they are due. It is the ratio of classified loans to total loans issued (Kabir &
Dey, 2012).
1.7.3 Non-performing Loan
A non-performing loan is one which is in default or close to being in default. The borrower
has not made interest payments according to the contract terms, usually 3 months, and has
principal outstanding (Aziz, Ibrahim, & Isa, 2009).
1.7.4 Commercial Banks
According to the Central Bank of Kenya (2015), a commercial bank is one which
undertakes banking business, i.e.: accepting money from the public and lending or investing
money held.
1.7.5 Liquidity
Bank liquidity refers to its ability to meet all its contractual obligations as they fall due,
mainly those of depositors (Ongore & Kusa, 2013).
1.7.6 Financial Ratios
Financial ratios are common measures of performance for organisations. They show the
relationship between items found in financial statements of the organisation (Echeboka et
al. 2014).
9
1.8 Chapter Summary
This first chapter provides a general overview of this study. The introduction highlights the
background of the study with regards to previous studies conducted outside Kenya and
locally on the factors affecting bank performance. The chapter also presented the problem
statement, identified the existing knowledge gap on factors influencing bank performance,
as well as the purpose of the study. The research questions are also outlined as well as the
significance of the study, scope of the study and definition of terms.
The second chapter provides the literature review based on the research questions which
focus on previous studies similar to this study as well as their findings and conclusions.
Chapter three follows with the methodology that was used in this study, detailing the
research design, population, sampling design, data collection methods, research procedures
and data analysis methods. Chapter four presents the findings and results using graphs and
tables. Chapter five concludes the study with a summary of the findings, discussions,
conclusions and recommendations.
CHAPTER TWO
2.0 LITERATURE REVIEW
2.1 Introduction
This chapter reviews existing literature related to the financial performance of commercial
banks. The chapter is organized such that each of the research questions presented in the
previous chapter is clearly addressed. Specifically, the chapter highlights literature review
on the three CAMEL factors – capital adequacy, asset quality and management efficiency
– that influence the financial performance of commercial banks.
10
2.2 The Effect of Capital Adequacy on Financial Performance of Commercial Banks
When analysing the determinants of banking performance, certain factors stand out. They
are bank-specific and within the scope of banks to influence using policy and decisions.
These factors will differ from bank to bank and thus are appropriate when conducting a
comparative study of various commercial banks with regards to performance. They include
Capital adequacy, Asset quality, Management efficiency, Earnings and Liquidity. The
CAMEL rating system is widely used, especially by regulatory bodies in the evaluation and
ranking of bank safety and soundness (Altan et al., 2014). It involves reviewing different
areas of a bank based on various sources of information including financial statements,
budgets, financing sources and others. CAMEL is an acronym for the five bank-specific
factors named above which will be analysed in detail in relation to banking performance
(Nimalathasan, 2008). According to Buerger (2011) the CAMEL rating is the most crucial
number to a bank, in terms of regulation. She states that “all bank directors should have a
firm understanding of the meaning of CAMELS ratings and the profound impact these
ratings have on the bank.”
2.2.1 Capital Ratio
Capital is the amount of own funds that a bank has to fund its activities and can be used as
a safeguard in case of unfavourable changes in the environment (Athanasoglou et al., 2008).
Ongore and Kusa (2013) explain that enough capital is necessary for liquidity purposes as
bank deposits can be susceptible to bank runs. Capital adequacy is thus, an indication of a
bank’s capital strength in terms of insolvency risk. Capital adequacy ratio (CAR) is
commonly expressed by the sum of Tier I Capital and Tier II Capital as a percentage of a
bank’s risk weighted assets (Swarnapali, 2014). Capitalisation is another indicator of
capital adequacy measured by the ratio of shareholders’ equity to total assets of a bank
(Onuonga, 2014). This shows the extent to which a bank’s assets are financed by the
owners’ funds (Obamuyi, 2013).
With regards to the relationship between capital adequacy and bank performance, generally
banks with low capital ratio are considered more risky than those with higher capitalization,
especially in the case of a financial crisis, and thus adverse implications for bank
performance (Onuonga, 2014). According to Zhang and Dong (2011), wellcapitalized
banks are safer, have greater creditworthiness and gain from reduced funding costs which
all positively affect the performance of commercial banks. Nouaili et al. (2015) add that a

11
highly capitalized bank has a lesser need for debt financing thus reducing its cost of debt.
Onuonga (2014) explain that banks with high capitalization are able to meet the regulator’s
capital requirements and then issue the excess funds as loans. Rao and Lakew (2012) also
write that banks with high capital ratio are assumed less risky because in a situation where
asset quality is deteriorating and a bank does not have enough loan loss reserves to write
off the bad loans, the bank can use its equity to write off the balance.
Many studies have revealed results that support the positive relationship between high
capitalization and profitability of banks. Nouaili et al. (2015) in their study find a positive
impact of capitalization on the interest margin of banks in Tunisia concluding that higher
capital levels represent a positive signal to the market on the solvency of the banks. A study
by Onuonga (2014) showed that capital adequacy or capital strength has a positive impact
on the profitability of the top banks in Kenya in 2008 to 2013. Capital actually showed the
largest impact on the changes in profits in this case, which agrees with the argument that
highly capitalized banks can even endure general financial crisis and remain profitable. The
author thus suggests that the top commercial banks in Kenya can earn higher profits by
increasing capital.
Obamuyi (2013) also found a positive and significant relationship between profitability and
capitalization of banks in Nigeria. He explains that banks with more capital can access
funds cheaply; enhance their ability to assume risk and invest in better quality assets which
proves favourable with regards to liquidity and lending and thus profitability of the banks.
The positive relationship reflects the statements found in the expected bankruptcy costs
hypothesis and the signaling hypothesis according to Obamuyi (2013).
Studies by Athanasoglou et al. (2008), Flamini et al. (2009), Rao and Lakew (2012) and
Sufian and Kamarudin (2012) also had similar results.
Some authors, on the other hand, revealed capital adequacy to have a negative impact on
bank performance in their studies. For instance, the study on banks in Uganda by Frederick
(2014) found such a negative relationship and explained that the banks may have been
avoiding potentially risky but profitable undertakings in an approach deemed too prudent.
This shows that capital regulatory requirement can have adverse implications on bank
performance if not adjusted with increased investments. Studies by Zhang and Dong (2011)
and Swarnapali (2014) also found capital to have a negative impact on bank profitability.

12
2.2.2 Earnings
Profit maximization is the main objective for most organisations, including commercial
banks, and is often viewed as an indicator of sound performance. Nimalathasan (2008)
explains that earnings are a reflection of a bank’s ability to continue conducting business
in the present and future. Thus the earnings or profits element in the CAMEL rating system
examines the quality of a bank’s profitability as well as the sustainability of profits and
potential for future growth (Altan et al., 2014). A bank with high earnings is able to increase
its own capital base, finance expansion ventures and pay attractive dividends to its
shareholders as well as build the bank’s provisions or reserves. Profitable banks can absorb
loan losses, reward shareholders and inspire public confidence which is essential for their
continued success. Effective and efficient asset and liability management is important for
banks to start enjoying good returns (Muhmad & Hashim, 2015).
Various profitability ratios can be used to measure a bank’s ability to earn profits from
revenue and assets. Kabir & Dey (2012) in their research refer to net investment margin
(NIM), return on assets (ROA), diversification ratio, net profit margin, earnings per share
(EPS), return on capital employed (ROCE). NIM, ROA and ROE are the most commonly
used ratios in measuring bank profitability in banking literature. Ratios are not affected by
fluctuations in general price levels making them more appropriate to use than real values
of profit when assessing bank profitability (Rao & Lakew, 2012).
It is without much doubt that earnings have a significant influence on the financial
performance of commercial banks which may explain the limited literature on the
relationship between earnings and bank performance as compared to the other CAMEL
elements. Nonetheless, the study by Muhmad and Hashim (2015) analysed earnings quality
and found it to be significant and a contributing factor for better performance of banks in
Malaysia. Nasserinia et al. (2014) find NIM to be the most important measure or proxy for
performance over ROA and ROE.
It is thus natural to gather that earnings expressed by profitability ratios have a strong and
significant relationship with bank performance as many studies employ these ratios when
describing bank performance. For instance, Swarnapali (2014) used ROA to show the
ability of a bank to generate profits from bank assets and ROE to show the return to
shareholders on their equity. Sufian and Kamarudin (2012) used these same ratios to show
performance of Bangladeshi banks, Frederick (2014) in his study in Uganda, Ongore and
Kusa (2013) on banks in Kenya as well as others such as Trujillo-Ponce, (2012);

13
Davydenko (2011); Sehrish et al. (2011); Oladele et al. (2011); Goaied (2008); and
Kosmidou (2008), according to Frederick (2014).
2.2.3 Market Power Theory
In the late 1980s, researchers took an interest to banks and studies on the performance of
banks started with the application of two industrial organizations models: the Market Power
and Efficiency Structure theories (Athanasoglou, Brissimis, & Delis, 2008). As such,
studies focused on the relationship between market structure and bank profitability. The
Portfolio theory, developed later, has also provided more insight to the study of bank
profitability (Atemnkeng & Nzongang, 2006).
The Market Power theory proposes that the market structure of the industry has a significant
impact on the performance of banks. Olweny and Shipho (2011) report that there are two
approaches associated with the Market Power theory namely the Structure Conduct
Performance (SCP) and the Relative Market Power (RMP) hypotheses.
The SCP hypothesis can be described as the relationship between market structure, firm
conduct and firm performance. Baye (2010) explains that the structure of an industry may
include technology, concentration, and market conditions while conduct refers to factors
such as the pricing decisions, advertising decisions, and R&D decisions made by firms in
a market and performance is the profits and social welfare generated. Athanasoglou et al.
(2008) suggest that in this case, increased market power yields monopoly profits and
Olweny and Shipho (2011) add that concentration in the banking market may lead to bank
market power which can result in higher profits.
According to Berger (1995), barriers to entry into an industry influence a firm’s profitability
in that higher costs of entry help existing firms maintain monopoly profits, as new entrants
would shrink the profits. Market concentration, thus, reduces the cost of collusion between
existing banks leading to higher profits. Olweny and Shipho (2011) report that banks in
more concentrated markets can collude and charge higher loan rates while paying lower
deposit rates and end up making abnormal profits, more than those banks operating in less
concentrated markets, regardless of their efficiency.
The RMP hypothesis, on the other hand, states that bank profitability is influenced by
market share and proposes that only large banks with differentiated products can control

14
prices and grow their profits. They are able to exercise market power and gain monopoly
profits whereas firms with smaller market shares operate as if under perfect competition
and cannot earn the same supernormal profits (Olweny & Shipho, 2011 and Berger, 1995).
The Structure Conduct Performance has been the most studied of the two Market Power
hypotheses mainly testing the relationship between profitability and concentration
measures. Earlier empirical works include Mason (1939) and Bain (1951) who observed
that profits of firms operating in highly concentrated industries are significantly higher than
that of firms in industries with lower concentration (Seelanatha, 2010). The study by
Kaufman (1966) on the banking market in Iowa also found the concentration level of the
market to be positively but not strongly related to bank performance. More recently Fu and
Heffernan (2005) studied the market structure of the Chinese banking structure and
observed results in favour of the RMP hypothesis. A study by Seelanatha (2010), however,
found that the traditional SCP approach is not held in the banking industry in Sri Lanka and
the banks performance does not depend on either market concentration or market power of
individual banks but on efficiency.
2.2.4 Ownership Structure
Literature on ownership structure as a determinant for the financial performance of banks
mainly compares privately owned banks and public banks. Nouaili et al. (2015) mention
that most researchers find public banks to be “less powerful” than private banks, although
Onuonga (2014) observes that researchers investigating the influence of government and
private ownership on bank performance have presented contradicting results.
Dietrich and Wanzenried (2011) concurred that public banks in Switzerland do not perform
as well as private banks. However, the global financial crisis may have changed this as
government owned banks are viewed as safer and better managed than private institutions
which could lead to better performance. Cornett, Guo, Khaksari & Tehranian (2009), in
their study of the impact of state ownership on performance differences in privately-owned
and state-owned banks, also found that government owned banks operated less profitably
than private banks due to the fact that they give out riskier loans, which adds to their credit
risk and bad solvency ratios. Larger differences in performance were noted in countries
where the government was heavily involved and where political corruption existed in the
banking system. Bonin, Hasan and Wachtel (2004), on the other hand, find no significant

15
negative connection of either government or private ownership on the financial
performance of commercial banks.
Some researchers also observe a difference in performance of domestic and foreign
commercial banks. In justification for the higher profitability enjoyed by foreign banks,
Flamini et al. (2009) state that foreign banks in Sub-Saharan Africa mainly serve the service
sector which leaves local banks to provide funds to riskier sectors such as agriculture and
infrastructure. Also, foreign banks limit exposure to credit risk by offering loans usually
for less than one year which may be favourable in terms of profitability.
According to Athanasoglou et al. (2008), in developing countries such as Kenya, foreign
ownership has a positive and significant impact on financial performance of banks because
they end up gaining in terms of improved technology, risk management expertise, new
knowledge on corporate governance as well as competitive advantage. Flamini et al. (2009),
however, in their study found foreign ownership not to have a significant impact on bank
profits due to higher informational disadvantages which counter the positive effects of
better technology and efficiency.
2.3 The Effect of Asset Quality on Financial Performance of Commercial Banks
2.3.1 Bank Loans
Commercial banks possess many types of assets, current or fixed, but the asset contributing
to the largest share of a bank’s income is the bank loan (Ongore & Kusa, 2013). Echeboka
et al. (2014) stress that the quality of a bank’s assets is influenced by the bank’s exposure
to specific risks, the trends in non-performing loans and the financial health of bank
borrowers. The quality of loans is then crucial to the success of banks as poor asset quality
is said to be one of the main causes of bank failures.
Although banks are required to set up reserves for bad debts, banks are at high risk of
incurring losses as a result of bad loans which makes non-performing loan (NPL) ratios the
best proxies for asset quality. Altan et al. (2014) also assert the need for asset quality
analysis is to determine the amount of non-performing assets as a percentage of the total
assets. Asset quality of a commercial bank is thus mainly observed on the basis of the
bank’s ability to recover its outstanding loans and advances in due time and this is shown
by the percentage of bad debts to total gross loans issued (Kabir & Dey, 2014).

16
Quality of the loan portfolio has a direct impact on bank profitability, according to Ongore
and Kusa (2013), and non-performing loans should be monitored and kept as low as
possible using appropriate strategy and policies. Therefore the lower the percentage of
NPL to total loans the better the bank’s financial performance. Many studies seem to agree
with this generalization.
Muhman and Hashim (2015), for instance, find that as loan loss provisions decrease, bank
performance increases and that an increase in assets financed by loans leads to an increase
in bank profitability, thus concluding that asset quality has a significant association with
performance of banks in Malaysia. Sangmi and Nazir (2010) find asset quality to have a
significant impact on performance of banks in India and concluded that a low ratio of NPL
to total loans is associated with a financially sound bank portfolio. Ongore and Kusa (2013)
found the NPL ratio to have a strong negative relationship with bank profitability showing
that poor asset quality was associated with poor commercial bank performance in Kenya.
Kosmidou (2008) also concluded that poor asset quality has a negative effect on bank
profitability as it pulls down interest income revenue and adds to provision cost.
Findings from Frederick’s (2014) study show that asset quality and credit risk has a
significant negative impact on the profitability of commercial banks for the relevant period.
It is concluded that poor quality of loans can result in higher loan loss provisions, thus reducing bank profits. Asset quality has a positive relationship with bank efficiency
meaning that banks should keenly monitor their assets and employ credit risk management
systems.
2.3.2 Credit Risk
Literature explains credit risk using the loan loss provision to total loans ratio. It is usually
negatively related to profitability ratios. Nouaili et al. (2015) explain the theory of balanced
markets which predicts that banks which manage their credit risk successfully are at an
advantage because a strong relationship between risk and profitability exists. A higher ratio
of loan loss provision to total asset may be an indicator of loans with poor quality or poor
loan portfolio management which negatively impact profitability of a bank (Rao & Lakew,
2012). Thus banks are more likely to achieve high performance by maintaining or reducing
credit exposure.
Monitoring credit risk policies regularly and setting strategies which predict future levels
of risk can assist banks in maintaining a low risk index. Rao and Lakew (2012) emphasize

17
that major banking problems can be traced back to failure of financial institutions to identify
impaired assets and set up reserves for writing off these assets.
Onuonga (2014) reports that some researchers use the ratio of loans to assets to measure
credit risk. In this case, the higher the ratio, the higher the number of loans granted which
increases chances of default or credit risk. It is explained that a bank’s lending rate is
normally higher than its deposit rate and thus when more deposits are transformed into
loans, larger interest margin and profits are expected. Banks will usually increase their
margins on interest on loans in order to make up for the higher credit risk assumed, which
in turn increases the NIM and bank profits (Onuonga, 2014). This shows a positive
relationship between credit risk and bank performance. Flamini et al. (2009) also predict a
positive association between credit risk and bank earnings, based on standard asset pricing
arguments.
In their study on Ethiopian banks, Rao and Lakew (2012) find that there is a negative loan
loss provision to total loans ratio and recommend that the commercial banks should increase
efforts in credit risk management. Olweny and Shipho (2011) also find a strong and
negative association between credit risk and bank performance, stating that banks which do
not manage their credit loans are likely to be less profitable than those which monitor asset
quality.
However, Flamini et al. (2009) find that credit risk has a positive and significant impact on
profitability and conclude that risk-averse shareholders seek risk adjusted returns and larger
earnings to compensate higher credit risk. Onuonga (2014), using the loans to assets ratio
found a positive relationship with bank profitability, observing a 0.02% increase in profits
when the ratio goes up by 1%, for banks in Kenya. Swarnapali (2014), on the other hand,
conducted research on banks in Sri Lanka and found no statistically significant relationship
between credit risk ratio and bank performance.
2.3.3 Inflation
Inflation can be measured by the consumer price index (CPI) growth rate and reflects the
annual percentage change in the cost of purchasing a basket of goods and services for a
given period, according to Kiganda (2014). Inflation may have direct effects on bank
performance such as through an increase in the price of labour, and indirect effects such as
changes in interest rates and asset prices (Sufian & Kamarudin, 2012).

18
The degree to which inflation can affect the performance of commercial banks depends on
whether bank management can fully and correctly predict future fluctuations in inflation
which according to Frederick (2014) and Flamini et al. (2009), allows banks to adjust
interest rates in order to profit. Unexpected movements in inflation lead to a faster increase
of bank costs than bank incomes due to banks’ slow reaction in adjusting interest rates,
which thus has an adverse effect on bank performance (Rao & Lakew, 2012).
Many authors such as Rao and Lakew (2012), Frederick (2014), Flamini et al. (2009),
Athanasoglou et al. (2008) as well as Dietrich and Wanzenried (2011) conducted studies
on the effect of inflation on bank performance and found a positive and significant
relationship. For this positive relationship, they offer the explanation that bank managers
were able to forecast fully or not, future movements in inflation and thus to change interest
rates accordingly to generate more revenue (Athanasoglou et al., 2008).
Other studies, however, such as those by Nouaili et al. (2015), Ongore and Kusa (2013),
Sufian and Kamarudin (2012) as well as Naceur and Kandil (2009) reveal different results,
that inflation has a negative impact on the bank returns. The rationale for this negative
relationship as described in Nouaili et al. (2015) is that inflation can lead to a reduction in
the demand for loans as it increases uncertainty for the future. Low demand for credit results
in fewer loans issued and thus lower bank returns.
2.3.4 Business Cycles
The growth in Gross Domestic Product (GDP) is used in this case as the proxy for business
cycles or economic development. It is one of the main macroeconomic indicators used to
measure the health of a country’s economy, and it is a measure of the overall economic
output in a country for a given period, usually a year (Rao & Lakew, 2012). GDP is used
to monitor changes in bank profitability caused by changes in business cycles which are
known to have an impact on supply and demand for loans and deposits (Obamuyi. 2013).
The variable is expected to affect performance of commercial banks positively. In a period
with slow GDP growth and especially during recessions, the quality of loans worsens
leading to increased defaults and reducing bank profits (Flamini et al., 2009). In such a
cycle, demand for credit is low and lending tends to go down because such periods are
associated with increased risk (Athanasoglou et al., 2008). Obamuyi (2013) explains that
an increase in economic activities, on the other hand, indicates that customer demand for

19
loans may increase, and with improved lending activities, banks are able to increase their
profits. So a higher GDP can be a sign of potentially profitable business opportunities from
which a bank can generate more revenue.
Nouaili et al. (2015) agree that growth in GDP has a positive relationship with bank
performance in their findings based on Tunisian banks and conclude that the banks took
advantage of the changes made in the financial sector in Tunisia. Obamuyi (2013) finds a
significant and positive effect of GDP on bank profitability in Nigeria. Dietrich and
Wanzenried (2014) and Zhang and Dong (2011) also have similar findings. Kiganda (2014)
in his study on Equity Bank in Kenya finds that economic growth has a positive effect on
the bank’s profitability but statistically insignificant.
Sufian and Kamarudin (2012) surprisingly found a negative but significant relationship
between economic growth and bank performance is negative and significant. He elaborates
that although demand for financial services increases with a growing economy and as
societies become wealthier, the high volatility in economic growth in Bangladesh for the
relevant period of study could have caused the lower demand for financial services and
increased loan defaults experienced. Ongore and Kusa (2013), however, reach the
conclusion that GDP has an insignificant relationship with bank performance in Kenya.
Flamini et al. (2009) and Rao and Lakew (2012) also had similar results in their studies.
Nouaili et al. (2015) explain that many studies relating macroeconomic factors and bank
performance find a positive relationship as a period of strong growth leads to an increase
in investment and consumption, resulting in more credits and thus improved bank
profitability.
2.4 The Effect of Management Efficiency on Financial Performance of Commercial
Banks
2.4.1 Bank Management
“Sound management is the most important pre-requisite for the strength and growth of any
financial institution” (Nimalathasan, 2008). Management quality is described by Echeboka
et al. (2014) as the ability for managers to determine and control the risks involved in a
bank’s activities and to ensure compliance with regulation in the efficient implementation
of banking activities. Management is usually responsible for making important decisions

20
in an organisation and is also responsible for setting the vision and objectives which focus
a firm’s activities (Altan et al., 2014) and so it is with reason that management efficiency
is considered by many to be a crucial element of the CAMEL rating system. Management
competency which refers to managers with high integrity, professional competence and
quality of service, according to Muhmad and Hashim (2015), can result in stable profit for
commercial banks.
Management efficiency, although it is often expressed qualitatively, can be measured using
financial ratios as proxy for factors such as efficient use of resources, income maximization,
reduced operating costs (Sangmi & Nazir, 2010). Operating profit to total income (revenue)
ratio is a popular ratio according to Mohiuddin (2014), which shows income generation by
management as well as the ratio of operating expenses to total asset which is expected have
a negative impact on bank profitability. Sufian and Kamarudin (2012) explain that the ratio
can provide details about the non-interest expenses of a bank such as the amount of wages
and salaries, cost of running branch and office facilities. Reduced expenses show an
efficient management and tend to improve the profitability of commercial banks. Literature
provides other ratios including credit to deposit ratio, asset utilization ratio, diversification
ratio, earnings per employee ratio and expenditure per employee ratio (Echeboka et al.,
2014).
Nasserinia, Ariff and Fan-Fah (2014) state that bad management increases the chances of a
bank failing and the findings from various studies tend to concur. Ongore and Kusa (2013),
in their study, concluded that management efficiency represented by operating profit to
total income ratio has a significant impact on the performance of commercial banks.
Nasserinia et al. (2014) studied commercial banks in Japan and results indicated that
managerial efficiency in terms of operating expenses to total asset has a positive
relationship with profitability ratios. They concluded that low bank returns can be a signal
of poor management practices. Athanasoglou et al. (2008) found that operating expenses
are negatively and strongly associated with profitability showing that management
decisions on costs affect Greek bank performance. Frederick (2014) conducted a study on
banks in Uganda and found operating expenses to have a negative impact on profitability
showing that efficient cost management is crucial for better financial performance of banks.
Obamuyi (2013) and Rao and Lakew (2012) had similar results whereas Muhmad and
Hashim (2015), Echeboka et al. (2014) and Sufian and Kamarudin (2012) reported
opposing results.

21
2.4.2 Efficiency Structure Theory
The Efficiency Structure theory asserts that bank performance is not determined by the
market concentration but by bank efficiency. This theory is also made up of two distinct
hypotheses, namely X-efficiency and Scale–efficiency (Olweny & Shipho, 2011).
According to the X-efficiency hypothesis, a bank which operates more efficiently than its
competitors can be more profitable due to lower operational costs. Such firms tend to gain
larger market shares and thus higher market concentration, however it is argued that
concentration alone should not lead to increased profitability (Olweny & Shipho, 2011).
Athanasoglou et al. (2008) argue that with other factors held constant, the impact of
concentration on profitability should be negligible. Thoraneenitiyan (2010) discusses that
banks with better management and practices will be better at controlling costs and earning
profits, thus “moving the bank closer to the best-practice, lower bound cost curve.”
The Scale-efficiency hypothesis states that some banks achieve better scale of operation
and thus lower costs resulting in higher profit and faster growth for the banks
(Thoraneenitiyan, 2010). The scale approach focuses on economies of scale rather than
efficiency gained through good management or production technology, according to
Olweny & Shipho (2011), as larger firms can obtain lower unit cost and higher profits
through economies of scale. Larger firms can then take advantage of greater market shares,
and thus higher concentration and then increased profitability.
Seelanatha (2010) summarises that in the case of the Efficient Structure approach, the
aggressive behavior of efficient firms in the market may lead to the creation of larger firms
and a greater market share. Firms can maximize profits by maintaining their prices and
firm sizes unchanged or by reducing prices and expanding the firm size.
According to Berger (1995), previous analysis of the Market Power theories did not
consider the effects of the Efficient Structure and which motivated him to conduct a test
based on all four hypotheses. His results showed evidence supporting only the Relative
Market Power and X-efficiency hypotheses. Smirlock (1985) verified the Efficient
Structure hypothesis in his study analysing over 2700 banks and found no relationship
between market concentration and bank profitability, but detected a significant positive
relationship between bank profitability and market share. Byeongyong and Weiss (2005)
found in favour of the Efficient Structure theory concluding that regulators should put more
emphasis on ways for firms to achieve efficiency rather than market power. Yu and Neus
22
(2005) found evidence supporting positive scale efficiency suggesting that firms can
achieve better performance by taking advantage of economies of scale (Seelanatha. 2010).
Kamau and Were (2013), in their study, present findings which indicate that superior
performance in the Kenyan banking sector can be due to structure and collusive power and
not efficiency hence supporting the SCP hypothesis. They reject the Xefficiency hypothesis
and Scale-efficiency hypothesis.
Kamau and Were (2013) discuss policies that banks can adopt, which would be appropriate
for the theories mentioned. Those which find in favor of the Market Power theory would
advocate for policies that encourage mergers, in order to achieve larger market share and
thus improved profitability while the proponents of Efficient Structure theory would
support policies that can increase efficiency and productivity which may lead to greater
profitability.
2.4.3 Portfolio Theory
In a study by Atemnkeng and Nzongang (2006), another more relevant approach is
identified. The balanced Portfolio theory suggests that the contents of a bank portfolio,
together with, its profit and the return to shareholders can be due to policy decisions.
According to Ongore and Kusa (2013), these can be influenced by many factors including
the rates of return on all assets in the portfolio, the risks involved with the financial assets
as well as the size of the portfolio.
The implication here becomes that portfolio diversification and the desired portfolio
composition of commercial banks can be as results of the decisions by the bank
management. Atemnkeng and Nzongang (2006) assert that the assets and liabilities chosen
by the management as well as the unit costs incurred to make each component of the assets
will determine the firm’s ability to earn high profits.
Sinkey (1975) observed the characteristics of problem banks. He proposed that various
factors, both financial and operational, could be useful in checking the financial health of a
bank and diagnose its main problems. These factors included assets composition and others
such as loan characteristics, capital adequacy, sources and uses of revenues, efficiency and
profitability.
Hayden, Porath and von Westernhagen (2006) found opposing evidence in their study
which assessed bank profitability and portfolio diversification across different industries,

23
broader economic sectors and geographical regions by examining individual bank loan
portfolios of 983 German banks. The results indicate that there are no significant
performance benefits associated with diversification as each type of diversification tends to
reduce the banks’ returns. It is also found that the impact of diversification depends strongly
on the risk level. Evidence showed that only for moderate risk levels and in the case of
industrial diversification does diversification significantly improve banks’ returns.
According to Ongore and Kusa (2013), it can be deduced from the theories discussed, that
commercial bank performance is influenced by both internal and external factors to. The
Market Power theory mainly explains bank profitability as a function of external market
factors whereas the Efficiency Structure theory and the Portfolio theory assert that the
financial performance of banks is dependent on internal efficiencies and management
decisions (Olweny & Shipho, 2011).
2.4.4 Cost of Operations
According to Frederick (2014), costs of operations are controllable expenses which can
only have a positive impact on performance of commercial banks when they are managed
well. Operating costs of a bank are usually expressed as a percentage of profits and are
known to have a negative relationship with bank performance (Swarnapali, 2014), however
improved management of these expenses can increase efficiency and lead to higher profits.
This percentage is also widely known as a measure of efficiency in financial performance
literature as well as from the efficiency theory (Onuonga, 2014). Thoraneenitiyan (2010)
discusses that banks with better management and practices will be better at controlling costs
and earning profits, thus “moving the bank closer to the bestpractice, lower bound cost
curve.”
Flamini et al. (2009) explain that although the impact of operation costs on earnings may
seem obvious, meaning that high expenses lead to reduced profits; this may not always be
the case. The rationale for this is that higher costs may imply higher volume of banking
activities and in turn higher revenues. In less competitive markets, where banks enjoy
market power, costs can be passed on to customers and this would then create a positive
correlation between overheads costs and profitability.
Obamuyi (2013), in his study, finds that operating expenses have a negative and significant
impact on the profitability of banks in Nigeria and suggests that in order to improve
performance, banks must actively and efficiently manage costs. Rao and Lakew (2012) also
24
observed similar results in their study on banks in Ethiopia suggesting that more efficient
commercial banks reported higher profits than those with poor expense management in the
period of study as well as the fact that a reduction in costs can boost bank profits. Some
other studies, however, Naceur (2003) in Tunisia and Guru et al. (2002) in Malaysia found
contradictory results concluding that expenses may have a positive impact on profits and
suggesting that banks can transfer high operating costs to depositors and borrowers and also
that expenditure on salaries and wages may be justified when higher profits are achieved
(Onuonga, 2014).
2.5 Chapter Summary
This chapter has detailed the review of relevant literature relating to the financial
performance of commercial banks. Three major issues have been discussed including
capital adequacy, asset quality, management and how they relate to bank performance.
Chapter three presents the methodology that was used in this study.

25
CHAPTER THREE
3.0 RESEARCH METHODOLOGY
3.1 Introduction
This chapter explains the methodology that the researcher employed in this study. It also
describes the research design, the population, sampling design, data collection methods,
research procedures and data analysis methods that were used in this study.
3.2 Research Design
Research design is the strategy for a study and the plan by which the strategy will be
implemented. Cooper and Schindler (2014) define it as the blueprint for fulfilling research
objectives and answering research questions while Saunders, Lewis and Thornhill (2012)
describe it as the framework for meeting research objectives and providing reasons for
choice of data sources, collection method and analysis techniques.
In this study, the researcher used descriptive research survey design. Descriptive research
involves collecting data that answers questions about the participants of the study. It is
appropriate when the researcher wishes to provide an accurate representation of persons,
events or situations, according to Saunders et al. (2012), and make inferences about the
target population. This study design helps the researcher report situations as observed and
produce statistical information which can be useful to various stakeholders in their decision
making process.
3.3 Population and Sampling Design
3.3.1 Population
Cooper and Schindler (2014) write that population refers to the gathering of all elements
about which the research wishes to make inferences. Saunders et al. (2012) explain that the
population is the full set of cases or items from which an appropriate sample is taken to
study. A population element, however, is the individual item on which measurement is
taken, according to Cooper and Schindler (2014). For this study, the target population or
those cases that contain the desired information consists of the 10 commercial banks listed
on the Nairobi Securities Exchange from 2010 to 2014.
26
3.3.2 Sampling Design
3.3.2.1 Sampling Frame
According to Cooper and Schindler (2014), the sampling frame is a list of elements from
which the sample will be collected and it is closely associated to the population. From the
sampling frame the required number of subjects, respondents, elements and firms are
selected in order to make a sample, so it is important that the sampling frame is unbiased,
current and accurate (Saunders et al., 2012). This study surveyed all 10 banks listed on NSE
which make up the sampling frame. This is the entire population of the study.
3.3.2.2 Sampling Technique
A sampling technique explains how cases are to be selected from the population, for
observation. Saunders et al. (2012) note that there are two types of sampling techniques,
probability sampling and non-probability sampling. Probability sampling, which includes
random sampling and cluster sampling designs for example, is often preferred as it applies
random selection in order for all cases in the population to have an equal probability or
chance of being selected. Unlike, non-probability sampling such as purposive and
convenience designs, probability sampling reduces sampling bias.
This study targeted all the banks quoted on the NSE during the relevant period and as they
are only 10 banks, a census was done in order to provide a true measure of population. As
a result no sampling technique was necessary because the research employed the entire
population.
3.3.2.3 Sample Size
A sample is a group of cases consisting of a portion of the target population that the
researcher carefully selects for analysis in order to determine facts about that population
(Schindler & Cooper, 2014). The larger the population size, the smaller the percentage of
the population required to get a representative sample, however Schindler and Cooper
(2014) advise that the greater the desired precision of the estimate, the larger the sample
should be. This study surveyed all the banks listed on the Nairobi Securities Exchange for
the period of 2010 to 2014, in order to examine the factors affecting financial performance

27
of commercial banks in Kenya. The sample of this study is therefore the 10 commercial
banks listed on NSE.
Table 3.1: Sample Size Distribution Table
Population Sample % Sampled
10 banks 10 banks 100%
3.4 Data Collection Methods
The researcher used secondary data sources. Secondary data refers to data that was
originally collected for another purpose but can be further analysed to provide different
knowledge and new conclusions (Saunders et al., 2012). It may be obtained within an
organisation or from sources outside the organisation. Secondary data for this study was
obtained from financial statements and other records maintained by the banking regulator,
Central Bank of Kenya (CBK) as well as from the websites of the relevant banks. Data
relevant to measuring the required ratios for analysis was obtained from these reports for
the period of 5 years from 2010 to 2014.
3.5 Research Procedures
Research procedures refer to the actions that the researcher took to collect the type of data
identified as crucial for the study. The secondary data was collected from Central Bank of
Kenya statistics and from the websites of the specific banks. These websites contained
enough accurate secondary data – specifically for the dependent variables, Return on Assets
(ROA) and Return on Equity (ROE) as well as data for the ratios of capital adequacy, asset
quality and management efficiency – which were subjected to analysis.
3.6 Data Analysis Methods
The data analysis in this study involved the use of descriptive and inferential statistics in
order to help the researcher establish the relationship between the 3 independent variables
and the dependent variables (ROA and ROE) representing bank performance. The
independent variables include Capital Adequacy Ratio expressed as % Total Capital to
Risk-Weighted Assets, Asset Quality expressed as % Non-Performing Loans to Gross
Loans, and Management Efficiency expressed as % Operating Profit to Total Income. The
dependent variables include Return on Assets expressed as % Profit after Tax to Total
Assets and Return on Equity expressed as % Profit after Tax to Shareholder’s Equity.

28
Descriptive statistics refer to methods of organizing and summarizing data, for this study
frequencies and percentages as well as measures of central tendency (means) and dispersion
(standard deviation) were used. Data was also organised into graphs and tables for easy
reference and better communication.
Inferential statistics refer to methods of drawing conclusions from sample data about a
population. For this study, regression and correlation analysis were used to determine both
the nature and the strength of the relationship between two variables. Correlation analysis
is usually used together with regression analysis to measure how well the regression line
explains the variation of the dependent variable. The regression and correlation analyses
were based on the association between two (or more) variables. SPSS and Excel were the
analysis tools used in this study.
3.7 Chapter Summary
This chapter has presented the research methodology including the research design,
population and sampling design, data collection methods and research procedures as well
as data analysis methods. The chapter reveals that the researcher used a descriptive study
design based on the research questions as well as descriptive and inferential statistics to
analyse the data. The chapter also highlights the target population which includes all the
banks listed on the Nairobi Securities Exchange from 2010 to 2014. The next chapter,
Chapter 4, presents the results and findings of the study.
CHAPTER FOUR
4.0 RESULTS AND FINDINGS
4.1 Introduction
This chapter provides an analysis, interpretation and discussion of the findings on the
factors affecting financial performance of commercial banks listed on the NSE. It presents
the descriptive information on the study variables namely; Return on Assets (ROA), Return
on Equity (ROE), Capital Adequacy, Asset Quality and Management Efficiency as well as
highlights the relationships between financial performance and the specified CAMEL
factors.
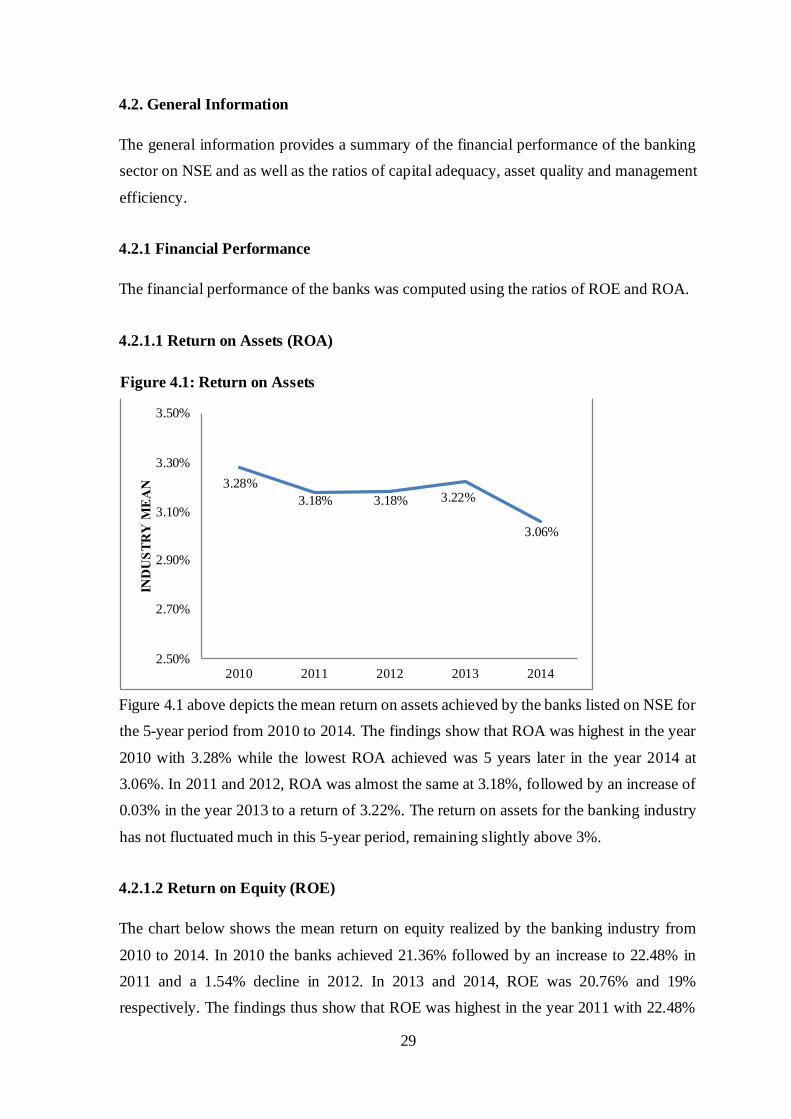
29
4.2. General Information
The general information provides a summary of the financial performance of the banking
sector on NSE and as well as the ratios of capital adequacy, asset quality and management
efficiency.
4.2.1 Financial Performance
The financial performance of the banks was computed using the ratios of ROE and ROA.
4.2.1.1 Return on Assets (ROA)
Figure 4.1 above depicts the mean return on assets achieved by the banks listed on NSE for
the 5-year period from 2010 to 2014. The findings show that ROA was highest in the year
2010 with 3.28% while the lowest ROA achieved was 5 years later in the year 2014 at
3.06%. In 2011 and 2012, ROA was almost the same at 3.18%, followed by an increase of
0.03% in the year 2013 to a return of 3.22%. The return on assets for the banking industry
has not fluctuated much in this 5-year period, remaining slightly above 3%.
4.2.1.2 Return on Equity (ROE)
The chart below shows the mean return on equity realized by the banking industry from
2010 to 2014. In 2010 the banks achieved 21.36% followed by an increase to 22.48% in
2011 and a 1.54% decline in 2012. In 2013 and 2014, ROE was 20.76% and 19%
respectively. The findings thus show that ROE was highest in the year 2011 with 22.48%
Figure 4.1: Return on Assets
3.28 % 3.18 % % 3.18 3.22 %
% 3.06
2.50 %
2.70 %
% 2.90
% 3.10
% 3.30
% 3.50
2010 2011 2012 2013 2014
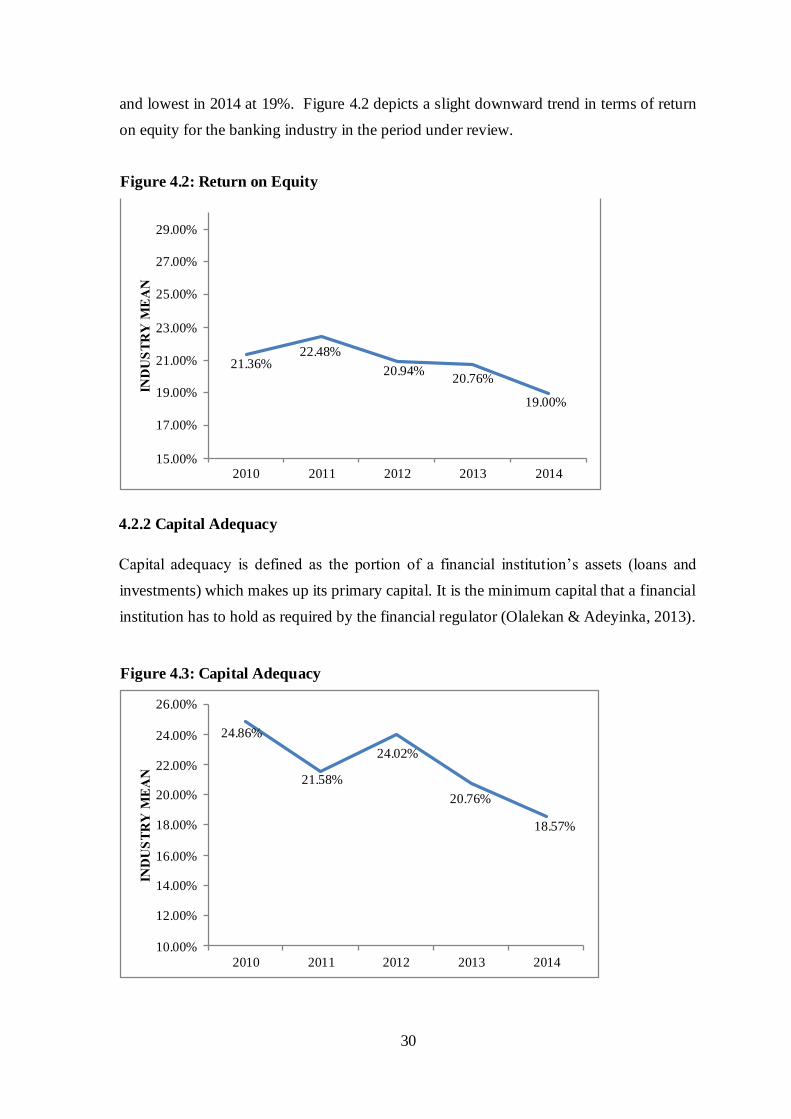
30
and lowest in 2014 at 19%. Figure 4.2 depicts a slight downward trend in terms of return
on equity for the banking industry in the period under review.
4.2.2 Capital Adequacy
Capital adequacy is defined as the portion of a financial institution’s assets (loans and
investments) which makes up its primary capital. It is the minimum capital that a financial
institution has to hold as required by the financial regulator (Olalekan & Adeyinka, 2013).
Figure 4.2: R eturn on Equity
21.36 % 22.48 %
20.94 % 20.76 %
19.00 %
15.00 %
17.00 %
19.00 %
% 21.00
% 23.00
% 25.00
% 27.00
% 29.00
2010 2011 2012 2013 2014
Figure 4.3: Capital Adequacy
24.86 %
% 21.58
24.02 %
% 20.76
18.57 %
10.00 %
12.00 %
14.00 %
16.00 %
18.00 %
20.00 %
22.00 %
% 24.00
% 26.00
2010 2011 2012 2013 2014

31
Figure 4.3 shows the mean capital adequacy realized by the banks listed on NSE from 2010
to 2014. In 2010 the banks achieved 24.86%, followed by a decrease to 21.58% in 2011
and a 2.44% increase in 2012. In 2013, capital adequacy went down by 3.26% to 20.76%
followed by a further decline in 2014 of 2.19%. The findings show that capital adequacy
was highest in the year 2010 with 24.86% and lowest in 2014 at 18.57%.
Capital adequacy for the banking industry has shifted often in this 5-year period.
4.2.3 Asset Quality
Asset quality of a commercial bank is observed on the basis of the bank’s ability to recover
its outstanding loans and advances in due time and this is shown by the percentage of bad
debts or non-performing loans to total gross loans issued (Kabir & Dey, 2014).
Figure 4.4: Asset Quality
% 4.37
3.21 %
3.73 %
% 4.77 % 5.06
0.00 %
1.00 %
2.00 %
3.00 %
4.00 %
% 5.00
% 6.00
7.00 %
2010 2011 2012 2013 2014

32
Figure 4.4 above illustrates the asset quality in terms of mean non-performing loans to gross
loans of the banking industry for the period of 2010 to 2014. In 2010, the ratio was 4.37%
and decreased to 3.21% in 2011. The ratio of non-performing loans to gross loans increased
between 2011 and 2014, with 3.21% in 2011, 3.73% in 2012, 4.77% in 2013 and finally
5.06% in 2014. The findings show that asset quality was best in 2011 with a low ratio of
3.21% and poorest in 2014 with the highest ratio of 5.06%. The chart above indicates an
increasing trend in terms of non-performing loans to gross loans ratio meaning the asset
quality of commercial banks has been deteriorating in the period under review.
4.2.4 Management Efficiency
An efficient management refers to managers with high integrity, professional competence
and quality of service, according to Muhmad and Hashim (2015), which can result in stable
profit for commercial banks. Operating profit to total income (revenue) ratio is a popular
ratio for management efficiency (Mohiuddin, 2014).
Figure 4.5: Management Efficiency
83.65 %
81.50 %
% 70.93
79.17 % 77.13 %
60.00 %
65.00 %
70.00 %
75.00 %
% 80.00
% 85.00
2010 2011 2012 2013 2014

33
Figure 4.5 illustrates the trend in management efficiency of the banking industry for the
period of 2010 to 2014. In 2010 the banks achieved 83.65%, followed by a slight decrease
to 81.50% in 2011. A major decrease of 10.53% was experienced in 2012 with 70.93%,
however, the ratio of operating income to total income shot back up to 79.17% in 2013.
Management efficiency achieved in 2014 was 77.13%. The findings show that management
efficiency was highest in the year 2010 with 83.65% and lowest in 2012 at 70.93%.
Management efficiency has not been stable for the banking industry in the 5-year period,
with sharp movements in 2012 and 2013.
4.2.5 Descriptive Statistics
Table 4.1: Descriptive Statistics
N Minimum Maximum Mean
Std.
Deviation
ROA 5 3.06% 3.28% 3.18% 0.08%
ROE 5 19.00% 22.48% 20.91% 1.26%
CA 5 18.57% 24.86% 21.96% 2.54%
AQ 5 3.21% 5.06% 4.23% 0.76%
ME 5 70.93% 83.65% 78.48% 4.88%
Table 4.1 above provides a summary of the descriptive statistics for the dependent and
independent variables. It represents the variables of the 10 commercial banks listed on the
NSE for the period of 2010 to 2014.
The findings show that return on assets (ROA) had an overall mean value of 3.18% and a
standard deviation of 0.08% for the relevant period. The highest ROA achieved was
3.28% and the lowest 3.06%. The overall mean in terms of return on equity (ROE) was
20.91% with a standard deviation of 1.26%. Capital adequacy (CA) had a mean of 21.96%
and a standard deviation 2.54%; asset quality (AQ) had a mean of 4.23% and a standard
deviation of 0.76% while management efficiency (ME) had a mean value of
78.48% and a standard deviation of 4.88%.
4.3 Effect of Capital Adequacy on Financial Performance of Commercial Banks
4.3.1 Correlation Analysis
The data collected was analysed and used to generate the Pearson correlation coefficient
which tests whether an association between the relevant variables exists or not. The strength
of the association is measured based on the Pearson’s correlation scale where a value in the
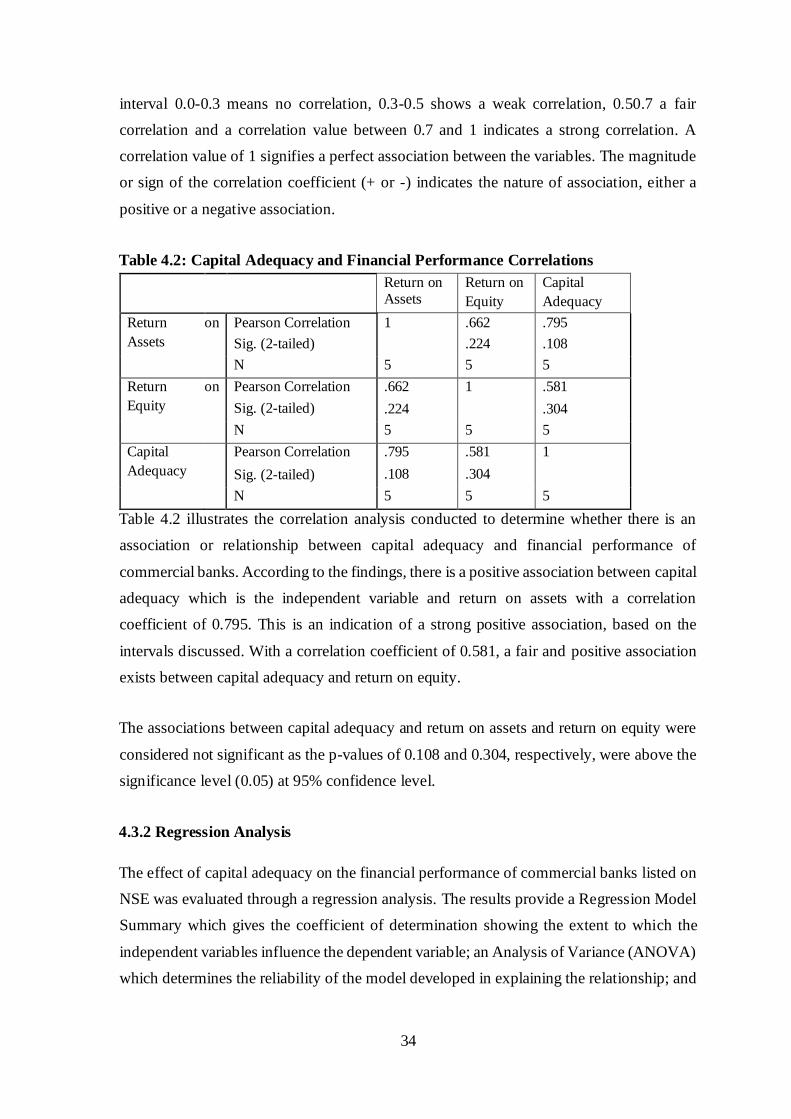
34
interval 0.0-0.3 means no correlation, 0.3-0.5 shows a weak correlation, 0.50.7 a fair
correlation and a correlation value between 0.7 and 1 indicates a strong correlation. A
correlation value of 1 signifies a perfect association between the variables. The magnitude
or sign of the correlation coefficient (+ or -) indicates the nature of association, either a
positive or a negative association.
Table 4.2: Capital Adequacy and Financial Performance Correlations
Return on
Assets Return on
Equity
Capital
Adequacy
Return
Assets
on Pearson Correlation
Sig. (2-tailed)
1
.662
.224
.795
.108
N 5 5 5
Return
Equity
on Pearson Correlation
Sig. (2-tailed)
.662
.224
1
.581
.304
N 5 5 5
Capital
Adequacy Pearson Correlation
Sig. (2-tailed)
.795
.108
.581
.304
1
N 5 5 5
Table 4.2 illustrates the correlation analysis conducted to determine whether there is an
association or relationship between capital adequacy and financial performance of
commercial banks. According to the findings, there is a positive association between capital
adequacy which is the independent variable and return on assets with a correlation
coefficient of 0.795. This is an indication of a strong positive association, based on the
intervals discussed. With a correlation coefficient of 0.581, a fair and positive association
exists between capital adequacy and return on equity.
The associations between capital adequacy and return on assets and return on equity were
considered not significant as the p-values of 0.108 and 0.304, respectively, were above the
significance level (0.05) at 95% confidence level.
4.3.2 Regression Analysis
The effect of capital adequacy on the financial performance of commercial banks listed on
NSE was evaluated through a regression analysis. The results provide a Regression Model
Summary which gives the coefficient of determination showing the extent to which the
independent variables influence the dependent variable; an Analysis of Variance (ANOVA)
which determines the reliability of the model developed in explaining the relationship; and

35
finally the Regression Coefficient which explains the extent to which the independent
variables influence the dependent variable.
4.3.2.1 The Effect of Capital Adequacy on ROA
Table 4.3: Regression Model Summary – Capital Adequacy and ROA
Model R R Square
Adjusted R Square
Std. Error of the Estimate
1 .795a .631 .508 .0564449
a. Predictors: (Constant), Capital Adequacy
The R Square value of 0.631, in Table 4.3, shows that capital adequacy explains 63.1% of
the banking industry’s return on assets. This is also means that some other factors which
were not studied in the current research model explain 36.9% of return on assets of the
commercial banks.
Table 4.4: ANOVA – Capital Adequacy and ROA
Model
Sum
of Squares df Mean Square F Sig.
1 Regression .016 1 .016 5.136 .108b
Residual .010 3 .003
Total .026 4
a. Dependent Variable: Return on Assets
b. Predictors: (Constant), Capital Adequacy
Table 4.4 presents the F statistic which is used to test the significance of the association
between capital adequacy and return on assets. The F value is 5.136. The probability of
obtaining a value greater than or equal to 5.136 is more than 0.05 evident by the significance
value of 0.108 which is more than 0.05. Thus the effect of capital adequacy on return on
assets is not significant at the 95% level of confidence.
Table 4.5: Regression Coefficients – Capital Adequacy and ROA
Model Unstandardized
Coefficients
Standardized
Coefficients
t Sig.
B Std. Error
Beta
1 (Constant) 2.630 .246 10.708 .002
Capital Adequacy .025 .011 .795 2.266 .108

36
a. Dependent Variable: Return on Assets
Based on the results in Table 4.5, the regression model generated is:
ROA = 2.630 + 0.025 Capital Adequacy ratio + ε
The model shows that keeping capital adequacy constant, financial performance in terms
of ROA will be 2.630. The findings further show that capital adequacy is positively related
to ROA as its coefficient is positive. A unit increase in capital adequacy would lead to a
0.025 increase in ROA of the banking industry. This relationship, however, was not
significant as shown by the p-value of 0.108 which is more than 0.05, the critical value at
5% level.
4.3.2.2 The Effect of Capital Adequacy on ROE
Table 4.6: Regression Model Summary – Capital Adequacy and ROE
Model R R Square Adjusted R Square
Std. Error of the Estimate
1 .581a .338 .117 1.1826779
a. Predictors: (Constant), Capital Adequacy
The R Square value of 0.338, in Table 4.6, shows that capital adequacy explains 33.8% of
the banking industry’s return on equity. This implies that some other factors which were
not studied in the current research model explain 66.2% of return on assets of the
commercial banks.
Table 4.7: ANOVA – Capital Adequacy and ROE
Model Sum of Squares
df Mean Square F Sig.
1 Regression 2.143 1 2.143 1.532 .304b
Residual 4.196 3 1.399
Total 6.339 4
a. Dependent Variable: Return on Equity
b. Predictors: (Constant), Capital Adequacy
Table 4.7 presents the F statistic tests the significance of the association between capital
adequacy and return on equity. The F value is 1.532. The significance value of 0.304 is
more than 0.05, meaning that the probability of obtaining a value greater than or equal to
1.532 is more than 0.05. Thus the effect of capital adequacy on return on equity is not
significant at the 95% level of confidence.
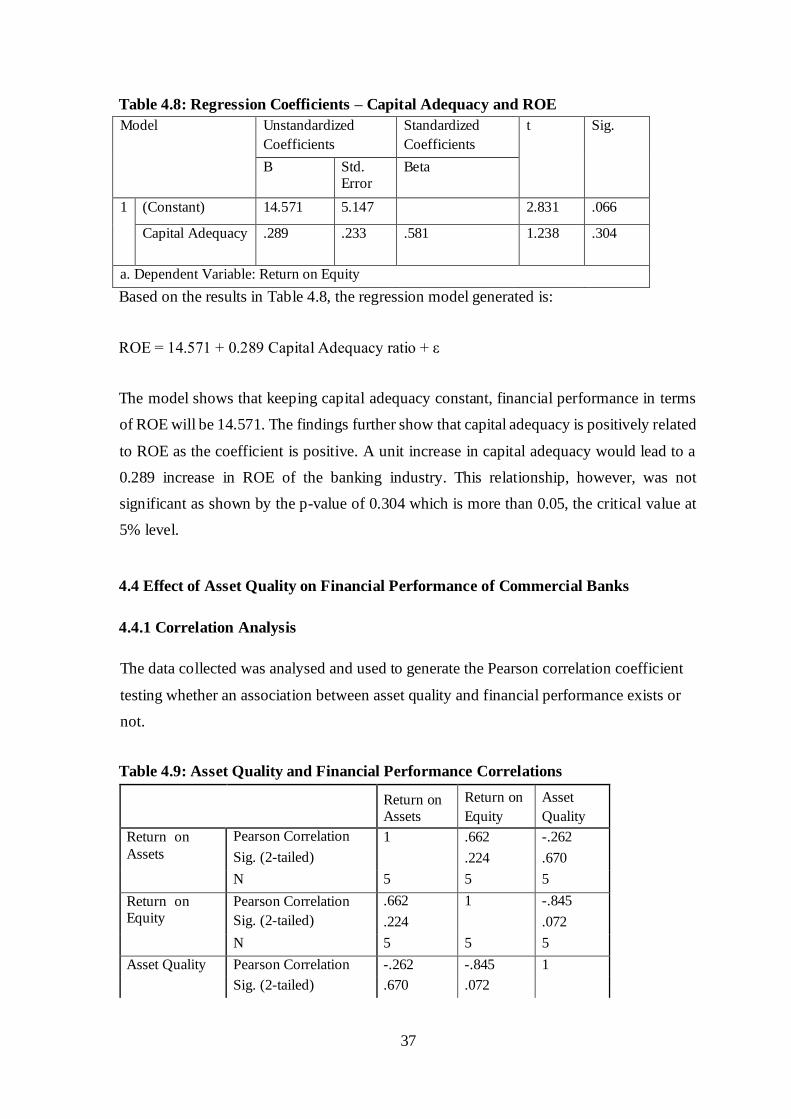
37
Table 4.8: Regression Coefficients – Capital Adequacy and ROE
Model Unstandardized
Coefficients
Standardized
Coefficients
t Sig.
B Std. Error
Beta
1 (Constant) 14.571 5.147 2.831 .066
Capital Adequacy .289 .233 .581 1.238 .304
a. Dependent Variable: Return on Equity
Based on the results in Table 4.8, the regression model generated is:
ROE = 14.571 + 0.289 Capital Adequacy ratio + ε
The model shows that keeping capital adequacy constant, financial performance in terms
of ROE will be 14.571. The findings further show that capital adequacy is positively related
to ROE as the coefficient is positive. A unit increase in capital adequacy would lead to a
0.289 increase in ROE of the banking industry. This relationship, however, was not
significant as shown by the p-value of 0.304 which is more than 0.05, the critical value at
5% level.
4.4 Effect of Asset Quality on Financial Performance of Commercial Banks
4.4.1 Correlation Analysis
The data collected was analysed and used to generate the Pearson correlation coefficient
testing whether an association between asset quality and financial performance exists or
not.
Table 4.9: Asset Quality and Financial Performance Correlations
Return on Assets
Return on
Equity
Asset
Quality
Return on Assets
Pearson Correlation
Sig. (2-tailed)
1
.662
.224
-.262
.670
N 5 5 5
Return on Equity
Pearson Correlation
Sig. (2-tailed)
.662
.224
1
-.845
.072
N 5 5 5
Asset Quality Pearson Correlation -.262 -.845 1
Sig. (2-tailed) .670 .072
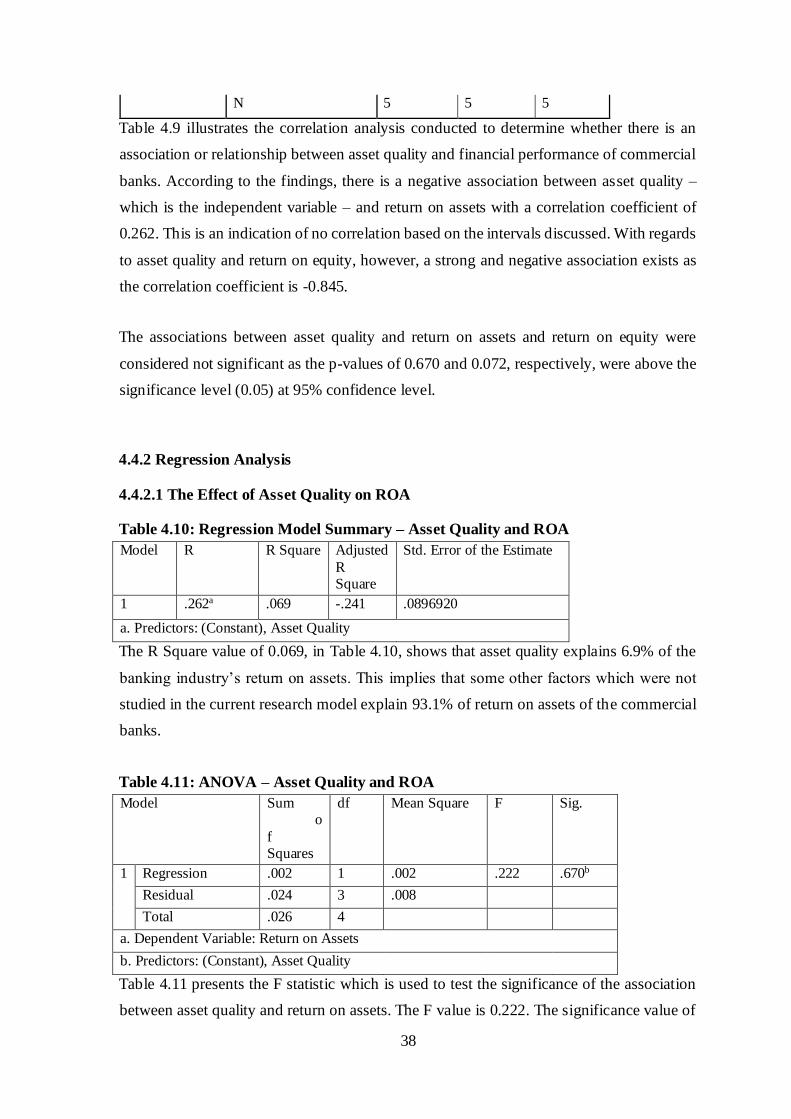
38
N 5 5 5
Table 4.9 illustrates the correlation analysis conducted to determine whether there is an
association or relationship between asset quality and financial performance of commercial
banks. According to the findings, there is a negative association between asset quality –
which is the independent variable – and return on assets with a correlation coefficient of
0.262. This is an indication of no correlation based on the intervals discussed. With regards
to asset quality and return on equity, however, a strong and negative association exists as
the correlation coefficient is -0.845.
The associations between asset quality and return on assets and return on equity were
considered not significant as the p-values of 0.670 and 0.072, respectively, were above the
significance level (0.05) at 95% confidence level.
4.4.2 Regression Analysis
4.4.2.1 The Effect of Asset Quality on ROA
Table 4.10: Regression Model Summary – Asset Quality and ROA
Model R R Square Adjusted R Square
Std. Error of the Estimate
1 .262a .069 -.241 .0896920
a. Predictors: (Constant), Asset Quality
The R Square value of 0.069, in Table 4.10, shows that asset quality explains 6.9% of the
banking industry’s return on assets. This implies that some other factors which were not
studied in the current research model explain 93.1% of return on assets of the commercial
banks.
Table 4.11: ANOVA – Asset Quality and ROA
Model Sum o
f Squares
df Mean Square F Sig.
1 Regression .002 1 .002 .222 .670b
Residual .024 3 .008
Total .026 4
a. Dependent Variable: Return on Assets
b. Predictors: (Constant), Asset Quality
Table 4.11 presents the F statistic which is used to test the significance of the association
between asset quality and return on assets. The F value is 0.222. The significance value of

39
0.670 is more than 0.05, meaning that the probability of obtaining a value greater than or
equal to 0.222 is more than 0.05. Thus the effect of asset quality on return on assets is not
significant at the 95% level of confidence.
Table 4.12: Regression Coefficients – Asset Quality and ROA
Model Unstandardized
Coefficients
Standardized
Coefficients
t Sig.
B Std. Error
Beta
1 (Constant) 3.302 .254 13.013 .001
Asset Quality -.028 .059 -.262 -.471 .670
a. Dependent Variable: Return on Assets
Based on the results in Table 4.12, the regression model generated is:
ROA = 3.302 - 0.028 Asset quality ratio + ε
The model shows that holding asset quality constant, financial performance in terms of
ROA will be 3.302. The findings further confirm that asset quality is negatively related to
ROA as the coefficient is negative. A unit increase in asset quality ratio would lead to a
0.028 decrease in ROA of the banking industry. This relationship, however, was not
significant as shown by the p-value of 0.670 which is more than 0.05, the critical value at
5% level.
4.4.2.2 The Effect of Asset Quality on ROE
Table 4.13: Regression Model Summary – Asset Quality and ROE
Model R R Square
Adjusted R Square
Std. Error of the Estimate
1 .845a .714 .619 .7773739
a. Predictors: (Constant), Asset Quality
The R Square value of 0.714, in Table 4.13, shows that asset quality explains 71.4% of the
banking industry’s return on equity. This means that some other factors which were not
studied in the current research model explain only 28.6% of return on equity of the
commercial banks.

40
Table 4.14: ANOVA – Asset Quality and ROE
Model Sum of Squares
df Mean Square F Sig.
1 Regression 4.526 1 4.526 7.489 .072b
Residual 1.813 3 .604
Total 6.339 4
a. Dependent Variable: Return on Equity
b. Predictors: (Constant), Asset Quality
Table 4.14 shows the F statistic which is used to test the significance of the association
between asset quality and return on equity. The F value is 7.489. The significance value of
0.072 is more than 0.05 meaning that the probability of obtaining a value greater than or
equal to 7.489 is more than 0.05. Thus the effect of asset quality on return on equity is not
significant at the 95% level of confidence.
Table 4.15: Regression Coefficients – Asset Quality and ROE
Model Unstandardized
Coefficients
Standardized
Coefficients
t Sig.
B Std. Error
Beta
1 (Constant) 26.851 2.199 12.209 .001
Asset Quality -1.406 .514 -.845 -2.737 .072
a. Dependent Variable: Return on Equity
Based on the results in Table 4.15, the regression model generated is:
ROE = 26.851 – 1.406 Asset quality ratio + ε
The model shows that keeping asset quality constant, financial performance in terms of
ROE will be 26.851. The findings further show that asset quality is negatively related to
ROE as the coefficient is negative. A unit increase in asset quality ratio would thus result
in a 1.406 decrease in ROE of the banking industry. This relationship, however, was not
significant as shown by the p-value of 0.072 which is more than 0.05, the critical value at
5% level.
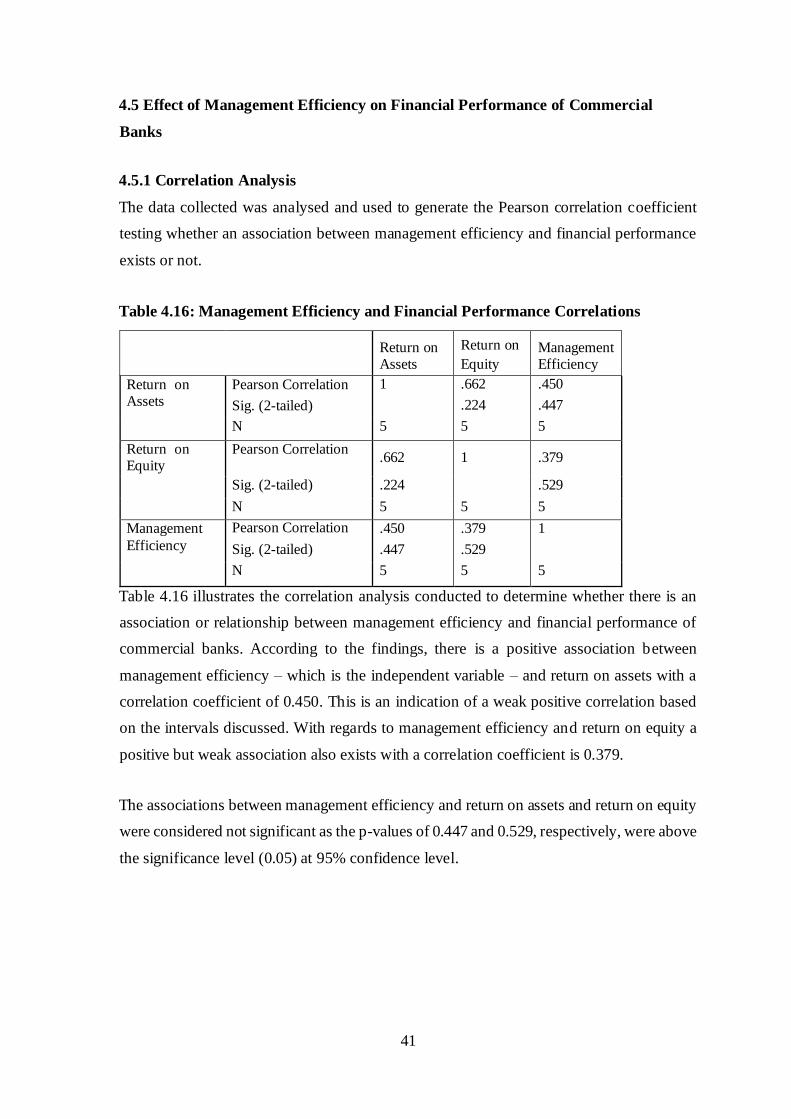
41
4.5 Effect of Management Efficiency on Financial Performance of Commercial
Banks
4.5.1 Correlation Analysis
The data collected was analysed and used to generate the Pearson correlation coefficient
testing whether an association between management efficiency and financial performance
exists or not.
Table 4.16: Management Efficiency and Financial Performance Correlations
Return on Assets
Return on
Equity Management Efficiency
Return on Assets
Pearson Correlation
Sig. (2-tailed)
1
.662
.224
.450
.447
N 5 5 5
Return on Equity
Pearson Correlation .662 1 .379
Sig. (2-tailed) .224 .529
N 5 5 5
Management Efficiency
Pearson Correlation
Sig. (2-tailed)
.450
.447
.379
.529
1
N 5 5 5
Table 4.16 illustrates the correlation analysis conducted to determine whether there is an
association or relationship between management efficiency and financial performance of
commercial banks. According to the findings, there is a positive association between
management efficiency – which is the independent variable – and return on assets with a
correlation coefficient of 0.450. This is an indication of a weak positive correlation based
on the intervals discussed. With regards to management efficiency and return on equity a
positive but weak association also exists with a correlation coefficient is 0.379.
The associations between management efficiency and return on assets and return on equity
were considered not significant as the p-values of 0.447 and 0.529, respectively, were above
the significance level (0.05) at 95% confidence level.
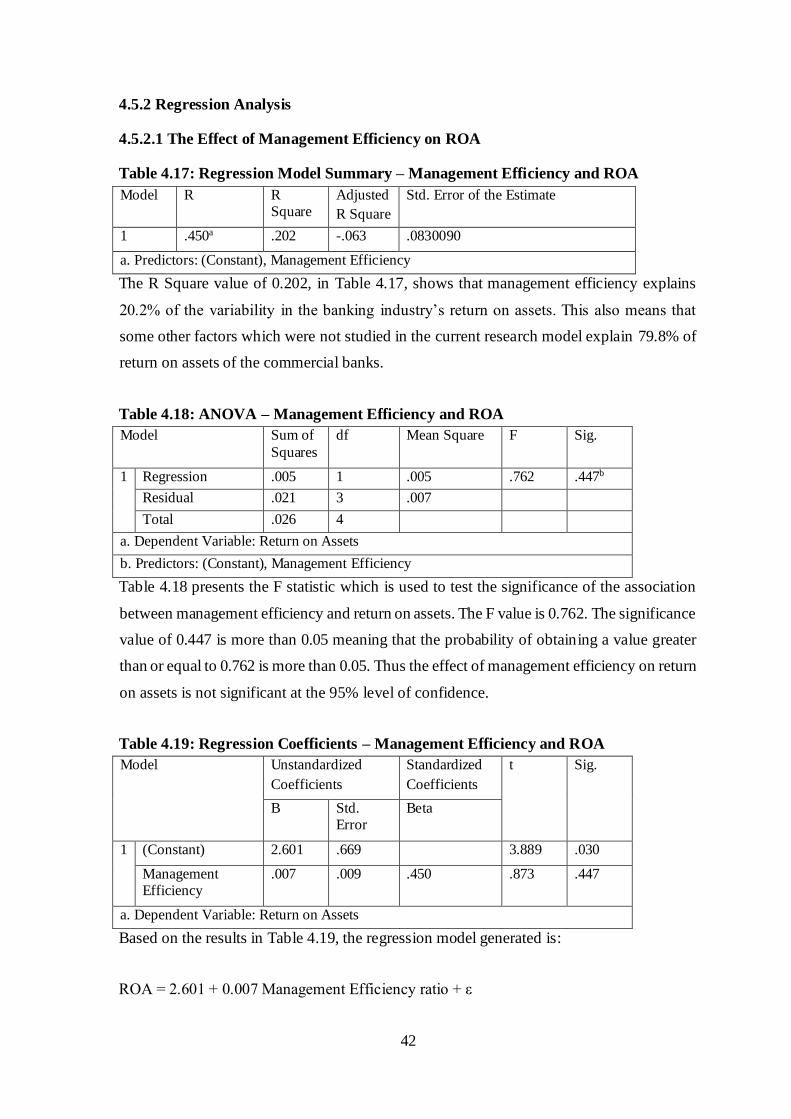
42
4.5.2 Regression Analysis
4.5.2.1 The Effect of Management Efficiency on ROA
Table 4.17: Regression Model Summary – Management Efficiency and ROA
Model R R Square
Adjusted
R Square
Std. Error of the Estimate
1 .450a .202 -.063 .0830090
a. Predictors: (Constant), Management Efficiency
The R Square value of 0.202, in Table 4.17, shows that management efficiency explains
20.2% of the variability in the banking industry’s return on assets. This also means that
some other factors which were not studied in the current research model explain 79.8% of
return on assets of the commercial banks.
Table 4.18: ANOVA – Management Efficiency and ROA
Model Sum of Squares
df Mean Square F Sig.
1 Regression .005 1 .005 .762 .447b
Residual .021 3 .007
Total .026 4
a. Dependent Variable: Return on Assets
b. Predictors: (Constant), Management Efficiency
Table 4.18 presents the F statistic which is used to test the significance of the association
between management efficiency and return on assets. The F value is 0.762. The significance
value of 0.447 is more than 0.05 meaning that the probability of obtaining a value greater
than or equal to 0.762 is more than 0.05. Thus the effect of management efficiency on return
on assets is not significant at the 95% level of confidence.
Table 4.19: Regression Coefficients – Management Efficiency and ROA
Model Unstandardized
Coefficients
Standardized
Coefficients
t Sig.
B Std. Error
Beta
1 (Constant) 2.601 .669 3.889 .030
Management Efficiency
.007 .009 .450 .873 .447
a. Dependent Variable: Return on Assets
Based on the results in Table 4.19, the regression model generated is:
ROA = 2.601 + 0.007 Management Efficiency ratio + ε

43
The model shows that keeping management efficiency constant, financial performance in
terms of ROA will be 2.601. The findings further show that management efficiency is
positively related to ROA as the coefficient is positive. A unit increase in management
efficiency would result to a 0.007 increase in ROA of the banking industry. This
relationship, however, was not significant as shown by the p-value of 0.447 which is more
than 0.05, the critical value at 5% level.
4.5.2.2 The Effect of Management Efficiency on ROE
Table 4.20: Regression Model Summary – Management Efficiency and ROE
Model R R Square
Adjusted R Square
Std. Error of the Estimate
1 .379a .144 -.141 1.3449531
a. Predictors: (Constant), Management Efficiency
The R Square value of 0.144, in Table 4.20, shows that management efficiency explains
14.4% of the variability in the banking industry’s return on equity. This means that some
other factors which were not studied in the current research model explain 85.6% of return
on equity of the commercial banks.
Table 4.21: ANOVA – Management Efficiency and ROE
Model Sum of Squares
df Mean Square F Sig.
1 Regression .912 1 .912 .504 .529b
Residual 5.427 3 1.809
Total 6.339 4
a. Dependent Variable: Return on Equity
b. Predictors: (Constant), Management Efficiency
Table 4.21 presents the F statistic which is used to test the significance of the association
between management efficiency and return on equity. The F value is 0.504. The
significance value of 0.529 is more than 0.05 meaning that the probability of obtaining a
value greater than or equal to 0.504 is more than 0.05. Thus the effect of management
efficiency on return on equity is not significant at the 95% level of confidence.
Table 4.22: Regression Coefficients – Management Efficiency and ROE
Model Unstandardized
Coefficients
Standardized
Coefficients
t Sig.
B Std. Error
Beta
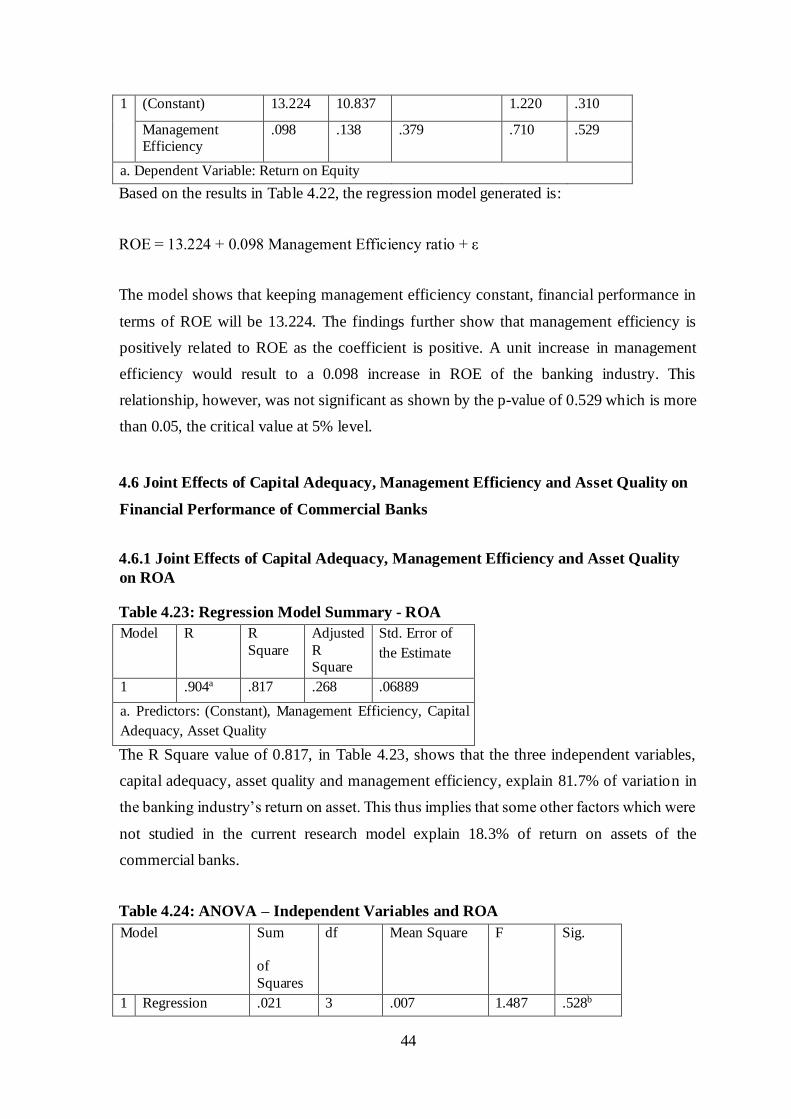
44
1 (Constant) 13.224 10.837 1.220 .310
Management Efficiency
.098 .138 .379 .710 .529
a. Dependent Variable: Return on Equity
Based on the results in Table 4.22, the regression model generated is:
ROE = 13.224 + 0.098 Management Efficiency ratio + ε
The model shows that keeping management efficiency constant, financial performance in
terms of ROE will be 13.224. The findings further show that management efficiency is
positively related to ROE as the coefficient is positive. A unit increase in management
efficiency would result to a 0.098 increase in ROE of the banking industry. This
relationship, however, was not significant as shown by the p-value of 0.529 which is more
than 0.05, the critical value at 5% level.
4.6 Joint Effects of Capital Adequacy, Management Efficiency and Asset Quality on
Financial Performance of Commercial Banks
4.6.1 Joint Effects of Capital Adequacy, Management Efficiency and Asset Quality
on ROA
Table 4.23: Regression Model Summary - ROA
Model R R Square
Adjusted R Square
Std. Error of
the Estimate
1 .904a .817 .268 .06889
a. Predictors: (Constant), Management Efficiency, Capital
Adequacy, Asset Quality
The R Square value of 0.817, in Table 4.23, shows that the three independent variables,
capital adequacy, asset quality and management efficiency, explain 81.7% of variation in
the banking industry’s return on asset. This thus implies that some other factors which were
not studied in the current research model explain 18.3% of return on assets of the
commercial banks.
Table 4.24: ANOVA – Independent Variables and ROA
Model Sum of Squares
df Mean Square F Sig.
1 Regression .021 3 .007 1.487 .528b

45
Residual .005 1 .005
Total .026 4
a. Dependent Variable: Return on Assets
b. Predictors: (Constant), Management Efficiency, Capital Adequacy, Asset Quality
Table 4.24 presents the F statistic which is used to test the significance of the association
between the independent variables and return on assets. The F value is 1.487. The
significance value of 0.528 is more than 0.05 meaning that the probability of obtaining a
value greater than or equal to 1.487 is more than 0.05. Thus the effect of the independent
variables on return on assets is not significant at the 95% level of confidence.
Table 4.25: Regression Coefficients – Independent Variables and ROA
Model Unstandardized
Coefficients
Standardized
Coefficients
t Sig.
B Std. Error
Beta
1 (Constant) 2.015 .709 2.844 .215
Capital Adequacy .027 .016 .836 1.708 .337
Asset Quality .013 .052 .122 .249 .845
Management Efficiency
.007 .007 .410 .955 .515
a. Dependent Variable: Return on Assets
Based on the results in Table 4.25, the regression model generated is:
ROA = 2.015 + 0.027 Capital Adequacy + 0.013 Asset Quality ratio + 0.007 Management
Efficiency ratio + ε
The model shows that keeping the three independent variables constant, financial
performance in terms of ROA will be 2.015. The findings further show that capital
adequacy is positively related to ROA as the coefficient is positive. Holding all the other
variables constant, a unit increase in capital adequacy would result in a 0.027 increase in
ROA of the banking industry. This relationship, however, was not significant as shown by
the p-value of 0.337 which is more than 0.05, the critical value at 5% level.
With regards to asset quality, the model shows a positive relationship to ROA evident from
the positive regression coefficient of 0.013. This means that holding all the other variables
constant, a unit increase in asset quality ratio would lead to a 0.013 increase in ROA of the

46
banks listed on the NSE. The relationship was found to be not significant at the 95%
confidence level, as the p-value of 0.845 is more the than 0.05.
The model in Table 4.25 also indicates a positive relationship between management
efficiency and ROA due to the positive regression coefficient of 0.007. Holding other
variables constant, a unit increase in the ratio of management efficiency would lead to a
0.007 increase in ROA on commercial banks. This relationship was not significant as shown
by the p-value of 0.515 which is more than 0.05, the critical value at 5% level.
4.6.2 Joint Effects of Capital Adequacy, Management Efficiency and Asset Quality
on ROE
Table 4.26: Regression Model Summary - ROE
Model R R Square
Adjusted R Square
Std. Error of
the Estimate
1 .958a .917 .670 .72319
a. Predictors: (Constant), Management Efficiency, Capital
Adequacy, Asset Quality
The R Square value of 0.917, in Table 4.26, shows that the three independent variables,
capital adequacy, asset quality and management efficiency, explain 91.7% of variation in
the banking industry’s return on equity. This thus means that some other factors which were
not studied in the current research model explain 8.3% of return on equity of the
commercial banks.
Table 4.27: ANOVA – Independent Variables and ROE
Model Sum of Squares
df Mean Square F Sig.
1 Regression 5.816 3 1.939 3.707 .361b
Residual .523 1 .523
Total 6.339 4
a. Dependent Variable: Return on Equity
b. Predictors: (Constant), Management Efficiency, Capital Adequacy, Asset
Quality
Table 4.27 presents the F statistic which is used to test the significance of the association
between the independent variables and return on equity. The F value is 3.707. The
significance value of 0.361 is more than 0.05 meaning that the probability of obtaining a

47
value greater than or equal to 3.707 is more than 0.05. Thus the effect of the independent
variables on return on equity is not significant at the 95% level of confidence.
Table 4.28: Regression Coefficients – Independent Variables and ROE
Model Unstandardized
Coefficients
Standardized
Coefficients
t Sig.
B Std. Error
Beta
1 (Constant) 15.984 7.441 2.148 .277
Capital Adequacy .096 .163 .194 .589 .661
Asset Quality -1.281 .547 -.770 -2.343 .257
Management Efficiency
.105 .074 .406 1.409 .393
a. Dependent Variable: Return on Equity
Based on the results in Table 4.28, the regression model generated is:
ROE = 15.984 + 0.096 Capital Adequacy – 1.281 Asset Quality ratio + 0.105 Management
Efficiency ratio + ε
The model shows that keeping the three independent variables constant, financial
performance in terms of ROE will be 15.984. The findings further show that capital
adequacy is positively related to ROE as the coefficient is positive. Holding all the other
variables constant, a unit increase in capital adequacy would result in a 0.096 increase in
ROE of the banking industry. This relationship, however, was not significant as shown by
the p-value of 0.661 which is more than 0.05, the critical value at 5% level.
With regards to asset quality, the model shows an inverse relationship with ROE evident
from the negative regression coefficient of -1.281. This means that holding all the other
variables constant, a unit increase in asset quality ratio would lead to a 1.281 decrease in
ROE of the banks listed on the NSE. The relationship was found to be not significant at the
95% confidence level, as the p-value of 0.257 is more the than 0.05.
The model in Table 4.28 indicates a positive relationship between management efficiency
and ROE due to the positive regression coefficient of 0.105. Holding other variables
constant, a unit increase in the ratio of management efficiency would lead to a 0.105
48
increase in ROE of commercial banks. This relationship was not significant as shown by
the p-value of 0.393 which is more than 0.05, the critical value at 5% level.
4.7 Chapter Summary
This chapter presented the findings and results of the study. The chapter employed the use
of line graphs and tables to illustrate the results that were derived from the study. Section
4.1 introduced the chapter while Section 4.2 presented general information found on the
dependent variables – ROA and ROE – as well as the independent variables – capital
adequacy, asset quality, and management efficiency. Section 4.3 presented the findings on
the first research question: How does Capital Adequacy affect the financial performance of
commercial banks in Kenya? Section 4.4 presented the findings on the second research
question: How does Asset Quality affect the financial performance of commercial banks in
Kenya? Section 4.5 presented the findings on the third research question: How does
Management Efficiency affect the financial performance of commercial banks in Kenya?
Finally, Section 4.6 presented the findings on the joint effect of the three independent
variables on financial performance of commercial banks in Kenya. Chapter five provides a
summary of the study. It presents discussions of the findings, conclusions and
recommendations.
CHAPTER FIVE
5.0 DISCUSSIONS, CONCLUSIONS AND RECOMMENDATIONS
5.1 Introduction
Chapter five, the final chapter, provides a summary of the study and discussions of the
major findings. The chapter also draws conclusions and relevant recommendations based
on the research questions.
5.2 Summary of the Study
The purpose of this study was to examine the factors affecting financial performance of
commercial banks listed on the Nairobi Securities Exchange. The study was guided by the
following three research questions: How does Capital Adequacy affect the financial
49
performance of commercial banks in Kenya? How does Asset Quality affect the financial
performance of commercial banks in Kenya? and How does Management Efficiency affect
the financial performance of commercial banks in Kenya?
The study used a descriptive research design to examine the performance of banks in Kenya.
The target population of this study consisted of the 10 commercial banks listed on the
Nairobi Securities Exchange from 2010 to 2014. The study researched the entire
population, which includes all 10 banks listed on NSE. The researcher believed that these
banks would provide sufficient data to study the association between the given variables.
The researcher used secondary data sources when collecting data. Secondary data was
available on all ten commercial banks for a period of five years from 2010 to 2014, yielding
50 observations on the financial performance of banks proxied by Return on Assets (ROA)
and Return on Equity (ROE). The analysis of the quantitative data collected was done using
descriptive and inferential statistics utilizing the SPSS version 23.
Descriptive statistics that were drawn included: percentages, means, standard deviation,
minimums and maximums. In order to examine the effect of independent factors on bank
performance, correlation and regression analyses were utilised, with ROA and ROE as
dependent variables and capital adequacy, asset quality and management efficiency as the
independent or predictor variables.
The study found that over the five year period reviewed, capital adequacy ratio of the
banking industry was not constant but kept fluctuating. The banks achieved their highest
ratio of 24.86% in 2010 and their lowest in 2014 at 18.57%. From the correlation analysis
and the regression analysis, the study found that capital adequacy had a positive effect or
association with both ROA and ROE. The effect of capital adequacy on financial
performance both in terms of ROA and ROE was found to be not significant at the 95%
level of confidence.
With regards to asset quality, the study found that the ratio kept changing over the five year
period from 2010 to 2013. The findings show that asset quality was best in 2011 with a low
ratio of 3.21% and poorest in 2014 with the highest ratio of 5.06%. The correlation analysis
indicates a very weak and negative association between asset quality and ROA however a
strong and negative association was found between asset quality and ROE. The regression
analysis further confirms the inverse association between asset quality ratio and financial
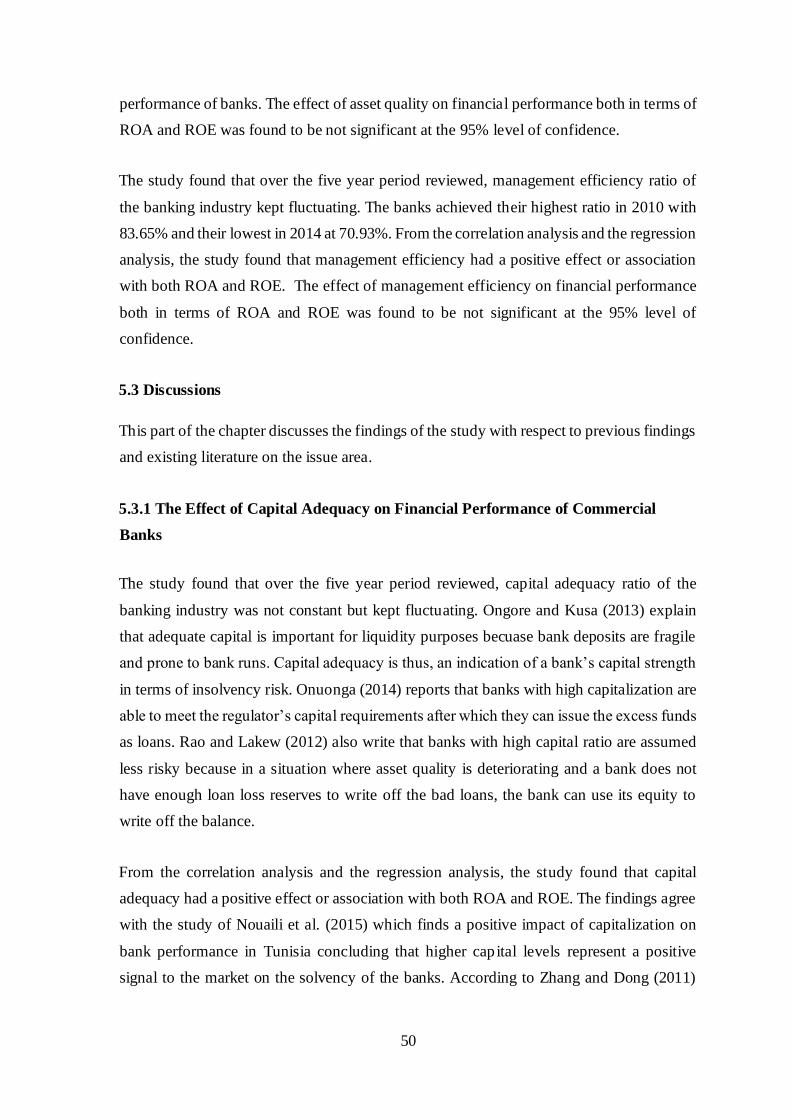
50
performance of banks. The effect of asset quality on financial performance both in terms of
ROA and ROE was found to be not significant at the 95% level of confidence.
The study found that over the five year period reviewed, management efficiency ratio of
the banking industry kept fluctuating. The banks achieved their highest ratio in 2010 with
83.65% and their lowest in 2014 at 70.93%. From the correlation analysis and the regression
analysis, the study found that management efficiency had a positive effect or association
with both ROA and ROE. The effect of management efficiency on financial performance
both in terms of ROA and ROE was found to be not significant at the 95% level of
confidence.
5.3 Discussions
This part of the chapter discusses the findings of the study with respect to previous findings
and existing literature on the issue area.
5.3.1 The Effect of Capital Adequacy on Financial Performance of Commercial
Banks
The study found that over the five year period reviewed, capital adequacy ratio of the
banking industry was not constant but kept fluctuating. Ongore and Kusa (2013) explain
that adequate capital is important for liquidity purposes becuase bank deposits are fragile
and prone to bank runs. Capital adequacy is thus, an indication of a bank’s capital strength
in terms of insolvency risk. Onuonga (2014) reports that banks with high capitalization are
able to meet the regulator’s capital requirements after which they can issue the excess funds
as loans. Rao and Lakew (2012) also write that banks with high capital ratio are assumed
less risky because in a situation where asset quality is deteriorating and a bank does not
have enough loan loss reserves to write off the bad loans, the bank can use its equity to
write off the balance.
From the correlation analysis and the regression analysis, the study found that capital
adequacy had a positive effect or association with both ROA and ROE. The findings agree
with the study of Nouaili et al. (2015) which finds a positive impact of capitalization on
bank performance in Tunisia concluding that higher capital levels represent a positive
signal to the market on the solvency of the banks. According to Zhang and Dong (2011)

51
well-capitalized banks are safe, have greater creditworthiness and gain from reduced
funding costs. These all positively affect the performance of commercial banks.
These findings also agree with those of Onuonga (2014), which revealed that capital
adequacy or capital strength has a positive impact on the profitability of the top banks in
Kenya in 2008 to 2013. In his study, capital showed the largest impact on the variations in
profits, confirming a view that highly capitalized banks can even endure general financial
crisis and remain profitable and suggesting that the top commercial banks in Kenya could
earn higher profits by increasing capital. However the results of this study are in
contradiction with those of Frederick (2014), Zhang and Dong (2011) and Swarnapali
(2014) which all found capital to have a negative impact on bank profitability.
A bank with high earnings is able to increase its own capital base, finance expansion
ventures and pay attractive dividends to its shareholders as well as build the bank’s
provisions or reserves. Profitable banks can absorb loan losses, reward shareholders and
inspire public confidence which is essential for their continued success. Effective and
efficient asset and liability management is important for banks to start enjoying good
returns (Muhmad & Hashim, 2015).
Olweny and Shipho (2011) and Berger (1995) discuss the Relative Market Portfolio
hypothesis, which states that bank profitability is influenced by market share and proposes
that only large banks with differentiated products can control prices and grow their profits.
These banks are able to exercise market power and gain monopoly profits whereas firms
with smaller market shares operate as if under perfect competition and cannot earn the same
supernormal profits.
5.3.2 The Effect of Asset Quality on Financial Performance of Commercial Banks
The study found that the ratio of asset quality (total non-performing loans to gross loans)
kept changing over the five year period from 2010 to 2013. The findings show that asset
quality was best in 2011 with a low ratio of 3.21% and poorest in 2014 with the highest
ratio of 5.06%. Altan et al. (2014) explain that the purpose of asset quality analysis is to
determine the amount of non-performing assets as a percentage of the total assets. The
quality of a loan portfolio has a direct impact on bank profitability, according to Ongore
and Kusa (2013), and non-performing loans should be monitored and kept as low as

52
possible using appropriate strategy and policies. Therefore the lower the percentage of NPL
to total loans the better the bank’s financial performance.
The correlation analysis indicates a very weak and negative association between asset
quality and ROA, however a strong and negative association was found between asset
quality and ROE. The regression analysis further confirms the inverse relationship between
asset quality ratio and financial performance of banks. Ongore and Kusa (2013) found the
NPL ratio to have a strong negative relationship with bank profitability, showing that poor
asset quality was associated with poor commercial bank performance in Kenya. Kosmidou
(2008) also concluded that poor asset quality has a negative effect on bank profitability as
it pulls down interest income revenue and adds to provision cost. Fredrick (2014) concluded
that poor quality of loans can result in higher loan loss provisions, thus reducing bank
profits. Asset quality has a positive relationship with bank efficiency meaning that banks
should closely monitor their assets and use credit risk management systems.
In contrast with this study’s findings, Flamini et al. (2009) find that credit risk has a positive
and significant impact on profitability and conclude that risk-averse shareholders seek risk
adjusted returns and larger earnings to compensate higher credit risk. Onuonga (2014) also
found a positive relationship, using the loans to assets ratio with bank profitability in Kenya.
Nouaili et al. (2015) explain the theory of balanced markets which predicts that banks which
manage their credit risk successfully are at an advantage because a strong relationship
between risk and profitability exists. A higher ratio of loan loss provision to total asset may
be an indicator of loans with poor quality or poor loan portfolio management which
negatively impact profitability of a bank (Rao & Lakew, 2012). Thus banks are more likely
to achieve high performance by maintaining or reducing credit exposure.
5.3.3 The Effect of Management Efficiency on Financial Performance of Commercial
Banks
The study found that over the five year period reviewed, management efficiency ratio of
the banking industry kept fluctuating. The banks achieved their highest ratio in 2010 with
83.65% and their lowest in 2014 at 70.93%. Management efficiency, although it is often
expressed qualitatively, can be measured using financial ratios as proxy. Operating profit
to total income (revenue) ratio is a popular ratio according to Mohiuddin (2014), which
shows management income generation and is expected to have a positive impact on bank

53
profitability. Nasserinia, Ariff and Fan-Fah (2014) suggest that bad management increases
the chances of a bank failing.
Atemnkeng and Nzongang (2006) argue that the extent of diversification and the desired
contents of a bank portfolio can be as results of the decisions by the bank management.
They assert that the assets and liabilities chosen by the management as well as the unit costs
incurred to make each component of the assets will determine the firm’s ability to earn high
profits.
From the correlation analysis and the regression analysis, this study found that management
efficiency had a positive effect or association with both ROA and ROE. These findings are
consistent with the findings of Ongore and Kusa (2013), who in their study, concluded that
management efficiency represented by operating profit to total income ratio has a
significant impact on the performance of commercial banks. Nasserinia et al. (2014) studied
commercial banks in Japan and concluded that low bank returns can be a signal of poor
management practices. However, Kamau and Were (2013), in their study, present findings
which indicate that superior performance in the Kenyan banking sector can be due to
structure and collusive power and not efficiency and thus find in favour of the Structure
Conduct Performance (SCP) hypothesis and not the Efficiency Structure Theory.
Thoraneenitiyan (2010) discusses that banks with better management and practices will be
better at controlling costs and earning profits, thus “moving the bank closer to the
bestpractice, lower bound cost curve.” Rao and Lakew (2012) also observed similar results
in their study on banks in Ethiopia suggesting that more efficient commercial banks
reported higher profits than those with poor expense management in the period of study as
well as the fact that a reduction in costs can boost bank profits.
5.4 Conclusions
The study makes the following conclusions with regard to the three research questions that
that guided the study.

54
5.4.1 The Effect of Capital Adequacy on Financial Performance of Commercial
Banks
The study concludes that capital adequacy has a positive effect on the financial performance
of commercial banks listed on the Nairobi Securities Exchange. The study revealed that an
increase in capital adequacy would result in a positive increase in both ROA and ROE of
commercial banks. The effect of capital adequacy on financial performance both in terms
of ROA and ROE was found to be not significant at the 95% level of confidence.
Commercial banks need to maintain high capitalization not only to be able to meet the
regulator’s capital requirements but also because high capital ratio can positively affect the
performance of banks. Higher capital levels are associated with high solvency and lower
risk levels. Well capitalized banks also profit from reduced funding costs which also
positively affects the performance of commercial banks.
5.4.2 The Effect of Asset Quality on Financial Performance of Commercial Banks
The study concludes that asset quality has a negative effect on the financial performance of
commercial banks listed on NSE. The study indicates that an increase in the asset quality
ratio would lead to a decrease in both ROA and ROE of commercial banks. The effect of
asset quality on financial performance both in terms of ROA and ROE was found to be not
significant at the 95% level of confidence.
It is important that banks maintain low levels of non-performing loans as they contribute to
poor quality of loans which can result in higher loan loss provisions, thus having adverse
effects on bank performance. Commercial banks are more likely to achieve high
performance by managing or reducing their credit risk and thus should closely monitor their
assets and use effective credit risk management systems.
5.4.3 The Effect of Management Efficiency on Financial Performance of Commercial
Banks
The study concludes that management efficiency has a positive effect on the financial
performance of commercial banks listed on the Nairobi Securities Exchange. The study
revealed that an increase in management efficiency ratio would result in a positive increase
in both ROA and ROE of commercial banks. The effect of capital adequacy on financial

55
performance both in terms of ROA and ROE was found to be not significant at the 95%
level of confidence.
Management is responsible for making important decisions in an organisation and financial
institutions require sound management in order to grow. Effective and efficient
management– whether in terms of income generation, portfolio diversification or cost
reduction – are thus crucial for banks as can contribute to increased bank profits.
5.5 Recommendations
5.5.1 Recommendations for Improvement
5.5.1.1 The Effect of Capital Adequacy on Financial Performance of Commercial
Banks
The study established a positive and non-significant effect of capital adequacy on bank
performance. As these results have important implications for the survival and growth of
banks, commercial banks in Kenya should implement effective internal policies that can
potentially improve their capital adequacy ratio. Investors are recommended to consider
capital ratio when determining the risk levels and the extent of solvency of a bank. When
making investment decisions, capital adequacy ratio can be used to predict future
performance of commercial banks in terms of Return on Assets and Return on Equity. The
government and the regulatory body, CBK, must encourage banks through effective
policies to regularly raise their capital and provide the environment necessary for the
banking sector as well as the economy to grow.
5.5.1.2 The Effect of Asset Quality on Financial Performance of Commercial Banks
The study found that asset quality – in terms of total non-performing loans to gross loans –
has a negative and non-significant effect on the financial performance of commercial banks
in Kenya. This study recommends that banks operating in Kenya must identify and reduce
the effects of factors that can deteriorate asset quality because non-performing loans, unless
well-managed, are a big threat to banks and the banking industry. In order to reduce their
credit exposure, commercial banks must also take preventative measures by doing thorough
research into loan applicants’ credit, financial health and profitability. The government and
regulatory bodies in Kenya must formulate or revise and implement policies on effective
credit risk management in order to improve asset quality. Investors can use asset quality to

56
predict the future financial performance of banks as well as to decide which banks to invest
in.
5.5.1.3 The Effect of Management Efficiency on Financial Performance of
Commercial Banks
This study found that management efficiency has a positive and non-significant effect on
the financial performance of banks in Kenya. Commercial banks should identify and invest
in the factors such as new technology that add to a bank’s operating income as this has
positive implications on the bank’s profitability. Portfolio diversification and portfolio
composition of commercial banks is influenced by bank management and thus it is
recommended that banks set up policies that guide these decisions with the aim of
maximizing returns.
This study also recommends that commercial banks devise effective mechanisms to reduce
or control operational expenses. Investors can use information about bank management as
a signal about the future performance of commercial banks. The government of Kenya and
the regulatory body are recommended to devise policies and regulations that guide the
operations of commercial banks as well as strategies to enforce these regulations in order
to achieve a robust and transparent decision-making process and boost the soundness of the
banking system.
5.5.2 Recommendations for Future Research
This study was limited to ten commercial banks listed on the Nairobi Securities Exchange
and thus the researcher suggests that further studies should be conducted on the factors
affecting the financial performance of all commercial banks in Kenya. This study was also
limited to only three factors of the CAMEL model, namely capital adequacy, asset quality
and management efficiency. This study therefore suggests further studies on the effect of
all CAMEL factors – including earnings and liquidity – on the financial performance of
commercial banks. Future studies on a similar topic may also gain from using both
qualitative and quantitative research approaches as the views of bank stakeholders can
provide additional information not necessarily covered by the bank financial reports.

57
REFERENCES
Adesina, K. S. (2012). A comparative performance evaluation of the Nigerian banking
sector in the post – 2005 consolidation: Through the Camel Rating System.
International Journal of Business and Social Science, 3(13), 259-268.
Altan, M., Yusufazari, H. & Beduk, A. (2014). Performance analysis of banks in Turkey
using Camel Approach. Proceedings of the Proceedings 14th International
Academic Conference, 21-32.
Atemnkeng, T. & Nzongang J. (2006). Market structure and profitability performance in
the banking industry of CFA countries: The case of commercial banks in Cameroon.
Journal of Sustainable Development in Africa, 8(2), 1-14.
Athanasoglou, P. P., Brissimis, S. N. & Delis, M. D. (2008). Bank-specific, industryspecific
and macroeconomic determinants of bank profitability. Journal of International
Financial Markets, Institutions and Money, 18(2), 121-136.
Aziz, A., Ibrahim, I. & Isa, M. (2009). The impact of nonperforming loans (NPL) towards
profitability performance (ROA, ROE, & NPM). Institute of Research,
Development and Commercialization.
Baye, M. R. (2010). Managerial Economics and Business Strategy (7th ed.). New York:
McGraw-Hill/Irwin.
Berger, A. N. (1995). The Profit-Structure relationship in banking – Tests of MarketPower
and Efficient-Structure hypotheses. Journal of Money, Credit and Banking, 27 (2),
404-431.
Bonin, J., Hasan, I. & Wachtel, P. (2004). Bank performance, efficiency and ownership in
transition countries. Journal of Banking and Finance, 29 (1), 31-53.
Buerger, L. (2011). CAMELS ratings: what they mean and why they matter.
DirectorCorps. Retrieved from:
58
http://www.schiffhardin.com/Templates/media/files/Other%20PDFs/CAMELS-
Ratings---Lori-Buerger---March-2012.pdf
Byeongyong, P. C. & Weiss, M. A. (2005). An empirical investigation of market structure,
efficiency, and performance in Property-Liability insurance. Journal of Risk &
Insurance, 72 (4), 635-73.
CBK. (2015). Performance and developments in the Kenyan banking sector for the
quarter ended 30th June 2015. Retrieved from:
https://www.centralbank.go.ke/images/docs/Bank%20Supervision%20Reports/Qu
arterly%20Performance%20Reports/Quarter2of2015.pdf
Cooper, D. R. & Schindler, P. S. (2014). Business research methods (12th ed.). New York:
McGraw-Hill/Irwin.
Cornett, M. M., Guo, L., Khaksari, S. & Tehranian, H. (2009). The impact of state
ownership on performance differences in privately-owned versus state-owned
banks: An international comparison. Journal of Financial Intermediation, 19 (1),
74-94.
Dietrich, A. & Wanzenried, G. (2011). Determinants of bank profitability before and during
the crisis: evidence from Switzerland. Journal of International Financial Markets,
Institutions and Money, 21 (3), 307-327.
Dietrich, A. & Wanzenried, G. (2014). The determinants of commercial banking
profitability in low-, middle-, and high-income countries. The Quarterly Review of
Economics and Finance, 22, 1-18.
Echeboka, F. N., Egbunike, C. F. & Ezu, G. K. (2014). Determinants of bank profitability
in Nigeria: Using Camel Rating Model (2001 – 2010). IOSR Journal of Business
and Management, 16 (9), 44-50.
Flamini, V., McDonald, C. & Schumacher, L. (2009). The determinants of commercial
bank profitability in Sub-Saharan Africa. IMF Working Paper, WP/09/15.
59
Frederick, N. K. (2014). Factors affecting performance of commercial banks in Uganda: A
case for domestic commercial banks. Proceedings of 25th International Business
Research Conference, 1-19.
Hayden, E., Porath, D. & v.Westernhagen, N. (2006). Does diversification improve the
performance of German banks?: Evidence from individual bank loan portfolios.
Working Papers, Oesterreichische Nationalbank (Austrian Central Bank).
Jaber, J. J & Al-khawaldeh, A. (2014). The impact of internal and external factors on
commercial bank profitability in Jordan. International Journal of Business and
Management, 9 (4), 22-30.
Kabir, A. & Dey, S. (2012). Performance analysis through CAMEL Rating: A comparative
study of selected private commercial banks in Bangladesh. Journal of Politics &
Governance, 1 (2/3), 16-25.
Kamau, A. & Were, M. (2013). What drives banking sector performance in Kenya. Global
Business and Economics Research Journal, 2 (4), 45-59.
Kiganda, E. O. (2014). Effect of macroeconomic factors on commercial banks profitability
in Kenya: Case of Equity Bank Limited. Journal of Economics and Sustainable
Development, 5 (2), 46-56.
Kosmidou, K. (2008). The determinants of banks’ profits in Greece during the period of
EU financial integration. Emerald Group Publishing Limited, Managerial Finance,
34 (3), 146-159.
Kumbirai, M. & Webb, R. (2010). A financial ratio analysis of commercial bank
performance in South Africa. African Review of Economics and Finance, 2 (1), 30-
53.
Lipunga, A. M. (2014). Determinants of profitability of listed commercial banks in
developing countries: Evidence from Malawi. Research Journal of Finance and
Accounting, 5 (6), 41-49.

60
Mohiuddin, G. (2014). Use of CAMEL Model: A study on financial performance of
selected commercial banks in Bangladesh. Universal Journal of Accounting and
Finance, 2 (5), 151-160.
Muhmad, S. N. & Hashim, H. A. (2015). Using the camel framework in assessing bank
performance in Malaysia. International Journal of Economics, Management and
Accounting, 23 (1), 109-127.
Muiruri, J. K. & Ngari, J. M. (2014). Effects of financial innovations on the financial
performance of commercial banks in Kenya. International Journal of Humanities
and Social Science, 4 (7), 51-57.
Nasserinia, A., Ariff, M. & Fan-Fah, C. (2014). Key determinants of Japanese commercial
banks performance. Pertanika Journals Social Sciences & Humanities, 22 (5), 17-
38.
Nimalathasan, B. (2008). A comparative study of financial performance of banking sector
in Bangladesh – An application of CAMELS Rating System. Annals of University
of Bucharest, Economic and Administrative Series, No. 2, 141-152.
Nouaili, M., Abaoub, E. & Ochi, A. (2015). The determinants of banking performance in
front of financial changes: Case of trade banks in Tunisia. International Journal of
Economics and Financial Issues, 5 (2), 410-417.
Obamuyi, T. M. (2013). Determinants of banks’ profitability in a developing economy:
Evidence from Nigeria. Organizations and markets in Emerging Economies, 4 (2),
97-111.
Ogilo, F. (2012). The impact of credit risk management on financial performance of
commercial banks in Kenya. DBA Africa Management Review, 3 (1), 22-37.
Olalekan, A. & Adeyinka, S. (2013). Capital adequacy and banks' profitability: An
empirical evidence from Nigeria. American International Journal of Contemporary
Research, 3(10), 87-93.
Olweny, T. & Shipho, T. M. (2011). Effects of banking sectoral factors on the profitability
of commercial banks in Kenya. Economics and Finance Review, 1 (5), 01-30.

61
Ongore, V. O. & Kusa, G. B. (2013). Determinants of financial performance of commercial
banks in Kenya. International Journal of Economics and Financial Issues, 3 (1),
237-252.
Onuonga, S. M. (2014). The analysis of profitability of Kenya`s top six commercial banks:
Internal factor analysis. American International Journal of Social Science, 3 (5),
94-103.
Rao, K. R. & Lakew, T. B. (2012). Determinants of profitability of commercial banks in a
developing country: Evidence from Ethiopia. International Journal of Accounting
and Financial Management Research, 2 (3), 1-20.
Sangmi, M. & Nazir, T. (2010). Analyzing financial performance of commercial banks in
India: Application of CAMEL model. Pak. J. Commer. Soc. Sci, 4 (1), 40-55.
Saunders, M., Lewis, P. & Thornhill, A. (2012). Research methods for business students
(6th ed.). Harlow: Pearson.
Seelanatha, L. (2010). Market structure, efficiency and performance of banking industry in
Sri Lanka. Banks and Bank Systems, 5 (1), 20-31.
Uzhegova, O. (2015). The relative importance of industry- & country-specific factors for
bank performance in developed and emerging economies. Canadian Center of
Science and Education, 7 (7), 365-384.

62
APPENDIX A
DATA COLLECTION SHEET
2010 2011 2012 2013 2014 Mean
RETURN ON ASSETS = PAT/Total Assets
Profit After Tax
Total Assets
RETURN ON EQUITY = PAT/Shareholder's Equity
Profit after Tax
Shareholder's Equity
CAPITAL ADEQUACY = (Tier 1 + Tier 2
capital)/Riskweighted Assets
Tier 1 + Tier 2 Capital
Risk-weighted Assets
ASSET QUALITY =
NonPerforming Loans/Gross
loans
Non-performing Loans
Gross Loans
MANAGEMENT EFFICIENCY = Operating
income/ Total Income
Operating Income
Total Income (Interest and
Noninterest)
Top Related