


Languages
Pages
Legal


Erasmus School of Economics
To obtain the academic degree of Master of Science
Economics and Business (Major in Marketing)
Trust as center of sharing-economy businesses
Exploring how online platforms can effectively facilitate
trust between strangers to engage in ridesharing
Author: R.J.B. (Ronald) Hoek, 376740
Supervisor: Dr. N.M. (Nuno) Almeida Camacho
Study: MSc. Economics and Business, specialization Marketing Date: August 6, 2015

2
Abstract
Trust is found in practice as well in marketing literature to be an important driver of online
consumer purchase intentions, especially when the service or product embeds a high risk.
Theory of cues suggests that in case of unfamiliarity or limited information, consumers
engage in analyzing observable cues to form perceptions of quality, reliability and
trustworthiness. Literature of Need for Cognition indicates that those with a high need for
cognition are more likely to engage in effortful analysis of presented information while those
with a low need for cognition remain in superficial analysis.
This thesis tests the effect of perceived trustworthiness on the intention to engage in
ridesharing with a stranger through an online platform, and how an online platform can
effectively facilitate these trustworthiness perceptions by presenting different types of trust-
cues. Additionally, this research explores differences in effect of trust-cue types on trust
perceptions for people with a high need for cognition versus those with low need for cognition.
Through an online web-based experiment (n=255), six screenshots of online ridesharing-
profiles have been presented with varying presence of types of trust-cues originating from i)
the Community, ii) the Platform and iii) the Ride-offering agent. At each profile, respondents
were asked regarding their trustworthiness perceptions, likelihood to engage in ridesharing
and their willingness to pay. To prevent confounding effects, demographical characteristics,
prior attitude to the concept and general propensity to trust were being controlled for in the
models.
This study confirms existing literature by proving that trust is an important driver of
consumers’ intention to rideshare with a stranger through an online platform. From the three
dimensions of trust perceptions (perceived Ability, Benevolence and Integrity) perceived
ability is found to be the most important driver. Respondents react different when analyzing a
ridesharing profile for the first time compared to following profiles, indicating a strong learning
effect. Community-generated trust-cues are found to be superior to other types of trust-cues
by being the single affecter of trustworthiness perceptions in the first round and being the
strongest driver across all experimental rounds. Agent- and platform-generated trust-cues
also affect trust perceptions, but the effect sizes are less than one-third of community-
generated trust-cues. The higher one’s need for cognition, the more one is affected by
community- and platform-generated trust-cues, indicating that need for cognition affects the
way one interprets online trust-cues. For agent-generated trust-cues this effect has not been
found.
Managers of online consumer-to-consumer sharing platforms are advised to have a major
focus on facilitating trust between community members. Building perceptions regarding the
ability/ competence of the ride-offering agent has the biggest impact on ridesharing intentions.

3
Community feedback mechanisms function as the strongest affecter of trust and
consequently behavioral intentions and willingness to pay.
Key words: Trust, online trust-cues, sharing-economy, ridesharing, need for cognition,
consumer-to-consumer, platform design, online marketing.

4
Table of Contents
TABLE OF CONTENTS ............................................................................................................ 4
1. INTRODUCTION ................................................................................................................... 5
2. THEORY AND HYPOTHESES ............................................................................................. 9
2.1 Conceptual Framework ....................................................................................................... 9
2.2 Drivers of Ridesharing Likelihood: Trust Perceptions ....................................................... 10
2.3 Managing Trust Perceptions: The Role of Online Trust-cues ........................................... 12
2.4 The Moderating Effect of Need for Cognition .................................................................... 18
2.5 Control Variables ............................................................................................................... 19
3. EMPIRICAL RESEARCH ................................................................................................... 21
3.1 Methodology ...................................................................................................................... 21
3.2 Variable Measurements .................................................................................................... 23
3.3 Data Collection .................................................................................................................. 27
3.4 Validity and Reliability of Constructs ................................................................................. 28
4. RESULTS ............................................................................................................................ 30
4.1 Checking Assumptions ...................................................................................................... 30
4.2 Testing the Effect of Perceived Trustworthiness on Likelihood to Rideshare ................... 34
4.3 Testing Online Trust-cues on Perceived Trustworthiness ................................................. 37
4.4 Testing the Effect of Need for Cognition on the Effect of Trust-cue Source on Perceived Trustworthiness ....................................................................................................................... 43
4.5 Explorative Analysis .......................................................................................................... 45
5. CONCLUSIONS .................................................................................................................. 47
5.1 General Discussion ........................................................................................................... 47
5.2 Practical Implications ......................................................................................................... 48
5.3 Research Limitations and Directions for Future Research ................................................ 50
BIBLIOGRAPHY ..................................................................................................................... 52
APPENDICES ......................................................................................................................... 57

5
1. Introduction
“The currency of the new economy is trust” is what Rachel Botsman, thought leader on the
collaborative economy and author of the book What’s Mine is Yours, says in a popular TED-
talk held at the TEDGlobal event in Edinburgh, June 2012. She refers to the rise of
companies like AirBnB where reputation and trustworthiness are important drivers of
transactions between two consumers, who are complete strangers to each other. “A high
degree of trust is often required with collaborative lifestyles, because human-to-human
interaction, not a physical product, is often the focus of the exchange” (Botsman & Rogers,
2010, p. 73). Zak & Knack (2001) found through their cross-section empirical research across
37 countries that trust is a key driver of economic growth. In societies with high levels of trust
significant higher rates of investments take place. The importance of trust for creating
transactions is also described in the thesis of Adler (2001), who states that trust is - besides
price and market hierarchy - the third important dimension of the knowledge economy and the
future capitalism. As Tanz (2014) writes in an article in Wired about the fundamental impact of
the sharing economy and the importance of trust: “The sharing economy has come on so
quickly and powerfully that regulators and economists are still grappling to understand its
impact. But one consequence is already clear: Many of these companies have us engaging in
behaviors that would have seemed unthinkably foolhardy as recently as five years ago”,
referring to behaviors of sharing various products and services with strangers through online
mediating platforms.
This thesis focuses on consumer-to-consumer (C2C) trustworthiness evaluations via online
ridesharing platforms. For research purposes, ridesharing is expected to be an interesting
domain within C2C sharing platforms due to the fact most people commute on a daily basis
(an average of 2.65 movements per day in the Netherlands for the age of 12 and above1),
while importance of a reliable/trustworthy travel mode matters (Bhat & Sardesai, 2006).
Morency (2007) defines ridesharing as “ridesharing exists when two or more trips are
executed simultaneously, in a single vehicle”. Ridesharing is a transportation service provided
by individuals with empty seats in their car and are willing to invite others to join their ride,
mediated through an online platform. What differentiates this service from commercial
transportation services like taxis, public transportation is that participants of the service are
not part of a profit-organization or are registered as one. Currently the main accommodators
of ridesharing services in the Netherlands are Blablacar 2 , ANWB Samenrijden 3 ,
Filenetwerken4, Meerijden5 and Backseatsurfing6. Simular transportation services through
1 Centraal Bureau voor de Statistiek (2013). Retrieved from www.cbs.nl 2 Blablacar.nl. (2015, April). Retrieved from https://www.blablacar.nl/ 3 Samenrijden.nl. (2015, April). Retrieved from http://samenrijden.nl/ 4 Filenetwerken.nl. (2015, April). Retrieved from http://filenetwerken.nl/ 5 Meerijden.nu. (2015, April). Retrieved from http://meerijden.nu/ 6 Backseatsurfing.com. (2015, April). Retrieved from http://backseatsurfing.com/

6
online platforms are Uber7 and Lyft8. The difference between transportation services and
ridesharing services is that ride-sharers do not have a monetary incentive to act upon
(ridesharing services are based on a free service or -at maximum- a cost-sharing construct),
and the rides mostly consist out of long distance traveling (international or cross-country). For
transportation services like Uber and Lyft, the monetary incentive is stronger and the rides
mostly consist of middle or short distances.
Most of the research on ridesharing has been conducted in North America, where ridesharing
and carpooling is more adopted than in European countries, most likely due to governmental
stimulation of ridesharing initiatives like carpooling lanes, carpool parking subsidies, several
ride matching programs and increase of gas prices (Saranow, 2006). In 2011 ridesharing
represented approximately 8 and 11% of the transportation mode share in Canada and the
USA respectively, and approximately 638 ride matching programs are present in North
America (Chan & Shaheen, 2012). Ridesharing has been researched in several domains.
Prior research has focused on topics such as optimizing demand and supply through
technology (Agatz, Erera, Savelsbergh & Wang, 2010 & 2011; Brereton, Roe, Foth, Bunker &
Buys, 2009), optimizing matches based on preferences, trip accessories and payment
(Kamar & Horvitz, 2009; Kleiner, Nebel & Ziparo, 2011), employer-based and region-based
programs to stimulate ridesharing between employees (Hwang & Giuliano, 1990; Cervero &
Griesenbeck, 1988), and optimization models to enable ridesharing with passenger transfers
on public transport and between different car-sharers (Coltin & Veloso, 2013; Huwer, 2004).
While many studies focus on the technological and practical issues around ridesharing, little
or no research has been found on the role of trust and personality around the likelihood of
engaging in the context of ridesharing with a stranger. Trust however is suggested by
practitioners as one of its main tenets (Tanz, 2014) and in marketing literature there is a long
tradition of studying trust and its effects on marketing- and brand-related constructs (e.g.
Garbarino et al., 1999; Kelton et al., 2008; Levin et al., 2004; Moorman et al, 1993; Morgan et
al., 1994; Resnick et al., 2002; Sirdeshmukh et al., 2002).
People have to rely on strangers in the context of ridesharing because they limited
information available regarding the trustworthiness of the ride provider. But how does a ride-
seeker create the perception of a ridesharing stranger being trustworthy enough to feel
comfortable to rely on that particular person? Moreover, which types of consumer are more or
less likely to trust others and, consequently are more likely to adopt ridesharing or other
sharing economy services? Importantly, can sharing economy platforms shape these trust
perceptions? If yes, how? This thesis builds on existing research in behavioral and social
sciences to develop theory-based hypotheses about the antecedents and consequences of
trust in this new sharing economy.
7 Uber.com (2015, April). Retrieved from https://www.uber.com/ 8 Lyft.com (2015, April). Retrieved from https://www.lyft.com/

7
For instance, the homophily literature, in psychology and sociology, suggests that people
believe that others in their own demographic group are more honest, trustworthy, and
cooperative than those in different groups (Brewer, 1999; McAllister, 1995; Tsui & O’Reilly,
1989). McPherson, Smith-Lovin & Cook (2001) found literature with homophily on cases of
similarity of demographic characteristics such as age, sex, race/ethnicity, education and
psychological characteristics like intelligence, attitudes, and aspirations. Chatman & Flynn
(2001) found that in case of unfamiliarity, people tend to rely on observable characteristics
like sex, race and origin to categorize and predict someone’s behavior, where in case of
demographic dissimilarity the cooperativeness is to be found lower. In these studies it is
recognizable that people build their perceptions of trustworthiness about a stranger based on
physical observable cues.
The ‘cues theory’ suggests that firms may use specific cues to foster trust (Akerlof, 1970). In
the absence of information about the agents, consumers rely on (online) trust-cues – which
firms can display on their online and mobile platforms - which they use to infer the level of
trustworthiness deserved by a certain provider. But how does one evaluate the trust-cues that
firms decide to include on their platforms? Credibility evaluations aim to reduce risk, which is
found to take place through source credibility estimation (Lucassen & Schraagen, 2011 and
2013). Kelton, Fleischmann & Walace (2008) stated that when a trust source is not perceived
as reliable, one might decide to ignore the presented information completely, especially when
the credibility of information is very important for the matter. Source credibility is found to
have a direct effect on behavioral intentions and attitude change in the context of consumer
advertising and business (Gotlieb & Sarel, 1991; Homer & Kahle, 1990; Ward & McGinnies,
1974; Woodside & Davenport, 1974). Since one estimates the accurateness of information by
their perception of the credibility of the source in the context of business and consumer
buying intentions, it is expected that the same evaluation takes place when evaluating the
credibility of trust-cues on online platforms. Based on own observational research of 15 online
C2C platforms in several domains of C2C sharing, 17 online trust-cues have been identified
and a priori segmented based upon three sources from where the trust-cues origin; (i) the
agent, (ii) the platform and (iii) the community. This thesis focuses on the effect of these
sources of trust-cues on trust perceptions.
There are also characteristics of the individual consumer that could effect to what extent a
consumer is influenced by the aforementioned drivers of trust (e.g. trust-cues) before
adopting a shared service. Verplanken, Hazenberg & Palenéwen (1992) found that
individuals with a high need for cognition (NFC) put more effort in external information search
than individuals with low NFC. Therefore it is expected that individuals with a high NFC put
more effort in analyzing the presented information on the online platform regarding the agent
who is to be trusted, and consequentially are more likely to take into account the cue source.
Individuals with low NFC who are more likely to base their decision on simple and easy to

8
interpret cues without putting extra effort by analyzing the trustworthiness of the source. The
trust-cue source is therefore expected to have a larger impact in the decision making of
individuals with high NFC than of those with low NFC.
The main objective of this study is to propose a theory-based framework to empirically test
the effect of trust-cue source in C2C trustworthiness evaluations through online ridesharing
platforms. This study hypothesizes that this effect is moderated by the need for cognition, and
consequently the effect of the perceived trustworthiness on the likelihood to engage into
ridesharing activities. Hence, this study provides insights on the importance of trustworthiness
for consumers to engage into transaction with other consumers, and how trust can be most
effectively be facilitated through an online mediating platform.
The results of this thesis have strong managerial implications given the rapid rise of the
sharing economy. Over the last years, the importance of this matter has increased
significantly due to the rise of the “Collaborative economy”- or “Sharing economy”- with online
C2C companies similar to AirBnB, like CouchSurfing, LeftoverSwap, TicketSwap, TaskRabbit,
IndieGogo, KickStarter, Lyft, Blablacar and many other initiatives9. In 2014, Timm Teubner
found over 200 start-ups, backed by a funding of around two billion US Dollars, competing in
the growing market for peer-to-peer sharing of physical assets like cars, rides,
accommodations, tools, toys, apparels, household appliances and much more (Teubner,
2014). This research thus provides start-up companies and managers of these online C2C-
companies insights in the importance of trust for their business model and how to effectively
facilitate C2C trust in an online environment. This thesis also answers the call from the Dutch
Hitchhiking association (Nederlandlift 10 ) for research on the domain of hitchhiking and
ridesharing regarding motivations and barriers of active participation.
After this introduction, this report continues with Chapter 2 that presents the conceptual
framework and the underlying theories to support the tested hypotheses. The research
methodology and measurements are presented in Chapter 3. Chapter 4 provides the analysis
of the data collected from the conducted field research, and concludes into results. Chapter 5
elaborates further on the found results and concludes in managerial implications, academic
contributions and directions for further research.
9 Framework: Collaborative Economy Honeycomb. (2015, April 17). Retrieved from http://crowdcompanies.com/blog/framework-collaborative-economy-honeycomb/ 10 Wat doet Nederlandlift; wetenschappelijk onderzoek. (2015, April 15). Retrieved from http://www.nederlandlift.nl/wat-doet-nederlandlift/wetenschappelijk-onderzoek/

9
2. Theory and Hypotheses
2.1 Conceptual Framework
This chapter elaborates on the underlying theories of the variables and presents the
hypotheses of the current study. As a result of the presented theories of this chapter a
conceptual framework is developed and presented below (figure 1) as a reading guide for the
following paragraphs.
Figure 1 Conceptual framework
Throughout this thesis ‘the ridesharing service’ means the actual event of ridesharing where
an individual (the ridesharing or ride-providing agent) gives a ride to another individual (the
ride-seeker or ride-consuming agent). The trustor is defined as the person who trusts, and the
trustee is the person who is to be trusted.

10
2.2 Drivers of Ridesharing Likelihood: Trust Perceptions
Several definitions for trust have been found in the academic literature. Moorman, Zaltman,
and Deshpande (1992) define trust as "a willingness to rely on an exchange partner in whom
one has confidence". Morgan & Hunt (1994) define trust as “existing when one party has
confidence in the exchange partner's reliability and integrity". This thesis adopts the following
more developed and widely accepted definition from Rousseau et al. (1998): “Trust is a
psychological state comprising the intention to accept vulnerability based on positive
expectations of the intentions or behaviors of another”.
Trust has been extensively described as an important factor for online businesses
(Balasubramanian, 2003; Urban et al., 2000; Bart et al., 2005) and therefore marketing
scholars have devoted considerable attention to the trust construct. In marketing, trust has
been found as a strong driver for customer relationship (Garbarino, & Johnson, 1999),
customer value and loyalty (Reichheld & Schefter, 2000; Sirdeshmukh, Singh & Sabol, 2002),
customer adoption of new technology (Suh & Han, 2003) and many other domains of
consumer behavior. Mayer, Davis & Schoorman (1995), Davis, Schoorman, Mayer & Tan
(2000) and Gil, Boies, Finegan & McNally (2005) found that intentions to accept vulnerability
sterns from the perceived ability, benevolence and integrity of the trustee. The factors of
trustworthiness are defined as following: (i) perceived ability, (ii) perceived benevolence and
(iii) perceived integrity (Mayer et al., 1995). These factors are discussed each in turn.
First, perceived ability refers to the trustor’s belief that the trustee is able to successfully
perform a specific task for a specific domain. Note that this means that when someone is
trusted to be competent doing one task, it does not automatically mean the same person is
trusted for any other task as well. Other synonyms of perceived ability in research, found by
Mayer et al. (1995), are competence, expertise and expertness.
Second, perceived benevolence means that the trustee has the best interest at heart for the
trustor, meaning that the trustee wants to do good to the trustor aside from an egocentric
profit motive. Mayer et al. (1995) found in other research similar factors that overlap with
benevolence like openness, caring, goodwill, intentions and motives.
Third, perceived integrity is the perception that the trustee is committed to a specific set of
principles that the trustor finds acceptable. Issues as the consistency of the party's past
actions, credible communications about the trustee from other parties, belief that the trustee
has a strong sense of justice, and the extent to which the party's actions are congruent with
his or her words, all affect the perception of the degree to which the party is committed to
their integrity. Overlapping phenomena in other research, found by Mayer et al. (1995), are
value congruence, consistency, character and openness/congruity.

11
Hitchhiking and carpooling requires a certain level of trust in the other party, since one has to
accept their dependency on a stranger. Theory suggests one bases trustworthiness
perceptions on expectations of the intentions and behavior of another. Based on the above
mentioned theories and findings, it is expected that a consumer’s decision to engage, or to
not engage, in ridesharing is partly determined by perceived trustworthiness which comes
from the three underlying factors ability, benevolence and integrity. Therefore it is
straightforwardly posited that:
H1a: The higher the perceived ability of the agent, the higher the probability that a consumer
will engage in ridesharing
H1b: The higher the perceived benevolence of the agent, the higher the probability that a
consumer will engage in ridesharing
H1c: The higher the perceived integrity of the agent, the higher the probability that a
consumer will engage in ridesharing

12
2.3 Managing Trust Perceptions: The Role of Online Trust-cues
The quality of ridesharing and - inevitably connected - the trustworthiness and reliability of the
ride-sharer is prior to the event not clear for the ride-seeking agent. It is expected from the
signaling theory that in such scenarios -when the ride-seeker is building perceptions- he/she
relies on signals to infer quality and risk (Akerlof, 1970; Ippolito, 1990; Spence, 1973).
Especially in online environments signaling takes place due to the lack of other significant
cues and higher perceived risk compared to real-life environments (Biswas & Biswas, 2004).
Urban (2000) writes that a key factor to build online trust is to “maximize cues that build trust
on your web site”. On online platforms many different mechanisms are present to function as
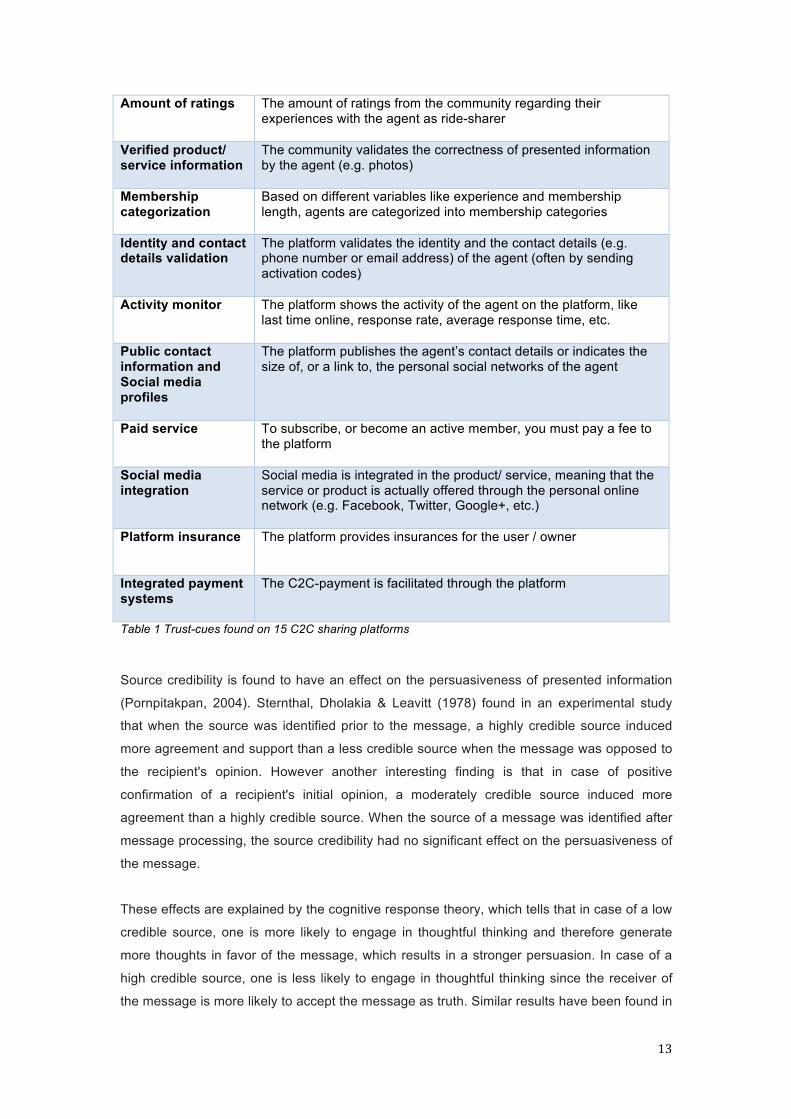
trust-cue. By analyzing 15 online C2C platforms11 in several domains of C2C sharing, 17
trust-cues regarding the ride-providing agent have been found and are presented in Table 1.
The found theory of trust-cues will be explained in the following paragraphs.
Trust cues Description
Profile picture The agent can upload a picture to his/her profile
Personal preference
The agent can indicate his/her preference regarding the product or service like willingness to talk, music, smoking or inviting pets
Personal profile summary
The agents can write a brief summary to introduce themselves and/or indicate their intentions
Service/ product details
The details of the product or service the agent offers
Reviews sentiment / valence
The sentiment (positive or negative) of the written reviews from the community regarding their experiences with the agent
Amount of reviews The amount of the written reviews from the community regarding
their experiences with the agent
Average and dispersions of Rating
The average score, and dispersion, of all ratings from the community regarding their experiences with the agent as ride-sharer
11 Blablacar.nl. (2015, April). Retrieved from https://www.blablacar.nl/ Samenrijden.nl. (2015, April). Retrieved from http://samenrijden.nl/ Airbnb.com (2015, April). Retrieved from https://www.airbnb.com/ Filenetwerken.nl. (2015, April). Retrieved from http://filenetwerken.nl/ Carmapool.com. (2015, April). Retrieved from https://carmacarpool.com/ Couchsurfing.com (2015, April). Retrieved from https://www.couchsurfing.com/ Ticketswap.nl. (2015, April). Retrieved from https://www.ticketswap.nl/ Getaround.com. (2015, April). Retrieved from https://www.getaround.com/ Peerby.com. (2015, April). Retrieved from https://www.peerby.com Snappcar.nl. (2015, April). Retrieved from https://www.snappcar.nl Thuisafgehaald.nl. (2015, April). Retrieved from http://www.thuisafgehaald.nl/ Backseatsurfing.com. (2015, April). Retrieved from http://backseatsurfing.com/ Meerijden.nu. (2015, April). Retrieved from http://meerijden.nu/ Spinlister.com. (2015, April). Retrieved from https://www.spinlister.com/ Relayrides.com. (2015, April). Retrieved from https://relayrides.com/
13
Amount of ratings The amount of ratings from the community regarding their experiences with the agent as ride-sharer
Verified product/ service information
The community validates the correctness of presented information by the agent (e.g. photos)
Membership categorization
Based on different variables like experience and membership length, agents are categorized into membership categories
Identity and contact details validation
The platform validates the identity and the contact details (e.g. phone number or email address) of the agent (often by sending activation codes)
Activity monitor The platform shows the activity of the agent on the platform, like last time online, response rate, average response time, etc.
Public contact information and Social media profiles
The platform publishes the agent’s contact details or indicates the size of, or a link to, the personal social networks of the agent
Paid service To subscribe, or become an active member, you must pay a fee to the platform
Social media integration
Social media is integrated in the product/ service, meaning that the service or product is actually offered through the personal online network (e.g. Facebook, Twitter, Google+, etc.)
Platform insurance The platform provides insurances for the user / owner
Integrated payment systems
The C2C-payment is facilitated through the platform
Table 1 Trust-cues found on 15 C2C sharing platforms
Source credibility is found to have an effect on the persuasiveness of presented information
(Pornpitakpan, 2004). Sternthal, Dholakia & Leavitt (1978) found in an experimental study
that when the source was identified prior to the message, a highly credible source induced
more agreement and support than a less credible source when the message was opposed to
the recipient's opinion. However another interesting finding is that in case of positive
confirmation of a recipient's initial opinion, a moderately credible source induced more
agreement than a highly credible source. When the source of a message was identified after
message processing, the source credibility had no significant effect on the persuasiveness of
the message.
These effects are explained by the cognitive response theory, which tells that in case of a low
credible source, one is more likely to engage in thoughtful thinking and therefore generate
more thoughts in favor of the message, which results in a stronger persuasion. In case of a
high credible source, one is less likely to engage in thoughtful thinking since the receiver of
the message is more likely to accept the message as truth. Similar results have been found in

14
a study about buy and lease situations of personal computers (Harmon & Coney, 1982),
information trustworthiness on Wikipedia (Lucassen & Schraagen; 2011, 2013) and have
been found to have a direct effect on behavioral intentions and attitude change in the context
of consumer advertising and business (Gotlieb & Sarel, 1991; Homer & Kahle, 1990; Ward &
McGinnies, 1974; Woodside & Davenport, 1974).
The most widely adopted dimensions of source credibility stern from the book of Hovland,
Janis & Kelley (1953): perceived expertise and trustworthiness. Expertise means that a
source is perceived to be capable of making correct assertions, and trustworthiness refers to
how the audience perceives the assertions to be considered valid by the source. This
research has identified three sources of trust-cues on 15 analyzed online platforms: (1) the
agent, (2) the platform and (3) the community. See table 2 below for a presentation of the
trust-cues per source. Each source will be discussed in turn in the following paragraphs.
Agent generated Community generated Platform generated Profile picture Reviews sentiment/
valence Membership categorization
Personal preference Amount of reviews Public contact information and social media profiles
Personal profile summary Average ad dispersion of Rating
Identity and contact details validation
Service/ product details Amount of ratings Activity monitor
Verified product/ service information
Paid service
Social media integration
Insurance
Integrated payment systems
Table 2 Trust-cues a priori segmented based on source
2.3.1 Agent-generated Trust-cues
The first segment of trust-cues is the agent-generated trust-cues. Agent-generated trust-cues
are cues of trust created by the ridesharing agents about themselves. Research has found
that the digital presentation of the self is often not similar to the actual self, but a preferred
subset of the actual self. In other words, people are selling themselves based on the context
and purpose of the online environment and the assumed viewers. Schau et al. (2003) found
“constructing a digital self” and “projecting a digital likeness” as strategies involved in creating
a digital self-presentation. As Belk (2013) concludes in the context of virtual self-
representation when creating a digital avatar; “The relative freedom of configuring our avatar

15
bodies has led some to suggest that our avatars represent our ideal selves, possible selves,
aspirational selves, or a canvas on which we can “try out” various alternative selves”. Biswas
& Biswas (2004) states that sellers have the role, in case of information asymmetry, to
undertake certain activity to send out appropriate “signals” to the recipient. Since this type of
behavior is common, it is expected that the communicated self is perceived less reliable than
objective information, which makes the source less reliable to indicate someone’s actual
trustworthiness. In other words; ride providing agents have an incentive to sell themselves as
decent ride-providers, with the goal to communicate positive perceptions regarding
themselves, which makes them by default a biased source for trustworthy information.
However, Teubner, Adam, Camacho & Hassanein (2014) found through a study on profile
pictures on C2C sharing websites that a higher degree of picture humanization is found to
have a positive effect on social presence which in turn positively effects sharing behavior due
to increase of trust and perceived reciprocity. This study gives an indication that, even though
a self-presentation strategy might be present, the more information someone shows
regarding themselves the higher the perceived trustworthiness due to increase of
transparency. Therefore it is expected that agent-generated cues of trustworthiness is a
strong indicator of someone’s benevolence and consequently someone’s perceived
trustworthiness. In conclusion the following hypothesis is formulated;
H2a: The presence of agent-generated trust-cues positively influences the perceived
trustworthiness of the ridesharing agent
2.3.2 Community-generated Trust-cues
This thesis defines community-generated trust-cues as: “indication of trustworthiness
regarding the agent, generated by the community of ride-sharers on a platform”. As Floridi
observes, after stating that social media like Facebook enables people to enter in a voluntary
panopticon, “with the scope for naive lying about oneself on Facebook is increasingly reduced
(these days everybody knows if you are, or behave like, a dog online)” (Belk, 2013). People
are likely to be revealed on internet when lying because of the social control by the connected
community. The community reacts positively (or negatively) and therefore rewards (or
punishes) accepted (or not-accepted) behavior. On online platforms the same mechanism
exist. Due to ratings and reviews from the community the actual behavior of an agent is
revealed. This is opposing to agent-generated trust-cues or platform-generated trust-cues,
which indicates the trustworthiness of the agent prior to an actual event of ridesharing. The
expectations are that community-generated trust-cues are therefore considered important
affecters of trust perceptions regarding the ride-provider.
A study of Forman, Ghose & Wiesenfeld (2008) found that reviewer identity enclosure in
online stores has a positive effect on consumer judgement of product reviews, meaning that a

16
positive indication of trust-cue credibility has a positive effect when forming a judgement.
Several studies found that electronic reputation systems where community feedback is
present have a positive effect on credibility and positive feedback has positive influence on
consumer trust perceptions (Ba & Pavlou, 2002; Zhao, Yang & Zhao, 2013; Resnick &
Zeckhauser, 2002). Chevalier & Mayzlin (2006) found that online word of mouth (WOM) has a
positive effect on book sales. Bolton, Katok & Ockenfels (2004) found in an experimental
investigation that electronic reputation systems work positively on the efficiency of
transactions by offering information about the trustworthiness of an agent. Therefore the
following hypothesis is stated;
H2b: The presence of community-generated trust-cues positively influences the perceived
trustworthiness of the ridesharing agent
2.3.3 Platform-generated Trust-cues
Besides agent and community-generated cues of trustworthiness, the platform (or facilitating
organization) also provides information regarding the trustworthiness of the agent. As
facilitator of transactions between agents on the platform, the organization behind the
platform has the objective to stimulate activity, so therefore induces trustworthiness of the
platform as well of the individuals on it. Stewart (2003) found that recommending and linking
to an unknown website by a known and trusted website, has a significant positive effect on
the trust perception regarding the unknown website and positively affects the intention to buy.
This indicates that consumers value recommendations from trusted websites. When the
platform is perceived trustworthy, it is expected that the platform can positively influence the
ride-seekers’ perceptions regarding ride-providing agents.
Pavlou & Gefen (2004) found that a buyer’s perception of an effective third-party institution
effectively can facilitate trust in individual sellers, as well in the whole community of sellers, by
offering mechanisms of effective market feedback of past behavior, legal guarantees and
trusted payment systems. Bart et al. (2005) found the following drivers for website
trustworthiness: privacy, security, navigation and presentation, brand strength, advice, order
fulfillment, community features and absence of errors. The impact of each factor on website
trust differs across website categories and consumers. The three most important factors for
community websites to induce trust are (in descending order of importance) brand strength,
privacy and absence of errors. The expectation is that when a website performs information
validation and screening of agents, the consumer values the credibility of these cues, apart
from personal experiences, based on brand strength, privacy and absence of error on the
platform.
H2c: The presence of platform-generated trust-cues positively influences the perceived
trustworthiness of the ridesharing agent

17
2.3.4 The Relative Importance of Different Types of Trust-cues
The previous sections discussed theory regarding the three major sources of trust-cues,
resulting into hypotheses that expect a positive effect of such trust-cues on the perceived
trustworthiness. In this thesis, however, in this thesis the goal is to go beyond these
descriptive expectations and compare the relative importance of different type of trust-cues in
their effectiveness to build trust perceptions regarding the ridesharing agent and document
differences in their relative importance.
Ford, Smith & Swasy (1990) found that consumers are more skeptical to subjective claims
than objective claims. Similar constructs have been found regarding partisan versus
nonpartisan sources in the context of advertising, where infomercials (perceived nonpartisan)
have a stronger effect than advertisements (perceived partisan) on recall, forming attitude
and purchase intentions (Singh, Balasubramanian & Chakraborty; 2000). This indicates that
consumers value objective and nonpartisan information higher and perceive them more
reliable.
Trusov, Bucklin & Pauwels (2009) showed similar results on new member sign-ups for a
social network, where the effect of positive online WOM is stronger than traditional marketing
(media exposure). A similar effect is found in online trust-cue evaluations in tourism where
Sparks, Perkins & Buckley (2013) compared product information from visiting tourists
(community-generated) with information from the manager of the resort (service-offering
agent). The study of Sparks et al. also found that community-generated information has a
stronger effect on forming positive beliefs and trust perceptions than information from the
manager of the resort. Therefore it is expected that community-generated trust-cues are the
strongest effectors of perceived trustworthiness, resulting in the following hypotheses;
H3a: Community-generated trust-cues have stronger positive effect on perceived
trustworthiness of the ridesharing agent than agent-generated trust-cues.
H3b: Community-generated trust-cues have stronger positive effect on perceived
trustworthiness of the ridesharing agent than platform-generated trust-cues.
In the same line of reasoning as the above-mentioned findings regarding objective versus
subjective claims as well partisan versus nonpartisan sources, the same is expected
regarding the comparison of effect of platform-generated trust-cues and agent-generated
trust-cues on perceived trustworthiness. As agent-generated trust-cues are generated with a
more subjective and partisan perspective because a ride-offering agent has the objective to
sell, the following hypothesis is stated;

18
H3c: Platform-generated trust-cues have stronger positive effect on perceived trustworthiness
of the ridesharing agent than agent-generated trust-cues.
2.4 The Moderating Effect of Need for Cognition
As discussed in the introduction, the expectation is that the effect of trust-cues on
trustworthiness perceptions (and thus on the probability that a consumer engages in
ridesharing) to be moderated by the consumer’s need for cognition. Petty, Briñol, Loersch &
McCaslin (2009) define need for cognition (NFC) as “the tendency of people to vary in the
extent to which they engage in and enjoy effortful cognitive activities,” where the higher the
NFC the more likely one is to engage in effortful cognitive activities.
An individual with high NFC is expected to evaluate information presented on the web more
thoroughly than those with a low NFC. High NFC is expected to result in a deeper analysis of
the presented trust-cues regarding the agent, meaning that the individual is more likely to be
aware of the trust-cue source and willing to put extra effort in using this information in the
decision making process, also known in the Elaboration likelihood model (ELM) as the central
route (Haugtvedt, Petty & Cacioppo, 1992; Cacioppo, Petty & Morris, 1983). Vice versa, an
individual with low NFC is expected to make a fast decision based on a superficial analysis of
the presented information, known in the ELM as the peripheral route (Carter, Hall, Carney &
Rosip, 2006). Individuals with a low NFC mostly focus on simple cues as attractiveness,
appearance, frame of the message and their own emotional state (Cacioppo, Petty, & Feng
Kao, 1984). For individuals low on NFC, trust-cue source is therefore expected to have limited
effect in the decision-making process, resulting in little effect of the trust-cue source on trust
perceptions towards the ridesharing agent. Therefore this study states the hypothesis;
H4: High need for cognition has a positive effect on the effect of trust-cue source on
trustworthiness perceptions regarding a ridesharing agent on an online C2C ridesharing
platform.
19
2.5 Control Variables
2.5.1 Consumers’ Propensity to Trust
The definition of trust adopted from Rousseau et al. (1998) emphasizes on ‘a psychological
state comprising the intention to accept vulnerability’. This implies that a person needs to be
open to being in the psychological state to accept the required vulnerability. Therefore, before
any transaction between two parties can take place, under the condition that trust is an
important factor, a propensity to trust (or interpersonal trust) must exist prior to availability of
information about the trustee. Mayer et al (1995) define propensity to trust as an individual’s
general willingness to trust others. Someone with a high propensity to trust believes that the
majority of the people is honest and has good intentions and therefore is expected to trust
someone else relatively easy and is willing to accept the required vulnerability. Jarvenpaa et
al. (1998) define propensity to trust as a general personality trait that conveys a general
expectation of how trusting one should be. What all three definitions have in common, is that
propensity to trust is an attitude regarding others based on general expectations of
trustworthiness, where a high propensity to trust means a positive general expectation of
trustworthiness, and a low propensity to trust means a negative general expectation of the
trustworthiness of people. This definition emphasizes that propensity to trust has nothing to
do with the particular person who is to trust, nor the context of where trust is required.
The propensity to trust is deviating among people. Studies have found a difference in gender,
race and nationality dissimilarity (Alesina & La Ferrara, 2002; Glaeser et al., 2000). Besides
characteristics, Alesina & La Ferrara (2002) found that the history of a person influences their
propensity to trust others. A recent history of traumatic experience, or belonging to a group
that historically felt discriminated against, has a negative effect on the general propensity to
trust others. Leven et al. (2004) found that propensity to trust is a strong influencer of
accepting vulnerability required for knowledge transfer among colleagues on the workplace.
Before one is able to trust someone, a willingness and ability to trust must be present.
Therefore propensity to trust is added to control for the perceived trustworthiness of the
agent.
2.5.2 Previous Experiences
Doney & Cannon (1997) found in buyer-seller relationships that various variables influence
trust. But when controlling for previous experiences, neither trust nor the salesperson
influence a current suppliers’ buying decision. This means that in case of previous
experiences, trust has become a less important, or sometimes even irrelevant, factor for
buyer-seller decisions. Also in an online environment, Bart et al (2005) found in an
exploratory empirical study among 6,831 consumers across 25 websites that trust is most
important for infrequently purchased, high involvement goods and services. Therefore, to

20
control for the effect of (a frequent) purchase history for ridesharing, the categorical variable
‘previous ridesharing experience’ is being controlled for in the equation, interacting with the
influence of trust on the probability to engage in ridesharing.
2.5.3 A priori Word-of-Mouth
Besides actual personal experiences, there is elaborated literature available about the strong
influence of positive and negative recommendations and reviews from peers on attitude,
buying intentions and decisions (Engel et al., 1969; Dodson Jr. et al, 1978; Herr et al., 1991;
Liu, 2006). To control for the effect of WOM from other sources than the online ridesharing
platform on the probability to engage in ridesharing, WOM is added in the model, interacting
with the influence of trust on the probability to engage in ridesharing.

21
3. Empirical Research
This chapter explains the methodology of the empirical research conducted in this study.
Firstly it focuses on the experimental design. The second part presents the measurements of
the variables and the last part describes the process and results of the data collection.
3.1 Methodology
To conduct a solid empirical research for testing the aforementioned hypotheses, an
experiment with a modified 23 within subject-design is enrolled through a web-survey. A within
subject design is chosen to control for individual fixed effects, to allow for individual
comparisons and execute more powerful tests. Through a repeated-measures factorial design
a simulated platform is presented with all factors being held constant, except the varying
presence regarding agent, community and platform-generated trust-cues regarding the
ridesharing agent. After each experiment, the respondents were asked about their perceived
trustworthiness, behavioral intentions and willingness to pay regarding the presented profile.
To control for practice and boredom effects during the experiment (Field, A.; p17) a
randomization of order of treatments is included.
Since a profile without any trust-cue information is not valuable researching and confusing for
the respondent, the case of non-presence of all aspects is excluded from the research. To
maintain a balanced level of attributes in the design (Huber & Zwerina, 1996), the case of
presence of all aspects is also excluded, resulting in six versions of treatments, presented in
table 3 below (treatments A to F).
Experimental manipulations (1=present, 0=not present)
Agent
generated
trust-cues
Platform
generated
trust-cues
Community
generated
trust-cues
A 1 0 0
B 0 1 0
C 0 0 1
D 1 1 0
E 1 0 1
F 0 1 1
Table 3 Experimental manipulations
To design a strong experimental treatment, two major aspects of the online ridesharing
platform have been empirically tested a priori. Through a web-survey conducted from June 6
2015 till June 7 2015, the platform design and the profile picture to be used for the experiment
22
were pre-tested. This small pre-test had 28 respondents (16 males and 12 females) with an
average age of 30 years old. The results from this research gave solid evidence to base the
following decisions. The presented simulated ridesharing platform is based on the ridesharing
platform of Blablacar12, because Blablacar was found as the highest scoring regarding
“intention to go ridesharing” and scored high scores on trustworthiness and reliability
perceptions compared to the other platforms active in the Netherlands. Demographic
similarity was found to have a strong effect on perceptions of trustworthiness, so ten pictures
were pre-tested to find someone as much as neutral as possible. Five males and five females
were selected from a random person generator13. Of the tested pictures, picture 5 was
selected for the research because it showed the lowest variance (.841). See appendix A for
an elaboration on this pre-test. The experiment was designed with Adobe Photoshop CS5,
resulting in six different profiles, which are presented in appendix B.
12 Blablacar.nl. (2015, April). Retrieved from https://www.blablacar.nl/ 13 Randomuser.me (2015, June), Retrieved from https://randomuser.me/

23
3.2 Variable Measurements
To increase the validity and reliability of the survey, the introduction emphasized that there
are no "correct" answers, their honesty in responding to the questions is important to
obtaining psychometrically sound data, and their responses are anonymous (Cacioppo &
Petty, 1982).
3.2.1 Trust Measurements
This study adopts the measurements of benevolence, ability, integrity and propensity to trust
from Mayer & Davis (1999), which is presented in the table below. All questions are
measured on a 5-point Likert scale ranging from “Strongly disagree” to “Strongly agree”. To
keep the questionnaire brief and pleasant, this study adopts a limited amount of measures
because a respondent is forced to fill in all questions six times (after each treatment). Swain,
Weathers & Niedrich (2008) found that, due to increase of task complexity, the use of reverse
Likert items in surveys is likely to increase the chance of misresponse. Based on this finding,
the current research only adopts the positively stated dimensions from the literature. The
following table presents the adopted and not-adopted measures from Mayer & Davis (1999)
and presents the adjustments made to the context of ridesharing.
From Mayer & Davis, 1999
The current study
Ability Top management is very capable of performing its job.
This driver is very capable in providing a good ridesharing service
Top management is known to be successful at the things it tries to do.
Not adopted
Top management has much knowledge about the work that needs done.
Not adopted
I feel very confident about top management's skills.
I feel confident about the ridesharing skills of this driver
Top management has specialized capabilities that can increase our performance.
Not adopted
Top management is well qualified.
This driver is a well qualified ride-sharer
Benevolence Top management is very concerned about my welfare.
Not adopted
My needs and desires are very important to top management.
My needs and desires are very important to this driver

24
Top management would not knowingly do anything to hurt me.
This driver would not knowingly do anything to hurt me
Top management really looks out for what is important to me.
This driver really looks out for what is important to me
Top management will go out of its way to help me.
Not adopted
Integrity Top management has a strong sense of justice.
This driver has a strong sense of justice
I never have to wonder whether top management will stick to its word.
Not adopted
Top management tries hard to be fair in dealings with others.
This driver tries hard to be fair in dealing with clients
Top management's actions and behaviors are not very consistent.
Not adopted
I like top management's values.
Not adopted
Sound principles seem to guide top management's behavior
Sound principles seem to guide this driver’s behavior
Propensity to trust One should be very cautious with strangers.
Not adopted
These days, you must be alert or someone is likely to take advantage of you.
Not adopted
Most people can be counted on to do what they say they will do.
Adopted
Most people answer public opinion polls honestly.
Adopted
Most experts tell the truth about the limits of their knowledge.
Adopted
Most salespeople are honest in describing their products.
Adopted
Most repair people will not overcharge people who are ignorant of their specialty.
Adopted
Most adults are competent at their jobs.
Adopted
Table 4 Measurements of Perceived Ability, Benevolence and Competence, and Propensity to Trust, adopted from Mayer & Davis, 1999

25
3.2.2 Need for Cognition Measurements
To measure the Need for Cognition, nine positively coded measurements from the revised
version of the Need for Cognition scale from Cacioppo, Petty & Feng Kao (1984) are adopted
in the study and presented in table 5. For the Dutch version of the survey, the Dutch
translated and validated version from Pieters, Verplanken & Modde (1987) is used. In the
same line of reasoning as in paragraph 3.2.1, this research does not adopt the reversed
coded measurements (Swain, Weathers & Niedrich, 2008).
9 measurements of Need For Cognition (Cacioppo, Petty & Feng Kao, 1984) (Reversed coded measurements are excluded) I would prefer complex to simple problems. I like to have the responsibility of handling a situation that requires a lot of thinking. I find satisfaction in deliberating hard and for long hours. The idea of relying on thought to make my way to the top appeals to me. I really enjoy a task that involves coming up with new solutions to problems. I prefer my life to be filled with puzzles that I must solve. The notion of thinking abstractly is appealing to me. I would prefer a task that is intellectual, difficult, and important to one that is somewhat important but does not require much thought. I usually end up deliberating about issues even when they do not affect me personally. Table 5 Measurements of Need for Cognition from Cacioppo, Petty & Feng Kao (1984)
In the study of Cacioppo, Petty, Feinstein & Jarvis (1996) is found that there is little effect on
the use of different response scales (e.g., 5-point vs. 9-point) or anchors (e.g., very much
agree vs. extremely characteristic) on the NFC measurements. To maintain a pleasant
survey, and prevent misresponse, the same scale is used as in the measures of trust; a 5-
point Likert scale ranging from “strongly disagree” to “strongly agree”.
3.2.3 Previous Experience
To measure previous experiences of a respondent regarding ridesharing, as well as any other
form of making part of the sharing-economy, the respondents are asked if they ever had
experience with ridesharing through online platforms (yes or no). In case of experience,
respondents are asked if these experience(s) are mostly positive or negative. This question
divides the respondents into four categorical groups: (1) no past experience with ridesharing,

26
(2) positive past experience with ridesharing, (3) neutral past experience with ridesharing and
(4) negative past experience with ridesharing.
3.2.4 A priori Word of Mouth
To measure the Word-of-Mouth (WOM) knowledge of respondents regarding ridesharing prior
to the experiment, respondents were asked if they have heard about ridesharing platforms
before, and if so, if they have heard mostly positive or negative information. This question will
categorize respondents into four groups; (1) No WOM-knowledge about ridesharing platforms
prior the experiment, (2) positive WOM-knowledge about ridesharing platforms prior the
experiment, (3) neutral WOM-Knowledge about ridesharing platforms prior the experiment
and (4) negative WOM-knowledge about ridesharing platforms prior the experiment.
3.2.5 Attitude, Behavioral Intentions and Willingness to Pay
The survey presented the attitude and behavioral intentions questions on two levels. The first
level measured, prior being exposed to the experimental manipulations, the respondents’
attitude and behavioral intentions regarding ridesharing through online platforms on an overall
conceptual level. At the end of the survey-experiment the conceptual overall attitude and
behavioral intentions were asked again to measure if this changed by the course of the
experiment. The second level, on an individual case level, this study tests after each
treatment of the experiment the behavioral intentions of the respondents regarding the
presented ridesharing agent. This thesis adopted the measurements of attitude from Berger &
Mitchell (1989), which are two questions on a bipolar scale from ranging from one to seven,
indicating, “Like” to “Dislike”, and “Good” to “Bad”. Additionally some more measurements of
attitude are added as a control; useful to useless, beneficial to harmful, desirable to
undesirable and wise to foolish.
Besides the stated behavioral intention, the variable Willingness to pay (WTP) is added as
additional dependent variable. This thesis adopts the methodology from Van Doorn & Verhoef
(2011) for the stated WTP, which consist of the open question: how much are you willing to
pay for this product. For the context of this research, the hypothetical question is stated:
“consider a trip from Rotterdam to Brussels, for which a ticket by train costs on average 30
EURO. How much are you willing to pay to join this driver’s ride to Brussels?”. This method is
heavily debated in the literature for its validity to measure the actual willingness to pay, since
respondents are not incentivized to respond honestly. However, the objective of this research
is not to measure the actual willingness to pay, but to compare the difference between
treatments (Van Doorn & Verhoef, 2011). Therefore this methodology is perceived reliable
and is being used for this research.

27
3.3 Data Collection
As a result of the presented theory and hypotheses from chapter 2 and the research
methodology and measurements from the previous paragraphs of chapter 3, a web-based
survey-experiment is created and is presented in appendix B. Because of the international
characteristics of the research population, the survey has been published in two languages;
Dutch and English. The questions are translated from English to Dutch, and validated by
translating the questions back to English by an independent native Dutch university student
with a proficiency level of English. Before launching the survey to the whole research
population, the survey has been pre-tested through a soft launch to 10 respondents in both
Dutch and English with different levels of education (low and high), resulting in last feedback
regarding question formulations and a strong questionnaire.
The survey is published online with survey software Qualtrics14. To increase the amount of
respondents, as well the quality of response, an incentive was awarded to five random
respondents who completed the survey. The price consisted of one of the five coupons of
cinema Pathé of 10,- EUROS. Through the usage of cookies, respondents were prevented to
complete the survey more than once. To increase the reach of the survey campaign, an
incentive was offered to share the survey invitation on one’s Facebook profile, which triples
the chance of winning a coupon. This resulted in 48 post shares on Facebook. Since this
study has been conducted in a hypothetical situation with no consumption consequence for
the participants, respondents were not incentivized to answer honestly. Ding, Grewal, &
Liechty (2005), found that an incentive structure provides a strong motivation to answer
honestly, since the participants “have to live” with their decision and the effect of their answer
could affect them in real life. Therefore, at the end of the survey respondents were asked if
they prefer to win a cinema coupon or a coupon for ridesharing through Blablacar of the same
value of 10 Euro.
The online survey is distributed within the direct and indirect network of the researcher by
using personal invitation mails, social media and word-of-mouth by using ambassadors to
reach the secondary network of the researcher. The survey has been published from June 10
2015 to June 22 2015, resulting in 407 recorded responses of which 257 are completed
surveys. The completed surveys had a median completion duration of 14.8 minutes. After a
manual cleaning, checking for participants who participated twice, 255 completed surveys are
used for the analysis, resulting in 1,530 observations. From the sample of 255 respondents,
42.7% is female and the average age is 32.3 and median age of 27. The sample consists of a
majority of high-educated people with 55% university education, 30% higher education, 12%
middle and 3% low education. The majority of the respondents are working fulltime (62%).
12% of the respondents work part-time and 22% is a student. The nationality of the
14 www.qualtrics.com

28
respondents is mostly Dutch (92.5%), 3.1% is Greek and 1.2% German. See appendix C for
a complete table of demographics of the respondents.
3.4 Validity and Reliability of Constructs
In order to measure the validity and reliability of the measured constructs, a principal
component analysis (PCA) with orthogonal rotation (varimax) is conducted across all items of
Propensity to trust, Need for cognition, perceived trustworthiness and prior attitude towards
ridesharing through platforms. The factor analysis found five dimensions, due to two different
found dimensions within NFC, where NFC_1 and NFC_9 were outliers negatively affecting
the reliability of the measures. By excluding these items from the PCA, the factor analysis
found four dimensions (K-value >1) as expected. By deleting the two items the explained
variance, KMO and Cronbach’s Alpha did not change significantly. See the table below for a
presentation of the results of the final factor analysis.
Rotated factor
loadings Item-to-total
correlation Explained
variance
Kaiser-Meyer-
Olkin Measure of
Sampling Adequacy
Cronbach's Alpha
Need for cognition NFC_2 .762 .742 47.38% .839 0.812 NFC_3 .634 .652
NFC_4 .668 .665
NFC_5 .633 .638
NFC_6 .708 .710
NFC_7 .667 .679
NFC_8 .720 .722
Propensity to trust Prop_1 .710 .715 45.99% .817 .763 Prop_2 .722 .715
Prop_3 .659 .660
Prop_4 .644 .657
Prop_5 .713 .702
Prop_6 .587 .612 Prior Attitude PRIOR_ATT_1 .789 .803 67.69% .907 .902 PRIOR_ATT_2 .844 .837
PRIOR_ATT_3 .817 .835
PRIOR_ATT_4 .833 .820
PRIOR_ATT_5 .787 .811
PRIOR_ATT_6 .830 .829 Perceived Trustworthiness Agent Abil1 .870 .885 74.43% .941 .957 Abil2 .870 .877
Abil3 .864 .881
Ben1 .867 .846

29
Ben2 .836 .852
Ben3 .845 .842
Int1 .843 .846
Int2 .851 .869
Int3 .873 .865 Table 6 Results of Factor Analysis
The Kaiser-Meyer-Olkin measure verified the sampling adequacy for the analysis, KMO=.90
(between ‘great’ and ‘superb’ according to Field, 2009), and all KMO values for individual
items are >.817 which is well above the acceptable limit of .5 (Field, 2009). Bartlet’s test of
Sphericity measures X2 (378) p< .001, indicating that correlations between items were
sufficient large for PCA. Four components had eigenvalues over Kaiser’s criterion of 1 and in
combination explained 60.59% of the variance. The scree plot shows clearly 4 components
and given the large sample (>200) the 4 components are retained for further analysis. The
table below shows the factor loadings after rotation, item-to-total correlation, explained
variance, KMO and the Cronbach’s Alpha.
KMO and Bartlett's Test
Kaiser-Meyer-Olkin Measure of Sampling Adequacy. .898
Bartlett's Test of Sphericity
Approx. Chi-Square 25359.434
df 378
Sig. .000
Table 7 Results of KMO and Bartlett's Test

30
4. Results
4.1 Checking Assumptions
Before analyzing the data of the experiment through parametric tests, three major
assumptions need to be explored; independency, normality and homogeneity of variance
(Field, 2009).
Independency
The first tested assumption is independency between observations. Since the research
design consists out of between- and within-subject data, a randomization of experiments must
be present. Since the experiment is an online web survey, all respondents participated
individually, anonymously and therefore independently between subjects. Therefore this
paragraph will focus on within-subject independency.
To assure independency within subjects, a randomization has been included in the treatment
order of the experiment. To test if this has been executed properly a one-sample Chi-Square
is executed to test (H0) if the six treatments discussed above occur equally across the six
rounds of my experiment. The table below shows that there is no significantly unequal
allocation of treatments across the six rounds (Chi-square, p>.05), meaning that the
randomization across experiments has been executed properly.
Experiment 1st round
2nd round
3rd round
4th round
5th round
6th round Total
A 43 40 48 41 43 40 255 B 45 52 33 38 40 47 255 C 35 48 41 52 31 48 255 D 53 40 36 32 52 42 255 E 39 34 52 52 41 37 255 F 40 41 45 40 48 41 255
Total 255 255 255 255 255 255 1,530 Chi-Square
(Sig.) 0.479 0.430 0.292 0.185 0.292 0.834
H0 (α=.05) Retain H0
Retain H0
Retain H0
Retain H0
Retain H0
Retain H0
Table 8 Count of experimental treatments per round
To decide if all rounds, or only the first experimental round can be used for further analysis,
we have to compare if respondents answered the first round significantly different from all
other rounds, on average. Table 9 presents the average of the variables of within-subject
measurements; perceived benevolence, perceived ability, perceived integrity, perceived trust,
attitude, intention and willingness to pay (WTP). The test found a significant (Two-tailed
Paired Sample T-test, p < .05) difference between the first round and the average round in
the independent variables perceived benevolence and perceived ability, and in the dependent
variables attitude, intention and WTP. This could be due to practice or boredom effect, and/or

31
because the first round functioned as a reference point for the next rounds. Under the
assumption of boredom and practice effects, one could state that only the first round must be
used. However, since there is no prove that the boredom or practice effect differs between
respondents, we can assume that this effect is equal over treatments. Therefore the first
round of experiments, as well all treatment-rounds, are used for further analysis, and possible
differences are discussed.
Paired Sample T-test
Round 1st 2nd 3rd 4th 5th 6th All 1st -
All t
Sig. (2-
tailed)
Average Perceived Benevolence (scale 1-5) 3.21 3.27 3.33 3.35 3.32 3.30 3.30 -0.085 2.57 .011 Average Perceived ability (scale 1-5) 3.64 3.51 3.61 3.59 3.52 3.52 3.57 0.079 -2.07 .040 Average Perceived integrity (scale 1-5) 3.32 3.33 3.35 3.39 3.33 3.29 3.34 -0.015 0.47 .641 Average Trust (scale 1-5) 3.39 3.37 3.43 3.44 3.39 3.37 3.40 -0.007 0.22 .822 Average attitude (proportion = yes) ( scale 0-1) 0.79 0.69 0.69 0.66 0.66 0.63 0.69 0.102 5.19 .000 Average Intention (scale 0-10) 6.40 5.84 5.90 5.79 5.63 5.50 5.84 0.559 5.86 .000 Average WTP 17.6 16.6 16.8 16.7 16.3 16.4 16.8 0.888 4.22 .000 Table 9 Mean of dependent variables per experimental round
Since subjects are randomly selected into treatments, and consequently also in the first
treatment, we have to test if the demographic characteristics across treatment groups in the
first round are unequal. To test for this, a chi-square test is executed among daily occupation
(χ2(15) = 13.075, p = .597), education (χ2(10) = 16.668, p = .082), gender (χ2(5) = .793, p =
.977) and age categories (χ2(15) = 14.847, p = 462). Also NFC (low, average, high NFC)
(χ2(10) = 13.753 p = 185), prior attitude (negative vs. neutral vs. positive) (χ2(10) = 5.460, p =
.858), prior WOM (yes, no) (χ2(5) = 6.503 p = .260) and propensity to trust (low, average and
high) (χ2(10) = 6.899, p = .735) are tested for unequal proportion over experimental
treatments. See the appendix for the SPSS output of these results. Since none of the Chi-
square tests is significant, the H0 (equal proportion of categories across groups) cannot be
rejected and it can be stated that, in the present dataset, all treatments and measurements
are independently executed. In other words; respondents are randomly and equally divided
into treatment groups.

32
Homogeneity of variance
Homogeneity of variance means that the variance of variables must be the same throughout
the data (Field, 2009). In this context, this means that the variance of variables between the
six treatment groups in the first round must be equal. Levene’s test tests if the null hypothesis
(H0), that the variance of treatments is equal, can be rejected. This analysis is executed by a
one-way ANOVA through SPSS. See the table below for a presentation of the results. For all
variables the variance is the same across all 6 experiments (p > .05), and therefore we can
assume that the homogeneity of variance assumption is not being violated.
Test of Homogeneity of Variances Levene Statistic df1 df2 Sig. Benevolence 1.054 5 249 .387 Ability 1.212 5 249 .304 Integrity 1.618 5 249 .156 Trust .546 5 249 .742 INTENT 1.703 5 249 .134 WTP .781 5 249 .564 NFC_MEAN 2.022 5 249 .076 Prop_MEAN .791 5 249 .557 PRIOR_ATT_MEAN 1.676 5 249 .141 Table 10 Results of Test of Homogeniety of Variances
Normality
Parametric as well non-parametric tests require a normal distribution of the sampled data.
This paragraph explores the distributions of the dependent variables and transforms the data
to normal distributed data.
Trust shows a negative skewness (-.520, std. error .063) with a z-score of 8.31 > 3.29 (p >
.10), indicating a pile up of scores on the right side of the distribution. The kurtosis is strongly
positive (1.172, std. error .125), with a z-score of 9.37 > 3.29 (p < .10) indicating a flat and
light-tailed distribution. Intention to rideshare shows a strong negative skewness (-1.264, std.
error .153) with a z-score of 8.3 > 3.29 (p < .10) indicating a pile up of scores on the right side
of the distribution. The kurtosis is strongly positive (1.450, std. error .304), with a z-score of
4.8 > 3.29 (p < .10) indicating a flat and light-tailed distribution. The willingness to pay (WTP)
shows a strong positive skewness (1.223, std. error .153) with a z-score of 7.9 > 3.29 (p <.
10) indicating a pile up of scores on the left side of the distribution. The kurtosis is strongly
positive (3.895, std. error .304), with a z-score of 12.8 > 3.29 (p < .10), indicating a pointy and
heavy tailed distribution. To transform the three variables into normalized distributed data, the
data had transformed through SPSS by performing a fractional ranking of cases, and
transforming this ranking into normalized distributed data with an inverse distribution function,
using the original mean and standard deviation. See the table below for the statistics of the
normally transformed data.

33
Trust Norm_Trust Intention
Norm_INTENT Willingness to pay
Norm_WTP
Mean 3.399 3.400 5.844 5.842 16.775 16.824 Std. Deviation 0.728 0.716 2.464 2.369 8.407 8.162 Variance 0.530 0.513 6.071 5.614 70.683 66.612 Skewness -0.520 -0.007 -0.805 0.013 0.889 0.097 Std. Error of Skewness
0.063 0.063 0.063 0.063 0.063 0.063
Kurtosis 1.172 -0.250 -0.103 -0.329 2.551 -0.072 Std. Error of Kurtosis 0.125 0.125 0.125 0.125 0.125 0.125 Table 11 Test of normality before and after transformations

34
4.2 Testing the Effect of Perceived Trustworthiness on Likelihood to
Rideshare
To test hypotheses H1a, H1b and H1c, a linear regression model is executed, with the
dependent variables Norm_INTENT, and the independent variables perceived benevolence,
perceived ability and perceived integrity. In paragraph 3.4 was found that perceived ability,
perceived integrity and perceived benevolence are part of one single dimension; perceived
trustworthiness, meaning a strong internal correlation and in this context multicollinearity.
Therefore this analysis is executed firstly with the perceived trustworthiness as the average
score of all dimensions. To test for differences in the effect of the dimensions of trust, a
second linear regression is executed among the individual dimensions; perceived ability,
perceived integrity and perceived benevolence. For this analysis, all observations are used
(n=1,530).
4.2.1 Model 1: The Effect of Trust on Ridesharing Likelihood
The first regression model is executed using SPSS 20. Besides testing intention to rideshare
through perceived trustworthiness, additional characteristics are added to the model like
gender (male), education level (high), age, and prior attitude towards ridesharing. Therefore
the following regression model is tested:
Norm_INTENT i = β0 + β1 * male + β2 * high_education + β3 * age + β4 *
prior_attitude + β5 * Trust + εi
To test the effect of trust, firstly a regression is executed with the above-mentioned variables,
without trust. In the second block, trust is added as independent variable to measure the
effect on the model. Looking at table 12 below, the results show that model 1a found
significant results for high education, age and prior attitude, affecting intention to rideshare.
Gender is not found to be significant, and therefore is deleted from the model. In model 1b,
trust was added, which increases the fit of the model significantly with an increase of R-
square from .116 to .386. The F Change is 672 with a Significance level of .000, which tells
that the probability to find these results under the null hypothesis is less than .001. This model
predicts the likelihood to engage in ridesharing significantly well (Field, 2009).
Model 1a (R-Square: 0.116) Model 1b (R-Square: 0.386)
B Std.
Error Std. B Sig. B Std.
Error Std. B Sig.
(Constant) 3.059 0.327 0.000 -2.051 0.336 0.000 High_EDU (dummy) 0.500 0.165 0.075 0.002 0.343 0.138 0.051 0.013 AGE -0.019 0.005 -0.091 0.000 -0.010 0.004 -0.048 0.020 Prior_ATTITUDE 0.710 0.057 0.303 0.000 0.487 0.048 0.207 0.000 Trust 1.732 0.067 0.532 0.000 Model 1 DV: norm_INTENT, IV's: (Constant), High_EDU, AGE, Prior_ATTITUDE

35
Model 2 DV: norm_INTENT, IV's: (Constant), High_EDU, AGE, Prior_ATTITUDE, Trust Cases All (n=1,530) Table 12 Regression model 1
The coefficients of the model tells us that each unit change of perceived trustworthiness, the
likelihood to engage in ridesharing with the person increases with 1.732 (on a scale of 0-10),
resulting in the following equation;
Norm_INTENT i = -2.051 + .343 * high_education - .01 * age + .487 * prior_attitude +
1.732 * trust + εi
4.2.2 Model 2: The Effect of Different Trustworthiness Dimensions on
Ridesharing Likelihood
The results so far have proven that perceived trustworthiness positively affects the likelihood
to go ridesharing, so the analysis continues with testing hypotheses H1a, H1b and H1c, which
hypothesizes that the individual dimensions of perceived trustworthiness all affect the
likelihood to go ridesharing positively. Therefore a new but similar linear regression as the
previous model is executed with INTENT as dependent variable and instead of trust,
perceived benevolence, perceived ability and perceived integrity as independent variables,
resulting in the following equation;
Norm_INTENT i = β0 + β1 * high_education + β2 * age + β3 * prior_attitude + β4 *
Benevolence + β5 * Ability + β6 * Integrity + εi
In paragraph 3.4 was already found that these three independent variables have strong
correlation, which will cause multicollinearity in the current regression model. However,
multicollinearity does not bias estimates, it merely inflates standard errors and therefore the
likelihood for type II errors (Grewal, Cote, & Baumgartner; 2004). It is still stated to interpret
these results with caution.
Model 2b shows a R-square of .388 with a F-change of 226.1 (Sig. .000), indicating that
model 2b performs significantly better than 2a. However it is expected to find a strong effect
of multicollinearity, the Durbin-Watson test tests a score of 1.889, which means that the errors
are not strongly correlated (Field, 2009).
Model 2a (R-Square: 0.116) Model 2b (R-Square: 0.388)
B Std.
Error Std. B Sig. B Std.
Error Std. B Sig.
(Constant) 3.059 0.327 0.000 -1.972 0.342 0.000 High_EDU 0.500 0.165 0.075 0.002 0.323 0.138 0.049 0.020 AGE -0.019 0.005 -0.091 0.000 -0.011 0.004 -0.049 0.017 Prior_ATTITUDE 0.710 0.057 0.303 0.000 0.481 0.049 0.205 0.000

36
Benevolence 0.393 0.130 0.125 0.003 Ability 0.783 0.098 0.283 0.000 Integrity 0.530 0.128 0.164 0.000 Model 1 DV: norm_INTENT, IV's: (Constant), High_EDU, AGE, Prior_ATTITUDE Model 2 DV: norm_INTENT, IV's: (Constant), High_EDU, AGE, Prior_ATTITUDE, Benevolence, Ability, Integrity Cases All (n=1,530) Table 13 Regression model 2
From model 2b in table 13 above, is seen that all three aspects of trust are significant drivers
of people’s intention to use ridesharing through online platforms. The perceived ability is the
strongest driver with a standardized beta of .283, and integrity and benevolence perceptions
are less important with respectively .164 and .125 as standardized beta. All hypothesized
independent variables have been found significantly affecting the dependent variable
Intention to rideshare, resulting in the following equation;
Norm_INTENT i = -1.972 + .323 * high_education - .011 * age + .481 * prior_attitude
+ .393 × Benevolence i + .783 × Ability i + .530 × Integrity i + εi
Based on the analysis above no evidence is found to reject hypothesis H1a, H1b and H1c.
Hypotheses H1a: The higher the perceived ability of the agent, the higher the probability that a consumer will engage in ridesharing
Supported
H1b: The higher the perceived benevolence of the agent, the higher the probability that a consumer will engage in ridesharing
Supported
H1c: The higher the perceived integrity of the agent, the higher the probability that a consumer will engage in ridesharing
Supported

37
4.3 Testing Online Trust-cues on Perceived Trustworthiness
This paragraph tests hypotheses H2a, H2b and H2c. Firstly the quality of the experiment and
the assumptions of the parametric tests will be explored. This paragraph concludes with an
analysis of the empirical data to test the stated hypotheses.
4.3.1 Direct Effects of Trust-cues
For the analysis of H2 (a, b and c), a regression is executed with perceived trustworthiness as
dependent variable and the presence of platform-generated trust-cues (yes or no), agent-
generated trust-cues (yes or no) and community-generated trust-cues (yes or no) as
independent variables.
The effect of prior WOM and previous experience are expected to influence perceived
trustworthiness, intention to rideshare and willingness to pay. Because the amount of
respondents with experience is very low (11) this variable is not being used for the analysis.
For the analysis, the attitude prior the experiment will be used since this is the actual
measurement to control for previous knowledge and attitude, which is influencing the
experiment. In the table below, the attitude prior the experiment is presented per category of
previous WOM knowledge. These differences are found significant by performing a One-way
ANOVA (p < .001).
Have you ever heard of ridesharing through online platforms before?
ATTITUDE prior experiment N
No 4.014 109
Yes, mostly positive things 4.783 46
Yes, no positive or negative things 4.161 96
Yes, mostly negative things 3.667 4
Total 4.203 255 Table 14 Means of prior attitude compared to WOM
To explore the data, firstly independent sample T-tests are executed to test for significant
differences in mean of perceived benevolence, integrity, ability and trust comparing presence
and non-presence of agent, community and platform-generated trust-cues. Secondly, the
Levene’s test is executed to test for differences in variance between the same groups. See
the results presented in table 15.
The results show a statistically significant higher level of trust when participants evaluate
ridesharing options that include community-generated trust-cues (t = 5.5; p < .001). Agent-
generated trust-cues seem to have an effect on the perceived benevolence (t = -2.5; p < .05)
and platform-generated trust-cues on perceived integrity (t = -2.7; p < .05). Community-
generated trust-cues seem stronger as they affect all layers of trust, while agent-generated

38
trust-cues only effect benevolence perceptions and platform-generated trust-cues affect
online integrity perceptions. This explains why community-generated trust-cues are a much
stronger effector of perceived trustworthiness.
Table 15 Means and Standard deviations of dimensions of trust per presented trust-cue in the first round
If the same analysis as previous is executed across all experimental rounds (1,530
observations), we find some different results (see table 16). Where firstly significant difference
was found in the mean between the (non-)presence of agent-generated trust-cues, now this
difference is not found (t = -.65; p > .05). Where in round one the difference in means of trust
in presence and non-presence of platform-generated trust-cues was not significant, across all
rounds there is enough data to support a significant difference. The presence of community-
generated trust-cues in both samples have a significant difference in trust perceptions
compared to non-presence.
No Yes No Yes No Yesn 255 135 120 141 114 117 138
Benevolence MEAN 3.212 3.328 3.109 3.017 3.453 3.274 3.159Indep. Sample
T-test Sig. 0.013 0.000 0.200STD.DEV 0.708 0.671 0.726 0.669 0.681 0.693 0.718
Levene's Sig. 0.424 0.379 0.850Integrity MEAN 3.320 3.361 3.284 3.144 3.538 3.447 3.213
Indep. Sample T-test Sig. 0.386 0.000 0.008
STD.DEV 0.708 0.739 0.680 0.671 0.695 0.596 0.777Levene's Sig. 0.388 0.362 0.084
Ability MEAN 3.644 3.711 3.585 3.440 3.898 3.687 3.609Indep. Sample
T-test Sig. 0.190 0.000 0.419STD.DEV 0.765 0.808 0.722 0.760 0.694 0.709 0.810
Levene's Sig. 0.142 0.018 0.276Trust MEAN 3.392 3.326 3.467 3.200 3.630 3.469 3.327
Indep. Sample T-test Sig. 0.087 0.000 0.085
STD.DEV 0.656 0.627 0.683 0.627 0.614 0.581 0.709Levene's Sig. 0.238 0.646 0.183
OverallAgent
generated trustcuesCommunity
generated trustcuesPlatform
generated trustcues

39
Table 16 Means and Standard deviations of dimensions of trust per presented trust-cue across all rounds
Now we know the difference in mean between the three treatments but we cannot make a
conclusion regarding hypotheses H2 before determining the clean effect of the three
individual trust-cue sources on the perceived trustworthiness. Therefore a linear regression is
executed with perceived trust as dependent variable and the dummy variables of presence of
agent-, community- and platform-generated trust-cues as independent variables. To measure
a clean effect of the presence of trust-cues, the covariances propensity to trust and prior
attitude are added to the model. The following model is therefore tested;
Norm_Perceived_trustworthiness = β0 + β1 * Agent_trustcues + β2 *
Community_trustcues + β3 * platform_trustcues + β4 * Propensity to trust + β5 *
prior_attitude + εi
The first analysis will consist out of data from only the first round. Secondly a regression is
performed with data from all rounds. The regression is executed through two models; the first
model has attitude as independent variable. Because propensity to trust has not significantly
found as a strong dependent variable for trust (Sig. > .05), and is therefore excluded from the
presented model below. Secondly a complete model is executed with all tested independent
variables.
No Yes No Yes No Yesn 1530 765 765 765 765 765 765
Benevolence MEAN 3.297 3.309 3.284 3.047 3.546 3.367 3.226Indep. Sample
T-test Sig. 0.518 0.000 0.000STD.DEV 0.750 0.765 0.735 0.664 0.750 0.761 0.733
Levene's Sig. 0.470 0.000 0.176Integrity MEAN 3.335 3.337 3.333 3.108 3.563 3.405 3.265
Indep. Sample T-test Sig. 0.917 0.000 0.000
STD.DEV 0.733 0.758 0.708 0.654 0.738 0.731 0.729Levene's Sig. 0.068 0.000 0.554
Ability MEAN 3.566 3.631 3.500 3.220 3.911 3.627 3.505Indep. Sample
T-test Sig. 0.003 0.000 0.005STD.DEV 0.858 0.884 0.826 0.775 0.796 0.862 0.850
Levene's Sig. 0.370 0.003 0.794Trust MEAN 3.399 3.426 3.373 3.125 3.673 3.466 3.332
Indep. Sample T-test Sig. 0.153 0.000 0.000
STD.DEV 0.728 0.753 0.702 0.643 0.705 0.734 0.716Levene's Sig. 0.102 0.118 0.488
Overall Agent Community Platform
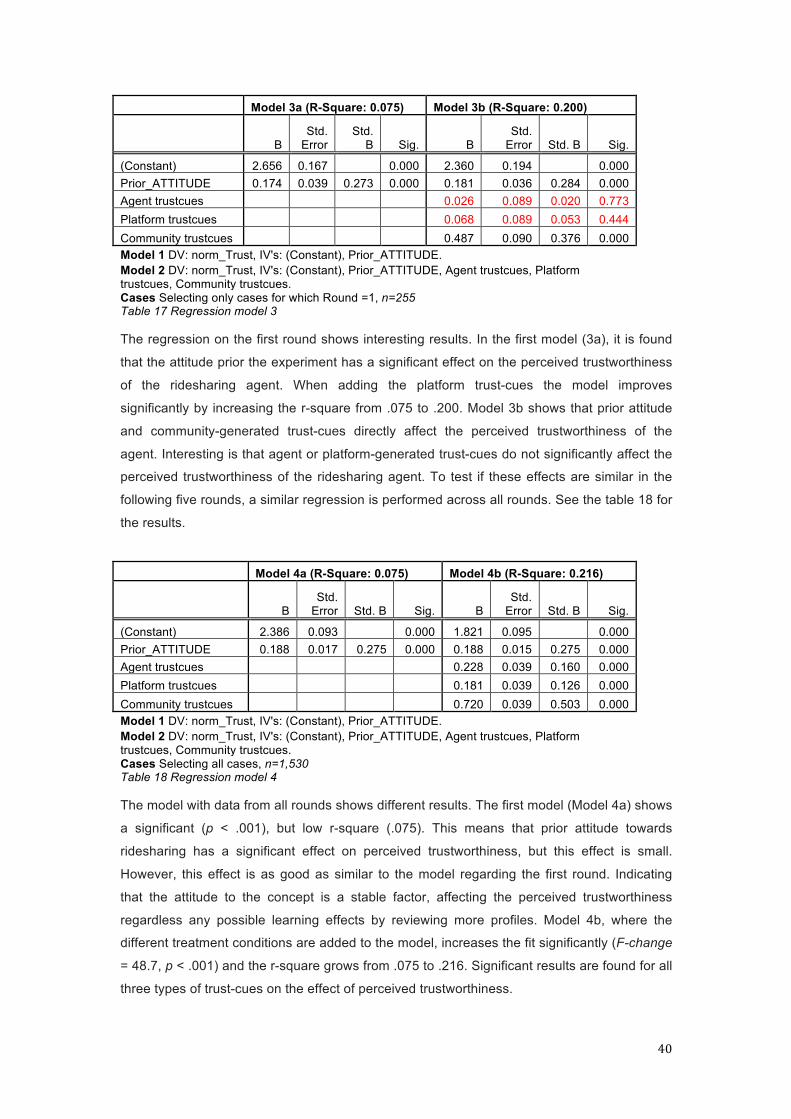
40
Model 3a (R-Square: 0.075) Model 3b (R-Square: 0.200)
B Std.
Error Std.
B Sig. B Std.
Error Std. B Sig.
(Constant) 2.656 0.167 0.000 2.360 0.194 0.000 Prior_ATTITUDE 0.174 0.039 0.273 0.000 0.181 0.036 0.284 0.000 Agent trustcues 0.026 0.089 0.020 0.773 Platform trustcues 0.068 0.089 0.053 0.444 Community trustcues 0.487 0.090 0.376 0.000 Model 1 DV: norm_Trust, IV's: (Constant), Prior_ATTITUDE. Model 2 DV: norm_Trust, IV's: (Constant), Prior_ATTITUDE, Agent trustcues, Platform trustcues, Community trustcues. Cases Selecting only cases for which Round =1, n=255 Table 17 Regression model 3
The regression on the first round shows interesting results. In the first model (3a), it is found
that the attitude prior the experiment has a significant effect on the perceived trustworthiness
of the ridesharing agent. When adding the platform trust-cues the model improves
significantly by increasing the r-square from .075 to .200. Model 3b shows that prior attitude
and community-generated trust-cues directly affect the perceived trustworthiness of the
agent. Interesting is that agent or platform-generated trust-cues do not significantly affect the
perceived trustworthiness of the ridesharing agent. To test if these effects are similar in the
following five rounds, a similar regression is performed across all rounds. See the table 18 for
the results.
Model 4a (R-Square: 0.075) Model 4b (R-Square: 0.216)
B Std.
Error Std. B Sig. B Std.
Error Std. B Sig.
(Constant) 2.386 0.093 0.000 1.821 0.095 0.000 Prior_ATTITUDE 0.188 0.017 0.275 0.000 0.188 0.015 0.275 0.000 Agent trustcues 0.228 0.039 0.160 0.000 Platform trustcues 0.181 0.039 0.126 0.000 Community trustcues 0.720 0.039 0.503 0.000 Model 1 DV: norm_Trust, IV's: (Constant), Prior_ATTITUDE. Model 2 DV: norm_Trust, IV's: (Constant), Prior_ATTITUDE, Agent trustcues, Platform trustcues, Community trustcues. Cases Selecting all cases, n=1,530 Table 18 Regression model 4
The model with data from all rounds shows different results. The first model (Model 4a) shows
a significant (p < .001), but low r-square (.075). This means that prior attitude towards
ridesharing has a significant effect on perceived trustworthiness, but this effect is small.
However, this effect is as good as similar to the model regarding the first round. Indicating
that the attitude to the concept is a stable factor, affecting the perceived trustworthiness
regardless any possible learning effects by reviewing more profiles. Model 4b, where the
different treatment conditions are added to the model, increases the fit significantly (F-change
= 48.7, p < .001) and the r-square grows from .075 to .216. Significant results are found for all
three types of trust-cues on the effect of perceived trustworthiness.

41
We find significantly results in the first round comparing to all rounds, indicating that a
learning effect is present. Where in the first round, respondents only seem to be affected by
their prior attitude and the community-generated trust-cues, the following rounds respondents
seem to know the platform better and also analyzing other trust-cues, resulting in significant
effects of agent-generated trust-cues and platform-generated trust-cues. Therefore we can
conclude that the stated hypotheses are supported by the data.
Hypotheses H2a: The presence of agent-generated trust-cues positively influences the perceived trustworthiness of the ridesharing agent
Supported
H2b: The presence of community-generated trust-cues positively influences the perceived trustworthiness of the ridesharing agent
Supported
H2c: The presence of platform-generated trust-cues positively influences the perceived trustworthiness of the ridesharing agent
Supported
4.3.2 Relative Strength of Different Effects
With the analysis of previous paragraph, we can automatically test hypotheses H3a, H3b and
H3c about the effect size of the different trust-cues. Based on the regression the following
equation is held to be true;
Norm_Perceived trustworthiness = 1.821 + .188 * Agent_trustcues + .720 *
Community_trustcues + 0.181 * platform_trustcues + 0.188 * prior_attitude + εi
Since we want to compare effect sizes, we have to compare the standardized coefficients.
The results show that community-generated trust-cues generate the highest perceived
trustworthiness regarding the ridesharing agent in the first round as well across all rounds.
Since in both models community-generated trust-cues prove to be superior to other trust-cues
we can state that community-generated trust-cues are the most important trust-cues on the
platform. The agent-generated trust-cues have the second strongest effect with standardized
coefficient of 0.160 across all rounds. The platform-generated trust-cues have the lowest
impact on perceptions of trustworthiness with 0.126 as standardized coefficient.
In the second part of the research, where respondents are being asked which aspects of the
platform are most important and least important for trust evaluations regarding the ridesharing
agent, similar results have been found. Significant effects are found through Chi-square tests
on counts of most important aspects of the profile (χ2(2) = 116.727, p < .001) and least
important aspects of the profile (χ2(2) = 154.642, p < .001). Also where respondents look at
firstly, found significant differences among the three aspects (χ2(2) = 98.480, p < .001). The
community-generated trust-cues are perceived the most often as an important aspect, and
the least often as not important. As well in the experiment as in the second part, the platform
and agent-generated trust-cues are found to be of least importance. However, a difference in

42
result is found from where respondents look first; agent-generated trust-cues are more often
being looked at firstly. See table 19 for a presentation of the proportions.
Aspect Important Not important First look
Picture 51% 14% 77%
Name and Age 7% 49% 24%
Personal text 13% 48% 25%
Agent 24% 37% 42%
Ratings 56% 5% 42%
Reviews 60% 8% 39%
Rating summary 34% 11% 28%
Community 50% 8% 36%
Activities 18% 39% 9%
Category driver 11% 48% 9%
Identification validation 38% 24% 27%
Platform 22% 37% 15%
Table 19 Self-stated important and non-important aspects of profile
Based on the findings above, H3a and H3b are supported by the data in the first round as
well across all rounds. However, no support is founded for H3c, since the effect size of
platform-generated trust-cues is lower than agent-generated trust-cues and non-significant in
the first round.
Hypotheses H3a: The presence of community-generated trust-cues has stronger positive effect on perceived trustworthiness of the ridesharing agent than agent-generated trust-cues.
Supported
H3b: The presence of community-generated trust-cues has stronger positive effect on perceived trustworthiness of the ridesharing agent than platform-generated trust-cues.
Supported
H3c: The presence of platform-generated trust-cues has stronger positive effect on perceived trustworthiness of the ridesharing agent than agent-generated trust-cues.
Not supported

43
4.4 Testing the Effect of Need for Cognition on the Effect of Trust-cue Source on Perceived Trustworthiness
This analysis builds further on the previous part and includes an interaction variable to the
model. The objective of this part is to explore for any differences of effect of trust-cue source,
due to a different need for cognition of the respondent.
Need for cognition is, as elaborated on in previous parts, a mean score of seven questions
(NFC2 until NFC8). Since the main effect of trust-cues have been tested in previous
paragraphs, two regression models will be executed to test for an interacting effect of NFC on
the effect of trust-cues on perceived trustworthiness. Firstly, the main effects of the trust-cues
on perceived trustworthiness will be tested (similar to the model in paragraph 4.3.1). The
second model will add the interaction variables NFCc * Agent, NFCc * Platform and NFCc *
Community (NFCc = centralized NFC). Both models include prior attitude as covariance. See
the tested equations of the models below.
Model 5a
Perceived trustworthiness = β0 + β1 * Prior_attitude + β2 * Agent_trustcues + β3 *
Community_trustcues + β4 * platform_trustcues + εi
Model 5b
Perceived trustworthiness = β0 + β1 * Prior_attitude + β2 * Agent_trustcues + β3 *
Community_trustcues + β4 * platform_trustcues + β5 * Agent_trustcues * NFC + β6 *
Community_trustcues * NFC + β7 * platform_trustcues * NFC + εi
Based on the two models above, the following results are found;
Model 5a (R-Square: 0.216) Model 5b (R-Square: 0.235)
B Std.
Error Std. B Sig. B Std.
Error Std. B Sig.
(Constant) 2.311 0.085 0.000 2.321 0.084 0.000 Prior_ATTITUDE 0.125 0.016 0.176 0.000 0.122 0.016 0.173 0.000 Agent trustcues 0.228 0.040 0.160 0.000 0.228 0.039 0.160 0.000 Platform trustcues 0.181 0.040 0.126 0.000 0.181 0.039 0.126 0.000 Community trustcues 0.720 0.040 0.503 0.000 0.720 0.039 0.503 0.000 Agent_NFCc 0.050 0.039 0.032 0.194 Platform_NFCc 0.075 0.039 0.047 0.054 Community * NFCc 0.154 0.039 0.098 0.000 Model 1 DV: norm_Trust, IV's: (Constant), Prior_ATTITUDE, Agent, Platform, Community Model 2 DV: norm_Trust, IV's: (Constant), Prior_ATTITUDE, Agent, Platform, Community, Agent * NFCc, Platform * NFCc, Community * NFCc Cases All (n=1,530) Table 20 Regression model 5
For an analysis of model 5a see paragraph 4.3.1. By adding the interaction variables in model
5b, a significant improvement of fit of the model is found (R2 = .235, F-Change (3, 1522) =

44
12.6, p < .001). Model 5b shows, compared to model 5a, no change of beta or significance of
the main effects, except for the prior attitude that shows a small decrease of beta. Strong
significant results have been found on the interaction between NFC and community-
generated trust-cues, indicating that for people with a high degree of need for cognition, the
effect of community-generated trust-cues on trustworthiness perceptions is higher, and lower
for those with a low need for cognition. There is no significant interaction found between NFC
and agent-generated trust-cues (β = .05, t(1522) = 1.3, p > .1), meaning the effect of agent-
generated trust-cues on perceived trustworthiness is similar between people with low or high
need for cognition. The effect of NFC on platform-generated trust-cues has been found just
not significant (p > .05), but when using an alpha of .10 considered significant. We can
conclude from this result that the effect of NFC on platform-generated trust-cues on perceived
trustworthiness is found but relatively small.
Evidence is found of the effect of need for cognition on the effect of community and platform-
generated trust-cues on perceived trustworthiness. However, the hypothesized effect of H4
suggests that need for cognition affects positively all effects of trust-cues on perceived
trustworthiness, which is not found. Therefore H4 is partially supported.
Hypotheses H4: High need for cognition has a positive effect on the effect of trust-cue source on trustworthiness perceptions regarding a ridesharing agent on an online C2C ridesharing platform.
Partially supported

45
4.5 Explorative analysis
4.5.1 The Effect of Trust-cue Source and NFC on the Underlying Trust
Constructs
In the previous paragraphs is found that perceived trustworthiness affects the intention to
rideshare. Different trust-cue sources affect the perceived trustworthiness differently. And
when one has a higher need for cognition, the effect of some trust-cues are differently than of
those with a low need for cognition. This paragraph makes a deeper step into the data by
exploring the three trust-cues affecting the three dimensions of trust. And if these effects differ
for people with low or high need for cognition. According to the literature presented in the
theory, perceived trust has three dimensions; perceived ability, perceived integrity and
perceived benevolence. To test the effect of trust-cues sources and the interaction effect of
NFC on the different dimensions, three explorative regressions have been executed. The
three regressions have the independent variables of presence of community, agent and
platform-generated trust-cues, with a second block the interactions with the centralized need
for cognition.
Dependent variables
Perceived trust
Perceived benevolence
Perceived integrity
Perceived ability
Main effects
Constant Prior Attitude 0.173 ** 0.159 ** 0.125 ** 0.203 ** Agent 0.160 ** 0.158 ** 0.162 ** 0.130 ** Platform 0.126 ** 0.101 ** 0.093 ** 0.140 ** Community 0.503 ** 0.437 ** 0.414 ** 0.515 **
Interaction Agent * NFCc 0.032 0.037 0.032 0.022 Platform * NFCc 0.047 * 0.046 * 0.037 0.055 ** Community * NFCc 0.098 ** 0.100 ** 0.071 ** 0.101 **
R-Square of model 0.235 0.187 0.154 0.259 Standardized coefficients of linear regressions with normalized perceived trust, perceived benevolence, perceived integrity and perceived ability as dependent variables (* = p < .1, ** = p < .05) Table 21 Regression model 6
This analysis focuses on the differences between models. In table 21, presenting the
standardized coefficients of the regression models, some subtle differences in effect of trust-
cue source on the dimensions of perceived trustworthiness are found.
Firstly, looking at the r-squares of the models, we find that the model with perceived ability as
DV has the best fit compared to perceived benevolence and perceived integrity. Secondly, in
all models, the community-generated trust-cues have the strongest effect on trust
perceptions. Interesting finding is that platform-generated trust-cues affect the perceived
ability more than agent-generated trust-cues, while on all other models this is opposite. Prior
attitude, platform- and community-generated trust-cues all seem to affect perceived ability the
most. The agent-generated trust-cues, on the other hand, affect the perceived integrity the
most.

46
In the interaction effects, all models show an increase of effect of community-generated trust-
cues when the respondents have a higher need for cognition (NFC). The effect of NFC on
agent-generated trust-cues does not affect any dimension of trust, indicating that the effect of
agent-generated trust-cues is the same for high and low NFC. Where the effect of NFC on the
effect of platform-generated trust-cues on perceived trustworthiness is barely significant (p <
.1) and presents low standardized coefficients, is the effect of NFC on the effect of perceived
ability significantly (p > .05). From this analysis we conclude that trust-cues primarily affect
perceived ability. Perceptions of integrity are less affected by trust-cues. For people with high
NFC, trust-cues from the community and the platform affect perceived ability more than those
with lower NFC.

47
5. Conclusions
5.1 General Discussion
The objective of this thesis is to gain insight into the effect of trustworthiness perceptions
through online platforms, and the effect of trust on ridesharing intentions. Through theories
and literature and an empirical web-based experiment, almost all stated hypotheses are
supported and additional insights are gained. The tested hypotheses and additional insights
will be discussed below.
Conform the found theory this research proves that trustworthiness perceptions regarding a
person have a direct effect on the intention to rideshare with this person. Looking at the three
dimensions of trustworthiness, all dimensions have a positive effect on ridesharing intentions.
An interesting finding is that perceived ability is the strongest effector of ridesharing
intentions. Ability also shows the highest variance across respondents as well across
experiments. In the explorative analysis, the strongest R-Square was found, indicating that
ability is the most important driver of trust in the context of trustworthiness of online
ridesharing platforms. Theory suggests that perceptions regarding ability are strongly linked
to the context of where trust is required. This indicates that the finding of perceived ability to
be the strongest driver of intentions can be externalized to other online ridesharing platforms,
but makes the result difficult to externalize to C2C online platforms with other contexts than
ridesharing. Additional research could give insights on this matter.
The platform offers several cues from where trust regarding the ridesharing agent can be
induced. This thesis identifies three main sources from where they origin; (i) the ridesharing
agent, (ii) the platform and (iii) the community of ride-sharers on the platform. As expected
from theory, all trust-cues have a positive effect on the perceived trustworthiness of the
ridesharing agent. However, not all effect sizes are similar. The community-generated trust-
cues generated a much stronger positive effect on perceived trustworthiness than agent or
platform-generated trust-cues. Self-generated trust-cues by the ridesharing agent have a
significant effect on trustworthiness perceptions, but the effect size is less than one-third of
the effect of community-generated trust-cues. The trust-cues generated by the platform have
the lowest, but still significant, effect on trust perceptions. Interesting fact is that in the first
round, respondents do not seem to use trust-cues from the platform and the ridesharing
agent in their trust evaluation. Here their prior attitude towards the concept, and community-
generated trust-cues are the most strongest and important effectors of perceived trust.
When deciding on perceived trustworthiness of the ridesharing agent, the need for cognition
plays a role in the effect of trust-cues. Theory suggests that different levels of need for
cognition effects the way someone processes the presented information. This research has
found support for this theory. For respondents with low need for cognition, the effect of

48
platform and community-generated trust-cues have lower effect on perceived trustworthiness
and for those with a high need for cognition, the effect size of agent-generated trust-cues is
higher than for those with no high need for cognition. This means that the effects of trust-cues
for high need for cognition are higher for all three sources than of those with low need for
cognition, supporting the existing literature of Need for Cognition.
When exploring the different dimensions of trust, the trust-cue sources seem to affect them
differently. The community-generated trust-cues affect all three dimensions of trust the most,
confirming the importance of this trust-cue. However, the importance of agent and platform-
generated trust-cues affects the dimensions differently. Theory suggests on one hand that
self-generated trust-cues are not expected to be reliable to induce someone’s
trustworthiness. On the other hand, the more transparent one is, the more benevolent one is
perceived to be. The data showed support for the theory that agent-generated trust-cue is,
aside from community-generated trust-cues, the strongest affecter. This effect is especially
strong for people with a high need for cognition. This means that in case of presence of self-
generated information, the perceived benevolence increases.
5.2 Practical Implications
The findings of this research give interesting insights for start-up companies, as well for
managers of C2C ridesharing platforms or other types of sharing platforms. This thesis
emphasizes the importance of trust for the success of online C2C sharing platforms. The
perceived trustworthiness of the ridesharing agent affects directly purchase intentions.
Besides the intention to engage, the perceived trustworthiness also affects directly the
willingness one is to pay for the service (r = .411, n = 1530, p= .000). This indicates that an
increase of perceived trustworthiness of the services and ridesharing agents on a C2C
sharing platform increases the amount of purchases, as well the possibility to increase the
price of the service. Trust is therefore an important aspect for the success of such business
models.
Besides emphasizing on the importance of trust, this research also provides insights in how
platforms can increase trust perceptions. Results suggest a major focus on community-
generated trust-cues. Community feedback through ratings and written reviews strongly affect
trust perceptions. Other trust-cues from the ridesharing agent, as well from the platform, have
less power than community-generated trust-cues, but still significant, and should therefore not
be ignored. People with low need for cognition, seem to mostly base their decision on
community-generated trust-cues, while those with a high need for cognition take more trust-
cues in consideration and are therefore more affected by agent and platform-generated trust-
cues. A suggestion based on the findings is to primarily present community-generated trust-
cues, offering those with a low need for cognition a direct insight in the most important trust-

49
cues, and at the same time also presenting the most important information for those with high
need for cognition. Since people with high need for cognition are more likely to engage in
deeper analysis of presented information, they are more likely to navigate further to other
trust-cues like agent-generated, or platform-generated trust-cues.
Other factors than the platform design can influence trust perceptions too. Those who have
heard positive things regarding ridesharing through online platforms prior the experiment,
have a significant higher positive attitude towards the concept than those who have not heard
of it [F (3, 251) = 7.233, p = .000]. This indicates that WOM marketing is expected to influence
the attitude positively, resulting in a higher perceived trustworthiness of the agents on the
platform. See table 22 for the average means of attitude prior and after the experiment,
divided in four categories of prior WOM. Interesting additional finding in the presented table
below, is that when respondents have participated in the current research, which presents six
different ridesharing profiles, the attitude on average increases with one point on a scale of 1-
7. This indicates that once one has seen the platform and profiles the attitude changes
positively.
Have you ever heard of ridesharing through online platforms before?
ATTITUDE prior
experiment
ATTITUDE post
experiment Change N Sig. (2-tailed)
No 4.014 5.333 1.32 109
0.000
Yes, mostly positive things 4.783 5.917 1.134 46
0.000
Yes, no positive or negative things 4.161 5.212 1.05 96
0.000
Yes, mostly negative things 3.667 4.667 1 4
0.024
Total 4.203 5.382 1.18 255 Table 22 attitude towards ridesharing through online platforms prior and after experiment, grouped per previous WOM
However transportation services through online platforms like Uber and Lyft are different from
ridesharing services regarding the monetary incentive and average length of fares, the
findings regarding online trust-cue evaluations and weight of importance are expected to be
similar. Also, in this context an online platform functions as facilitator between demand and
supply and reviews and ratings are present as trust-cues. Additional research could give
insights if the effect of perceived trustworthiness on intention of behavior is similar, since the
fares are shorter and more often in known areas of the commuter, which could decrease the
importance of trust compared to long distances (for instance Rotterdam to Brussels) which
requires a higher degree of trust perceptions before engaging into ridesharing due to a
perceived higher risk.

50
5.3 Research Limitations and Directions for Future Research
This research has several limitations, which could influence the results of this research.
These limitations provide opportunities for further research. Firstly, the sample consisted out
of 255 respondents, who were approached through the personal network of the current
researcher, which is not an a-select sample from the whole population. The sample exists out
of mostly high and university educated people from the Netherlands, which makes the results
more difficult to generalize. However, the impact of this is expected to be limited as the
between-subject experimental design controls for confounding effects. Additional research
with a larger and a-select sample could clarify if this limitation is present.
The experiment, however designed with the best intentions of the researcher, also has some
limitations. Firstly, the website screenshots were reported to be difficult to read and analyze
through mobile devices. While in real-life mobile apps of mobile friendly websites are
designed for this purpose, this was not possible for the current research. As a solution, it was
stated in the intro text as well as in the invitations to complete the survey through PC, laptop
or tablet, to minimize possible misreporting. Secondly, the researcher had to choose which
trust-cues are presented per trust-cue source in the experimental design for stability (same
amount of cues per source) as well for the limited space per page, resulting in three cues per
source (adopted from the Blablacar platform) Therefore that not all trust-cues were measured
in the research, which can negatively affect the completeness of information regarding the
ridesharing agent.
The differences of effect between trust-cue sources have been tested, but not the difference
of trust-cues within a source. This addition could explain variance since, for example, a rating
is an easy to analyze trust-cue and requires limited cognition to interpret while reviews require
more cognition since one has to read and process more information to form a judgment. The
same counts for agent-generated trust-cues where interpreting a picture requires little
cognition, but a personal story requires more cognition. Future research could give insights in
this difference and possibly explain more variance in perceived trustworthiness due to need
for cognition.
The third limitation is that this research only focuses on positive presented information,
excluding the negative effect of cues with disconfirmation of trust. Since this thesis found
different effects for positive confirming information, the research suggests to extent the
research on the effect of negative information from different sources on perceived
trustworthiness and the likelihood to engage in ridesharing.
This research found support for general theories by testing them in a context of ridesharing
through the online platform of Blablacar. It provides insights into the dynamics of building trust
perceptions of consumers regarding other consumers through ridesharing platforms, with

51
theory that is expected to apply in similar contexts as where a high degree of mutual trust is
required like services as ride-, car-, food- and house-sharing. Since the scope and size of this
thesis does not allow for an industry wide generalization across multiple online C2C platforms
in each domain with different requirement of amount of trust perceptions, additional research
is suggested.

52
Bibliography
Adler, P. S. (2001). Market, hierarchy, and trust: The knowledge economy and the future of capitalism. Organization Science, 12(2), 215-234.
Agatz, N. A. H., Erera, A., Savelsbergh, M. W. P., & Wang, X. (2010).Sustainable passenger transportation: Dynamic ride-sharing (No. ERS-2010-010-LIS). ERIM Report Series Research in Management.
Agatz, N. A., Erera, A. L., Savelsbergh, M. W., & Wang, X. (2011). Dynamic ride-sharing: A simulation study in metro Atlanta. Transportation Research Part B: Methodological, 45(9), 1450-1464.
Akerlof, G.A. (1970). The Market for “Lemons”: Quality Uncertainty and the Market Mechanism. Quarterly Journal of Economics, 84(3), 488–500.
Alesina, A., & La Ferrara, E. (2002). Who trusts others?. Journal of public economics, 85(2), 207-234.
Ba, S., & Pavlou, P. A. (2002). Evidence of the effect of trust building technology in electronic markets: Price premiums and buyer behavior. MIS quarterly, 243-268.
Balasubramanian, S., Konana, P., & Menon, N. M. (2003). Customer satisfaction in virtual environments: A study of online investing. Management Science, 49(7), 871-889.
Bart, Y., Shankar, V., Sultan, F., & Urban, G. L. (2005). Are the drivers and role of online trust the same for all web sites and consumers? A large-scale exploratory empirical study. Journal of Marketing, 69(4), 133-152.
Bhat, C. R., & Sardesai, R. (2006). The impact of stop-making and travel time reliability on commute mode choice. Transportation Research Part B: Methodological, 40(9), 709-730.
Belk, R. W. (2013). Extended self in a digital world. Journal of Consumer Research, 40(3), 477-500.
Berger, I. E., & Mitchell, A. A. (1989). The effect of advertising on attitude accessibility, attitude confidence, and the attitude-behavior relationship. Journal of Consumer Research, 269-279.
Biswas, D., & Biswas, A. (2004). The diagnostic role of signals in the context of perceived risks in online shopping: do signals matter more on the web?. Journal of Interactive Marketing, 18(3), 30-45.
Bolton, G. E., Katok, E., & Ockenfels, A. (2004). How effective are electronic reputation mechanisms? An experimental investigation. Management science,50(11), 1587-1602.
Botsman, R., & Rogers, R. (2010). What’s mine is yours. The Rise of Collaborative Consumption, Collins.
Brereton, M., Roe, P., Foth, M., Bunker, J. M., & Buys, L. (2009, November). Designing participation in agile ridesharing with mobile social software. In Proceedings of the 21st Annual Conference of the Australian Computer-Human Interaction Special Interest Group: Design: Open 24/7 (pp. 257-260). ACM.
Brewer, M. B. (1999). The psychology of prejudice: Ingroup love and outgroup hate?. Journal of Social Issues, 55(3), 429-444.
Cacioppo, J. T., & Petty, R. E. (1982). The need for cognition. Journal of Personality and Social Psychology, 42(1), 116.

53
Cacioppo, J. T., Petty, R. E., Feinstein, J. A., & Jarvis, W. B. G. (1996). Dispositional differences in cognitive motivation: The life and times of individuals varying in need for cognition. Psychological Bulletin, 119(2), 197.
Cacioppo, J. T., Petty, R. E., & Feng Kao, C. (1984). The efficient assessment of need for cognition. Journal of Personality Assessment, 48(3), 306-307.
Cacioppo, J. T., Petty, R. E., & Morris, K. J. (1983). Effects of need for cognition on message evaluation, recall, and persuasion. Journal of Personality and Social Psychology, 45(4), 805.
Carter, J. D., Hall, J. A., Carney, D. R., & Rosip, J. C. (2006). Individual differences in the acceptance of stereotyping. Journal of Research in Personality, 40(6), 1103-1118.
Cervero, R., & Griesenbeck, B. (1988). Factors influencing commuting choices in suburban labor markets: a case analysis of Pleasanton, California. Transportation Research Part A: General, 22(3), 151-161.
Chan, N. D., & Shaheen, S. A. (2012). Ridesharing in North America: Past, present, and future. Transport Reviews, 32(1), 93-112.
Chatman, J., & Flynn, F. (2001). The influence of demographic heterogeneity on the emergence and consequences of cooperative norms in work teams. Academy of Management Journal, 44, 956-974.
Chevalier, J. A., & Mayzlin, D. (2006). The effect of word of mouth on sales: Online book reviews. Journal of Marketing Research, 43(3), 345-354.
Coltin, B. J., & Veloso, M. (2013, May). Towards ridesharing with passenger transfers. In Proceedings of the 2013 international conference on Autonomous agents and multi-agent systems (pp. 1299-1300). International Foundation for Autonomous Agents and Multiagent Systems.
Davis, J. H., Schoorman, F. D., Mayer, R. D., & Tan, H. H. (2000). The trusted general manager and business unit performance: Empirical evidence of a competitive advantage. Strategic Management Journal, 21, 563-576.
Ding, M., Grewal, R., & Liechty, J. (2005). Incentive-aligned conjoint analysis. Journal of Marketing Research, 42(1), 67-82.
Dodson Jr, J. A., & Muller, E. (1978). Models of new product diffusion through advertising and word-of-mouth. Management Science, 24(15), 1568-1578.
Doney, P. M., & Cannon, J. P. (1997). An examination of the nature of trust in buyer-seller relationships. Journal of Marketing, 35-51.
Engel JF, Kegerreis RJ, Blackwell RD (1969) Word-of-mouth communication by the innovator. Journal of Marketing, 33(3):15–19.
Field, A. (2009). Discovering statistics using SPSS. Sage publications.
Ford, G. T., Smith, D. B., & Swasy, J. L. (1990). Consumer skepticism of advertising claims: Testing hypotheses from economics of information. Journal of Consumer Research, 433-441.
Forman, C., Ghose, A., & Wiesenfeld, B. (2008). Examining the relationship between reviews and sales: The role of reviewer identity disclosure in electronic markets. Information Systems Research, 19(3), 291-313.
Garbarino, E., & Johnson, M. (1999), "The Different Roles of Satisfaction, Trust and Commitment for Relational and Transactional Consumers," Journal of Marketing, 63 (April), 70-87.

54
Gill, H., Boies, K., Finegan, J. E., & McNally, J. (2005). Antecedents of trust: Establishing a boundary condition for the relation between propensity to trust and intention to trust. Journal of Business and Psychology, 19(3), 287-302.
Glaeser, E. L., Laibson, D. I., Scheinkman, J. A., & Soutter, C. L. (2000). Measuring trust. Quarterly Journal of Economics, 811-846.
Gotlieb, J. B., & Sarel, D. (1991). Comparative advertising effectiveness: The role of involvement and source credibility. Journal of Advertising, 20(1), 38-45.
Grewal, R., Cote, J. A., & Baumgartner, H. (2004). Multicollinearity and measurement error in structural equation models: Implications for theory testing. Marketing Science, 23(4), 519-529.
Harmon, R. R., & Coney, K. A. (1982). The persuasive effects of source credibility in buy and lease situations. Journal of Marketing Research, 255-260.
Haugtvedt, C. P., Petty, R. E., & Cacioppo, J. T. (1992). Need for cognition and advertising: Understanding the role of personality variables in consumer behavior. Journal of Consumer Psychology, 1(3), 239-260.
Herr PM, Kardes FR, Kim J (1991) Effect of word-of-mouth and product-attribute information on persuasion: An accessibility diagnosticity perspective. Journal of Consumer Research. 17(4):454–462.
Homer, P. M., & Kahle, L. R. (1990). Source expertise, time of source identification, and involvement in persuasion: An elaborative processing perspective. Journal of Advertising, 19(1), 30-39.
Hovland, C. I., Janis, I. L., & Kelley, H. H. (1953). Communication and persuasion; psychological studies of opinion change.
Huber, J., & Zwerina, K. (1996). The importance of utility balance in efficient choice designs. Journal of Marketing Research, 307-317.
Huwer, U. (2004). Public transport and car-sharing—benefits and effects of combined services. Transport Policy, 11(1), 77-87.
Hwang, K., & Giuliano, G. (1990). The determinants of ridesharing: Literature review.
Ippolito, P.M. (1990). Bonding and Nonbonding Signals of Product Quality. Journal of Business, 63(1), 41–60.
Jarvenpaa, S. L., Knoll, K., & Leidner, D. E. (1998). Is anybody out there? Antecedents of trust in global virtual teams. Journal of Management Information Systems, 29-64.
Kamar, E., & Horvitz, E. (2009, July). Collaboration and Shared Plans in the Open World: Studies of Ridesharing. In IJCAI (Vol. 9, p. 187).
Kelton, K., Fleischmann, K. R., & Wallace, W. A. (2008). Trust in digital information. Journal of the American Society for Information Science and Technology, 59(3), 363-374.
Kleiner, A., Nebel, B., Ziparo, V. A., & Srl, A. (2011, July). A mechanism for dynamic ride sharing based on parallel auctions. In IJCAI (Vol. 11, pp. 266-272).
Levin, D. Z., & Cross, R. (2004). The strength of weak ties you can trust: The mediating role of trust in effective knowledge transfer. Management Science,50(11), 1477-1490.
Liu, Y. (2006). Word of mouth for movies: Its dynamics and impact on box office revenue. Journal of Marketing, 70(3), 74-89.

55
Lucassen, T., & Schraagen, J. M. (2011). Factual accuracy and trust in information: The role of expertise. Journal of the American Society for Information Science and Technology, 62(7), 1232-1242.
Lucassen, T., & Schraagen, J. M. (2013). The influence of source cues and topic familiarity on credibility evaluation. Computers in Human Behavior, 29(4), 1387-1392.
Mayer, R. C., Davis, J. H., & Schoorman, D. 1995. An integrative model of organizational trust. Academy of Management Review, 20: 709-734.
Mayer, R. C., & Davis, J. H. (1999). The effect of the performance appraisal system on trust for management: A field quasi-experiment. Journal of Applied Psychology, 84(1), 123–136.
McAllister, D. J. (1995). Affect- and cognition-based trust as foundations for interpersonal cooperation in organizations. Academy of Management Journal, 38, 24-59.
McPherson, M., Smith-Lovin, L., & Cook, J. M. (2001). Birds of a feather: Homophily in social networks. Annual Review of Sociology, 415-444.
Moorman, Christine, Gerald Zaltman, and Rohit Deshpande (1992), "Relation- ships Between Providers and Users of Market Research: The Dynamics of Trust Within and Between Organizations," Journal of Marketing Research, 29 (August), 314-28.
Moorman, Christine, Rohit Deshpande, and Gerald Zaltman (1993), "Factors Affecting Trust in Market Relationships," Journal of Marketing, 57 (January), 81-101.
Morency, C. (2007). The ambivalence of ridesharing. Transportation, 34(2), 239-253.
Morgan, Robert M. and Shelby D. Hunt (1994), "The Commitment-Trust Theory of Relationship Marketing," Journal of Marketing, 58 (July), 20-38.
Pavlou, P. A., & Gefen, D. (2004). Building effective online marketplaces with institution-based trust. Information Systems Research, 15(1), 37-59.
Pieters, R. G., Verplanken, B., & Modde, J. M. (1987). " Neiging tot nadenken": Samenhang met beredeneerd gedrag. Nederlands Tijdschrift voor de Psychologie en haar Grensgebieden.
Petty, R. E., Briñol, P., Loersch, C., & McCaslin, M. J. (2009). The need for cognition. Handbook of individual differences in social behavior, 318-329.
Pornpitakpan, C. (2004). The persuasiveness of source credibility: A critical review of five decades' evidence. Journal of Applied Social Psychology, 34(2), 243-281.
Reichheld, Frederick F. and Phil Schefter (2000), "E-Loyalty: Your Secret Weapon on the Web," Harvard Business Review, 78 (July/August), 105-13.
Resnick, P., & Zeckhauser, R. (2002). Trust among strangers in internet transactions: Empirical analysis of ebay’s reputation system. The Economics of the Internet and E-commerce, 11(2), 23-25
Rousseau, Denise M., Sim B. Bitkin, Ronald S. Burt, and Colin Camerer (1998), "Not So Different After All: A Cross- Discipline View of Trust," Academy of Management Review, 23 (3), 393-404.
Saranow, J. (2006). Carpooling for Grown-Ups---High Gas Prices, New Services Give Ride-Sharing a Boost; Rating Your Fellow Rider. Wall Street Journal.
Schau, H. J., & Gilly, M. C. (2003). We are what we post? Self-‐presentation in personal web space. Journal of Consumer Research, 30(3), 385-404.

56
Singh, M., Balasubramanian, S. K., & Chakraborty, G. (2000). A comparative analysis of three communication formats: advertising, infomercial, and direct experience. Journal of Advertising, 29(4), 59-75
Sirdeshmukh, Deepak, Jagdip Singh, and Barry Sabo (2002), "Consumer Trust, Value, and Loyalty in Relational Exchanges," Journal of Marketing, 66 (January), 15-37
Sparks, B. A., Perkins, H. E., & Buckley, R. (2013). Online travel reviews as persuasive communication: The effects of content type, source, and certification logos on consumer behavior. Tourism Management, 39, 1-9.
Spence, A.M. (1973). Job Market Signaling. Quarterly Journal of Economics, 87(3), 355–374.
Sternthal, B., Dholakia, R., & Leavitt, C. (1978). The persuasive effect of source credibility: Tests of cognitive response. Journal of Consumer Research, 252-260.
Stewart, K. J. (2003). Trust transfer on the world wide web. Organization Science, 14(1), 5-17.
Suh, B., & Han, I. (2003). Effect of trust on customer acceptance of Internet banking. Electronic Commerce Research and Applications, 1(3), 247-263.
Swain, S. D., Weathers, D., & Niedrich, R. W. (2008). Assessing three sources of misresponse to reversed Likert items. Journal of Marketing Research, 45(1), 116-131.
Tanz, J. (2014). How Airbnb and Lyft Finally Got Americans to Trust Each Other. Retrieved May, 5, 2014.
Teubner, T., Adam, M. T., Camacho, S., & Hassanein, K. (2014). Understanding Resource Sharing in C2C Platforms: The Role of Picture Humanization. ACIS.
Teubner, T. (2014). Thoughts on the Sharing Economy. In Proceedings of the International Conference on e-Commerce (Vol. 11, pp. 322-326).
Trusov, M., Bucklin, R. E., & Pauwels, K. (2009). Effects of word-of-mouth versus traditional marketing: findings from an internet social networking site. Journal of Marketing, 73(5), 90-102.
Tsui, A. S., Egan, T., & O'Reilly, C. (1991, August). Being different: Relational demography and organizational attachment. In Academy of Management Proceedings (Vol. 1991, No. 1, pp. 183-187). Academy of Management.
Urban, G. L., Sultan, F., & Qualls, W. J. (2000). Placing Trust at the Center of Your Internet Strategy. Sloan Management Review.
Van Doorn, J., & Verhoef, P. C. (2011). Willingness to pay for organic products: Differences between virtue and vice foods. International Journal of Research in Marketing, 28(3), 167-180.
Verplanken, B., Hazenberg, P. T., & Palenewen, G. R. (1992). Need for cognition and external information search effort. Journal of Research in Personality, 26(2), 128-136.
Ward, C. D., Br McGinnies, E. (1974). Persuasive effects of early and late mention of credible and noncredible sources. Journal of Psychology, 86(1), 17-23.
Woodside, A. G., & Davenport, J. W. (1974). Effects of price and salesman expertise on customer purchasing behavior. Journal of Business, 49, 51-59.
Zak, P. J., & Knack, S. (2001). Trust and growth. The Economic Journal,111(470), 295-321.
Zhao, Y., Yang, S., Narayan, V., & Zhao, Y. (2013). Modeling consumer learning from online product reviews. Marketing Science, 32(1), 153-169.

Appendices
Appendices
Appendix A - Pre-test
SCREEN Question
number Question Categories Value / range Question type Variable type
1 Gender What is your gender? Male 1 SR,
nominal Numeric
Female 2
Age What is your age (in years)? <open> 10 - 99 SR, ratio Numeric
Educ What is your current or highest completed education?
No formal education 1 SR, ordinal Numeric
Education up to age 12 2
Education up to age 14 3
Education up to age 18 4
Higher education 5
University 6
SHOWING pages 2-6 PAGES IN RANDOM ORDER
2
Please see the website below, or visit www.blablacar.nl, (opens a new window), and give your opinion below:
<Showing blablacar screenshot>
A1 Do you know this website? Yes 1 SR, nominal
Numeric
No 2

Appendices
A Please indicate on a scale of 0 - 10 how much you agree with the following statements regarding the website above:
A_1 The organization behind this website is professional
Slider, 0-10 SR, ratio Numeric
A_2 The information on this website is reliable
Slider, 0-10 SR, ratio Numeric
A_3
If I would go ridesharing through an online platform, I would use this website
Slider, 0-10 SR, ratio Numeric
3
Please see the website below, or visit Samenrijden.nl, (opens a new window), and give your opinion below:
<Showing samenrijden.nl screenshot>
B Do you know this website? Yes 1 SR, nominal
Numeric
No 2
B Please indicate on a scale of 0 - 10 how much you agree with the following statements regarding the website above:
B_1 The organization behind this website is professional
Slider, 0-10 SR, ratio Numeric
B_2 The information on this website is reliable
Slider, 0-10 SR, ratio Numeric
B_3
If I would go ridesharing through an online platform, I would use this website
Slider, 0-10 SR, ratio Numeric
4
Please see the website below, or visit www.filenetwerken.nl, (opens a new window), and give your opinion below:
<Showing filenetwerken screenshot>
C1 Do you know this website? Yes 1 SR, nominal
Numeric
No 2
C Please indicate on a scale of 0 - 10 how much you agree with the following statements regarding the website above:

Appendices
C_1
The organization behind this website is professional
Slider, 0-10 SR, ratio Numeric
C_2 The information on this website is reliable
Slider, 0-10 SR, ratio Numeric
C_3
If I would go ridesharing through an online platform, I would use this website
Slider, 0-10 SR, ratio Numeric
5
Please see the website below, or visit backseatsurfing.com, (opens a new window), and give your opinion below:
<Showing backseatsurfing.com screenshot>
D1 Do you know this website? Yes 1 SR, nominal
Numeric
No 2
D Please indicate on a scale of 0 - 10 how much you agree with the following statements regarding the website above:
D_1 The organization behind this website is professional
Slider, 0-10 SR, ratio Numeric
D_2 The information on this website is reliable
Slider, 0-10 SR, ratio Numeric
D_3
If I would go ridesharing through an online platform, I would use this website
Slider, 0-10 SR, ratio Numeric
6
Please see the website below, or visit Meerijden.nu, (opens a new window), and give your opinion below:
<Showing meerijden.nu screenshot>
E1 Do you know this website? Yes 1 SR, nominal
Numeric
No 2
E Please indicate on a scale of 0 - 10 how much you agree with the following statements regarding the website above:
E_1 The organization behind this website is professional
Slider, 0-10 SR, ratio Numeric
E_2 The information on this website is reliable
Slider, 0-10 SR, ratio Numeric

Appendices
E_3
If I would go ridesharing through an online platform, I would use this website
Slider, 0-10 SR, ratio Numeric
7 INTRO_FACE Please check the following ten pictures of people who offer a ride via an online ridesharing platform
<Show 10 pictures of 5 males and 5 females, with the numbers 1 to 10>
If you would go ridesharing, with who would you be most comfortable sharing a ride as a passenger?
PREF Please indicate to what degree you would avoid or prefer being a passenger with each person?
Driver 1 1= stronlgy avoid, 7=strongly prefer 1-7 SR, interval
Numeric
Driver 2
1= stronlgy avoid, 7=strongly prefer 1-7 SR, interval
Numeric
Driver 3
1= stronlgy avoid, 7=strongly prefer 1-7 SR, interval
Numeric
Driver 4
1= stronlgy avoid, 7=strongly prefer 1-7 SR, interval
Numeric
Driver 5
1= stronlgy avoid, 7=strongly prefer 1-7 SR, interval
Numeric
Driver 6
1= stronlgy avoid, 7=strongly prefer 1-7 SR, interval
Numeric
Driver 7
1= stronlgy avoid, 7=strongly prefer 1-7 SR, interval
Numeric
Driver 8
1= stronlgy avoid, 7=strongly prefer 1-7 SR, interval
Numeric
Driver 9
1= stronlgy avoid, 7=strongly prefer 1-7 SR, interval
Numeric
Driver 10
1= stronlgy avoid, 7=strongly prefer 1-7 SR, interval
Numeric

Appendices
8 END Thank you for participating in my pre-test! In case of any questions or remarks, you can write this in the text box below, or contact me through [email protected]

Appendices
Platforms
B www.backseatsurfing.com A www.meerijden.nu

Appendices
C www.samenrijden.nl D www.filenetwerken.nl

Appendices
E www.blablacar.nl

Appendices
10 drivers
Results platforms
Blablacar Samenrijden Filenetwerken Backseatsurfing Meerijden
The organization behind this website is professional
MEAN 7.82 7.86 6.46 5.25 3.68
STDDEV 1.06 1.33 1.40 1.92 2.13 The information on this website is reliable
MEAN 7.39 7.43 6.29 5.86 3.82
STDDEV 0.92 1.23 1.72 1.38 2.13 If I would go ridesharing through an online platform, I would use this website
MEAN 7.29 6.86 4.79 4.68 2.46
STDDEV 1.61 1.99 2.48 2.40 2.35
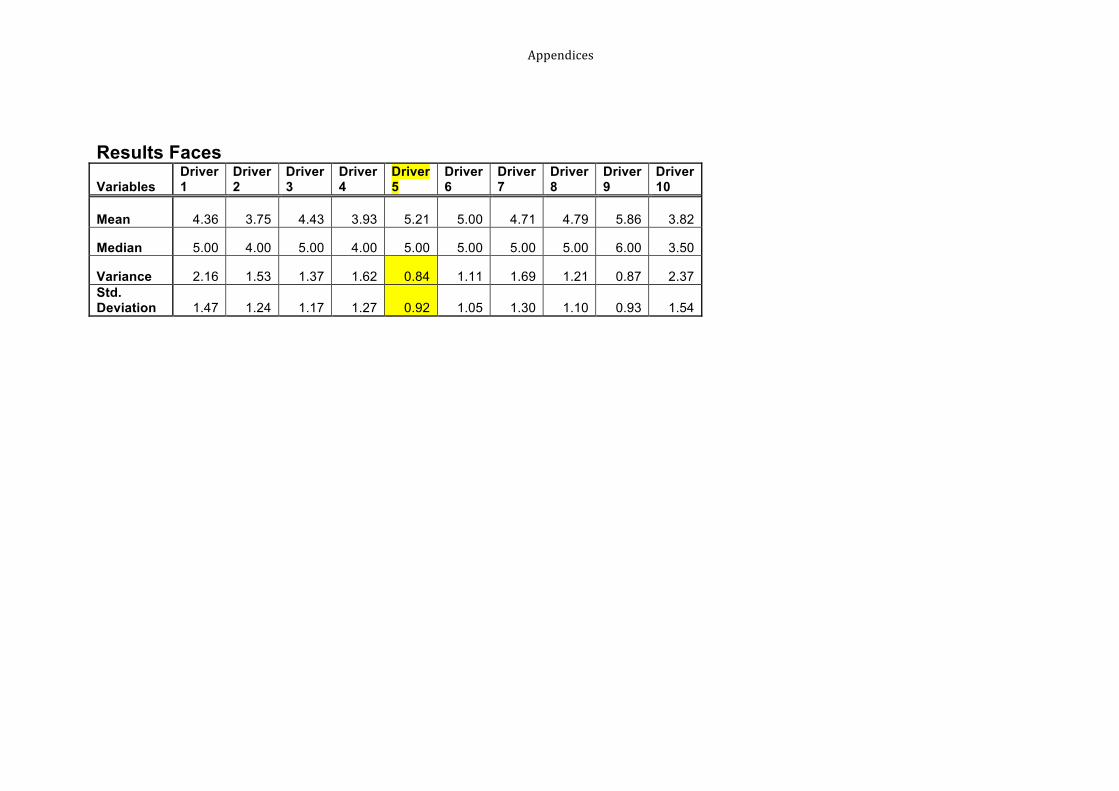
Appendices
Results Faces
Variables Driver 1
Driver 2
Driver 3
Driver 4
Driver 5
Driver 6
Driver 7
Driver 8
Driver 9
Driver 10
Mean 4.36 3.75 4.43 3.93 5.21 5.00 4.71 4.79 5.86 3.82
Median 5.00 4.00 5.00 4.00 5.00 5.00 5.00 5.00 6.00 3.50
Variance 2.16 1.53 1.37 1.62 0.84 1.11 1.69 1.21 0.87 2.37 Std. Deviation 1.47 1.24 1.17 1.27 0.92 1.05 1.30 1.10 0.93 1.54

Appendices
Appendix B – Survey
SCREEN
Question number Question Categories
Value / range
Question type Variable type Routing
1 INTRO Dear contestant, (voor Nederlands, verander de taal rechts boven)
This survey is about online ridesharing platforms. The survey takes approximately 10 minutes to complete. Among completed and valid surveys 5 emailaddresses will be randomly selected and receive a cinema coupon of 10,EURO for Pathé. (not obligatory) This survey is easier to complete on a PC, laptop or tablet than on the mobile phone. Firstly some questions will be asked regarding your personality and experiences with ridesharing. After this part, 6 different ridesharing profiles are presented with some related questions. The final part includes some wrap-up and demographical questions. At the end of the survey you can leave your emailaddress to have a chance on one of the 5 cinema coupons. Thanks a lot in advance! For questions, contact me through [email protected] Kind regards, Ronald Hoek Student MSc Business and Economics, specialization Marketing Erasmus School of Economics, Erasmus University Rotterdam
2 NFC_intro Please indicate how much you agree with the following statemements NFC1 I would prefer complex to simple problems. 1=Strongly disagree, 2=disagree,
3=neutral, 4=agree, 5=strongly agree
1-5 SR, interval
Numeric
NFC2 I like to have the responsibility of handling a situation that requires a lot of thinking.
1=Strongly disagree, 2=disagree, 3=neutral, 4=agree, 5=strongly agree
1-5 SR, interval
Numeric
NFC3 I find satisfaction in deliberating hard and for long hours. 1=Strongly disagree, 2=disagree, 3=neutral, 4=agree, 5=strongly
1-5 SR, interval
Numeric

Appendices
agree
NFC4 The idea of relying on thought to make my way to the top appeals to me. 1=Strongly disagree, 2=disagree, 3=neutral, 4=agree, 5=strongly agree
1-5 SR, interval
Numeric
NFC5 I really enjoy a task that involves coming up with new solutions to problems. 1=Strongly disagree, 2=disagree, 3=neutral, 4=agree, 5=strongly agree
1-5 SR, interval
Numeric
NFC6 I prefer my life to be filled with puzzles that I must solve. 1=Strongly disagree, 2=disagree, 3=neutral, 4=agree, 5=strongly agree
1-5 SR, interval
Numeric
NFC7 The notion of thinking abstractly is appealing to me. 1=Strongly disagree, 2=disagree, 3=neutral, 4=agree, 5=strongly agree
1-5 SR, interval
Numeric
NFC8 I would prefer a task that is intellectual, difficult, and important to one that is somewhat important but does not require much thought.
1=Strongly disagree, 2=disagree, 3=neutral, 4=agree, 5=strongly agree
1-5 SR, interval
Numeric
NFC9 I usually end up deliberating about issues even when they do not affect me personally.
1=Strongly disagree, 2=disagree, 3=neutral, 4=agree, 5=strongly agree
1-5 SR, interval
Numeric
3 PROP_intro Please indicate how much you agree with the following statemements
Prop1 Most people can be counted on to do what they say they will do. 1=Strongly disagree, 2=disagree, 3=neutral, 4=agree, 5=strongly agree
1-5 SR, interval
Numeric
Prop2 Most people answer public opinion polls honestly. 1=Strongly disagree, 2=disagree, 3=neutral, 4=agree, 5=strongly agree
1-5 SR, interval
Numeric
Prop3 Most experts tell the truth about the limits of their knowledge. 1=Strongly disagree, 2=disagree, 3=neutral, 4=agree, 5=strongly agree
1-5 SR, interval
Numeric
Prop4 Most salespeople are honest in describing their products. 1=Strongly disagree, 2=disagree, 3=neutral, 4=agree, 5=strongly agree
1-5 SR, interval
Numeric
Prop5 Most repair people will not overcharge people who are ignorant of their specialty. 1=Strongly disagree, 2=disagree, 3=neutral, 4=agree, 5=strongly agree
1-5 SR, interval
Numeric
Prop6 Most adults are competent at their jobs. 1=Strongly disagree, 2=disagree, 3=neutral, 4=agree, 5=strongly agree
1-5 SR, interval
Numeric

Appendices
4 INTRO_RIDESHARING
This survey is about ridesharing. Ridesharing exists when two or more trips take place simultaneously in a single vehicle. Lately there has been a growth of online platforms that connect people who offer and look for a ride. On these platforms you primarily find people who frequently drive long distances for work or leisure, and like to have a companion on their way. They often ask a small fee to share the costs of the ride, but the drivers' motives are rarely to earn profits. See below the logo's of platforms in the Netherlands
PRIOR_WOM Have you ever heard of ride-sharing through online platforms before? 1= No 1-3 SR,
categorial Numeric
2= Yes, mostly positive things 3= Yes, no posiotive or negative
things
4= Yes, mostly negative things PREV_EXP Have you ever ride-shared through an online platform? 1= Yes 0-1 SR,
categorial Numeric
0= No 5 FREQ_EXP What was the frequency of ridesharing through an online platform in the
last 6 months? 1=Never If
Prev_EXP=1
2= Rarely (1-2 times) 3=Occasionally (3-5 times) 4= Often (5-10 times) 5= Very often (more than 10
times)
NPS_EXP Given your personal experience, how likely are you to recommend ridesharing through an online platform to a friend or colleague?
0 = not at all likely, 10= extremely likely
Slider, 0-10
SR, ratio Numeric If Prev_EXP=1
6 PRIOR_ATT Please indicate what you think about ridesharing through an online
platform?
Like - Dislike 1-7 SR, Bipolar
Numeric
Good - Bad 1-7 SR, Bipolar
Numeric
Usefull - Useless 1-7 SR, Bipolar
Numeric
Beneficial - Harmful 1-7 SR, Bipolar
Numeric

Appendices
Desirable - Undesirable 1-7 SR, Bipolar
Numeric
Wise - Foolish 1-7 SR, Bipolar
Numeric
PRIOR_INT Please indicate how likely it is that you would use ridesharing through an
online platform in the future? 0 = not at all likely, 10= extremely likely
Slider, 0-10
SR, ratio Numeric
7 You will now be presented with 6 different looking profiles of a person who
offers a ride through a ridesharing platform. All 6 profiles will be about the same person, but try to look at every profile as if it is a completely new situation.
8 - 13 See the following ridesharing profile and answer the questions regarding
this profile. RANDO
MLY PRESENT THE 6 PROFILES
Trust_intro Please indicate how much you agree with the following statements regarding the presented profile. Given the profile above, I believe..
Abil1 this driver is very capable in providing a good ride-sharing service 1=Strongly disagree, 2=disagree, 3=neutral, 4=agree, 5=strongly agree
1-5 SR, interval
Numeric
Abil2 I feel confident about the ridesharing skills of this driver 1=Strongly disagree, 2=disagree, 3=neutral, 4=agree, 5=strongly agree
1-5 SR, interval
Numeric
Abil3 this driver is a well qualified ride-sharer 1=Strongly disagree, 2=disagree, 3=neutral, 4=agree, 5=strongly agree
1-5 SR, interval
Numeric
Ben1 my needs and desires are very important to this driver 1=Strongly disagree, 2=disagree, 3=neutral, 4=agree, 5=strongly agree
1-5 SR, interval
Numeric
Ben2 this driver would not knowingly do anything to hurt me 1=Strongly disagree, 2=disagree, 3=neutral, 4=agree, 5=strongly agree
1-5 SR, interval
Numeric
Ben3 this driver really looks out for what is important to me 1=Strongly disagree, 2=disagree, 3=neutral, 4=agree, 5=strongly agree
1-5 SR, interval
Numeric
Int1 this driver has a strong sense of justice 1=Strongly disagree, 2=disagree, 3=neutral, 4=agree, 5=strongly agree
1-5 SR, interval
Numeric
Int2 this driver tries hard to be fair in dealing with clients 1=Strongly disagree, 2=disagree, 1-5 SR, Numeric
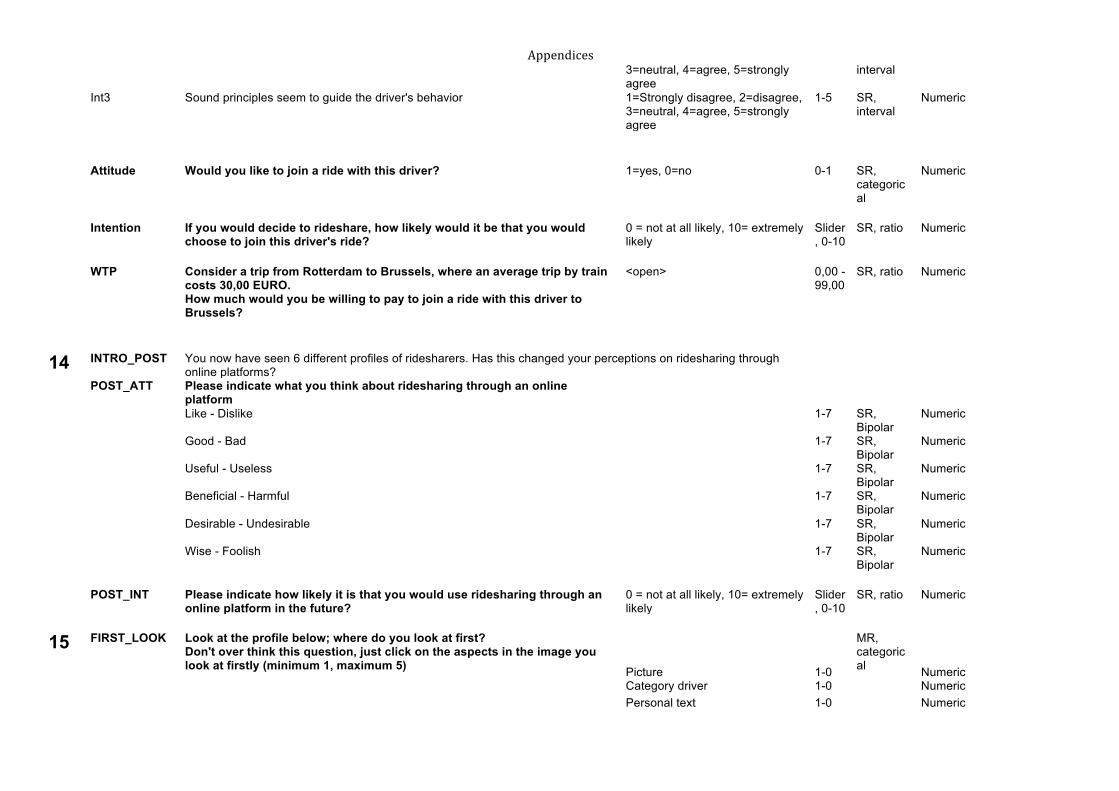
Appendices
3=neutral, 4=agree, 5=strongly agree
interval
Int3 Sound principles seem to guide the driver's behavior 1=Strongly disagree, 2=disagree, 3=neutral, 4=agree, 5=strongly agree
1-5 SR, interval
Numeric
Attitude Would you like to join a ride with this driver? 1=yes, 0=no 0-1 SR, categorical
Numeric
Intention If you would decide to rideshare, how likely would it be that you would
choose to join this driver's ride? 0 = not at all likely, 10= extremely likely
Slider, 0-10
SR, ratio Numeric
WTP Consider a trip from Rotterdam to Brussels, where an average trip by train
costs 30,00 EURO. How much would you be willing to pay to join a ride with this driver to Brussels?
<open> 0,00 - 99,00
SR, ratio Numeric
14 INTRO_POST You now have seen 6 different profiles of ridesharers. Has this changed your perceptions on ridesharing through
online platforms?
POST_ATT Please indicate what you think about ridesharing through an online platform
Like - Dislike 1-7 SR,
Bipolar Numeric
Good - Bad 1-7 SR, Bipolar
Numeric
Useful - Useless 1-7 SR, Bipolar
Numeric
Beneficial - Harmful 1-7 SR, Bipolar
Numeric
Desirable - Undesirable 1-7 SR, Bipolar
Numeric
Wise - Foolish 1-7 SR, Bipolar
Numeric
POST_INT Please indicate how likely it is that you would use ridesharing through an
online platform in the future? 0 = not at all likely, 10= extremely likely
Slider, 0-10
SR, ratio Numeric
15 FIRST_LOOK Look at the profile below; where do you look at first?
Don't over think this question, just click on the aspects in the image you look at firstly (minimum 1, maximum 5) Picture 1-0
MR, categorical Numeric
Category driver 1-0 Numeric
Personal text 1-0 Numeric

Appendices
Ratings 1-0 Numeric
Reviews 1-0 Numeric
Activities 1-0 Numeric
Rating summary 1-0 Numeric
Car 1-0 Numeric
Name and Age 1-0 Numeric
identification validation 1-0 Numeric
16 IMP_CUE
S What are the top3 MOST important parts of the profile to decide whether the ridesharer is trustworthy? (Click on the 3 most important parts in the image) Picture 1-0
MR, categorical Numeric
Category driver 1-0 Numeric
Personal text 1-0 Numeric
Ratings 1-0 Numeric
Reviews 1-0 Numeric
Activities 1-0 Numeric
Rating summary 1-0 Numeric
Car 1-0 Numeric
Name and Age 1-0 Numeric
identification validation 1-0 Numeric
17 N_IMP_C
UES What are the top3 LEAST important parts of the profile to decide whether the ridesharer is trustworthy? (Click on the 3 least important parts in the image) Picture 1-0
MR, categorical Numeric
Category driver 1-0 Numeric
Personal text 1-0 Numeric
Ratings 1-0 Numeric
Reviews 1-0 Numeric
Activities 1-0 Numeric
Rating summary 1-0 Numeric
Car 1-0 Numeric
Name and Age 1-0 Numeric
identification validation 1-0 Numeric
18 DEMO_INTRO You have reached the final part of the survey
Please fill in some demographical questions
Daily_occ What is your most important daily occupation? Full-time job (more than 29 hours
a week) 1 SR,
nominal Numeric
Part-time job (8-29 hours a week) 2 Part-time job (under 8 hours a 3

Appendices
week)
Unemployed 4 Sick/disabled 5 Retired 6 House wife/man 7 Student 8 Educ What is your current or highest completed education? No formal education 1 SR,
ordinal Numeric
Education up to age 12 2 Education up to age 14 3 Education up to age 18 4 Higher education 5 University 6 Gender What is your gender? Male 1 SR,
nominal Numeric
Female 2 Age What is your age (in years)? <open> 10 -
99 SR, ratio Numeric
Nationality What is your country of origin? Dropdown list with all countries 1-195 SR,
nominal Numeric
19 END Thank you for completing my survey, which is part of my MSc thesis! PRICE As a reward for completing this survey, you can participate to win a coupon of 10
EURO. Please indicate whether you are interested to win a coupon of the ridesharing platform Blablarcar, or a coupon for Cinema Pathé.
1= Blablacar coupon of 10,- EURO
1-3 SR, nominal
Numeric
2= Pathé cinema coupon of 10- EURO
3= I do not want to participate in
the lotery
MAIL Please fill in your email address to take part in the lottery and have a chance to
win one of the prices <open>

Appendices
END2 For this research I need a lot of completed surveys, so do you want to triple the chance of winning a coupon?
Share this post on your Facebook
and your email address will be mentioned three times in the list from where the
winners will be randomly selected!
In case of any questions regarding the questionnaire or research, feel free to contact me through [email protected]
Go to the next page to send your completed survey.
With kind regards,
Ronald Hoek

Appendix C – Experiment
A
B

Appendices
C

Appendices
D

Appendices
E

Appendices
F

Appendices
Appendix D – Additional tables and graphs
Demographics respondents (n=255) % Count %
Mal
e
% F
emal
e
% B
elow
25
% 2
5 - 2
9
% 3
0 - 3
9
% 4
0 - 5
4
% 5
5 an
d ol
der
% U
nive
rsity
% H
ighe
r edu
catio
n %
Edu
catio
n up
to
age
18
% E
duca
tion
up to
ag
e 14
% F
ull-t
ime
job
% P
art-t
ime
job
(8-2
9 hr
s)
% P
art-t
ime
job
(< 8
hr
s)
% U
nem
ploy
ed
% S
ick/
disa
bled
% R
etire
d
% H
ouse
wife
/man
% S
tude
nt
Gender Male 57,3% 146 28 32 20 12 8 58 31 10 1 67 6 1 1 1 1 1 23 Female 42,7% 109 29 26 17 21 6 51 29 15 5 56 17 1 1 0 1 2 22 Age Below 25 28,6% 73 56 44 62 25 12 1 36 3 0 1 0 1 1 58 25 - 29 29,4% 75 63 37 60 35 5 0 65 12 1 1 0 0 0 20 30 - 39 18,8% 48 60 40 52 35 13 0 83 13 0 2 0 0 2 0 40 - 54 15,7% 40 43 58 45 23 25 8 80 18 0 0 3 0 0 0 55 and older 7,5% 19 63 37 37 37 11 16 63 21 5 0 0 5 5 0 Education University 54,9% 140 60 40 32 32 18 13 5 59 9 1 1 0 1 0 29
Higher education 30,2% 77 58 42 23 34 22 12 9 71 10 1 1 0 0 1 14
Education up to age 18 12,2% 31 48 52 29 13 19 32 6 58 19 0 0 0 0 6 16 Education up to age 14 2,7% 7 29 71 14 0 0 43 43 57 29 0 0 14 0 0 0 Most important daily occupation Full-time job (> 29 hrs p/week) 62,4% 159 62 38 16 31 25 20 8 52 35 11 3 Part-time job (8-29 hrs p/week) 11,0% 28 32 68 7 32 21 25 14 43 29 21 7 Part-time job (< 8 hrs p/week) 0,8% 2 50 50 0 50 0 0 50 50 50 0 0 Unemployed 1,2% 3 67 33 33 33 33 0 0 67 33 0 0 Sick/disabled 0,4% 1 100 0 0 0 0 100 0 0 0 0 100 Retired 0,8% 2 50 50 50 0 0 0 50 100 0 0 0 House wife/man 1,2% 3 33 67 33 0 33 0 33 0 33 67 0 Student 22,4% 57 58 42 74 26 0 0 0 72 19 9 0 Tabel 1 Demographics

Appendices
Factor analysis Total Variance Explained
Compone
nt
Initial Eigenvalues Extraction Sums of Squared Loadings Rotation Sums of Squared Loadings
Total % of
Variance
Cumulative
%
Total % of
Variance
Cumulative
%
Total % of
Variance
Cumulative
%
1 7,162 25,579 25,579 7,162 25,579 25,579 6,693 23,903 23,903
2 3,856 13,771 39,350 3,856 13,771 39,350 4,106 14,665 38,568
3 3,212 11,470 50,820 3,212 11,470 50,820 3,335 11,910 50,478
4 2,736 9,771 60,591 2,736 9,771 60,591 2,832 10,113 60,591
5 ,959 3,425 64,016
6 ,875 3,126 67,142
7 ,852 3,042 70,184
8 ,807 2,883 73,067
9 ,658 2,351 75,418
10 ,634 2,265 77,683
11 ,604 2,156 79,839
12 ,584 2,086 81,925
13 ,539 1,925 83,850
14 ,517 1,845 85,695
15 ,456 1,630 87,325
16 ,424 1,516 88,840
17 ,394 1,408 90,249
18 ,362 1,293 91,542
19 ,344 1,229 92,771
20 ,304 1,085 93,856
21 ,301 1,074 94,930
22 ,283 1,010 95,939
23 ,262 ,937 96,877
24 ,221 ,789 97,665
25 ,194 ,693 98,358
26 ,168 ,601 98,959
27 ,161 ,573 99,533
28 ,131 ,467 100,000
Extraction Method: Principal Component Analysis.

Appendices
Rotated Component Matrixa
Component
1 2 3 4
I like to have the responsibility
of handling a situation that
requires a lot of thinking.
,042 -,019 ,762 ,068
I find satisfaction in
deliberating hard and for long
hours.
,055 ,045 ,634 -,090
The idea of relying on thought
to make my way to the top
appeals to me.
,085 -,095 ,668 -,081
I really enjoy a task that
involves coming up with new
solutions to problems.
,023 -,070 ,633 ,062
I prefer my life to be filled with
puzzles that I must solve. ,040 ,014 ,708 ,191
The notion of thinking
abstractly is appealing to me. ,066 ,034 ,667 -,115

Appendices
I would prefer a task that is
intellectual, difficult, and
important to one that is
somewhat important but does
not require much thought.
,063 ,040 ,720 ,059
Most people can be counted
on to do what they say they will
do
-,001 -,082 -,019 ,710
Most people answer public
opinion polls honestly ,026 -,099 -,012 ,722
Most experts tell the truth
about the limits of their
knowledge
,004 ,089 -,025 ,659
Most salespeople are honest in
describing their products ,018 -,036 ,001 ,644
Most repair people will not
overcharge people who are
ignorant of their specialty
,010 -,023 ,048 ,713
Most adults are competent at
their jobs ,003 -,027 ,052 ,587
Like:Dislike -,055 ,789 -,033 -,013
Good:Bad -,050 ,844 -,020 -,105
Usefull:Useless -,157 ,817 ,016 -,034
Beneficial:Harmful -,071 ,833 ,005 ,062
Desirable:Undesirable -,076 ,787 -,001 -,050
Wise:Foolish -,093 ,830 -,020 -,071
sound principles seem to guide
the driver's behavior ,870 -,040 ,023 ,012
this driver is very capable in
providing a good ride-sharing
service
,870 -,113 ,075 ,016
I feel confident about the ride-
sharing skills of this driver ,864 -,106 ,046 ,008
this driver is a well-qualified
ride-sharer ,867 -,109 ,078 -,005
my needs and desires are very
important to this driver ,836 -,109 ,066 ,002
this driver would not knowingly
do anything to hurt me ,845 -,059 ,081 ,053
this driver really looks out for
what is important to me ,843 -,038 ,057 -,012
this driver has a strong sense
of justice ,851 -,038 ,056 ,004
this driver tries hard to be fair
in dealing with clients ,873 -,036 ,045 ,016

Appendices
Extraction Method: Principal Component Analysis.
Rotation Method: Varimax with Kaiser Normalization.
a. Rotation converged in 5 iterations.
Component Transformation Matrix
Component 1 2 3 4
1 ,932 -,309 ,184 ,056
2 ,291 ,920 ,136 -,222
3 -,207 -,018 ,949 ,235
4 ,065 ,239 -,215 ,945
Extraction Method: Principal Component Analysis.
Rotation Method: Varimax with Kaiser Normalization.
Top Related