


Languages
Pages
Legal


Evolution


Adaptation
What do these bugs have in common?
A flower mantidin Malaysia
A leaf mantid in Costa Rica

Darwin’s Voyage• Studied theology• At age 22, 5yr, voyage on the
Beagle• Similarities between living and
fossil organisms
Figure 13.1A

Figure 13.4

GalapagosIslands
Isabela
Darwin
Wolf
Pinta
Marchena Genovesa
Fernandia
SantiagoBartolomé
RabidaPinzon
SeymourBaltra
Santa Cruz
Santa Fe
Tortuga
Española
San Cristobal
Floreana

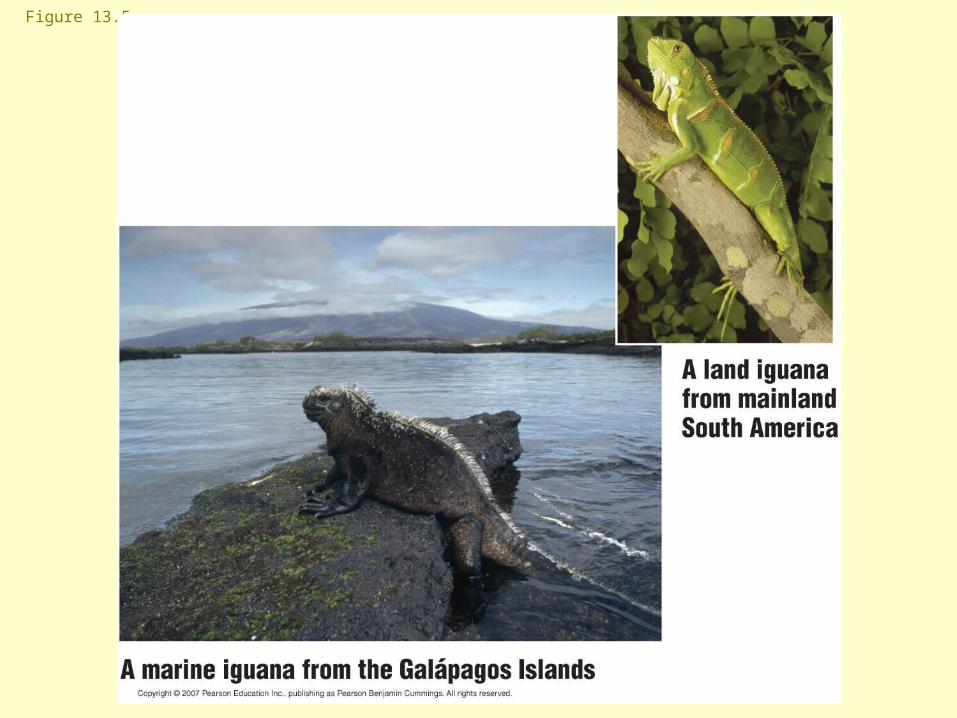
Figure 13.5

•Aristotle•Judeo-Christian culture•Lamarck
– Inheritance of acquired traits
Early Ideas


Geology
• Geologists proposed…– Very old Earth– Changed by gradual processes

•Darwin and Wallace•1859 On the Origin of Species•Natural Selection
– The mechanism of evolution– Artificial selection?
Descent with Modification

Figure 13.2A
Hundreds to thousandsof years of breeding(artificial selection)
Ancestral dog (wolf)
Figure 13.2B
Artificial Selection

Living species……Are descended from earlier forms
Thousands tomillions of years
of natural selection
Ancestral canine
African wild dog Coyote Wolf Fox Jackal
Figure 13.2C
Natural Selection

•Fossils
A Skull of Homoerectus
D Dinosaur tracksC Ammonite castsB Petrified tree
E Fossilized organicmatter of a leaf
G “Ice Man”
F Insect in amber
Evidence for Evolution

Figure 13.7

•The fossil record – Time lines
Figure 13.3H
Evidence for Evolution

•Fossils link extinct species w/ living species
Figure 13.3I
Evidence for Evolution

•Biogeography– Geographic distribution of species– Why are marsupials found mostly in
Australia?
Evidence for Evolution

Figure 13.10

•Comparative anatomy– Homologous structures
• similar characteristics from common ancestry
Evidence for Evolution
Human Cat Whale BatFigure 13.4A

•Comparative Embryology
Evidence for Evolution
Post-analtail
Pharyngealpouches
Chick embryo Human embryoFigure 13.4B

•Molecular Biology– Comparing DNA
between different organisms
Table 13.4
Evidence for Evolution

Natural Selection
• Darwin’s observations– Overproduction– Individual variation– Differential reproductive success
• Who will survive and reproduce?

•Natural selection– Certain traits increase survival– Those indiv. influence the future
•Where can we observe changes in traits?
Natural Selection

Figure 13.14

What is a population?Population genetics
Population Evolve
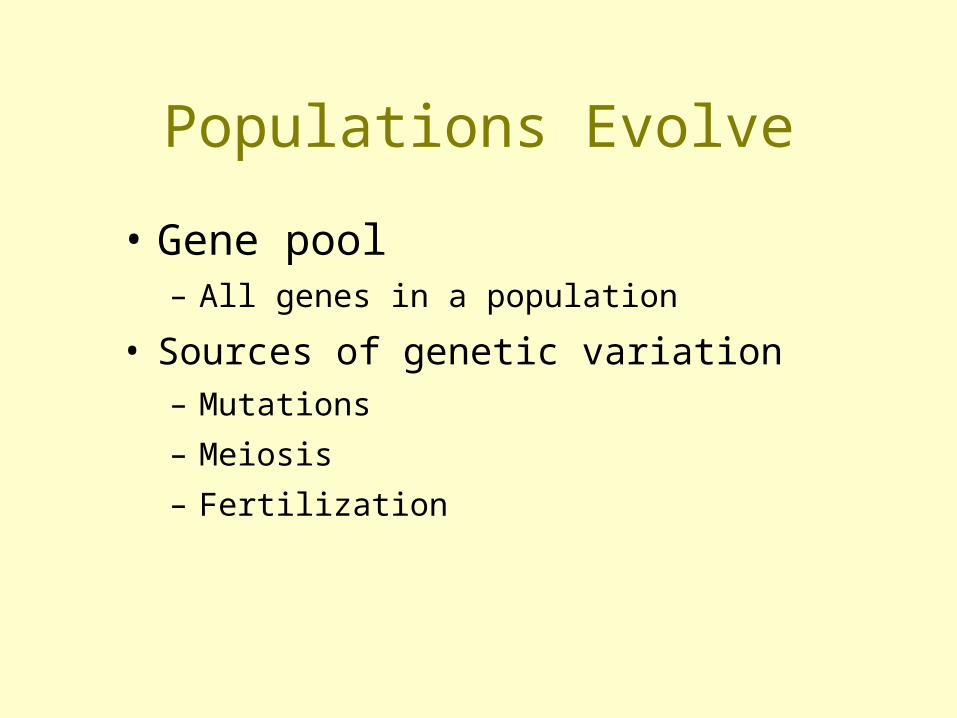
Populations Evolve
• Gene pool– All genes in a population
• Sources of genetic variation– Mutations
– Meiosis
– Fertilization

Populations Evolve
• Individuals don’t evolve!• Evolution is change in
frequency of traits in a population!

• Or not?•What would a nonevolving population look like?•Stable allele frequency
Populations Evolve

– Genes are shuffled during sexual reproduction
– does not alter the proportions of alleles
– P2 + 2pq + q2 = 1Phenotypes
Genotypes WW Ww ww
Number of animals(total 500)
320 160 20
320500
Genotype frequencies 0.64 160500
0.32 20500
0.04
Number of allelesin gene pool(total 1,000)
Allele frequencies 8001,000
0.8 W 0.2 w
640 W 160 W 160 w 40 w
Figure 13.7B
2001,000
Hardy-Weinberg Equilibrium

Genetic Equilibrium
• No mutation
• Large population
• Isolation
• Everyone reproduces
• Random mating

Microevolution
• Drives a population away from equilibrium: Natural selection and…– Gene flow
– Genetic drift
– Mutations
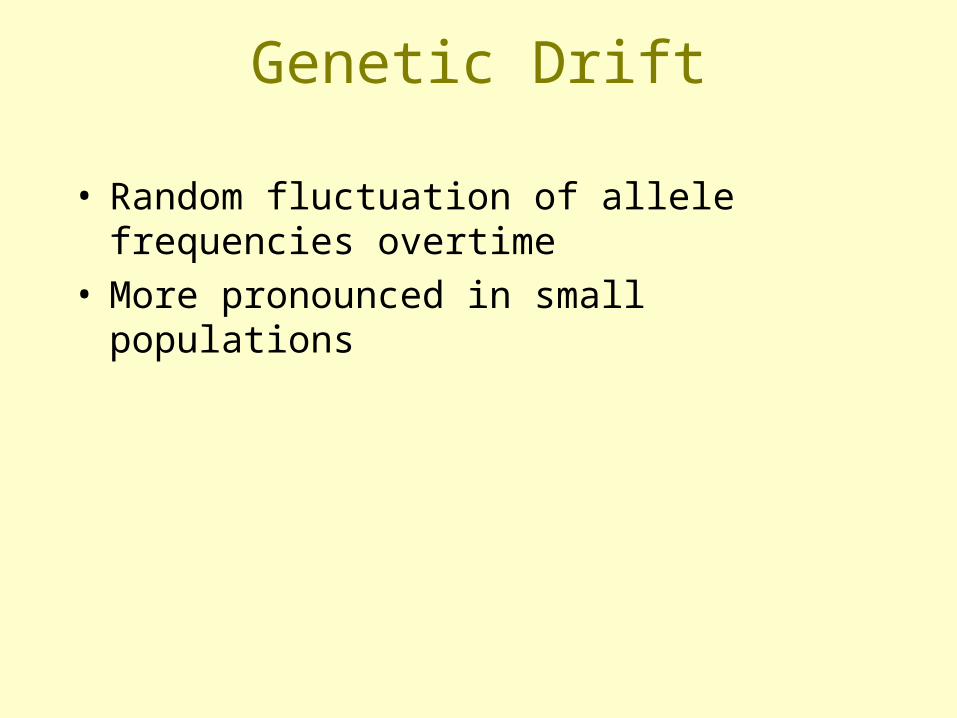
Genetic Drift
• Random fluctuation of allele frequencies overtime
• More pronounced in small populations

Figure 13.22

Computer Simulation
AA in five populations
allele A lostfrom fourpopulations
1.0
0.5
01 505 10 15 20 25 30 35 40 45
Generation (25 stoneflies at the start of each)

Computer Simulation
allele A neitherlost norfixed
1.0
0.5
01 505 10 15 20 25 30 35 40 45
Generation (500 stoneflies at the start of each)

Bottleneck Effect
• A severe reduction in population size
• Lots of drift• Example
– Elephant seals 20 individuals – rebounded to 30,000

Bottleneck
Originalpopulation
Bottleneckingevent
Survivingpopulation
Figure 13.9A Figure 13.9B

Figure 13.24

Inbreeding
• Leads to increased homozygosity• Can lower fitness • More recessive alleles are
expressed• Amish, cheetahs

Founder Effect
• A few individuals start a new population
• Allele frequencies of founders may be different from original population

Figure 13.25

Gene Flow
• Genes move in/out of a population
• Immigration/emigration
• Minimizes genetic variation between populations
Mutations
• Infrequent – Lethal – Neutral – Advantageous

Natural Selection Revisited
• Largest impact• Successful alleles = successful
phenotypes • Who will reproduce?• What will happen to allele
frequencies? • Increased fitness!
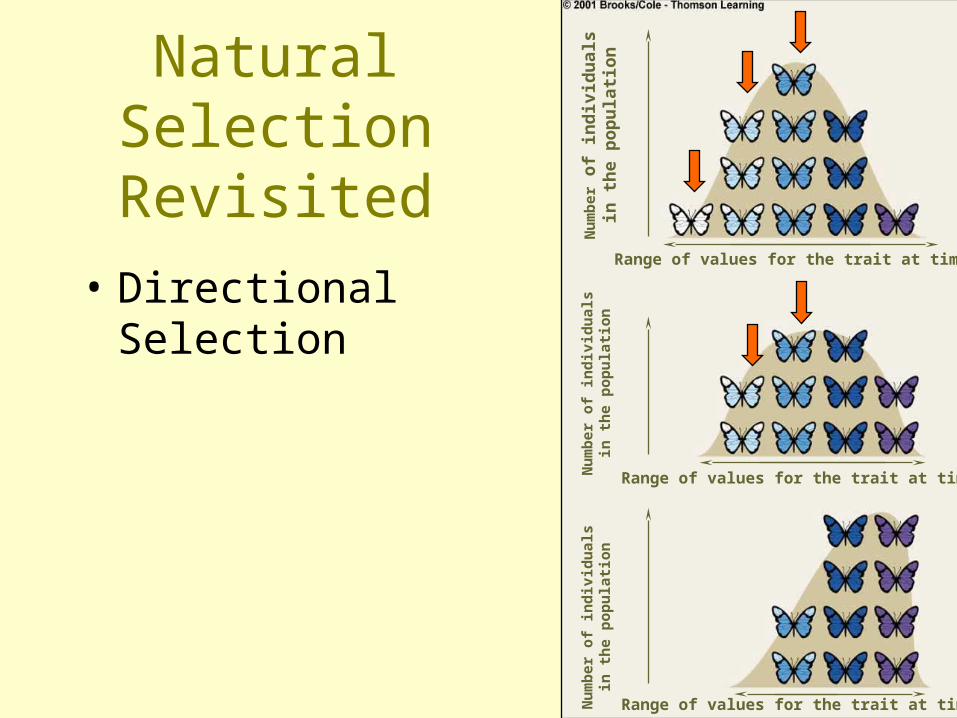
Natural Selection Revisited
• Directional Selection
Nu
mb
er o
f in
div
idu
als
in t
he
po
pu
lati
on
Range of values for the trait at time 1
Range of values for the trait at time 2
Range of values for the trait at time 3
Nu
mb
er o
f in
div
idu
als
in t
he
po
pu
lati
on
Nu
mb
er o
f in
div
idu
als
in t
he
po
pu
lati
on

Antibiotic Resistance• Since 1940s
• Overuse
• Resistant forms

Natural Selection Revisited
• Stabilizing Selection
Nu
mb
er o
f in
div
idu
als
in t
he
po
pu
lati
on
Range of values for the trait at time 1
Range of values for the trait at time 2
Range of values for the trait at time 3

Natural Selection Revisited
• Disruptive Selection
Nu
mb
er o
f in
div
idu
als
in t
he
po
pu
lati
on
Range of values for the trait at time 1
Range of values for the trait at time 2
Range of values for the trait at time 3
Nu
mb
er o
f in
div
idu
als
in t
he
po
pu
lati
on
Nu
mb
er o
f in
div
idu
als
in t
he
po
pu
lati
on

Sexual Selection
Question of the Day
Antibiotic resistant bacteria are showing up all over the place. The infamous “flesh eating” bacteria is an example. What are two things that you can do to help prevent more bacteria from becoming antibiotic resistant?
Top Related