


Languages
Pages
Legal


Purdue UniversityPurdue e-Pubs
Libraries Faculty and Staff Scholarship and Research Purdue Libraries
6-2015
Evaluation of Web GIS Functionality in AcademicLibrariesNingning KongPurdue University, [email protected]
Tao ZhangPurdue University, [email protected]
Ilana StonebrakerPurdue University, [email protected]
Follow this and additional works at: http://docs.lib.purdue.edu/lib_fsdocs
Part of the Geographic Information Sciences Commons, and the Library and InformationScience Commons
This document has been made available through Purdue e-Pubs, a service of the Purdue University Libraries. Please contact [email protected] foradditional information.
Recommended CitationKong, Ningning; Zhang, Tao; and Stonebraker, Ilana, "Evaluation of Web GIS Functionality in Academic Libraries" (2015). LibrariesFaculty and Staff Scholarship and Research. Paper 113.http://dx.doi.org/http://dx.doi.org/10.1016/j.apgeog.2014.11.017
1
EVALUATION OF WEB GIS FUNCTIONALITIES IN ACADEMIC LIBRARIES
Abstract
The rise of web-based GIS resources has expanded the scale and scope of spatial
information seeking in most, if not all, academic libraries. Even without formal GIS training,
users can search for spatial information, create customized maps, as well as perform simple
spatial analysis. However, few systematic evaluations have been conducted to summarize
common web GIS functionalities as GIS moving from traditional desktop applications to the
web. In this study, we evaluated and assessed the major functionalities of web GIS applications
and their potential value for information discovery and access, using six most popular
applications in the academic libraries. In addition, since web GIS targets non-GIS professionals,
we also conducted an empirical usability evaluation of the six GIS applications in academic
libraries. As the result, we identified eight major GIS functionalities that web GIS offers for
information seeking purposes. The usability evaluation suggested that a user-friendly web GIS
application should provide users a clear starting point, predictable map interaction, flexible
customization capabilities, and familiar web experiences. Our study is one of the first studies to
examine web-based GIS functionalities and their associated usability in a systematic way. The
results will serve as an important reference for web GIS developers.
Key words: web GIS, GIS functionality, usability, information seeking
1. INTRODUCTION
With an increasing number of web map standards (OGC, 2013) and web mapping
Application Programming Interfaces (API), web GIS applications have reached new levels of
sophistication and prominence unheard of in earlier decades (Batty, Hudson-Smith, Milton, &
Crooks, 2010; Crampton, 2009; Haklay, Singleton, & Parker, 2008). As a result, the use of
web GIS to deliver information is facing a dramatic expansion (Chow, 2008). This brings new
opportunities for information-seeking and visualization in academic libraries (Weessies &
Dotson, 2013), as spatial information is often embedded in various library databases. Taking
business data as an example, it is estimated that more than three-quarters of data in the libraries
contains a geographic component (Brody, 1999).
Meanwhile, GIS functionality has also evolved (Kim & Kim, 2002; Kraak, 2004; Lu,
2005). Unlike traditional GIS software supports, it is unnecessary for each web GIS
application to include all geospatial operation components. On the other hand, new
expectations emerge, such as a user friendly interface design, as the number of users without
formal GIS training increases (Newman et al., 2010; Nivala, Brewster, & Sarjakoski, 2008).
Web GIS developers need to rethink and redesign traditional GIS tools and features to enhance
their usability, especially in terms of learnability, flexibility and robustness.
In this paper, we conducted functional reviews and usability tests of six commonly
used web GIS applications in academic libraries to explore the major functionality and usability
factors that enhance the performance of web GIS as an information discovery application. We
highlight the prevailing web GIS functions and their usability concerns, which will serve as a
reference for web GIS researchers and developers.
2. BACKGROUND
2
GIS functionality has been classified and discussed from the very beginning of GIS
technology (Goodchild, 1987; D. Maguire & Dangermond, 1991; D. J. Maguire, Goodchild, &
Rhinds, 1991). Traditional desktop based GIS functionalities, including mapping, database,
and spatial analysis, has been challenged when desktop GIS moves onto the web (Kraak, 2004).
For mapping, web users pay more attention to map interactivity, manipulation capability, as
well as usability, in addition to the traditional static map products (You, Chen, Liu, & Lin,
2007). For databases, data models are hidden in the back-end from web users, and database
query function becomes more important than before. Spatial analysis is still an important
component in web GIS, although it is not necessary for web GIS to include as many spatial
analysis functions as traditional GIS. Web GIS applications should deliberately pick a
reasonable number of goal-oriented spatial functions to provide users the query or analytic
capability while not overwhelming them (Musser, 1997).
In the academic library research literature, there have been several review studies
introducing web GIS for information users. Cobb and Olivero (1997) reviewed several online
GIS services and listed some possible “pitfalls” GIS websites might have, including non-
intuitive design, too intensive mapping functionality, lack of cartographic design, etc. A more
recent review has considered the map import/export capabilities as the major GIS functions for
information seekers (Kidd, 2010). From the research and education support perspective of
academic libraries, Weessies and Dotson (2013) used three case studies to demonstrate the
importance of historical data and data download functionality of web GIS. Although some
important GIS functions and web GIS design flaws have been identified by information
scientists, these web GIS functionality and usability issues have not been systematically studied
to address the needs of web GIS users and assist developers in improving web GIS applications.
In this paper, we extend previous research and identify major web GIS functions together with
related usability concerns from an information seeking perspective.
3. RESEARCH METHOD
The six web GIS applications selected for this study were Reference USA (RU),
SimplyMap (SM), PolicyMap (PM), Social Explorer (SE), Proquest Statistical Datasets (PQ),
and ESRI Business Analyst Online (BAO). RU offers Google Map based database information
on U.S. and Canadian businesses, employers, and residents. SM, PM and SE enable non-
technical users to create custom maps and reports with focuses on business and marketing (SM),
political science (PM), and current and historical census information (SE). PQ offers a
collection of 17 subjects statistical data in both map and table formats. And ESRI BAO is a
web map-based solution for business site evaluation and market analysis.
These applications were selected based on their prominence among academic
libraries as could be ascertained by reviewing library resource pages. An email was sent to the
business librarian listervs BUSLIB-L (2000 subscribers) and BRASS-L (900 subscribers) in
May 2013 to request feedback on the working list of web GIS databases. These requests
resulted in 18 responses, mostly affirming the list already gathered. The functionality and
usability evaluation discussed here was based on the latest version of the six applications as of
December 2013. For functionality evaluation, we collected product information from vendors
and we documented and ran test cases of all listed functions for each web GIS platform. We
then synthesized and classified the functions available in each application into different
categories for comparison.
Based on the identified GIS functions, we designed four tasks for usability evaluation,
which are commonly used in web GIS platforms and represent a typical workflow of using a
web-based mapping application for users without GIS background. These four tasks include:
(1) create a customized map about a business-related variable for Indianapolis, IN; (2) change
the color and corresponding data range of mapping units on the map; (3) search for another
location (Provo, UT) on the map; and (4) export the map and save it to a local computer.
Seventeen university students were recruited through an advertisement posted on the Purdue
University Libraries website for usability tests. The participants reported extensive experience

3
with Google Maps or similar products but very little experience with other GIS software or web
GIS applications. Response measures of each task include: (1) score of the participant’s
successfulness in completing the task (0 – completed with ease, 1 – completed with difficulty,
and 2 – failed to complete); (2) time to complete; and (3) number of times an error occurred. In
addition, we encouraged participants to “think aloud” and recorded their computer screen
activity and voice using TechSmith Morae software during each test period. A researcher sat
next to participants, answered questions and provided prompts when participants explicitly
requested, and made observation notes about participant behavior. Participants completed the
System Usability Scale (SUS; Brooke, 1996) questionnaire and answered open questions about
their overall experience of each application. At the end of the evaluation, participants ranked
their preferences of the applications they used. Each evaluation session lasted approximately
one hour.
4. RESULTS
Based on the traditional GIS functionality framework, we have identified eight core
web GIS functions by summarizing the detailed function list of the six applications we studied
and the notes from our GIS functionality tests (Table 1). In this section, we discuss the details
of each function and associated usability test results.
TABLE 1
FUNCTIONS OF WEB GIS APPLICATIONS IN LIBRARIES
GIS functionality Details for web GIS
Mapping 1. Basemap availability
2. Legend customization
3. Map elements
4. Map products
Database 5. Information query
6. Location search
7. Reporting
Analysis 8. Selected sets of spatial analysis
4.1 BASEMAP AVAILABILITY
The basemap varied in different web GIS applications from very simple state and
county boundaries in PQ, to multiple choices of street map, imagery, and topography in BAO.
Common basemap information in these applications included state and county boundaries,
major cities, transportation networks, rivers and water bodies, parks, and landmarks. All of the
applications except for RU used Choropleth maps, i.e. areas are shaded in proportion to the
variable values, as the information delivery method. The basic mapping units in these
Choropleth maps included state, county, census tract, and block groups. Three applications
(BAO, SE, and SM) allowed users to turn on and off layers and labels.
To evaluate the basemap usability, we asked participants about their initial
impression of the application and then gave them the task of creating a customized map using a
business-related variable in the Indianapolis, IN area. For their initial impression, users
preferred applications with an easy and clean interface, big upfront map area, and clear starting
point. They liked basemaps with distinguishable colors, or ones familiar from their previous
web map experience, such as the Google Map style. Usability test scores (TABLE 2) indicated
that applications with an easy entry-point had higher task successfulness (e.g., SM), while
applications with overwhelming functions (e.g., BAO) or confusing tool bars (e.g., PM) had
relatively lower task successfulness. Although getting started with maps and utilizing multiple
map options are not a hurdle for GIS professionals, it becomes a design issue for general users.
TABLE 2
DESCRIPTIVE STATISTICS FOR CREATING MAP TASK Application Task Score* Task Time (second) Number of errors
4
Mean SD Min Max Mean SD Min Max Mean SD Min Max
RU 0.2 0.45 0 1 73.3 48.2 22.2 133.7 1.2 0.8 0 2
SM 0.14 0.38 0 1 60.7 27.6 34.5 113.0 1.4 1.3 0 4
PM 0.57 0.53 0 1 80.2 52.5 22.5 165.9 2.1 1.4 0 4
SE 0.29 0.49 0 1 117.9 97.0 25 297.1 3.9 2.9 0 8
PQ 0.13 0.35 0 1 41.6 39.4 9.7 127.0 1.3 1.2 0 3
BAO 0.63 0.74 0 2 126.6 90.7 36.6 305.8 1.8 1.4 0 4
* 0 – completed with ease, 1 – completed with difficulty, and 2 – failed to complete
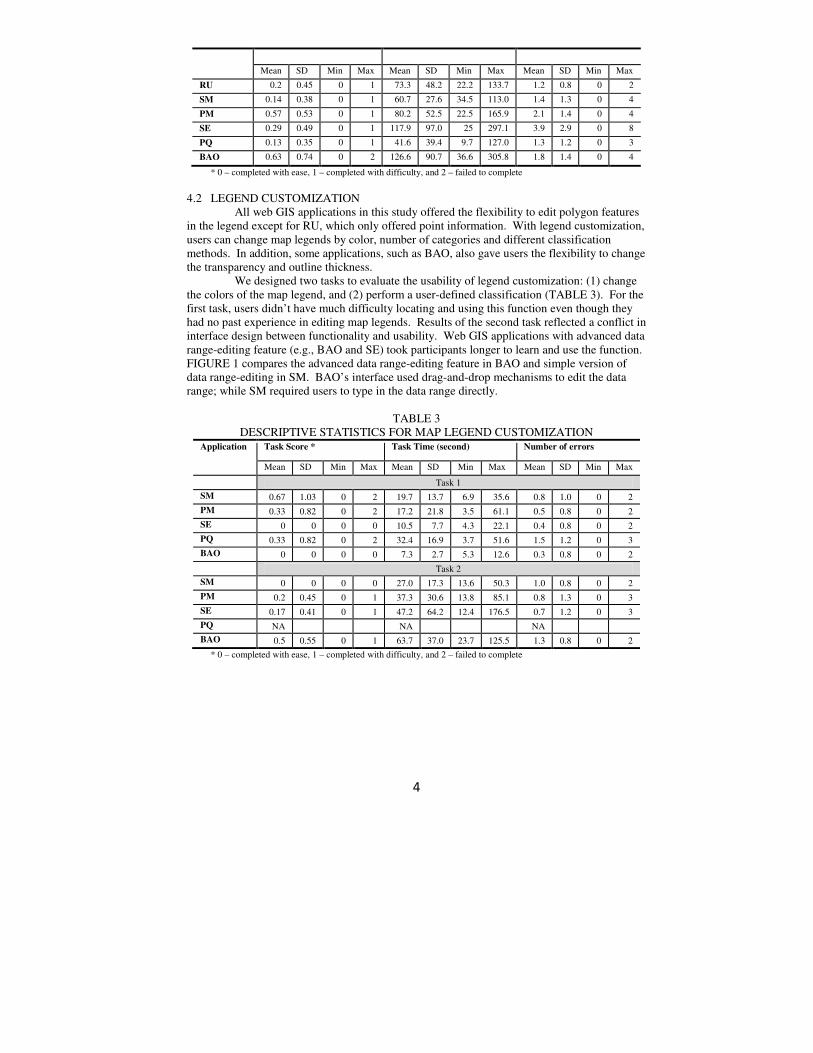
4.2 LEGEND CUSTOMIZATION
All web GIS applications in this study offered the flexibility to edit polygon features
in the legend except for RU, which only offered point information. With legend customization,
users can change map legends by color, number of categories and different classification
methods. In addition, some applications, such as BAO, also gave users the flexibility to change
the transparency and outline thickness.
We designed two tasks to evaluate the usability of legend customization: (1) change
the colors of the map legend, and (2) perform a user-defined classification (TABLE 3). For the
first task, users didn’t have much difficulty locating and using this function even though they
had no past experience in editing map legends. Results of the second task reflected a conflict in
interface design between functionality and usability. Web GIS applications with advanced data
range-editing feature (e.g., BAO and SE) took participants longer to learn and use the function.
FIGURE 1 compares the advanced data range-editing feature in BAO and simple version of
data range-editing in SM. BAO’s interface used drag-and-drop mechanisms to edit the data
range; while SM required users to type in the data range directly.
TABLE 3
DESCRIPTIVE STATISTICS FOR MAP LEGEND CUSTOMIZATION
Application Task Score * Task Time (second) Number of errors
Mean SD Min Max Mean SD Min Max Mean SD Min Max
Task 1
SM 0.67 1.03 0 2 19.7 13.7 6.9 35.6 0.8 1.0 0 2
PM 0.33 0.82 0 2 17.2 21.8 3.5 61.1 0.5 0.8 0 2
SE 0 0 0 0 10.5 7.7 4.3 22.1 0.4 0.8 0 2
PQ 0.33 0.82 0 2 32.4 16.9 3.7 51.6 1.5 1.2 0 3
BAO 0 0 0 0 7.3 2.7 5.3 12.6 0.3 0.8 0 2
Task 2
SM 0 0 0 0 27.0 17.3 13.6 50.3 1.0 0.8 0 2
PM 0.2 0.45 0 1 37.3 30.6 13.8 85.1 0.8 1.3 0 3
SE 0.17 0.41 0 1 47.2 64.2 12.4 176.5 0.7 1.2 0 3
PQ NA
NA
NA
BAO 0.5 0.55 0 1 63.7 37.0 23.7 125.5 1.3 0.8 0 2
* 0 – completed with ease, 1 – completed with difficulty, and 2 – failed to complete

5
FIGURE 1
DATA RANGE-EDITING INTERFACES IN BAO (LEFT) AND SM (RIGHT).
4.3 MAP ELEMENTS
Map elements, such as scale, title, overview map, and north arrow, which are
important in cartographic design, are often neglected in web GIS applications. On the other
hand, new interactive features equivalent to these traditional map elements such as interactive
map zoom and pan are more frequently used owing to the dynamic nature of web maps. All
applications except for PQ had a typical set of interactive zoom modes including zoom lever or
zoom in and out buttons, and mouse wheel zoom. PQ did not use this style because it was
developed using a previous Java-based web GIS technology. Only three applications (SM, SE,
BAO) showed a scale bar, and only SM showed an overview map. None of the applications
had a measuring tool, even though it has been mentioned as a preferred component for web
based mapping (Musser, 1997). During evaluation, we observed that users quickly learned
zooming by mouse wheel and panning by drag and drop. They tended to neglect zoom buttons
for rectangle based zoom and zoom to previous and next view, which are more familiar to GIS
professionals.
4.4 MAP PRODUCTS
The map products in the academic libraries context include three types: save a map,
share a map online, and download a map in graphic format. The save-a-map option is limited
to the same user login. The map URL or option to embed the map into a web page allows users
to share the resulting map online with others even if they do not have access to the application.
The download option allows users to insert the map into their documents, or share with others.
TABLE 4 lists the available map products in each application.
TABLE 4
DELIVERABLE MAP PRODUCTS IN THE SIX SELECTED APPLICATIONS
Application Save map Share map link Downloaded map format
RU N/A N/A JPG, PNG, GIF
SM Yes N/A PNG, JPG, GIF, SVG, PDF, Shapefile
PM Yes Share by link or embed into webpage PDF, PNG, JPG
SE Yes Share by link or embed into webpage PNG, PPT
PQ N/A Generate link with Digital Object Identifier PDF, Shapefile
BAO N/A N/A PDF, JPG
In the usability evaluation, we asked participants to export the map from each
application and save the result to a local computer. The task results (TABLE 5) revealed some

6
design issues in this function. Participants took much longer to download the map in PM,
because the export function is under the button labeled “Print” and most participants expected
this button to physically print the map. Some applications (e.g., BAO and PM) took a
considerable amount of time to generate the PDF file and showed a notification when the file
was ready. Participants tended to ignore the notifications because they were too subtle in the
interface. FIGURE 2 shows the downloadable link notification from BAO. Almost all the
participants ignored the link and clicked the OK button to close the dialog.
TABLE 5
DESCRIPTIVE STATISTICS FOR MAP EXPORT
Application Task Score * Task Time (second) Number of errors
Mean SD Min Max Mean SD Min Max Mean SD Min Max
Reference
USA 0.33 0.71 0 2 45.7 17.8 20.5 71.5 1.3 1.1 0 3
SimplyMap 0.43 0.79 0 2 61.9 35.5 28 128.1 1.4 1.1 0 3
PolicyMap 1 0.82 0 2 96.8 69.7 31.1 186.2 3.4 2.8 0 8
Social
Explorer 0.14 0.38 0 1 39 18.6 21.4 68.2 0.7 1.5 0 4
Proquest 0 0 0 0 29.9 7.2 17.4 38.8 1.1 1.1 0 2
ESRI BAO 0.57 0.79 0 2 70.2 51.9 22.9 177.8 1.7 1.4 0 4
* 0 – completed with ease, 1 – completed with difficulty, and 2 – failed to complete
We observed that the exporting map task poses a design challenge between
customizability and efficiency. Applications with longer map exporting times usually provided
more options to customize the map layout, text, etc., while applications with shorter task times
only generated screenshots of the map. Although current GIS technology may not be able to
significantly reduce the map generation time, a better interface design is needed to notify users
about the generated file and possible additional actions required, such as downloading.
FIGURE 2
DOWNLOADABLE LINK NOTIFICATION IN BAO
4.5 INFORMATION QUERY
All applications in this study had location-based identification function with details
listed in TABLE 6. Traditionally, GIS applications had legacy identification buttons to orient
the user to the location. As more web GIS applications are being developed for general users,
users expect to read map information in a more direct way such as mouse hover or direct click.
Another difference of web GIS applications compared to traditional GIS software is that web
7
GIS applications may not provide interactive tables (e.g., RU, SM, PM, SE). In our usability
evaluation, we asked the participants to take some time to read the map information such as the
value of an interesting map unit. Based on our observation, the map information upon hovering
was extremely helpful for participants in order for them to become familiar with the map and
understand the map information.
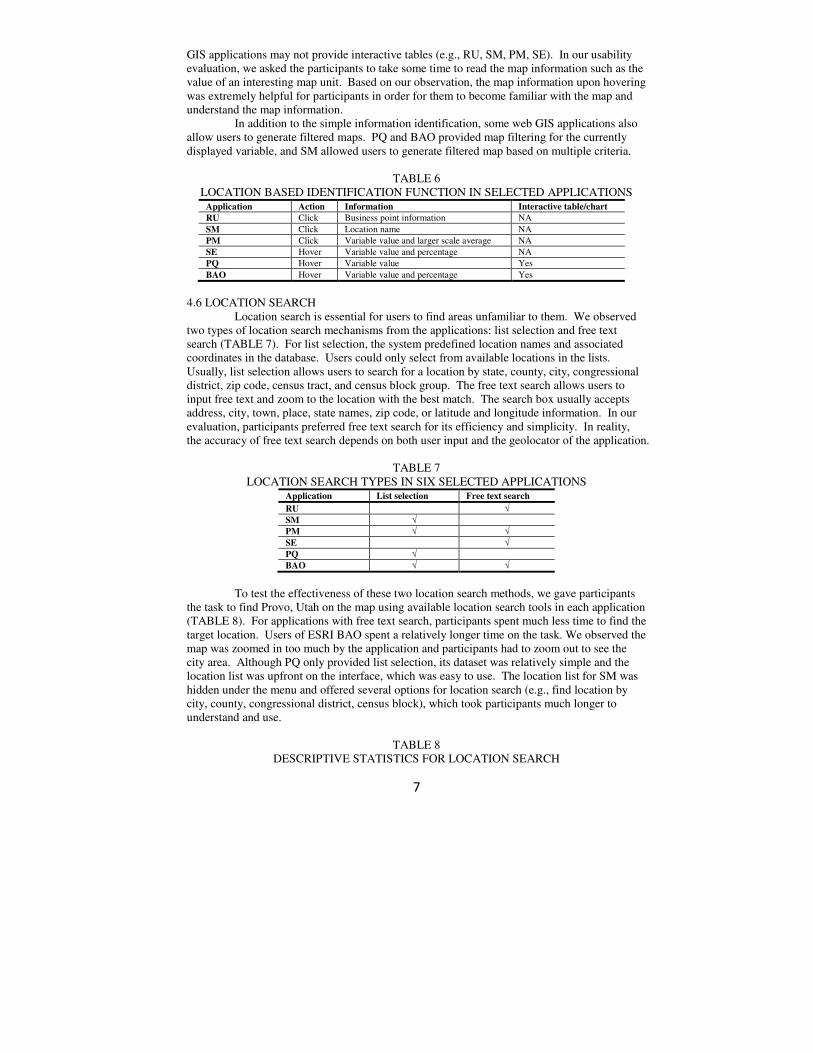
In addition to the simple information identification, some web GIS applications also
allow users to generate filtered maps. PQ and BAO provided map filtering for the currently
displayed variable, and SM allowed users to generate filtered map based on multiple criteria.
TABLE 6
LOCATION BASED IDENTIFICATION FUNCTION IN SELECTED APPLICATIONS
Application Action Information Interactive table/chart
RU Click Business point information NA
SM Click Location name NA
PM Click Variable value and larger scale average NA
SE Hover Variable value and percentage NA
PQ Hover Variable value Yes
BAO Hover Variable value and percentage Yes
4.6 LOCATION SEARCH
Location search is essential for users to find areas unfamiliar to them. We observed
two types of location search mechanisms from the applications: list selection and free text
search (TABLE 7). For list selection, the system predefined location names and associated
coordinates in the database. Users could only select from available locations in the lists.
Usually, list selection allows users to search for a location by state, county, city, congressional
district, zip code, census tract, and census block group. The free text search allows users to
input free text and zoom to the location with the best match. The search box usually accepts
address, city, town, place, state names, zip code, or latitude and longitude information. In our
evaluation, participants preferred free text search for its efficiency and simplicity. In reality,
the accuracy of free text search depends on both user input and the geolocator of the application.
TABLE 7
LOCATION SEARCH TYPES IN SIX SELECTED APPLICATIONS Application List selection Free text search
RU √
SM √
PM √ √
SE √
PQ √
BAO √ √
To test the effectiveness of these two location search methods, we gave participants
the task to find Provo, Utah on the map using available location search tools in each application
(TABLE 8). For applications with free text search, participants spent much less time to find the
target location. Users of ESRI BAO spent a relatively longer time on the task. We observed the
map was zoomed in too much by the application and participants had to zoom out to see the
city area. Although PQ only provided list selection, its dataset was relatively simple and the
location list was upfront on the interface, which was easy to use. The location list for SM was
hidden under the menu and offered several options for location search (e.g., find location by
city, county, congressional district, census block), which took participants much longer to
understand and use.
TABLE 8
DESCRIPTIVE STATISTICS FOR LOCATION SEARCH

8
Application Task Score * Task Time (second) Number of errors
Mean SD Min Max Mean SD Min Max Mean SD Min Max
RU 0 0 0 0 17.4 3 14.1 20.7 0.5 1 0 2
SM 0.5 0.55 0 1 72.5 34.2 31.9 115 2.2 1.3 1 4
PM 0 0 0 0 18 12.4 7.7 38.7 1 1.1 0 3
SE 0 0 0 0 14.9 3 9.9 17.7 0.2 0.5 0 1
PQ 0 0 0 0 12.8 5.5 9.2 19.2 1 1 0 2
BAO 0.17 0.41 0 1 28.7 26 8.5 78.3 1.2 1.2 0 3
* 0 – completed with ease, 1 – completed with difficulty, and 2 – failed to complete
4.7 REPORTING
All six applications had reporting functions that allowed users to select variables and
locations to generate sorted reports. BAO only provided users with reports in PDF format,
while other applications allowed users to download data in CSV, Excel or SAS format for
further analysis in other statistical software. Some applications offered pre-built standard
variable sets for particular topics (e.g., PM), while other applications allowed multiple variable
selection or multiple location comparison (e.g., SM). Since user requirements of the reporting
function depend on the context of use, we did not include report functions in the usability test.
4.8 SPATIAL ANALYSIS
Depending on the intended user groups, some web GIS applications provide spatial
analysis capability. In academic libraries, potential spatial analysis functions include buffer
analysis, map algebra, and heatmaps. A buffer in GIS is a zone around a map feature measured
in units of distance or time, which is usually used for proximity analysis (Sommer & Wade,
2006). In this study, SM, PM and BAO offered Euclidian distance-based buffer analysis
reports. An advanced buffer analysis generated the buffers based on driving distance (BAO).
PQ is the only application in this study that offered map algebra, which allows users to generate
new variables based on the combination or statistics of existing variables. This is a convenient
feature for GIS laypersons to explore the relationships between different spatial variables
without using traditional GIS software. The heatmap function provides an immediate visual
summary of information and allows the viewer to understand complex data sets. In academic
libraries, heatmap visualization is a useful way to summarize the spatial distribution of point
based datasets, if the point information is rich at a large scale. For example, RU generated
heatmaps for business locations if there were more than 300 records shown in the current zoom
level.
Spatial analysis provided by web GIS applications is not limited to the functions we
observed in this study. GIS laypersons may lack understanding of spatial analysis methods.
Depending on potential users’ needs and the nature of the dataset, more spatial analysis
functions could be implemented in web GIS applications. For example, in the academic library
environment, cluster analysis could help users to analyze patterns within the dataset. Web GIS
applications need to be well designed to balance the spatial analysis functions and usability so
that GIS laypersons are not misled or confused when using those functions.
5. DISCUSSION AND CONCLUSION
Of the six selected web GIS applications, we characterized eight common
functionalities and evaluated four of them via usability tests. For the mapping capability, our
results show that a user-friendly web GIS application should offer a clear starting point, a
familiar basemap, and enough flexibility for map customization. In this study, SM has a clear
starting point and easy-to-follow interface, which enabled a higher success rate in the map
creation task during the usability study. Other mapping features such as editing the legend and
exporting a map show a trade-off between functionality and user-friendliness. For database

9
interaction, the usability test results indicate that an easy-to-use web GIS application should
have predictable map and information interaction. Although spatial analysis is an important
part of web GIS application, we were not able to test the usability of various spatial analysis
functions due to its high variability among different applications. Web GIS developers should
take into consideration the experience level and expectations of general users in the application
design phase. It is important to note that some applications were updated with new functions
and interface designs between the times of usability test and when this paper was completed.
For example, PM modified its interface with larger map area and simpler search bar.
The usability evaluation is only based on commonly available GIS functions in the
six selected applications. There are some important aspects of web GIS functions that we could
not fully test due to this limitation. For example, although map measuring tools and overview
maps are mentioned many times in the literature (Cobb & Olivero, 1997; Kidd, 2010), most of
the selected applications did not have those features; further, we cannot test the users’
expectations. Also, some other functions, such as reporting and spatial analysis, vary across
different user cases, and we could not design common tasks to test their usability across
applications.
As the(Chapman & Brothers, 2006) adoption of web GIS increases, users’
experiences and skills may improve accordingly. A consistent design of features and functions
across applications will provide a better user experience in terms of familiarity and learnability.
The functional review and usability concerns we have identified in this study contribute to the
ongoing efforts of addressing the challenge of providing spatial information discovery for
general users of academic libraries and improving the overall user experience of web GIS
applications. As the next steps in our research, we will design user interfaces of web GIS
application based on the major GIS functions and usability concerns identified in this study,
which will serve as spatial information access points for academic library users across
disciplines.
ACKNOWLEDGMENT
We thank Michael Fosmire and Jane Yatcilla for their helpful comments on an earlier version of the manuscript.
6. REFERENCES
Batty, M., Hudson-Smith, A., Milton, R., & Crooks, A. (2010). Map mashups, Web 2.0 and the
GIS revolution. Annals of GIS, 16(1), 1–13. doi:10.1080/19475681003700831
Bennett, T. B., & Nicholson, S. W. (2007). Research Libraries: Connecting Users to Numeric
and Spatial Resources. Social Science Computer Review, 25(3), 302–318.
doi:10.1177/0894439306294466
Brody, R. (1999). Geographic Information Systems: Business Applications and Data. Journal
of Business & Finance Librarianship Geographic Information Systems, 5(1), 3–18.
doi:10.1300/J109v05n01
Brooke, J. (1996). SUS-A Quick and Dirty Usability Scale. In P. W. Jordan, B. Thomas, B. A.
Weerdmeester, & A. L. McClelland (Eds.), Usability Evaluation in Industry. London:
Taylor & Francis.
Chapman, K., & Brothers, P. (2006). Database Coverage for Research in Management
Information Systems. College & Research Libraries, 67(1), 50–62.
10
Chow, T. E. (2008). The Potential of Maps APIs for Internet GIS Applications. Transactions in
GIS, 12(2), 179–191. doi:10.1111/j.1467-9671.2008.01094.x
Cobb, D. A., & Olivero, A. (1997). Online GIS service. The Journal of Academic Librarianship,
23(6), 484–497.
Crampton, J. W. (2009). Cartography: maps 2.0. Progress in Human Geography, 33(1), 91–100.
doi:10.1177/0309132508094074
Goodchild, M. F. (1987). Towards an enumeration and classification of GIS functions. Proc.
Int. GIS Symposium. Retrieved from http://www.geog.ucsb.edu/~good/papers/104.pdf
Haklay, M., Singleton, A., & Parker, C. (2008). Web Mapping 2.0: The Neogeography of the
GeoWeb. Geography Compass, 2(6), 2011–2039. doi:10.1111/j.1749-
8198.2008.00167.x
Kidd, J. C. (2010). Web-based mapping: an evaluation of free mapping applications and web
GIS for library reference services. University of North Carolina at Chapel Hill.
Retrieved from https://cdr.lib.unc.edu/indexablecontent?id=uuid:f64751da-cb95-47aa-
8d4f-3ec5338420af&ds=DATA_FILE
Kim, D.-H., & Kim, M.-S. (2002). Web GIS service component based on open environment. In
IEEE International Geoscience and Remote Sensing Symposium (Vol. 6, pp. 3346–3348).
IEEE. doi:10.1109/IGARSS.2002.1027178
Kraak, M.-J. (2004). The role of the map in a Web-GIS environment. Journal of Geographical
Systems, 6(2), 83–93. doi:10.1007/s10109-004-0127-2
Lu, X. (2005). An investigation on service-oriented architecture for constructing distributed
Web GIS application. In 2005 IEEE International Conference on Services Computing
(SCC’05) Vol-1 (Vol. 1, pp. 191–197 vol.1). IEEE. doi:10.1109/SCC.2005.27
Maguire, D., & Dangermond, J. (1991). The functionality of GIS. In Geographical Information
Systems: Principles and Applications (pp. 319–335).
Maguire, D. J., Goodchild, M. F., & Rhinds, D. (1991). An overview and definition of GIS. In
Geographical Information Systems: Principles and Applications (pp. 9–20).
Musser, K. (1997). Interactive mapping on the world wide web. Oregon State University.
Retrieved from
http://scholarsarchive.library.oregonstate.edu/xmlui/bitstream/handle/1957/31260/Musse
rKarl.pdf?sequence=1
Newman, G., Zimmerman, D., Crall, A., Laituri, M., Graham, J., & Stapel, L. (2010). User-
friendly web mapping: lessons from a citizen science website. International Journal of
Geographical Information Science, 24(12), 1851–1869.
doi:10.1080/13658816.2010.490532

11
Nivala, A.-M., Brewster, S., & Sarjakoski, T. L. (2008). Usability Evaluation of Web Mapping
Sites. Cartographic Journal, The, 45(2), 129–138. doi:10.1179/174327708X305120
OGC. (2013). OGC Standards. Open Geospatial Consortium. Retrieved October 09, 2013,
from http://www.opengeospatial.org/standards/is
Sommer, S., & Wade, T. (2006). A to Z GIS: An Illustrated Dictionary of Geographic
Information Systems. Esri Press. Retrieved July 30, 2014, from
http://store.esri.com/esri/showdetl.cfm?SID=2&Product_ID=868&Category_ID=49
Weessies, K. W., & Dotson, D. S. (2013). Mapping for the Masses : GIS Lite and Online
Mapping Tools in Academic Libraries. Information Technology and Libraries, 32(1),
23–35.
You, M., Chen, C., Liu, H., & Lin, H. (2007). A Usability Evaluation of Web Map Zoom and
Pan Functions. International Journal of Design, 1(1), 15–25.
Top Related