


Languages
Pages
Legal


Evaluation of Environmental Status Reports
Prepared by Maharashtra Pollution Control Board
Evaluation of Environmental Status Reports of Cities in Maharashtra
June 2009
Prepared by
Maharashtra Pollution Control Board

Evaluation of Environmental Status Reports
Prepared by Maharashtra Pollution Control Board
Maharashtra Pollution Control Board
Kalpa Taru Point, 3rd and 4th floor,
Opp. Cine Planet,Sion Circle,
Mumbai-400 022.
Telephone - 022-24020781/24014701/24010437
Fax - 022-24024068
Web Address- www.mpcb.gov.in
Emails - [email protected] , [email protected]

Evaluation of Environmental Status Reports
Prepared by Maharashtra Pollution Control Board
Foreword
Cities in Maharashtra have been publishing Environmental Status Report (ESR) for last 12 years. These ESRs discuss the state of various natural resources and urban services and the environmental issues faced by respective cities.
In order that the ESRs emerge as a more comprehensive document and play a better role in aligning developmental policies with environment, MPCB has proposed an indicator based framework.
This framework of indicators follows the international practice with adaption to Indian cities. A quantitative approach is incorporated to allow an objective comparison between cities on their environmental performance as well as assess trends. A Microsoft Excel TM Model is developed to assist in the comparison.
The proposed framework is applied to ESRs of various cities in Maharashtra. Observation and experience of this application is enunciated in this report with specific recommendations.
The report concludes with strategies on how to strengthen the quality and use of ESRs for action planning and provides guidance on how to prepare ESRs as well as way ahead.

Evaluation of Environmental Status Reports
Prepared by Maharashtra Pollution Control Board
Acknowledgements
MPCB acknowledges the efforts of Environmental Management Centre towards developing the Indicator Framework and analysing the ESRs for various cities in Maharashtra.

Evaluation of Environmental Status Reports
Prepared by Maharashtra Pollution Control Board i
Table of Contents
Executive summary…………………………………………………..…(i)- (xix)
1 Background of the ESR Evaluation project .................................................... 1 1.1 Objectives of the project .......................................................................... 3 1.2 Purpose of this report ............................................................................... 3
2 Background of ESR ........................................................................................ 4 2.1 What is ESR? ........................................................................................... 4
2.1.1 Purpose of ESRs ............................................................................... 5 2.1.2 What are the basic requirements of ESRs......................................... 6 2.1.3 How did ESR framework evolve ...................................................... 6
3 ESRs for Indian Cities .................................................................................. 12 3.1 Environmental Reporting Initiatives in India......................................... 12 3.2 Introduction of ESR in India with 74th amendment to constitution ....... 13 3.3 Opportunities for ESR............................................................................ 15
4 Indicator Framework for ESRs ..................................................................... 17 4.1 Index based approach for assessing city environment ........................... 17
4.1.1 Advantages of Index Based Approach for SoE Reporting ............. 17 4.1.2 What are indicators? ....................................................................... 17
4.2 Indicator Frameworks at global level and in India................................. 21 4.3 Indicator programmes in India ............................................................... 22
5 Proposed Indicator framework...................................................................... 25 5.1 Methodology .......................................................................................... 26 5.2 The evaluation framework ..................................................................... 27 5.3 Scheme of Scoring and weights ............................................................. 29 5.4 Thematic indicators ................................................................................ 34
5.4.1 Growth of the cities:........................................................................ 34 5.4.2 State of resources ............................................................................ 37 5.4.3 Urban Services ................................................................................ 41 5.4.4 Initiatives for improving city environment ..................................... 46
5.5 Microsoft Excel™ model for scoring..................................................... 47 6 Application of the Indicator framework to the cities in Maharashtra........... 51
6.1 Pilot application for Pune and Mumbai.................................................. 52 6.2 Observations from analysis .................................................................... 56

Evaluation of Environmental Status Reports
Prepared by Maharashtra Pollution Control Board
6.2.1 Pune................................................................................................. 56 6.2.2 BrihanMumbai ................................................................................ 59
6.3 Application to other cities ...................................................................... 60 7 Conclusion & Recommendations ................................................................. 66
7.1 Standardization of ESR format .............................................................. 67 7.1.1 Follow standardized data flow and representation.......................... 67 7.1.2 Improve on spatial representation................................................... 69 7.1.3 Use Indicator Framework ............................................................... 70 7.1.4 Use ESR to reflect on Global Issues – GHG Emissions................. 71 7.1.5 Ensure Linkages to add Value, maintain Consistency and avoid
duplication....................................................................................... 71 7.2 Stakeholders’ Involvement..................................................................... 72
7.2.1 Follow a Stakeholder Consultative Process to Prepare and Share ESR ................................................................................................. 72
7.2.2 Consider Internet as an Effective Platform for Building and Sharing of ESRs ........................................................................................... 74
7.3 Linking ESR preparation to Strategic Planning ..................................... 74 7.4 Key Action Points .................................................................................. 76

Evaluation of Environmental Status Reports
Prepared by Maharashtra Pollution Control Board
List of Annexes
Annex I. Indicators framework for this project ................................................. 78 Annex II. Urban Services Environmental Rating System (USERS)............... 84 Annex III. UIPMP of City Managers’ Association–Gujarat Indicators ........... 87 Annex IV. Environmental Reporting across Globe .......................................... 91 Annex V. Environment Reporting in India ..................................................... 95 Annex VI. Indicator programmes of global reach .......................................... 102 Annex VII. Data Sources ................................................................................. 109 Annex VIII. Ekovoices .................................................................................. 114 Annex IX. Model Table of Contents .............................................................. 116

Evaluation of Environmental Status Reports
Prepared by Maharashtra Pollution Control Board
List of Tables
Table 2-1: SoE Reporting ....................................................................................... 4 Table 2-2: Purpose of ESRs for intended stakeholders .......................................... 6 Table 3-1: ESR initiatives in India........................................................................ 12 Table 4-1: Types of indicators .............................................................................. 20 Table 4-2: Type of Indicator programmes ............................................................ 21 5-1: Indicator framework ...................................................................................... 27 Table 5-2: Initial Weights for Thematic Indicators .............................................. 29 Table 5-3: Scoring Scheme................................................................................... 30 Table 5-4: Weights of themes and parameters...................................................... 31 Table 5-5: Excel model for scoring ...................................................................... 33 Table 5-6: Growth of cities ................................................................................... 34 Table 5-7: Scoring-Demographic Growth ............................................................ 35 Table 5-8: Scoring- Economic Growth................................................................. 35 Table 5-9: Scoring-Industrial Growth................................................................... 36 Table 5-10: Scoring- Spatial Growth.................................................................... 37 Table 5-11: State of resources............................................................................... 38 Table 5-12: Scoring-Land ..................................................................................... 38 Table 5-13: Scoring-Air........................................................................................ 39 Table 5-14: Scoring-Water quality ....................................................................... 40 Table 5-15: Scoring-Energy.................................................................................. 40 Table 5-16: Score-Humans ................................................................................... 41 Table 5-17: Urban Services .................................................................................. 41 Table 5-18: Scoring-Water Supply ....................................................................... 42 Table 5-19: Scoring-Sewerage and sanitation ...................................................... 43 Table 5-20: Compliance with MSW rules ............................................................ 44 Table 5-21: Scoring- Solid Waste Management................................................... 45 Table 5-22: Scoring- Transportation..................................................................... 46 Table 5-23: Yes/No type questions....................................................................... 46 Table 6-1: ESRs Reviewed ................................................................................... 51 Table 6-2: Core Indicators .................................................................................... 52 Table 6-3: Data Availability for Mumbai ............................................................. 53 Table 6-4: Data Availability for Pune................................................................... 54 Table 6-5: Solid waste chapter in ESR 2005-06 and 2006-07.............................. 56 Table 6-6: Fuel consumption data from Pune ESR 2004-05 and 2005-06 ........... 58 Table 7-1: Data collection for ESRs ..................................................................... 67

Evaluation of Environmental Status Reports
Prepared by Maharashtra Pollution Control Board
List of Figures
Figure 2-1: DPSIR Framework............................................................................... 9 Figure 4-1: Collection of data and its interpretation............................................. 18 Figure 4-2: Typical functions of Indicators .......................................................... 20 Figure 5-1: Methodology for developing indicator framework for assessment of ESRs...................................................................................................................... 26 Figure 5-2: Levels of Indicators............................................................................ 27 Figure 5-3: Thematic and Preliminary Indicators................................................. 28 Figure 5-4: Main Menu for the Microsoft Excel Model for scoring..................... 49 Figure 5-5: Data Input sheet for scoring ............................................................... 50 Figure 6-1: ESRs reviewed ................................................................................... 51 Figure 6-2: Star diagrams for the thematic indicators-Pune ................................. 55 Figure 6-3: Star diagrams for the thematic indicators-Mumbai............................ 55 Figure 6-4: Data availability- Growth of cities..................................................... 62 Figure 6-5: Data availability- State of Resources ................................................. 62 Figure 6-6: Data availability- Urban Services ...................................................... 63 Figure 6-7: City wise data availability.................................................................. 63 Figure 7-1: Interventions to improve ESR Performance ...................................... 67 Figure 7-2: Data representation in ESRs .............................................................. 69 Figure 7-3: The digitized information of the Pune City and surroundings with Hospitals labelled.................................................................................................. 70 Figure 7-4: Aligning the environmental reporting initiatives ............................... 71 Figure 7-5: Team composition for preparation of ESR ........................................ 72 Figure 7-6: ESR Preparation Process.................................................................... 73 Figure 7-7: Linking ESR preparation to Strategic Planning................................. 75

Evaluation of Environmental Status Reports
Prepared by Maharashtra Pollution Control Board
List of Boxes
Box 1-1 Environmental Issues in cities of Maharashtra ......................................... 1 Box 2-1: Environmental Media Framework ........................................................... 7 Box 2-2: Environmental Issues Framework ........................................................... 8 Box 2-3: Sector Framework.................................................................................... 8 Box 2-4: Environmental Process Framework ......................................................... 9 Box 2-5 About the DPSIR Framework................................................................. 10 Box 3-1: Table of Contents of Brihan Mumbai ESR 1998-99 ............................. 14 Box 4-1: Data and its interpretation...................................................................... 18 Box 7-1: use of GIS developing health care facility............................................. 69

Evaluation of Environmental Status Reports
Prepared by Maharashtra Pollution Control Board
List of abbreviations
ADB Asian Development Bank
CBPM Community Based Performance Monitoring
CDI City Development Index
CETP Common Effluent Treatment Plant
CEROI City Environmental Reports on the Internet
CMA-G City Managers’ Association-Gujarat
CPCB Central Pollution Control Board
CPHEEO Central Public Health and Environmental Engineering Organization
CRC Citizen Report Card
CSC Citizen Score Card
DPSIR Driving Forces- Pressures-State of Environment- Impacts- Response
ESR Environmental Status Report
EMC Environmental Management Centre
EPI Environmental Performance Index
EIA Environmental Impact Assessment
FCM Federation of Canadian Municipalities
GDP Gross Domestic Product
GEO Global Environmental Outlook
GIS Geographic Information System
GNP Gross National Product
IGIDR Indira Gandhi Institute for Developmental Research
ICLEI International Center for Local Environmental Initiatives
ICMA International City Managers’ Association

Evaluation of Environmental Status Reports
Prepared by Maharashtra Pollution Control Board
LPCD Liters Per Capita per Day
MDG Millennium Development Goals
MDI Multilateral Development Institutions
MEA Ministry of External Affairs
MEDA Maharashtra Energy Development Association
MMRDA Mumbai Metropolitan Region Development Authority
MoEF Ministry of Environment and Forest
MoUD Ministry of Urban Development
MPCB Maharashtra Pollution Control Board
MSW Municipal Solid Waste
NGO Non Governmental Organization
NATMO National Atlas and Thematic Mapping Organization
PSR Framework Pressure- State- Response Framework
PAC Public Affairs Centre
QOLRS Quality of Life Reporting System
RRC.AP (UNEP) Regional Resource Centre for Asia and the Pacific
SoE State of Environment
TERI The Energy Research Institute
ToC Table of Contents
TOR Terms of Reference
UCLG United Cities and Local Governments
UDPFI Urban Development Plans Formulation and Implementation
UIPMP Urban Indicators and Performance Measurement Programme
ULB Urban Local Body
UNEP United Nations Environment Programme

Evaluation of Environmental Status Reports
Prepared by Maharashtra Pollution Control Board
USERS Urban Services Environmental Rating System
WB World Bank
WSSD World Summit for Sustainable Development

Evaluation of Environmental Status Reports
Prepared by Maharashtra Pollution Control Board i
Evaluation of Environmental Status Reports of cities of Maharashtra
Executive summary
I. Background of the project
1. Increasing Urbanization: In current milieu of increasing urbanization more than half of world's population is living in cities and towns. Nearly 28% of India's population (285 million) lives in urban areas as per 2001 census. The percentage decadal growth of population in rural and urban areas during the decade is 17.9% and 31.2 % respectively. It is important to note that the contribution of urban sector to Gross Domestic Product (GDP) is currently expected to be in the range of 50-60 percent. Increased urbanization seen today is a result of this overall growth
2. State of Maharashtra: Maharashtra occupies a position of prominence in India. Maharashtra has been in the forefront of economic development and is often called the economic powerhouse of the country. With its proactive policies, the State continues to occupy the dominant position amongst the industrially advanced States in India. Economy of Maharashtra has been growing at the rate of 8%.
3. Urban environmental issues: However this growth is exerting tremendous pressure on the natural resources and urban services. Loss of green cover, deteriorating air quality, polluted water resources, problem of solid waste in urban areas, inequitable distribution of urban services, problem of urban poor, regional disparity are some of the environmental issues common in the State.
4. In India there have been several recent initiatives to steer sustainable development in urban areas. The 74th Amendment to the constitution has enlarged the roles and responsibilities of municipalities, specifically citing protection of the environment and promotion of ecological aspects.
5. Environmental Status Report (ESR): According to the municipal legislations, the Urban Local Bodies (ULBs) in Class I cities are required to publish an annual Environmental Status Report (ESR) which will indicate the status of environment management in the city and identify the areas where mitigation measures are required to be considered. The ESRs are submitted to Ministry of Urban Development (MoUD) and follow Mumbai Metropolitan Region Development Authority (MMRDA) guidelines for preparation.

Evaluation of Environmental Status Reports
Prepared by Maharashtra Pollution Control Board ii
6. Maharashtra is the State that has been publishing ESRs for last 12 years. These ESRs discuss the state of various natural resources and urban services and the environmental issues faced by the city. As a result of weak analytical framework and inconsistent data, the effort has remained only till compiling information on various environmental issues with ESRs having little role to play in action planning.
7. ESR data can be used to assess the environmental performance of the cities. ESR also can play a key role in mainstreaming environmental considerations in development policies. Since it is a document produced by the ULBs, it can trigger action at the city level. ESR it is a document which is published for citizens. If outreach of ESR is increased; then it will increase the awareness among citizens about the environmental issues and encourage public participation.
8. The Evaluation of ESRs Project: Maharashtra Pollution Control Board (MPCB) implements various environmental legislations in the State of Maharashtra. With a view of capturing wider spectrum of opportunities, MPCB proposed to develop an assessment framework for ESRs based on Indicators. Cities could be rated against each other according to this Indicator framework. ESRs developed on this basis can generate public debate and awareness about ‘green’ and sustainable cities and engender healthy competition amongst leading cities.
9. Objective of the project: Objective of the project was first to understand where ESRs stand as compared to global standards and then to develop environmental performance indicators for cities in State of Maharashtra. Secondly the project aimed to evolve a common format for the ESR along with a framework of indicators so as to allow assessment of environmental performance of cities.
10. Contents of the report:
Background of the project is explained in Chapter 1. Chapter 2 introduces State of Environment Reporting (SoE Reporting). Chapter 3 focuses on Environment Reporting initiatives in India. Index based approach for assessing city environment is discussed in Chapter 4. Indicator framework developed for cities in Maharashtra is presented in Chapter 5. Results of pilot application to Pune and Mumbai are presented in Chapter 6. Chapter 6 further discusses application of the framework to 12 other cities. Chapter 7 lists recommendations for improving quality of ESRs.
II. Background of ESRs
11. Local agenda 21 mandate for ESRs: Looking at the history of environmental reporting it can be said that formal environmental reporting finds its roots in the

Evaluation of Environmental Status Reports
Prepared by Maharashtra Pollution Control Board iii
Local Agenda 21 mandate that was passed in the Earth Summit of 1990 in Rio. Some initial attempts of environmental reporting are seen prior to the Summit. Under this mandate, ULBs required to undertake the preparation and publication of an ESR or equivalent. The ESR was expected to list city’s environmental concerns, growth factors and the overall environmental degradation and improvements. This data is often analysed to show trends of environmental pollution, impacts of growth and possible environmental action planning in the city.
12. State of Environment Reporting (SoE): ESR is one of the terminologies used for SoE. Different regions across the world use varying terminologies to characterize their respective SoEs. Each type of SoE may have its own distinct characteristics. Some of the other forms are: Global Environmental Outlook, Environment Monitors, Environmental Atlas, Sustainability Report etc.
13. SoEs can be further categorized based on the scale or level of the scope of SoE reporting, namely: Global or Regional level, Country and State Level, City Level, Corporate Level and Community Level.
14. ESR is one of the forms of SoE Reporting. Primary functions of SoE frameworks are to categorize the information giving report a structure, allow effective understanding of complexities and interlinkages between environmental issues and causes. There have been several frameworks tried and tested. Following four frameworks are commonly used. These frameworks are defined on the basis of how the information is structured.
Environmental media framework: Here information is categorized based on the environmental media like air water etc.
Environmental issues framework: In this case information is categorized based on the environmental issues like waste disposal, land degradation etc.
Sector framework: Here information is categorized based on various sectors like agriculture, tourism, forestry etc.
Environmental process framework: In this type of framework, reporting is based on the interplay of causation factors and their subsequent impacts on the environmental resources, covering cross sectoral themes. This framework uses the Pressure-State-Response (PSR) indicators to gauge the impact of human activities on the physical and biological processes of the ecosystem. This framework concentrates on reporting the dynamic ecosystem relationships reflecting both cause and effects.
15. DPSIR Framework: The Driving Force-Pressure-State-Impact-Response (DPSIR) approach is an off-shoot of the PSR framework. The DPSIR framework concentrates on reporting the dynamic ecosystem relationships reflecting both

Evaluation of Environmental Status Reports
Prepared by Maharashtra Pollution Control Board iv
cause and effects and is thus able to reflect the complexity of environmental dynamics
16. In India, SoEs are published at National, State, Regional and City level.
17. UNEP India SoE 2001: At national level State of Environment Report of India was prepared to be a part of Global State of the Environment Report in 2002 (Global Environmental Outlook-3) for the 2002 Earth Summit i.e., Rio + 10. The SoE followed the DPSIR framework coupled with Environmental Issues framework.
18. State level SoE Reports: In India 29 States and 5 Union Territories have attempted State level SoEs. Ministry of Environment and Forest (MoEF) has recommended DPSIR framework for National and State level SoEs. However this framework is not followed in the city level ESRs.
19. Regional ESRs of MPCB: MPCB has 11 regional offices all over Maharashtra. These offices prepare ESRs every year. These ESRs are prepared as a base document for preparation of State level SoE Report. These ESRs follow environmental media framework.
20. City Level ESRs: For city level ESRs in India, the Ministry of Urban Development (MoUD) is the nodal agency that mandates the creation of ESRs. Publication of ESRs is mandatory for all the municipal corporations in Maharashtra. Approximately 60% of the municipalities comply with this requirement. The city ESRs are typically based on environmental media framework but again not following this style on consistent basis.
21. Issues related to coherence and co-ordination: Though there have been various attempts of SoE Reporting at different levels, there is little relation of one with the other. At every level; objectives, scope, content, structure and process for preparation of report vary widely including the sources of data. Also priorities and issues at National and State level are not reflected for taking action at various levels.
22. Use of City ESRs: In this perspective the biggest advantage of City level ESR is that it is a document produced at local level and addresses the local issues. ESR can play a key role in mainstreaming environment into policy making. While addressing the global issues (like climate change), effort started at the top level often gets diluted when actions are to be taken at local level i.e. ULBs. ESRs can help align local actions with global issues. ESR is a document published for the

Evaluation of Environmental Status Reports
Prepared by Maharashtra Pollution Control Board v
citizens to get educated about the environment. Thus with reach of ESRs increased it can increase the awareness levels of the citizens in turn increasing their participation. ESRs can give important inputs for National level urban infrastructure projects like Jawaharlal Nehru National Urban Renewal Mission (JNNURM). They can also serve as key documents while rating the infrastructure and carrying out environmental assessment for Multilateral Development Institutions (MDI).
III. Indicator Framework for ESRs
23. The analytical framework of the ESR should assist in drawing meaningful inferences and guide responses towards environment protection and improvement in the city. The framework should be able to transcend from the understanding of the Impacts of the driving forces and pressures on the state of the environment and provide a logical decision making structure for responses to planners and policy makers.
24. The stepwise approach in the DPSIR framework allows this to a certain extent, but additional analytical interventions are found necessary to translate the ‘D-P-S-I’ into the ‘R’. (Driving Forces-Pressures-State-Impact to Response). This can be achieved through application of indicators.
25. ESRs not being able to translate the data into concrete actions taken for improvement can be attributed to the report form of ESR. Indicators in such case prove to be more efficient analytical tool.
26. Framework of Indicators: Indicators can provide crucial guidance for decision- making in a variety of ways. They can translate knowledge on physical and social science into manageable units of information that can facilitate the decision- making process. Indicators also can help to measure and calibrate progress towards sustainable development goals.
27. There have been several attempts to develop indicators that would apply to cities, either at National, Regional, or International levels. Few of these initiatives have been successful but many have failed because of exhaustive information needs that are deficit to meet at local level.
28. In India there are no formal models or frameworks of indicators that are used to assess the environmental performance of cities. Credit rating agencies have rated municipal bond issues, and to a limited extent have looked at the finances of municipalities they have rated. The Energy and Resources Institute (TERI) and City Managers’ Association-Gujarat (CMA-G) proposed models, the former for

Evaluation of Environmental Status Reports
Prepared by Maharashtra Pollution Control Board vi
Review of existing ESRs
Review of other environment reporting systems
Application to pilot study of selected cities
Getting feedback from stakeholders like municipal civil societies & CBOs, citizens of the cities etc
Preparation of the draft report
Preparation of final report
Developing framework for indicators
Based on DPSIR Framework
Recommendations for strengthening of ESRs
Applied to Pune & Mumbai
Review of various indicator programmes
the more limited purpose of assessing the environmental compliance of municipalities in the performance of their tasks.
IV. Proposed Indicator framework
29. As stated earlier the purpose of developing indicator framework for cities in Mahara+shtra was to assess their
environmental performance against common platform and to assess the quality of ESRs published by cities in Maharashtra.
30. After studying these frameworks of indicators a framework has been developed based on D-P-S-I-R framework. Figure-1 illustrates the methodology adopted.
Figure1. Methodology
31. Four levels of indicators. Indicator framework has been developed with four levels of indicators. Figure-2 explains pyramidal structure of the framework. At the base of the indicator pyramid are the data variables. The data variables are translated to preliminary indicators under various thematic groups. All the preliminary indicator under same theme add up to give scores of thematic indicators. Adding up score of thematic indicators finally give the apex score, i.e. the Environmental Performance Index (EPI).

Evaluation of Environmental Status Reports
Prepared by Maharashtra Pollution Control Board vii
Thematic Indicators (4 Nos)
Environmental Performance
Index
Preliminary Indicators (17 Nos)
Data variables (65 Nos)
Figure2. Levels of Indicators
32. The scoring is done in such a way that maximum of the score will show the best environmental performance of the city. Following methodology was used to derive the score.
33. These weights were defined as per the contribution of that theme into city environment. Weightages of all the four themes sum up to 100. Table-1 gives the initial weightages. E.g. state of natural resources is the most critical in the city environment. Thus it has been given highest weightage. Themes were assigned weight according to their importance.
Table1. Initial Weights for Thematic Indicators
Sr. No Thematic Indicators Weight
1 Growth of Cities 25
2 State of Resources 30
3 State of Urban services 25
4 Initiatives for improving city environment
20
Total 100
34. Data variables of all the preliminary indicators under same theme were assigned weight such that they sum up to 100. These weights of data variables were then adjusted for number of total data variables in particular theme. This was done using following formula.
Adjusted data variable weight = (Data variable weight x number of data variables under that theme) / Total number of data variables

Evaluation of Environmental Status Reports
Prepared by Maharashtra Pollution Control Board viii
35. The sum of adjusted weights of all the data variables under one theme now defined the adjusted weight for that theme. Since there are total 65 data variables and 11 data variables under theme of Growth of Cities the formula becomes
Adjusted data variable weight = (Data variable weight x 11) / 65
36. The revised weights for thematic indicators are shown in Figure-3.
Environmental Performance Index
Growth of cities (16.92)
State of resources (21.54)
Urban services (30.77)
Initiatives for improving city environment (30.77)
Demographic growth
Economic growth
Industrial growth
Spatial growth
Land
Air
Water
Energy
Water supply
Sewerage sanitation
Solid waste management
Transport
Primary indicators for diagnostic and action planning
Thematic Indicators
Humans
Environmental education
(Weights of the thematic indicators is mentioned next to them.)
All the
prelim
inary indicators under them
e add up
to 100
Waste Management
Slum Improvement
Traffic
Figure3. Weightages of thematic indicators
37. Scoring Scheme: To allow scoring Benchmarks were defined for each data variable. These benchmarks were completed using various sources of information from literature. For all the data related to the demography, benchmarks are defined by using Census figures for State and Country. For all the data variables related to natural resources the benchmark values have been defined using standards defined by various agencies like MPCB, Central Pollution Control Board (CPCB), Urban Development Plans Formulation and Implementation (UDPFI) Guidelines, Central Public Health and Environmental Engineering Organization (CPHEEO) etc. for the variables related to urban services the benchmarks are defined by referring to various studies conducted. E.g. studies by agencies like Asian Development Bank (ADB), Maharashtra Energy Development Agency (MEDA) etc. The data for which benchmarks were not available; E.g. Percentage of slum area to city area or annual fuel consumption of the city; intercity comparison was used to arrive at working level benchmarks.
38. The benchmark values are selected as the average score values. Scoring of the variable against benchmark is dependent upon whether that variable is pro environment. For all the pro environment variables higher the value than benchmark, better is the score and vice versa.

Evaluation of Environmental Status Reports
Prepared by Maharashtra Pollution Control Board ix
39. As stated earlier, score of the preliminary indicator is sum of weighted scores of all the data variables within it. Score of the thematic indicators is the sum of scores of all the preliminary indicators within it. This apex score i.e. EPI is given by summing up weighted scores of all the thematic indicators.
40. Microsoft Excel™ model: An excel model is developed for scoring. The values for different data variables from ESRs when entered in the excel model, gives the score for the indicators.
41. Unfortunately not all the data is available in ESRs. Hence the excel model was developed in such a way that if on a data variable is not available then its weight is distributed amongst other data variables in the proportion of its own weight. This scheme of adjustment is explained in the indicator framework.
V. Application of Indicator Framework
42. Indicator framework described in Figure-3 was applied to 14 other cities in Maharashtra. Too many data gaps were observed while applying the indicator framework to these cities. Thus for cities except Pune and Mumbai, the framework was applied in a checklist form to understand the data availability. Since such unavailable data will cause a skewed score, EPI has been calculated only for Pune and Mumbai.
43. Pilot application for Pune and Mumbai: Total Six ESRs of Pune (From year 2001-02 to 2006-07) and Five ESRs from Mumbai (Year 2002-02 to 2006-07) were reviewed. Result of apex score i.e. EPI as well as the thematic scores are presented in Figure-4 and Figure-5.
44. In order to compare the scores of the two or more cities and of two or more years, it is necessary that the data available is of the same degree; only then the scores will be compatible to compare with each other.
45. Inconsistent data in case of pilot application of framework to Pune and Mumbai did not allow intercity temporal comparison of the scores. In order to compare the scores cities have to report at least a limited number of indicators consistently. These indicators have been listed as Core Indicators in Table-2.
Table2. Core Indicators
Thematic Indicators Preliminary Indicators Data variables
Demographic growth (% 2001) Population growth rate Growth of cities
Economic growth Work participation ratio

Evaluation of Environmental Status Reports
Prepared by Maharashtra Pollution Control Board x
Spatial growth (Decadal) Population density
Land Landuse
Ambient air quallity Air
Water quality- River
Per capita energy consumption
State of natural resources
Energy
Infant mortality rate
Net LPCD
% of households connected by service connection
% of population catered to by underground sewer network
Water Supply
% of untreated sewage
Total SW generated
Life of landfill site
Urban Services
Solid Waste Mgmt
% of population travelling by public transport
46. Instead of calculating the Index with available data, better approach would be collecting the data in the format required for calculating the Index. This will in turn standardize the data format.
47. Large variation in the scores of consecutive years shows the inconsistency in data. Inconsistency in data is illustrated in Table-3 and Table-4. Out of total 65 data variables data for only 6 data variables was available in ESRs of Mumbai for year 2002-2007. In case of Pune consistent data was available only for 3 data variables out of 65.
Table3. Data Availability for Mumbai
2002-03 2003-04 2004-05 2005-06 2006-07

Evaluation of Environmental Status Reports
Prepared by Maharashtra Pollution Control Board xi
Population Growth Rate 20.1 20 20.6 20.6 20.6
% of slum population to total population 55 60 60 60 60
Population Density 27250 43583 43583 43583 43583
Crude Death Rate 6.89 7.1 6.8 6.8 6.89
Average tariff for water supply 3.5 3.5 3.5 3.5 3.5
Total Solid waste generated per capita 400 450 450 450 450
Table4. Data Availability for Pune
2002-03 2003-04 2004-05 2005-06 2006-07
Population Growth 65 62.1 38.28 38 50.08
% of slum population 35 34 40 43.15 40.38
% of untreated sewage 43 32 32 33
48. Thematic scores with application of the indicator framework were calculated for Pune and Mumbai. As regards to the application of the theme on ‘Initiatives for improving city environment’, adequate data was not available in the ESRs. Hence this theme was not applied in the pilot application. Thematic scores for Pune and Mumbai are shown in the form of star diagrams in Figure-4 and Figure-5.

Evaluation of Environmental Status Reports
Prepared by Maharashtra Pollution Control Board xii
050
100150200250300
Growth of cities
State of natural
resources
Urban Services
Ideal score
Average Score
2002‐03
050
100150200250300
Growth of cities
State of natural
resources
Urban Services
Ideal score
Average Score
2003‐04
050
100150200250300
Growth of cities
State of natural
resources
Urban Services
Ideal score
Average Score
2004‐05
050
100150200250300
Growth of cities
State of natural
resources
Urban Services
Ideal score
Average Score
2005‐06
050
100150200250300
Growth of cities
State of natural resources
Urban Services
Ideal score
Average Score
2006‐07
Figure4. Star diagrams for the thematic indicators-Pune

Evaluation of Environmental Status Reports
Prepared by Maharashtra Pollution Control Board xiii
050
100150200250300
Growth of cities
State of natural resources
Urban Services
Ideal score
Average Score
2002‐03
050
100150200250300
Growth of cities
State of natural
resources
Urban Services
Ideal score
Average Score
2003‐04
050
100150200250300
Growth of cities
State of natural
resources
Urban Services
Ideal score
Average Score
2004‐05
050
100150200250300
Growth of cities
State of natural
resources
Urban Services
Ideal score
Average Score
2005‐06
050
100150200250300
Growth of cities
State of natural resources
Urban Services
Ideal score
Average Score
2006‐07
Figure5. Star diagrams for the thematic indicators-Mumbai
VI. Application to other cities
49. As stated earlier because unavailability of the data, ESR of the cities other than Pune and Mumbai were analysed for the data availability in a checklist form.
50. The analysis of the data availability is presented in Figure-6 to Figure-9 shows % of data availability. As we can see the maximum data availability is 40%. Also from the available data, key details which will give clearer picture were missing. This largely affects the quality of ESRs.

Evaluation of Environmental Status Reports
Prepared by Maharashtra Pollution Control Board xiv
0 10 20 30 40 50 60 70 80 90 100
Demographic growth (% 2001)
Economic growth
Industrial growth
Spatial growth (Decadal)
Demographic growth (% 2001)
Economic growthIndustrial growthSpatial growth (Decadal)
% Data availability 285025
Unavailable data 729510075
Growth of Cities
Figure6. Data availability: Growth of Cities
0 20 40 60 80 100
Land
Air
Water
Energy
Human
LandAirWaterEnergyHuman
% Data availability 30421520
Unavailable data 70588598100
State of Resources
Figure7. Data availability: State of Resources
0 20 40 60 80 100 120
Water Supply
Sewerage Sanitation
Solid Waste Mgmt
Transport
Water SupplySewerage Sanitation
Solid Waste Mgmt
Transport
% Data availability 138133
Unavailable data 87928797
Urban Services
Figure8. Data availability: Urban Services

Evaluation of Environmental Status Reports
Prepared by Maharashtra Pollution Control Board xv
51. Figure-10 shows data availability for various Municipal Corporations. All the 12 Municipal Corporations have data availability bellow 50%.
Figure9. City wise data availability
52. Observation regarding the format of ESRs: There is no standard format of ESR. Sectors and issues covered in ESRs of different cities and ESRs of consecutive years of the same city differs largely. ESRs have largely remained a compilation of the data. This data is more often than not presented in statistical form. It is difficult to draw meaningful conclusions from such raw data. Data is not analyzed and not compared with the standards thus it does not reveal whether the condition of a particular environmental component or urban service is good or bad. Data is often presented in compartmentalized form. Relation of one sector with the other, overlaps between sectors do not surface hence it does not provide a clear picture of city environment. Relative performance of cities against one another cannot be judged because the format differs largely.
53. ESRs have been focusing on reactive decision making rather than proactive policy making. Mainstreaming of environmental considerations in the sectoral development remains outside the scope of the ESR, thus the recommendations made in the ESR remain unimplemented. The ESR framework, although compiles cross sectoral information and data, does not influence cross sectoral policies such as economic instruments (e.g. Tax rebates, incentives etc).

Evaluation of Environmental Status Reports
Prepared by Maharashtra Pollution Control Board xvi
54. The ESR does not address the implications of recommended Environmental Action Plans in terms of budgetary allocations. Financial deficiencies and non-allocation of budgets for Action Plans remains as one of the constraints.
55. Lastly, the most important element of stakeholder participation remains weak in formulating ESRs and subsequent Action Plans. It is essential for Environmental Action Plans to evolve out of a consultative process, which is not followed in the ESR preparation and dissemination strategy of the institutions.
56. After looking at the ESR in global context and reviewing City ESRs from Pune and Mumbai, it is evident that at present ESRs are playing little role in mainstreaming environment into policy making and action planning. It is unable to transform the ‘data’ regarding environmental issues into programmes and projects to address them. The reason partially is the quality of ESRs.
VII. Recommendation for improving process of ESR preparation
57. With enhanced performance ESR can become a key document for aligning developmental policies with environmental considerations and global environmental issues. Presently the ESR preparation process starts at collecting the available data and stops at data analysis and recommendations. Implementation of the action plan and enabling the policy framework to support those, remain out of scope of ESRs. This process is not inclusive of all the stakeholders. In order to enhance the quality and contribution of ESRs a more comprehensive ESR preparation process which is inclusive all the stakeholders has to be followed. Looking at the present drawbacks the recommendations are categorized under three heads.
• Standardizing the ESR format
• Stakeholders’ Involvement
• Influence Policy, Plan, programme and Projects
58. Figure-10 shows various stages involved in ESR preparation.

Evaluation of Environmental Status Reports
Prepared by Maharashtra Pollution Control Board xvii
Data collection
Data structuring
Use of Indicators
Identifying and Prioritizing the Gaps
Preparing Action Plans through Stakeholder Consultation
Supporting Action Plans through
Enabling Policy Measures
Stakeholder involvement
Standardizing the format
Influence Policy Plan Programme and Projects
Figure10. Interventions to improve Quality of ESR
A. Standardizing the ESR Format
59. Standardize the report formats, data collection, analyses and representation: Analysis of the ESR so far shows that there inconsistency of data is a major cause of poor output. Format of ESR differs each year for a city and it is not same for any two cities. This makes temporal comparison of data for a city and between cities impossible. Thus first step towards improving the quality of ESR is to standardize the report formats, data collection, analyses and representation.
60. Follow standardized data flow and representation: Data availability is a very crucial issue which ULBs face while preparing ESRs. Presently first data is collected and then from whatever available data report is generated. To achieve consistency in the report first the ESR format has to be standardized and accordingly data collection has to be followed. Refer Annex IX.
61. Improve on spatial representation: There is very little use of maps to present the issues. Most of the information is presented in the form of tables and graphs. All the maps used are of poor quality. Spatial representation of issues as well as responses is a better way to report. A GIS based data repository will be a better approach for organizing multi-attribute and spatial information of the ESRs. GIS can be effectively used as tool for decision making in relation to optimum gainful utilization of available resources. GIS would assist us in better linking of environmental, demographic and temporal factors with various issues to understand their causes.

Evaluation of Environmental Status Reports
Prepared by Maharashtra Pollution Control Board xviii
62. Use Indicator Framework: Indicator will play a key role in standardizing this data collection. Once the indicators are standardized automatically data will be collected in that format. These indicators can be divided into two parts. The core indicators which are mandatory for all the cities and for all the years and for which the data is easily available and the desired indicators which add value to the environmental performance assessment of the cities but data availability for which is in question. At least core indicators listed should be followed.
63. Use ESR to reflect on Global Issues: GHG Emissions: Microclimate changes, flash floods and urban heat island effect are examples on the impacts of rapidly growing urban bodies on a local scale. These changes when cumulated lead to regional and global scale impacts. Issues such as global warming are becoming of great concern today. Cities have an important share in global warming – given the intensive use of natural resources, energy consumption and releases of wastes/emissions. ESRs should include therefore key global indicators like GHG emissions.
64. Ensure Linkages to add Value maintain Consistency and avoid duplication: The ESRs can be used for defining programmes and projects by the ULB aligning them with local as well as global environmental issues. Only when ESRs emerge as a quality documents we can use them as inputs for environmental assessment for various project from multilateral agencies and for progress reporting of these projects. Annexure IX gives model ToC for future ESRs. A tiered process of City ESR to National SoEs may be set up. MPCB can play a role in building Regional ESRs based on city ESRs.
National SoE
State SoE
Regional ESRs
City ESRs Figure11. Aligning the environmental reporting initiatives
65. Figure-11 explains how all the environmental initiatives can be aligned. Once they have a common agenda, national policies will be aligned with local issues and local action will be aligned with national policies.

Evaluation of Environmental Status Reports
Prepared by Maharashtra Pollution Control Board xix
B. Involvement of the Stakeholders
66. Follow a Consultative process for ESR preparation and sharing: It is important to involve stakeholders in ESR preparation process at various stages like compiling data, reporting its analyses to highlight gaps and develop action plans. Presently ESRs are typically given to consultants for preparation.
67. The ESR preparation should be driven and directed by ESR Committee set up at ULB. See Figure-12.
ESR Team
Representatives from various departments of the ULB e.g. water supply dept., sanitation dept., building permissions dept., electricity dept., income tax dept., town planning dept. etc.
Private consultant
Citizen representatives, representatives from educational institutions, research institutions etc.
Figure12. Team composition and citizen involvement for preparation of ESR
68. ESR preparation process discussed in Figure-13 can be followed to ensure stakeholders’ involvement. ESR preparation process to be followed should be cited clearly in the TOR for outsourcing the ESR preparation. A Model TOR for outsourcing the ESR preparation is given in Annexure XIII.

Evaluation of Environmental Status Reports
Prepared by Maharashtra Pollution Control Board xx
Form ESR committee
Review the previous ESRs and the implementation of the Action Plans
ESR Launch Workshop
Situation Analysis
Present the Situation analysis to the committee
Action Plan for next 3 years
Present the Draft ESR Report to the committee
Final ESR Report
Data collection
Data structuring and analysis
Application of the Indicator Framework
Formation of Vision, Mission, Goals and Objectives
Developing Policies, Plans, Programmes and Projects
Action Plan for next 3 years
Figure13. ESR Preparation Process
69. Consider Internet as an Effective Platform for Building and Sharing of ESRs: Intercity comparison can be facilitated through online sharing of ESRs with other cities. This will increase the transparency in data sharing. Maharashtra has a website www.envis.maharashtra.gov.in . The ESRs can be shared on this website.
70. Use of tools like Ekovoices will be very useful. Ekovoices is a website launched to build a community of citizens who want to work towards a ‘Cleaner and Greener’ concept for the betterment of the Society. Ekovoices utilizes a Google maps based engine where users can report location specific environmental issues and initiatives. Experts in the field of environment and urban infrastructure management can form their own networks on Ekovoices. Refer Annex VIII.
C. Linking ESR preparation to Strategic Planning
71. From Vision to Action: The actions must be rounded. Vision- Mission-Goals-Objectives-Targets should emerge based on the inputs from ESR. The schemes implemented will be input to ESRs and revised Vision will emerge from new ESR.

Evaluation of Environmental Status Reports
Prepared by Maharashtra Pollution Control Board xxi
72. The ESR should carry a blue print of Vision to Action. The DPSIR Framework and the Strategic Planning Process should form two convoluting circles intersecting at Pressure and Response. See Figure-14. The DPSIR Framework externally supports the Strategic Planning Process, drawing information from the SoE and feeding back into the SoE evolve the Response (Environmental Action Plans)
The Analytical Framework facilitates the translation of SoE (State & Impact Indicators) into Strategies, Tactics and Tasks to evolve Response.
DPSIRFRAMEWORK
P=Pressures
S=State
I=Impacts
R=Responses
Implementation
D=Driving forces
Vision Mission
Goals
Objectives
Targets
Schemes
Policy, Plan, Program, Project
Desired state of environment
Stimulated by situation analysis
STRATEGIC PLANNING
Figure14. Linking ESR preparation to Strategic Planning
73. Linking ESR preparation to Strategic Planning: The actions must be rounded. Vision- Mission-Goals-Objectives-Targets should emerge based on the inputs from ESR. The schemes implemented will be input to ESRs and revised Vision will emerge from new ESR.
74. Key Action Points: Based on the deliberations above summing up action points is given below.
• Arrive at DPSIR based Table of Contents for ESRs • Conduct training of ESR “ coordinators” • Apply Indicator Framework • Follow consultative process in building ESR and platforms like ekovoices • Maintain link between MPCB’s regional reports with ESRs and in turn
with State SoE • Integrate Strategic Planning Process in the preparation and use of ESRs • Prepare a Model ESR on this basis under MPCB’s assistance

Evaluation of Environmental Status Reports
Prepared by Maharashtra Pollution Control Board xxii
• Elevate ESRs to reflect on Global Issues such as reporting on GHG & evolving action plans to reduce the carbon footprint.

Evaluation of Environmental Status Reports
Prepared by Maharashtra Pollution Control Board 1
1 Background of the ESR Evaluation project
In current milieu of increasing urbanization more than half of world's population is living in cities and towns. Nearly 28% of India's population (285 million) lives in urban areas as per 2001 census. The percentage decadal growth of population in rural and urban areas during the decade is 17.9 and 31.2 percent respectively. It is important to note that the contribution of urban sector to Gross Domestic Product (GDP) is currently expected to be in the range of 50-60 percent. Increased urbanization seen today is a result of this overall growth
Maharashtra State occupies a position of prominence in India. It has 10% of the country’s geographical area (0.3 Million Sq. Kms) and 10% of country’s coast line (720 Kms). 43% of its population lives in urban areas as against the country’s 28%. It contributes over 13 % of National GDP and its Per Capita Income is 39% higher than the country’s Per Capita Income. Its 96.88 million people (9.4 % of country’s population) produce over 19% of the country’s National Output. Maharashtra has been in the forefront of economic development and is often called the economic powerhouse of the country. With its proactive policies, the State continues to occupy the dominant position amongst the industrially advanced States in India. Economy of Maharashtra has been growing at the rate of 8%.1
However this growth is exerting tremendous pressure on the natural resources and urban services. Loss of green cover, deteriorating air quality, polluted water resources, problem of solid waste in urban areas, inequitable distribution of urban services, problem of urban poor, regional disparity are some of the environmental issues common in the State. Box1-1 gives some details about these issues stated in the State of Environment Report for Maharashtra 2007.
Box 1-1 Environmental Issues in cities of Maharashtra2
The State of Environment Report of Maharashtra 2007 reveals that almost 75 percent sewage treatment plants in Maharashtra run without valid consents.
About 99 percent of sewage generated by municipal councils and over 50 percent sewage discharged by municipal corporations goes untreated into either of three major river basins—Godavari, Tapi and Krishna.
Wide disparities exist between supply in urban and rural areas. Mumbai has a maximum average water supply of 200 litres per capita per day (lpcd) but even within the city, the slum areas barely receive 90 lpcd and the well-off areas get 300-350 lpcd
Pollution: Increase in vehicles is the reason of growing pollution in the State, the report states. Maharashtra Pollution Control Board's monitoring results for 2005-06 show that levels of Respirable Suspended Particulate Matter and Suspended Particulate Matter exceed in more than
1Industry, Investment and Infrastructure Policy, Maharashtra http://www.sidbi.in/notices/Maharashtra-INDUSTRIAL%20investment%20n%20infra%20POLICY%202006.pdf 2 Dismal picture of Maharashtra’s environment, Nidhi Jamwal, 10/08/2007, India Environmental Portal, http://www.indiaenvironmentportal.org.in/node/34287, accessed on 17/09/08

Evaluation of Environmental Status Reports
Prepared by Maharashtra Pollution Control Board 2
half the locations monitored. The monitoring report has found that two-wheelers constitute major share (69.32 percent) of vehicles in the State followed by four wheelers at 13.37 percent. Pune region alone accounts for about 20 percent of the total vehicles in the State followed by Greater Mumbai at 13 percent. Further, two wheelers and four wheelers (except taxis) constitute 81 percent of the total vehicles in Greater Mumbai.
Clearly, private vehicles take up more and more road space at the cost of public transport.
Solid waste: Maharashtra generates over 16,000 tonnes per day of Municipal Solid Waste (MSW), of which almost 50 per cent is generated by Mumbai: 7,000 tonnes per day. Pune generates 2,123 tonnes per day, while Thane generates 880 tonnes per day of MSW. According to the projections made by Nagpur-based National Environmental Engineering Research Institute, MSW in the State is estimated to increase to 8.05 million tonnes by 2011 and 11.77 million tonnes by 2021. Electronic waste generation is already at 20,270.6 tonnes per annum. The report also claims that Maharashtra produces almost 60 per cent (31.5 tonnes per day) of the total biomedical waste produced in the country.
Hazardous waste generation is pegged at 1.4 million tonnes annually (50 per cent of the total hazardous waste generated in the country) with Thane, Ratnagiri and Raigad generating the maximum amounts
In India there have been several recent initiatives to steer sustainable development in urban areas. The 74th Amendment to the constitution has enlarged the roles and responsibilities of municipalities, specifically citing protection of the environment and promotion of ecological aspects.3
According to the Municipal Legislations, the urban local bodies in Class A cities are required to publish an annual Environmental Status Report (ESR) which will indicate the status of environment management in the city and identify the areas where mitigation measures are required to be considered. The ESRs are submitted to Ministry of Urban Development (MoUD) and follow Mumbai Metropolitan Region Development Authority (MMRDA) guidelines for preparation.
Maharashtra is the State that has been publishing ESRs for last 12 years. These ESRs discuss the state of various natural resources and urban services and the environmental issues faced by respective cities.
However data presented in these reports is without much analysis. Presented data also show many inconsistencies. As a result the effort of publishing ESRs has remained only till compiling information on various environmental issues with ESRs having little role to play in action planning.
This effort can be taken to a higher level. ESR data can be used to assess the environmental performance of the cities. ESR also can play a key role in mainstreaming environmental considerations in development policies. Since it is a document produced by the Urban Local Bodies (ULBs), it can trigger action at the city level. ESR it is a document which is published for citizens. If reach of ESR is increased; it will increase the awareness among citizens about the environmental issues in turn increasing public participation. 3 http://www.niua.org/indiaurbaninfo/fire-D/ProjectNo.5.pdf

Evaluation of Environmental Status Reports
Prepared by Maharashtra Pollution Control Board 3
Maharashtra Pollution Control Board (MPCB) implements various environmental legislations in the State of Maharashtra. MPCB was established on 7th September, 1970 under the provisions of Maharashtra Prevention of Water Pollution Act, 1969. With a view of capturing wider spectrum of opportunities for ESRs, MPCB proposed to develop an assessment framework for ESRs based on Indicators. Cities could be rated against each other according to this Indicator Framework. ESRs based on this basis can generate public debate and awareness about ‘green’ and sustainable cities and engender healthy competition amongst leading cities.
1.1 Objectives of the project To understand where ESRs stand as compared to global standards
To benchmark best ESR practices so that all cities can follow them.
To evolve a common format for the ESR along with a framework of indicators so as to allow assessment of environmental performance of cities.
1.2 Purpose of this report Purpose of this report is first to understand where ESR stand in global context, various ESR initiatives taken at various levels world over and in India. Secondly to understand how indicators are being used as a tool for assessment of state of environment and to communicate to readers the indicator framework developed for this project. This report presents the framework of indicators and its application to 14 cities in Maharashtra. This framework was developed after studying various frameworks of indicators world over. It is then applied to those cities of which the ESRs were available.

Evaluation of Environmental Status Reports
Prepared by Maharashtra Pollution Control Board 4
2 Background of ESR This chapter gives background of ESR. It briefly explains various forms of ESRs published world over. It explains purpose of ESRs and evolution of ESR framework.
2.1 What is ESR? Looking at the history of environmental reporting it can be said that formal environmental reporting finds its roots in the Local Agenda 21 mandate that was passed in the Earth Summit of 1990 in Rio. Some initial attempts of environmental reporting are seen prior to the Summit. Under this mandate, ULBs required to undertake the preparation and publication of an annual ESR or equivalent. The ESR was expected to list city’s environmental concerns, growth factors and the overall environmental degradation and improvements. This data is often analysed to show trends of environmental pollution, impacts of growth and possible environmental action planning in the city.
ESR is one of the forms of State of Environment Reporting (SoE). Different regions across the world use varying terminologies to characterize their respective SoEs. Each type of SoE may have its own distinct characteristics. Some of the other forms of SoE are: Global Environmental Outlook, Environment Monitors, Environmental Atlas, Sustainability Report etc.
These SoEs can be further categorized based on the scale or level of the scope of SoE reporting, namely: Global or Regional level, Country and State Level, City Level Corporate Level and Community Level. The levels of SoE reporting are discussed later in this chapter.
Table-2-1 gives brief explanation about these initiatives. Detailed description is given in Error! Reference source not found..
Table 2-1: SoE Reporting
Sr. No. Level SoEs and Remarks
1. Global level Global Environmental Outlook
UNEP has launched Global Environmental Outlook Project in 1995. This series makes periodic reviews of the state of world’s environment and provides guidance for decision making process such as formulation of environmental policies, action planning and resource allocation.
2. Country Level These SoEs are compiled to assist decision makers, civil society, academicians, and the general public towards making informed and logical decisions based on environmental criteria.

Evaluation of Environmental Status Reports
Prepared by Maharashtra Pollution Control Board 5
Environmental Atlas
The distinguishing feature offered by the Environmental Atlas is the representation of environmental data and information usually in the form of maps
Country SoEs by UNEP
These SoEs address existing policy responses at national, sub-regional, and regional level, the future perspectives based on the different development patterns, recommended policy actions.
4. City level ESRs Based on Local Agenda 21 mandate, cities publish annual statements of the city’s environment, often drawing recommendations from it.
Community level initiatives
There also have been several initiatives in environmental reporting at community level like citizen report card, citizen score card and community based performance monitoring. The basic concept behind these initiatives is that citizens as users can provide useful information on the quality and adequacy of services and the problems they face with the service providers.
Corporate level Sustainability Reports are typically produced by corporate to assess the demand and supply of resources, risks of environmental degradation and the cost and benefits of environmental management.
2.1.1 Purpose of ESRs The purpose of ESRs is as outlined below:
ESRs are used to highlight the condition of the biophysical environment.
ESRs also include analysis of trends or changes in the environment, analysis of the causes of these changes, assessment and interpretation of the implications and impacts of these trends, and assessment of the actual and potential societal response to environmental problems.
An effective ESR is one of the most valuable means of informing policy makers, the public, and other stakeholders on the status of natural resources and the sustainability of resource-use patterns.
Today, ESRs have emerged from being solely environment oriented to being all encompassing, interfacing with economic and social elements. Hence, the ESR report has come to identify the key driving forces that influence environmental change and policies.
For any ESR to be effective, it is very essential to understand the function of the ESR in serving the requirements of the targeted audience. The purpose of the ESR will be achieved only if it is able to communicate to the intended audience the

Evaluation of Environmental Status Reports
Prepared by Maharashtra Pollution Control Board 6
state of the environment and translate into positive action. See in Table 2-2 the purpose of the ESR and the intended audience.
Table 2-2: Purpose of ESRs for intended stakeholders
Purpose Main intended Stakeholders
1 Highlight the condition of the Bio physical environment
National State/ Regional Decision makers and Citizens
2 Trends of change of Environment National State/ Regional State Decision makers
3 Causes of change in the environment National State/ Regional State Decision makers
4 Assessment and Implications of change in the environment
National State/ Regional State Decision makers
5 Societal response to environmental changes Citizens
6 Vulnerability of resources National State/ Regional State Decision makers
2.1.2 What are the basic requirements of ESRs Some basic considerations for ESRs reporting are that ESRs should be:
Based on scientific information, correct environmental monitoring data and sound analysis
Compiled in a manner that is easily understandable, easy to refer to and draw meaningful inferences from
Grounded in reality and feasible, giving due considerations to constraints and concerns of implementing agencies
Able to give technical facts in most simple and easily understandable language and visual representation
Pave the way for effective environmental action planning and subsequent actions towards improving the state of the environment.4
2.1.3 How did ESR framework evolve ESR is one form of SoE Reporting. In order that the SoE report serves its purpose and is able to fulfill the basic requirements of communicating about the state of
4 Adapted from A Checklist for the State of the Environment Reporting, EEA, 1999

Evaluation of Environmental Status Reports
Prepared by Maharashtra Pollution Control Board 7
the environment, as well as its social and economic relationships, a variety of SoE frameworks were tested and tried at various levels of reporting.
The evolution of SoEs is nothing but the evolution and transition of these SoE frameworks. The following are the primary functions of SoE frameworks:
To categorize the environmental information and thus provide a structure to reporting
Allow effective understanding of the interlinkages and complexity of environmental issues, their causes and impacts
Allow easy analysis in a manner that can be efficiently communicated to all stakeholders
Communicate inferences and recommendations such that Environmental Action Plans can emerge
Some of the SoE frameworks commonly used for SoE reporting include:
1. Environmental Media Framework
2. Environmental Issues Framework
3. Sector Framework
4. Environmental Process Framework
Environmental Media Framework: In this type of framework, reporting happens under the heads of various Environmental media such as Air, Water, Land and Biota. The SoEs are traditionally initiated using this framework, categorizing the information and analysis on the basis of the impacts on the environmental media. This framework incorporates the simple structure similar to the way in which environmental monitoring is categorized5. See Box 2-1
Environmental Issues Framework: Here SoE Reporting is categorized based on environmental issues such as Waste Disposal, Land Contamination, Air Pollution etc. Since issues are the crux of any action process, SoE Reporting is done in this framework. See Box 2-2 5 Producing SoE http://www.environment.gov.za/soer/resource/soeguide/gud_rs.htm accessed May, 2005
Box 2-1: Environmental Media Framework
Pros Cons
Simple structure for arranging information Compartmentalized approach
Environmental monitoring data corresponds to this framework
Integrated assessment of environmental information becomes impossible

Evaluation of Environmental Status Reports
Prepared by Maharashtra Pollution Control Board 8
This framework is politically favored and appeals to citizens. If executed properly, the focus on the environmental issues and issue based action planning can assist in generating citizen interest and participation. Although traditionally this framework of SoE started out with a focus on environmental issues alone, social aspects such as poverty are now being integrated into the SoE6.
Sector Framework: In this, reporting is categorized based on economic sectors such as Agriculture, Tourism, Forestry, Transportation etc. Under this framework, human activity is taken as the basis for organizing the SoE structure. See Box2-3. Although this reporting approach provides information on the economic benefits derived from the environment and the economic consequences of environmental trends, it does not recognize ecosystem complexity or processes7.
Environmental Process Framework: In this type of framework, reporting is based on the interplay of causation factors and their subsequent impacts on the environmental resources, covering cross sectoral themes.
This framework uses the Pressure-State-Response (PSR) indicators to gauge the impact of human activities on the physical and biological processes of the ecosystem. This framework concentrates on reporting the dynamic ecosystem relationships reflecting both cause and effects8. It provides a systematic and comprehensive coverage across sectors in an integrated manner. Such a framework also facilitates the development and evaluation of policy responses to environmental problems. See Box 2-4.
6 Producing SoE http://www.environment.gov.za/soer/resource/soeguide/gud_rs.htm accessed May, 2005 7 Producing SoE http://www.environment.gov.za/soer/resource/soeguide/gud_rs.htm accessed May, 2005 8 Producing SoE http://www.environment.gov.za/soer/resource/soeguide/gud_rs.htm accessed May, 2005
Box 2-2: Environmental Issues Framework
Pros Cons
Issue based approach is favoured by both the citizens and decision makers
Discussion on issues may happen without a spatial context
Policies and plans targeted towards specific issues are possible
Integrated environmental assessment of environmental information becomes impossible
Box 2-3: Sector Framework
Pros Cons
Sector heads corresponds well with the existing institutional structure
Discussion on issues may happen without a spatial context
Economic causation factors are taken into consideration
Integrated assessment of environmental information becomes impossible

Evaluation of Environmental Status Reports
Prepared by Maharashtra Pollution Control Board 9
The Driving Force-Pressure-State-Impact-Response (DPSIR) approach is an off-shoot of the PSR framework. The DPSIR framework concentrates on reporting the dynamic ecosystem relationships reflecting both cause and effects and is thus able to reflect the complexity of environmental dynamics to some extent. Further, it provides a systematic, comprehensive and integrated coverage across sectors. Such a framework also facilitates the development and evaluation of policy responses to environmental problems.
The DPSIR Approach attempts to answer five crucial questions that are essential to understand about the environmental complexities and develop responses to address these concerns. See Figure 2-1
Figure 2-1: DPSIR Framework
These five questions are as follows:
1. What is happening to the environment and why is it being pressured?
2. What are the consequences for the environment and humanity impacts?
Box 2-4: Environmental Process Framework
Pros Cons
Complexity of causation factors and impacts on the environment are evident
A complex structure for reporting
Indicators makes quantifying of environmental information possible
Has to be integrated with an analytical and spatial context for deriving action plans

Evaluation of Environmental Status Reports
Prepared by Maharashtra Pollution Control Board 10
3. What is being done about it and how effective is it?
4. What could be the alternative futures for the unwarranted unsustainable development?
5. What are the alternative actions to be taken?
Traditionally, the ESRs have always focused on the first question and hence have seen ESRs not being effectively translated into concrete environmental action plans.
The DPSIR Framework9 is based upon a limited set of policy-relevant key indicators. Indicator-based reports give time-trend information that needs to be updated annually. The purpose is to structure data and information on different environmental problems. The purpose of environmental indicators is to communicate such environmental information to policy-makers and the public. See Box 2-5 for more information on DPSIR Framework.
In summary, although these four distinct SoE frameworks exist, hybrid frameworks are now being employed to take advantage of the ‘pros’ of the frameworks while addressing the ‘cons’. Typically, the DPSIR framework is now being coupled with the Environmental Media Framework not only to derive a simple report structure but also to focus on the cause and effect relationships in the environment.
9 http://jolly.fimr.fi/boing/encyclopaedia.nsf/0/3324c654710ca754412569d00007bb27?OpenDocument , accessed May 2005
Box 2-5 About the DPSIR Framework
The roots of the DPSIR framework are found in the Pressure-State-Response (PSR) framework, developed by Anthony Friend in the 1970s to gauge the impact of human activities on the physical and biological processes of the eco system. A slightly elevated model of the PSR framework emerged as ‘sustainability’ became the key word. Sustainability encompasses social and environmental aspects and highlights their interdependence, hence inseparability. As a result, the Driving Force-Pressure-State Impact-Response (DPSIR) framework evolved.
The framework assumes cause-effect relationships between interacting components of social, economic, and environmental systems, which are
Driving forces of environmental change (e.g. industrial production)
Pressures on the environment (e.g. discharges of waste water)
State of the environment (e.g. water quality in rivers and lakes)
Impacts on population, economy, ecosystems (e.g. water unsuitable for drinking)
Response of the society (e.g. watershed protection)

Evaluation of Environmental Status Reports
Prepared by Maharashtra Pollution Control Board 11

Evaluation of Environmental Status Reports
Prepared by Maharashtra Pollution Control Board 12
3 ESRs for Indian Cities After understanding the background of SoE Reporting and ESRs, this chapter discusses SoE initiatives in India and introduction of ESR in India with 74th amendment to constitution.
3.1 Environmental Reporting Initiatives in India Since 1990s there has been growing attention to local environmental issues and the need for locally-based action. In 1992, the UN Conference on Environment and Development produced Agenda 21, a framework for local environmental action which recognized the critical role of local governments. Four years later, the UN Habitat II conference in Istanbul focused on the quality of life in human settlements and reaffirmed the role of local authorities in this process.
On completion of ten years of the Rio process, the World Summit on Sustainable Development (WSSD) held in September, 2002 at Johannesburg, South Africa reviewed and appraised progress towards sustainable development and the commitments made ten years ago at Rio and forged a cohesive set of global partnerships to achieve comprehensive implementation of Agenda 21. At the national level, the MoEF and Ministry of External Affairs (MEA) initiated a programme of triennial SoE Reports at National and State levels and building institutional capacities at various levels for preparing such reports.10
Table 3-1 summarizes these initiatives. For further details please refer Annex V
Table 3-1: ESR initiatives in India
Sr. No. Level Remarks
1. UNEP India SoE 2001 At national level State of Environment Report of India was prepared to be a part of Global State of the Environment Report in 2002 (GEO-3) for the 2002 Earth Summit i.e., Rio + 10. The SoE followed the DPSIR framework coupled with Environmental Issues framework.
2. State level SoE Reports In India 29 States and 5 Union Territories have attempted SoEs. Ministry of Environment and Forest (MoEF) has recommended DPSIR framework for National and State level SoEs. However this framework is not followed in the city level ESRs.
10 International Cooperation http://www.envfor.nic.in/report/0203/chap-11.htm#11-1 accessed May 23, 2005

Evaluation of Environmental Status Reports
Prepared by Maharashtra Pollution Control Board 13
3. Regional ESRs of MPCB
Regional ESRs are published by Maharashtra Pollution Control Board. MPCB has 11 regional offices all over Maharashtra. These offices prepare ESRs every year. These ESRs are prepared as a base document for preparation of State level SoE report. These ESRs follow environmental media framework.
4. City level ESRs For city level ESRs in India, the Ministry of Urban Development and Planning (MUDP) is the nodal agency that mandates the creation of ESRs. Publication of ESRs is mandatory for all the municipal corporations in Maharashtra. However only approximately 60% of the municipalities comply with this requirement. The city ESRs are typically based on environmental media framework but again are not following this style on a consistent basis.
5. Community level In India such an initiative has been tried in Bangalore. The Bangalore Citizen Report Card (CRC) was pioneered by the Public Affairs Centre (PAC). It provides an assessment of the satisfaction levels of citizens with regard to public services in Bangalore and ranks public service agencies (dealing with water, power, municipal services, transport, housing, telephones, banks and hospitals) in terms of their service performance.
6. Environmental atlas The Environmental Atlas of India is a compilation of all the environmentally related information presented in the form of maps and text including statistical data. This Atlas is scheduled to be released during year 2000. The scale adopted is 1:12 million for general maps and 1:2 million for detailed maps. State level and district level Environmental Atlas are also being prepared
3.2 Introduction of ESR in India with 74th amendment to constitution
In India, the 74th Amendment to the constitution has enlarged the roles and responsibilities of municipalities, specifically citing protection of the environment and promotion of ecological aspects.11
11 http://www.niua.org/indiaurbaninfo/fire-D/ProjectNo.5.pdf

Evaluation of Environmental Status Reports
Prepared by Maharashtra Pollution Control Board 14
Protection of environment and ecological aspects is a constitutional duty of ULBs in the country as per 12th schedule (Article 243W) introduced in the constitution, vide 74th constitutional amendment act of 1992.
Urban forestry, protection of the environment and promotion of ecological aspects have been specifically mentioned in the 12th Schedule as a responsibility of municipal bodies. With this act in place, it is expected that management of urban environment at a local level would become more effective especially, if it were undertaken in a partnership mode with the private sectors and community groups.
According to the municipal legislations, the urban local bodies in Class I cities are required to publish an annual ESR which will indicate the status of environmental management in the city and identify the areas where mitigation measures are required to be considered. The ESRs are submitted to Ministry of Urban Development (MoUD) and follow Mumbai Metropolitan Region Development Authority (MMRDA) guidelines for preparation. The objective of the ESRs is to survey, monitor the change of the Environmental Status and to take up an action plan for the proceeding year. This whole exercise is taken up with a view that it will benefit the ULB Officials, Central and State Government bodies, Governing bodies, legislative members, Non Governmental Organizations (NGOs), policy planners, and public for the measures to be taken up for environmental restoration and developmental activities.
Following are a few key observations of the current ESR process by Municipal authorities in India:
Typically, the ESRs are compiled using the Environmental Media Framework or a combination of the Media framework and Issues framework.
Generally it is observed that the ESR process, although on a smaller scale, does not involve a stakeholder participation and consultation process, particularly for Indian cities.
As a result, the ownership of the report remains solely with the municipal authority, making the implementation of the recommendations and action plans outlined by the ESRs unfeasible and unrealistic in implementation.
See Box 3-1 for a sample Table of Contents for Brihan Mumbai ESR 1998-99. Typically, ESRs address similar issues in Indian cities.
Box 3-1: Table of Contents of Brihan Mumbai ESR 1998-99 1. Description of area 2. Land Use. 3. Water Supply 4. Sewage Collection and Disposal System 5. Storm Water Drain. 6. Solid Waste Disposal. 7. Power Supply and consumption 8. Roads, Traffic and Transport.

Evaluation of Environmental Status Reports
Prepared by Maharashtra Pollution Control Board 15
3.3 Opportunities for ESR Although there have been attempts of SoE Reporting at National, State, Regional, City and Community levels, there is little relation of one with the other. At every level; objectives, scope, content, structure and process of preparation of the report vary widely including the sources of data.
Priorities and issues at national and State level are not reflected in action at various levels. In this perspective the biggest advantage of City level ESR is that it is a document produced at city level and addresses the issues at city level. ESR can be used as a key document for various purposes. Following are some of the examples of the potential use of ESRs.
Reflecting on Global issues
While addressing the global issues like climate change, effort started with a top-down approach often gets diluted till it reaches the bottom of the system i.e. ULBs, ESR can trigger a bottom up approach for addressing the global issues like climate change. Policies of ULBs can be aligned with global issues. ESR can play an important role in action planning.
Community Participation triggering Policy making
Communities can be the best judge of the environment in which they are living. Their contribution in action planning and implementing the plan is valuable. ESR is a document published for the citizens to get educated about the environment. Thus with reach of ESRs increased it can increase the awareness levels of the citizens in turn increasing their participation in policy making. Separating environment from development and ‘patch up’ approach for addressing the environmental issues will only worsen the situation. ESR can serve as fact sheet when taking decisions related to urban infrastructure.
Jawaharlal Nehru National Urban Renewal Mission
They can play an important role in progress reporting in National level urban infrastructure projects like Jawaharlal Nehru National Urban Renewal Mission (JNNURM).
JNNURM Progress Reporting is at 3 levels.
9. Housing and Slums 10. Air Quality status
10.1 Air pollution index 10.2 Trend analysis 10.3 Noise levels.
11. Land and Soils 12. Industries, Wastes and Hazards. 13. Health. 14. Environmental Impacts on Vulnerable Groups in the Cities. 15. Challenges before us

Evaluation of Environmental Status Reports
Prepared by Maharashtra Pollution Control Board 16
State level
City Level
Project Level
ESRs can be a key input for JNNURM Progress reporting at city level.
Funding from multilateral agencies12
Now ULBs may be allowed to directly raise funds from Multilateral Development Institutions (MDIs) such as the World Bank (WB), Asian Development Bank (ADB) and other international financial institutions, based on their credit ratings. At present, funds for ULBs are routed through the Centre. Government has already launched an initiative to rate their infrastructure projects. Credit rating agencies like Fitch, Icra and Crisil have been asked by the government to rate the projects of these bodies according to their financial and infrastructural viability. The ratings would be crucial for these bodies to fund their projects through multilateral financing agencies.
The urban development ministry is of the view that central allocation of Rs 50,000 Crore through JNNURM alone would not be sufficient enough to meet the requirements of the local bodies
On this background ESR can play a key role at 2 stages
While rating the infrastructure projects in the cities: Data in ESRs can be of importance while rating these cities.
While raising funds from the multilateral agencies like WB or ADB: These funding institutions have their own stringent environmental policy guidelines and environmental assessment procedures which have to be complied with. The data in ESR can be used for these environmental assessments.
12 Local bodies likely to raise funds directly from WB, ADB 7 Aug, 2008, 0048 hrs IST,Rajat Guha, ET Bureau http://economictimes.indiatimes.com/News/Economy/Policy/Local_bodies_likely_to_raise_funds_directly_from_WB_ADB/rssarticleshow/3335088.cms accessed on 29 September 2009
Evaluation of Environmental Status Reports
Prepared by Maharashtra Pollution Control Board 17
4 Indicator Framework for ESRs The analytical framework of the ESR should assist in drawing meaningful inferences and guide responses towards environment protection and improvement in the city. The framework should be able to transcend from the understanding of the Impacts of the Driving Forces and Pressures on the State of the Environment and provide a logical decision making structure for Responses to planners and policy makers. The stepwise approach in the DPSIR framework allows this to a certain extent, but additional analytical interventions are found necessary to translate the ‘D-P-S-I’ into the ‘R’ (Driving Forces-Pressures-State-Impact to Response). This can be achieved through application of indicators.
4.1 Index based approach for assessing city environment While ESR is one form of SoE Reporting, there are other more effective forms like Indices. This chapter discusses the Index based approach for assessing city environment. Indicator initiatives in various parts of the world are discussed followed by presenting the indicator framework developed for this project.
4.1.1 Advantages of Index Based Approach for SoE Reporting Indicators can provide crucial guidance for decision- making in a variety of ways. They can translate knowledge on physical and social science knowledge into manageable units of information that can facilitate the decision- making process. They can help to measure and calibrate progress towards sustainable development goals. They can provide an early warning, sounding the alarm in time to prevent economic, social and environmental damage. Indicators are also important tools to communicate ideas, thoughts and values.
The United Nations Conference on Environment and Development held in 1992 recognized the important role that indicators can play in helping countries to make informed decisions concerning sustainable development. This recognition is articulated in Chapter 40 of Agenda 21 which calls on countries at the national level, as well as international, governmental and non-governmental organizations to develop and identify indicators of sustainable development that can provide a solid basis for decision- making at all levels. Moreover, Agenda 21 specifically calls for the harmonization of efforts to develop sustainable development indicators at the national, regional and global levels, including the incorporation of a suitable set of these indicators in common, regularly updated and widely accessible reports and databases.13
4.1.2 What are indicators? The word indicator is often misused and is applied to a range of situations using numbers that all attempt to describe and measure performance of an activity.
13 Assessment of Sustainability Indicators (ASI) A SCOPE/UNEP/IHDP/EEA Project, ASI Workshop 10-14 May 2004, Prague, Czech Republic

Evaluation of Environmental Status Reports
Prepared by Maharashtra Pollution Control Board 18
Experts who work with numbers, evaluating and analysing them on a daily basis frequently express the collection of data and its interpretation as a progression in a pyramid or triangle as demonstrated in Figure 4-1. These terms are explained in Box 4-1.
Figure 4-1: Collection of data and its interpretation
Box 4-1: Data and its interpretation
Data Forms the foundation,
Collection of numbers for a specific purpose
E.g. the number of paved roads in the city
Information but without a context or further analysis
Does not provide much insight.
To be useful, it needs interpretation
The addition of further data such as the cost of a lane kilometer of paved road and combining the two data sets, provides additional information especially if it is compared year-over-year.
Statistics The layer above “data”
Collection, analysis, and presentation of data to be used for making informed decisions in all areas of business and government.
Often need interpretation
The interpretation is provided to explain the numbers, especially when year-over-year comparisons are used and different answers could be given to questions about why numbers went up or down.
Indicators Level above statistics.
Models that simplify complex subjects to numbers which can be easily grasped and understood by policymakers and the public.
Simple numbers, comparable over time and space, that have a clear link with policy implications
In contrast to statistics, indicators should send a plain and correct message without the need for further explanation or interpretation.
For more complex issues, they can be also be used as an executive summary to inform non-experts who want to get a quick impression of

Evaluation of Environmental Status Reports
Prepared by Maharashtra Pollution Control Board 19
basic trends.
Indicators/indexes Terms often used interchangeably because they are both used to measure a condition that requires little additional analysis to understand.
Most commonly, the term “index” is used for indicators related to a baseline
Indicators that can accurately show the outcome of the performance of city services and programs are particularly important
Purpose of indicators
They are an important quantitative tool for measuring performance of any type of city.
They should be designed to explain something important about the services or products that are being delivered
They are instruments that help us understand, manage and improve what our cities do.
Effective indicators can help measure how well services are delivered and the level of citizen satisfaction with that delivery
Typical functions
The typical functions of indicators are to describe problems in a simplified manner and help grasp the bigger picture. They quantify qualitative aspects and identify trends. These functions of indicators are as described in Figure 4-2.

Evaluation of Environmental Status Reports
Prepared by Maharashtra Pollution Control Board 20
Typical Functions of Indicators
Description
Simplification
Measurement
Trend Identification
Clarification
Communication
Catalyst for Action
Describes conditions or problems Increase general understanding
Simplify complexity; provide a representative picture with significance extending to larger phenomena of interest.Measures characteristics of quality of life; measureperformance of activities or services
Establish baseline data; identify trends or patterns; show direction, improvement, disintegration, plateaus.Two types:1) Past orientation. Indicators are chosen in light of their historical trend‐identification properties. i.e. showing how dimensions of an identified phenomenon have been changing;2) Future orientation. The indicator is a ‘forward looking instrument’ used as a predicative, forecasting device.Clarify analytical issues or long‐term goals; Highlight areas of concern or improvement
Translate data into terms understandable by a wide range of viewers
Stimulate public, stakeholders and political awareness, as well as interest and will to work towards change.
‘What are things like?’
‘What’s the big picture?’
‘How much?’
‘How did we do?’‘Where are we headed?’
‘What is mostimportant?’
‘How do we explain?’
‘What next?’ Figure 4-2: Typical functions of Indicators
Types of Indicators
Depending upon the focus there can be various indicator types like economic indicators, social indicators, environmental indicators etc. Conventionally indicators used to single sector with single discipline approach. Used now are multi sectoral indicators and interdisciplinary approaches. Other than these there are performance measurement indicators and benchmarks. See Table 4-1.
Table 4-1: Types of indicators
Indicator set Characteristics of Indicator state
Indicator type
Focus of measurement
Monitors
Economic Economy Changes in market value activities
Social Social wellbeing
Social well being through surrogate concepts
Conventional Discrete, single sector, often single discipline approach
Environment Ecological systems
Structural and functional features of Eco-System
Holistic, multi sectoral, multi and
Sustainability Sustainability Sustainability through the integrated accounting of

Evaluation of Environmental Status Reports
Prepared by Maharashtra Pollution Control Board 21
environmental, economic and social development factors
Health Cities Health Health through positive/holistic health models
Integrative
interdisciplinary approaches
Quality of life Quality of life Quality of life examining social, health, economic and environmental conditions
Performance measurement
Progress towards goals and objectives
Performance Performance, production or financial approaches Benchmarks
Performance of organisation or programme
Organizational practices against ‘best in class organisations
4.2 Indicator Frameworks at global level and in India There have been several attempts to develop indicators that would apply to cities, either at national, regional, or international levels. Few of these initiatives have been successful but many have failed because of exhaustive information needs that are deficit to meet at local level.
These programmes can be categorised as global, regional or country specific and city specific programmes. Table 4-2 gives brief description about these categories
Table 4-2: Type of Indicator programmes
Sr. No. Type of programme
Name of programme
Following are the categories in the programmes at Global, Regional and Country level initiatives
Programmes measuring progress towards global goals and declarations
Millennium Development Goals, Habitat Agenda,
Urban Indicators Programme administered by UN-HABITAT, and the
Millennium Project, administered by the United Nations Statistics Division.
Local Agenda 21
Cities Environment Reports on the Internet (CEROI) give cities a template for reporting the state of the environment pursuant to Local Agenda 21.
Global rankings Many indicator programs produce a composite score which is then used to compare cities around the globe in different

Evaluation of Environmental Status Reports
Prepared by Maharashtra Pollution Control Board 22
categories such as “livability”, “quality of living”, or “best places to live”. These reports are often conducted by private companies, some on a fee basis.
Programs monitoring specific issues
A number of indicator programs monitor trends in specific urban issues and create ways to compare one city to another on that specific issue. One example of this type is Globalization and Urban Performance (Leautier, 2006). This study focused on the fields of urban governance and globalization, and sought to test three hypotheses:
Capacity development programmes
Many organizations throughout the world engage in capacity building exercises to help cities undertake the task of data collection in a meaningful and globally comparable way. These capacity building programs are not indicators in themselves, but are intended to enhance cities’ participation in global monitoring by improving how they collect data which can be used globally.
Certain programmes are city specific
City initiatives Virtually all cities around the world collect data and statistics, and most use them to form indicators of some kind. Some of the most innovative work on indicators globally is being done at the individual city level, much of it focused on providing very detailed, locally-oriented information to elected officials, city managers, and citizens about city government performance and about conditions citywide and in neighborhoods.
4.3 Indicator programmes in India In India there are no formal models or frameworks that are used to measure the environmental performance of cities. Credit rating agencies have rated municipal bond issues, and to a limited extent have looked at the finances of municipalities they have rated. The Energy Resources Institute (TERI) and City Managers’ Association-Gujarat (CMA-G) proposed models, the former for the more limited purpose of assessing the environmental compliance of municipalities in the performance of their tasks.
Urban Services Environmental Rating System (USERS)
In India, TERI was engaged by the MoEF and the United Nations Development Programme (UNDP) to develop a framework called USERS (Urban Services Environmental Rating System). The aim of this project is to measure the performance of a municipal body with respect to its service delivery in urban areas through a set of performance indicators that are benchmarked against set targets. The ULBs of Kanpur and Delhi have been identified as pilot case studies. The USERS project is aimed at:
1. Addressing the problem of environmental degradation in urban areas by empowering urban communities with information, which would foster the emerging trend towards transparency and accountability.

Evaluation of Environmental Status Reports
Prepared by Maharashtra Pollution Control Board 23
2. Providing policy-makers/implementation agencies with an analytical tool, which would enable more informed planning/decision-making; and
3. Developing and disseminating a rating system for the environmental aspects associated with the operations of urban agencies involved in 3 service areas—water supply and waste (solid waste and sewerage) management.
The TERI’s USERS programme is quite limited since it focuses mainly on the environmental aspect of urban service. For measuring performance the TERI Model uses a list of the indicators for the 3 different services, with an integrated approach under 3 different categories covering management, technical, and financial indicators.
Annex II gives details of framework for comparative performance assessment.
UIPMP of City Managers’ Association–Gujarat
The CMA–G selected 29 finance indicators and 38 infrastructure indicators for its maiden pilot Urban Indicators and Performance Measurement Programme (UIPMP), and applied it to 10 selected cities of Gujarat for the year 2000–1 data. The salient features of this programme and the list of the indicators used are elaborated below:
The UIPM P was undertaken by the CMAG to provide the ULBs with an analytical tool for self assessment, which would also make them more transparent and accountable.
The process involved the formulation of a list of performance indicators by a Technical Advisory Committee, which comprised outside expert and practicing municipal officers.
Having finalized the list placed below, a hierarchy of weightages was formed and weightages were assigned to each performance indicator to facilitate comparison of one municipal body with another and to facilitate ranking of the municipal bodies evaluated.
The CMA-G team collected data through the questionnaire, followed by an orientation visit and data collection and validation visits to the municipal bodies.
Being the first experiment, not many municipal bodies participated in it. The data was not available nor was it reliable, so, as a result, many indicators could not be worked out.

Evaluation of Environmental Status Reports
Prepared by Maharashtra Pollution Control Board 24
The biggest obstacles turned out to be lack of uniform and compatible data, and apathy or indifference.
This entire exercise of performance measurement was based on the comparative measurement among the municipal bodies and did not include comparison against the standards or benchmarks.
CMA-G could not undertake or replicate the UIPM programme for years subsequent to 2001 and 2002 due to various reasons, but it still plans to extend the programme to 30 cities.
Though the UIPMP aimed at providing an analytical tool to municipal bodies for self-assessment, no municipal body has utilized UIPM for self-assessment in the last 2 years or so.
List of indicators is given in Annex III

Evaluation of Environmental Status Reports
Prepared by Maharashtra Pollution Control Board 25
5 Proposed Indicator framework
With a view that indicators will communicate picture of city environment in a better way than just a report, and to strengthen the current analytical framework of the ESRs, Framework of Indicators has been designed. This chapter of the report presents the Framework developed.
As stated earlier the purpose of developing indicator framework for cities in Maharashtra is to assess their environmental performance against common platform and to assess the quality of ESRs published by cities in Maharashtra.
After studying various indicators programs discussed in chapter 4, this framework has been developed based on D-P-S-I-R framework.
This indicator framework will provide picture of city environment in terms of an Environmental Performance Index (EPI). This index will be derived from various thematic indicators. These thematic indicators will be calculated based on the data available in ESRs of cities in Maharashtra for last 3-5 years.
For calculating EPI, data from the ESRs should be put in a matrix form. Putting data in a matrix format will-
Highlight the unavailable data
Help in tracing trends
Highlight inconsistencies in the data if any
This framework will also serve as a guide for the future ESRs as it defines the format in which the data is to be collected.

Evaluation of Environmental Status Reports
Prepared by Maharashtra Pollution Control Board 26
5.1 Methodology Following things were considered while developing Indicator Framework.
Scale of the cities
Availability of the data in ESR
Prioritization of the issues
Sectors to be covered
Feed back from ULBs and citizens
Keeping this in mind EMC has used following methodology. See Figure 5-1
Review of existing ESRs
Review of other environment reporting systems
Application to pilot study of selected cities
Getting feedback from stakeholders like municipal civil societies & CBOs, citizens of the cities etc
Preparation of the draft report
Preparation of final report
Developing framework for indicators
Based on DPSIR Framework
Recommendations for strengthening of ESRs
Applied to Pune & Mumbai
Review of various indicator programmes
Figure 5-1: Methodology for developing indicator framework for assessment of ESRs

Evaluation of Environmental Status Reports
Prepared by Maharashtra Pollution Control Board 27
5.2 The evaluation framework This framework has been developed based on DPSIR framework. There are 4 levels of indicators defined. Pyramidal structure of the framework is explained in Figure 5-2.
At the base of the indicator pyramid are the data variables. These are the values to be found in ESRs or calculated with the data in ESRs. E.g. in Table 5-1 population growth rate, growth in migrated population and percentage of slum population in the city are data variables. Their values are to be filled in by referring to ESRs. These data variable have been assigned certain weightages. Weights of all the data variables together add up to 100.
Thematic Indicators (4 Nos)
Environmental Performance
Index
Preliminary Indicators (17 Nos)
Data variables (65 Nos)
Figure 5-2: Levels of Indicators
Data variables of the same environmental components are put together to give preliminary indicators. E.g. in Table 5-1 all the components of demographic growth are grouped together to give preliminary indicator of demographic growth.
Preliminary indicators with same theme are grouped together to give thematic indicators which again have certain weightage. E.g. in Table 5-1 demographic growth, economic growth, industrial growth and spatial growth are all components of Growth of the cities. Growth of cities in turn determines pressure on resources.
Adding up score of thematic indicators finally give the apex score, Environmental Performance Index. Figure 5-3 shows the thematic and preliminary indicators.
5-1: Indicator framework
Thematic Indicators
Primary indicators Data variables
Growth of Demographic Population growth rate

Evaluation of Environmental Status Reports
Prepared by Maharashtra Pollution Control Board 28
Growth in migrated population (% Decadal) growth (% 2001)
% of slum population to total population
Work participation ratio
% of people below poverty line.
Average annual per capita income
Economic growth
Ratio of municipal revenue to municipal expenditure
% share of industries in total electricity consumption Industrial growth Number of polluting industries
Population density
cities
Spatial growth (Decadal) % of slum area to city area
Environmental Performance Index
Growth of cities (16.92)
State of resources (21.54)
Urban services (30.77)
Initiatives for improving city environment (30.77)
Demographic growth
Economic growth
Industrial growth
Spatial growth
Land
Air
Water
Energy
Water supply
Sewerage sanitation
Solid waste management
Transport
Priliminary indicators for diagnostic and action planning
Thematic Indicators
Humans
Environmental education
(Weights of the thematic indicators is mentioned next to them.)
All the
prelim
inary indicators under them
e add up
to 100
Waste Management
Slum Improvement
Traffic
Figure 5-3: Thematic and Preliminary Indicators

Evaluation of Environmental Status Reports
Prepared by Maharashtra Pollution Control Board 29
5.3 Scheme of Scoring and weights The scoring is done in such a way that maximum of the score will show the best environmental performance of the city. Following methodology was used to derive the score.
Defining the weights for themes and parameters
These weights were defined as per the contribution of that theme into city environment. Weightages of all the four themes sum up to 100. Table 5-2 gives the initial weightages.
E.g. state of natural resources is the most critical in the city environment. Thus it has been given highest weightages.
Themes were assigned weight according to their importance.
Table 5-2: Initial Weights for Thematic Indicators
Sr. No Thematic Indicators Weight
1 Growth of Cities 25
2 State of Resources 30
3 State of Urban services 25
4 Initiatives for improving city environment
20
Total 100
Data variables of all the preliminary indicators under same theme were assigned weight such that they sum up to 100.
These weights of data variables were then adjusted for number of total data variables in particular theme. This was done using following formula.
Adjusted data variable weight = (Data variable weight x number of data variables under that theme) / Total number of data variables
The sum of adjusted weights of all the data variables under one theme now defined the adjusted weight for that theme. Table 5-3 shows sample calculation for theme of Growth of Cities.
Since there are total 65 data variables and 11 data variables under theme of Growth of Cities the formula becomes
Adjusted data variable weight = (Data variable weight x 11) / 65

Evaluation of Environmental Status Reports
Prepared by Maharashtra Pollution Control Board 30
Table 5-3: Scoring Scheme
Thematic Indicators
Theme_wt
Data variable
adjusted wt Preliminary Indicators Data Variables
Data variables_wt
Adjustment (Data variable weight x 11/65)
25 16.92 Population growth rate 12 2.03
Growth in migrated population (% Decadal) 12 2.03
Demographic growth (% 2001)
% of slum population to total population 12 2.03
Work participation ratio 6 1.02
% of people below poverty line. 12 2.03
Average annual per capita income 6 1.02
Economic growth
Ratio of municipal revenue to municipal expenditure 6 1.02
% share of industries in total electricity consumption 8 1.35
Industrial growth
Number of polluting industries 6 1.02
Population density 8 1.35
Growth of cities
Spatial growth (Decadal) % of slum area to city area 12 2.03

Evaluation of Environmental Status Reports
Prepared by Maharashtra Pollution Control Board 31
After adjustment the weights of thematic indicators were revised as shown in Table 5-4.
Table 5-4: Weights of themes and parameters
Theme Weight Data variable Adjusted Weight
Growth of cities 25 16.92
State of natural resources 30 21.54
Urban Services 25 30.77
Initiatives for improving city environment 20 30.77
Defining Benchmarks for the data variables
A Benchmark is typically based on best practices or an agreed upon industry standard by which others may be measured or judged.
Defining benchmarks is the most important task since the score of the variable is dependant on the benchmark value.
These benchmarks are defined using various sources. For all the data related to the demography, benchmarks are defined by using census figures for state and country. For all the natural resources the benchmark values have been defined using standards defined by various agencies like MPCB, Central Pollution Control Board (CPCB), Urban Development Plans Formulation and Implementation (UDPFI), Central Public Health and Environmental Engineering Organization (CPHEEO) etc. for the variables related to urban services the benchmarks are defined by referring to various studies conducted. E.g. studies by agencies like Asian Development Bank (ADB), Maharashtra Energy Development Agency (MEDA) etc. however some data variables were such that they didn’t have any defined benchmark. E.g. Percentage of slum area to city area or annual fuel consumption of the city, such benchmarks is defined using the values in previous ESRs.
Benchmarks of all the data variables are discussed later in this chapter.
Scoring
As stated earlier the scoring is done in such a way that maximum of the score will show the best environmental performance of the city.
Score of the data variables: The benchmark values are selected as the average score values. Scoring of the variable against benchmark is dependent upon whether that variable is pro environment. For all the pro environment variables higher the value than benchmark, better is the score and vice versa.

Evaluation of Environmental Status Reports
Prepared by Maharashtra Pollution Control Board 32
E.g. Percentage of green area is a pro environment variable. Thus if its value is higher than the benchmark then it will be given better score. On the other hand for air quality parameters crossing the benchmark value will lead to lesser score.
Score of preliminary indicators: Score of the preliminary indicator is sum of scores of all the data variables within it.
Score of thematic indicators: Score of the thematic indicators is the sum of scores of all the preliminary indicators within it.
Environmental Performance Index: This apex score is given by summing up scores of all the thematic indicators.
Table 5-5 shows sample calculation of score for theme of Growth of Cities.

Evaluation of Environmental Status Reports
Prepared by Maharashtra Pollution Control Board 33
Table 5-5: Excel model for scoring
Themes Theme weight
Parameter adjusted weight
Components Parameters Parameters weight Adjustment Redistributed
weight Rating Weighted scores
25 20.00 Population growth rate 12 2.40 6.1 2.00 12.29
Growth in migrated population (% Decadal) 12 2.40 0.0 0.00 0.00
Demographic growth (% 2001)
% of slum population to total population 12 2.40 6.1 2.00 12.29
Work participation ratio 6 1.20 0.0 0.00
% of people below poverty line. 12 2.40 6.1 10.00 61.45
Average annual per capita income 6 1.20 0.0 0.00 0.00
Economic growth
Ratio of municipal revenue to municipal expenditure 6 1.20 0.0 0.00 0.00
% share of industries in total electricity consumption 8 1.60 0.0 0.00 0.00
Industrial growth
Number of polluting industries 6 1.20 0.0 0.00 0.00
Population density 8 1.60 0.0 0.00 0.00
Growth of cities
Spatial growth (Decadal)
% of slum area to city area 12 2.40 6.1 8.00 49.16
100 20.00 0.0

Evaluation of Environmental Status Reports
Prepared by Maharashtra Pollution Control Board 34
5.4 Thematic indicators This section explains thematic indicators, primary indicators and data variables developed. It also explains the score ranges defined for all the data variables.
5.4.1 Growth of the cities:
Growth of the cities has many dimensions. Under D-P-S-I-R framework this theme mainly relates to the driving forces that are acting on the city. Growth of the city invariably means more consumption of resources. Thus it is one of the crucial parameters. In order to consider all layers of city’s growth there are 4 preliminary indicators under this theme. Table 5-6 shows the preliminary indicators and the data variables under them.
Table 5-6: Growth of cities
Thematic Indicators
Preliminary indicators Data variables
Population growth rate
Growth in migrated population (% Decadal) Demographic growth (% 2001)
% of slum population to total population
Work participation ratio
% of population below poverty line.
Average annual per capita income Economic growth
Ratio of municipal revenue to municipal expenditure
% share of industries in total electricity consumption Industrial growth
Number of polluting industries
Population density
Growth of cities
Spatial growth (Decadal) % of slum area to city area
Demographic growth: Demographic growth will determine the pressure on the natural resources. Demographic growth of the city is a function of natural growth in population, growth in migrated population and growth in number of urban poor. Thus these are considered as data variables. Since growth of the city

Evaluation of Environmental Status Reports
Prepared by Maharashtra Pollution Control Board 35
population varies with the cities National and State growth rates are taken as average.
Score ranges for these variables are as shown in the Table 5-7.
Table 5-7: Scoring-Demographic Growth
Score range Data variable Unit
10 8 6 4 2 0 Remarks Source
Decadal population
growth rate
% <15 15-20 21-25 26-30 >30 Data not available
Decadal population growth rate
of Maharashtra
21.54% taken as
baseline for defining average
Census 2001
Growth in migrated
population % <10 10-15 16-20 21-25 >25 Data not
available
Decadal rate of migrated
for India 17% taken as baseline.
Census 2001 Data tables
% of slum population
to total population
% <20 21-25 26-30 31-35 >35 Data not available
Average of India 15% taken as baseline
Census 2001
Economic growth: Along with demographic growth city also undergoes economic growth. Economic growth of the city results in better employment opportunities and also better revenue for municipal bodies. Four data variables have been considered for this indicator. Work participation rate is an indicator of the employment levels in the city. Population bellow poverty line and average annual income determine the standard of living and ratio of municipal revenue to municipal determines the financial condition of the municipal body.
Score ranges for these variables are as shown in the Table 5-8.
Table 5-8: Scoring- Economic Growth
Score range Data variable
Unit
10 8 6 4 2 0 Remarks Source

Evaluation of Environmental Status Reports
Prepared by Maharashtra Pollution Control Board 36
Work participati
on rate >55 46-
55 36-45
26-35
0-25 Data not
available
Work participation
rate of Maharashtra taken as base
Census 2001
% of population
bellow poverty
line
% <20 21-25
26-30
31-35
>35 Data not
available
Average BPL population of India taken as
baseline
Article in INDIA
Together, 17 March
2006
Average annual per
capita income
Thousan
d INR
>35 31-35
21-30
10-20
<10 Data not
available
Decided based on Average annual per
capita income for India
www.indiabudget.nic.i
n
% of budget
spent on Environm
ental Infrastruct
ure
>45 41-45
31-40
21-30
0-20 Data not
available
Budget spent on Bio Medical
Waste, Municipal Solid
Waste and Sewage
Treatment Plants to be considered.
ULB Annual
Accounts
Industrial Growth: Industrial growth is one of the key factors responsible for pollution of natural resources. Thus it is also a determinant of pressure. Under this share of industries in electricity consumption is used as indicator of industrial growth. Polluting industries are dealt separately with number of polluting industries as indicator. While growth in non polluting industries can be in favour of city increase in polluting industries can deteriorate the environment of the city.
Score ranges for these variables are as shown in the Table 5-9.
Table 5-9: Scoring-Industrial Growth
Score range Data variable
Unit
10 8 6 4 2 0 Remarks Source
% share of industries in
total electricity
consumption
% <20 21-25
26-30
31-35 >35 Data not
available
% share of industries
in electricity
consumption of India used as
Maharashtra Energy
Development Agency www.maha
urja.com

Evaluation of Environmental Status Reports
Prepared by Maharashtra Pollution Control Board 37
baseline
% of polluting
industries to total
industries
% <11 11-20
21-40
41-60 >60 Data not
available Based on ESR data ESR
Spatial growth: As city expands demographically, spatial expansion of the city is bound to happen. Spatial growth of city is an important parameter of growth because it determines the pressure on land. Population density is used as an indicator of spatial growth based on the premise that if spatial growth of the city is not in pace with the population growth it will reflect in the built environment of the city, prices of the land and increase in slums of the city. Thus the second indicator used is % of slum area to the city area.
Score ranges for these variables are as shown in the Table 5-10.
Table 5-10: Scoring- Spatial Growth
Score range Data variable
Unit
10 8 6 4 2 0 Remarks Source
Population density
Persons/s
q Km
<275 276-300
301-500
501-1000
>1000 Data not
available
Population density of
Maharashtra taken as baseline
Census 2001
% of slum area to
city area % <2 3-5 6-8 9-12 >12 Data not
available Based on ESR data ESR
5.4.2 State of resources This theme deals with natural resources like land, air, water and energy; which is a manmade resource. This theme is a mix of State, Pressures and Impact in the D-P-S-I-R framework. E.g. air quality, water quality are indicators of state of resources while discharges of untreated effluent is an indicator of pressure. Humans are considered as one of the resources. However state of humans actually reflects the impacts of various activities.
Preliminary indicators and data variables considered under this theme are as shown in Table 5-11

Evaluation of Environmental Status Reports
Prepared by Maharashtra Pollution Control Board 38
Table 5-11: State of resources
Landuse
% of green area to the total city area Land
Green area per 1000 persons
Ambient air quality Air
Noise
Discharges of untreated industrial effluent
Water quality-Sea
Water quality-River Water
Water quality-Lakes
Per capita energy consumption
Share of renewable energy Energy
Annual fuel consumption- Petrol
Crude death rate
State of resources
Human Infant mortality rate
Land: Pressure on the land and state of land can be determined by the landuse pattern of the city. Urban Development Plan Formulation and Implementation (UDPFI) Guidelines give desirable landuse for the city. Thus compliance with UDPFI guidelines is considered as one indicator. Green areas are the lungs of the city. Their percentage to the city area is one of the critical indicators of the health of the city. Also considered as one indicator is green area per person
Score ranges for these variables are as shown in the Table 5-12.
Table 5-12: Scoring-Land
Score range Data variable
Unit
10 8 6 4 2 0 Remarks Source

Evaluation of Environmental Status Reports
Prepared by Maharashtra Pollution Control Board 39
Landuse
Number of uses e.g.
residential, commercial
etc. complying
with UDPFI
guidelines
>5 5 4 3 <2 Data not available
% of green areas to
city areas >20 16-
20 11-15
5-10 <5 Data not
available
Green area per 1000 person
Ha/person >2.0
1.6-2.0
1.1-1.4
0.5-1 <0.5 Data not
available
UDPFI Guidelines are taken as
baseline There are
total 7 land uses
mentioned in UDPFI
Guidelines.
UDPFI
Air: Air is one of the most important natural resources. Today the air quality of cities is threatened by vehicular and industrial emissions. Thus ambient air quality is considered as one of the indicators. Noise has been defined as an important parameter of Air quality. Thus it is used as second data variable.
Score ranges for this variable are as shown in the Table 5-13.
Table 5-13: Scoring-Air
Score range Data variable
Unit
10 8 6 4 2 0 Remarks Source
Ambient air quality
Number of parameters e.g. Sox,
Nox, CO etc. complying with
CPCB Guidelines
>5 5 4 3 <2
Data not
available
National ambient
air quality standards
CPCB
Noise
% of critical junctions not
complying with noise standards
<10
11-20
21-
40
41-
60 >60
Data not
available
ESR data ESR
Water: with population growth and economic growth consumption of water resources has increased many folds. Also pollution of surface and ground water resources has become a common phenomenon. Thus water quality for sea, river and lake and discharge of untreated industrial effluent are the indicators used.
Score ranges for this variable are as shown in the Table 5-14.

Evaluation of Environmental Status Reports
Prepared by Maharashtra Pollution Control Board 40
Table 5-14: Scoring-Water quality
Score range Data variable
Unit
10 8 6 4 2 0
Remarks Source
% of untreated industrial effluent
discharged
<20 20-40
41-60
61-80 >80 Data not
available
Water quality
Number of parameters e.g. pH,
TDS, BOD complying with
MPCB Guidelines
>8 8 6 5 <5 Data not available
As specified by MPC
B
MPCB
Energy: energy has become a key resource for development. In a wider perspective, energy is linked with an issue of CO2 emissions and in turn to climate change. Thus per capita consumption of energy is used as one indicator. Also important is the share of renewable energy. Thus it also is included as one of the indicators. Various fuels are also form of energy. Thus looking at the data availability, annual fuel consumption by the city is also considered as one of the indicators.
Score ranges for these variables are as shown in the Table 5-15.
Table 5-15: Scoring-Energy
Score range Data variable
Unit
10 8 6 4 2 0 Remarks Source
Per capita energy consumption
Kwh/
Annum
<300 301-350
351-400
401-500 >500
Data not
available
Per capita electricity
consumption of India taken as average
Maharashtra Energy
Development Agency
www.mahaurja.com
% share of renewable energy
>2.5 1.6-2.5
1.1-1.5
0.5-1 <0.5
Data not
available
% share of renewable energy in
India taken as baseline
Maharashtra Energy
Development Agency
www.mahaurja.com

Evaluation of Environmental Status Reports
Prepared by Maharashtra Pollution Control Board 41
Annual fuel consumption- Petrol
Lakh Lts <2 2.1-
3 3.1-
4 4.1-
5 >5
Data not
available
Derived from ESR
data ESR
Humans: Humans are one of the important resources. They are the ones which are directly affected by environmental conditions of the city. Thus crude death rate and infant mortality rate are taken as indicators. Ideally population affected by respiratory diseases is also a good indicator of impact of air pollution. But looking at the data availability it is not in the scope of this framework.
Score ranges for these variables are as shown in the Table 5-16.
Table 5-16: Score-Humans
Score range Data variable
Unit
10 8 6 4 2 0 Remarks Source
Crude death rate % <4 5-6 7 7.1-
10 >10 Data not available
Crude death rate of Maharashtra taken
as baseline
Census 2001
Infant mortality %
<20
20-30
31-35
36-45 >45 Data not
available
Infant mortality rate of Maharashtra
taken as baseline
Census 2001
5.4.3 Urban Services Urban services are as important as the natural resources as in cities, they have a major role in defining quality of life. Total four services are assessed; water supply, sewerage, solid waste management and transportation. While assessing the services two things are considered; service coverage and the service levels.
Preliminary indicators and data variables considered under this theme are as shown in Table 5-17.
Table 5-17: Urban Services
Net LPCD
% of households connected by service connection
Unaccounted for water
Average tariff
Urban services
Water Supply
Staff per 1000 connections

Evaluation of Environmental Status Reports
Prepared by Maharashtra Pollution Control Board 42
% of population catered to by underground sewer network
% area covered with collection to total city area
% of slum population served by pay and use toilets
% of untreated sewage
Sewerage Sanitation
Staff per 1000 connections
Total SW generated per capita
Life of landfill site
% of waste disposed into landfill site to total waste generated
% of waste collected to total waste
Compliance with MSW Rules
% biomedical waste treated to total BM waste
Solid Waste Mgmt
% of Wet waste treatment at ward level
Road area as % of ward area
% of population travelling by public transport Transport
% of accidents in city to number of accidents in India
Water Supply: Net LPCD and % of population covered by water supply network are the indicators of service coverage. Net LPCD is a direct indicator of water availability thus of pressure on water resources. Unaccounted for water and average tariff determine the consumption of water. More unaccounted for water and less average tariff often result in unreasonable use of water. These two are service level indicators. One more indicator used for service level is staff per 1000 connections.
Score ranges for these variables are as shown in the Table 5-18.
Table 5-18: Scoring-Water Supply
Score range Data variable
Unit
10 8 6 4 2 0 Remarks Sour
ce

Evaluation of Environmental Status Reports
Prepared by Maharashtra Pollution Control Board 43
Net supply of water lpcd
>150 141-150
131-140
91-130
<90 Data not
available As specified in CHPEEO
CPHEEO
Unaccounted for water %
>75 61-75 51-60
26-50
0-25 Data not
available
Staff/1000 connections Persons
<10 11-15 16-20
21-25
>25 Data not
available
As specified in CHPEEO
CPHEEO
Average water tariff Rs/cum
>5 3.1-5 1.6-3 <1.5
Fixed
rate
Data not available
% of household connected by service connection %
>30 26-30 21-25
11-20
<10
Data not available
ADB Study ADB
Sewerage and sanitation: % population catered to by underground sewer network, % area covered with collection to total city area and % of slum population served by pay and use toilets are the service coverage indicator. % population catered to by underground sewer network and % of slum population catered to by pay and use toilets are indicators of hygiene conditions in the city. Untreated sewage is a service level indicator which determines the water pollution in the city as the rest of the sewage goes untreated to some river or nallahs in the city.
Score ranges for these variables are as shown in the Table 5-19.
Table 5-19: Scoring-Sewerage and sanitation
Score range Data variable
Unit
10 8 6 4 2 0 Remarks Source
% of untreated sewage >75 61-
75 51-60
26-50 <25
Data not
available
Untreated sewage
quantity of Maharashtra
taken as baseline
www.indiaenvironmentalportal.org
% Area covered for
sewage
>75 61-75
51-60
26-50
<25 Data not
availa
Computed based on the data of Surat
www.suratmunicipal.org

Evaluation of Environmental Status Reports
Prepared by Maharashtra Pollution Control Board 44
collection ble
% of population
catered to by underground
sewer network
>75 61-75
51-60
26-50 <25
Data not
available
and Amritsar
% of slum population
served by pay and use toilets
<25 25-30
31-35
36-40 >40
Data not
available
Computed based on
ADB study ADB
Staff/1000 connections
Persons
>30 26-30
21-25
11-20 <10
Data not available
As specified in CHPEEO CPHEEO
Solid waste management: Solid waste management is the most critical service for the health and hygienic conditions of the city. Total SW generation per capita is an indicator of consumption pattern of the city. More the consumption more is the waste generation. Life of landfill site determines the hygiene conditions of the city. If life is over and still it is being loaded it will start affecting the land, water, air and health of people and various eco-systems of the surrounding area. % of waste disposed into landfill site is again a critical indicator of hygiene conditions in the city. If all the untreated waste in not disposed in the landfill then chances is there that it is being dumped at some locations in the city. This is very hazardous. % waste collected to total waste, % of biomedical waste treated and % of wet waste treated are service efficiency indicators.
Compliance with MSW Rules is an indicator of landfill site facility. If that is not according to the standards then proximity of this site is dangerous to the environment of surrounding area. This indicator has checklist of questions listed in Table 5-20.
Table 5-20: Compliance with MSW rules
Sr. No.
Question Score for Yes
Score for No
1 Is there waste inspection facility at the landfill site?
2 1
2 Is there weighing bridge? 2 1
3 Are land compactors used? 2 1

Evaluation of Environmental Status Reports
Prepared by Maharashtra Pollution Control Board 45
4 Are storm water drains in place? 2 1
5 Is 1.5 mm HDPE liner used? 2 1
6 Is the lechate collection facility in place? 2 1
7 Is there waste to energy plant? 2 1
8 Is there health inspection facility for workers? 2 1
Score ranges for these variables are as shown in the Table 5-21.
Table 5-21: Scoring- Solid Waste Management
Score range Data variable
Unit
10 8 6 4 2 0 Remarks Source
SW Generation per capita
gm <20
0 201-350
351-400
401-500
>500 Data not
available
Life of landfil site Years >18 16-
18 13-15
10-12 <10 Data not
available
% waste disposed to landfill site
>85 71-85
61-70
51-60 <50 Data not
available
As specified
in CHPEEO
CPHEEO
Collection efficiency % >13 10-
12 7-9 4-6 0-3 Data not available
% BMW treated to
total BMW >80 61-
80 41-60
21-40 <20 Data not
available
% Wet waste treated to total Wet
waste
>80 61-80
41-60
21-40 <20 Data not
available
Solid waste
management in India
www.europa.e
u
Compliance with MSW
Rules Score
<200
201-350
351-400
401-500
>500 Data not
available
Score calculated based on
the questions
MoEF
Notification
New Delhi, 25/09/2000

Evaluation of Environmental Status Reports
Prepared by Maharashtra Pollution Control Board 46
Transport: Air emissions from transportation and other industries are the main causes of air pollution. Thus transportation is a very important indicator of pressure on air. State of public transport in a city determines the number of private vehicles plying in the city and in turn the air emissions by them. Thus population travelling by public transport is considered as one indicator. % of road area to ward area is also taken as an indicator because it will determine the condition of traffic congestion. % of accidents is considered as one indicator.
Score ranges for these variables are as shown in the Table 5-22.
Table 5-22: Scoring- Transportation
Score range Data
variable Unit
10 8 6 4 2 0 Remarks Source
% of road area to
ward area >15 12-
15 9-11 7-8 <7
Data not
available
UDPFI Guidelines UDPFI
% population travelling by public transport
>85 76-85
61-75
40-60 <40
Data not
available
% population travelling by
public transport in Mumbai
taken as baseline
Article in INDIA
Together, November
2004
% of public
vehicles running on
CNG
>75 61-75
51-60
26-50 <25
Data not
available
4 lakh of accidents in
India per annum
Department of Road
Transport and
Highways GOI
5.4.4 Initiatives for improving city environment This part of indicator framework is based on Yes/No type questions. Table 5-23 lists the questions. 8 is the score for answer ‘Yes’ and 2 is the score for answer ‘No’. These questions are designed for four types of initiatives found common in the city. This section has been detailed out little more than the draft version of the Framework.
Table 5-23: Yes/No type questions
Are there any training programmes for teachers for Environmental education?
Are there any plantation schemes for schools?
Environmental education
Is there community participation for managing gardens of the city?

Evaluation of Environmental Status Reports
Prepared by Maharashtra Pollution Control Board 47
Is dry and wet waste collected separately?
Are there any waste to Energy Projects on the city landfil site?
Is there PPP in waste management for the city?
Is there Methane Gas Recovery Project at city landfill site?
Is there community participation for storage, collection and disposal of waste?
Waste Management
Are there any funds allocated for Research and Development for Waste Management Technologies?
Is there PPP for management of public toilets?
Are there any public toilets managed by CBOs or NGOs?
Are there community centres provided for slums?
Are there any adult education schools or classess in slums run by ULB?
Slum Improvement
Has the ULB provided for Community Health Centres?
Are there any paths dedicated to bicycle or pedestrian movement?
Is there allocation of Public Transport Fund?
Is there GPS-based On Line Bus Tracking System for the city transport?
Are there Microprocessor based ticket vending machines for busses
Is there Online ticket accounting system?
Traffic
Is there RFID & GPS based Smart Card system for public transport?
5.5 Microsoft Excel™ model for scoring
Purpose
This Microsoft Excel™ model is developed for application of indicator framework described earlier in this chapter. The purpose of this Microsoft Excel™ model is to provide a common platform in the form of score for cities against which environmental performance of cities can be judged. Score of Environmental Performance Index can be determined with this Excel worksheet.

Evaluation of Environmental Status Reports
Prepared by Maharashtra Pollution Control Board 48
Structure
As you open the excel sheet Menu is displayed on the first worksheet. A brief introduction to the framework and key instructions for operating the worksheet are displayed. Menu links to different worksheets.
Menu has following options
1. Input Data: This option links to the worksheet where, in order to calculate the EPI of a city, user needs to enter values for data variables. These values can be found in the ESRs.
2. View Result: After entering the data the score for various thematic indicators and the apex score for EPI is calculated. ‘View Results’ option will direct user to the results. User can view all the thematic scores and apex score. These scores are also represented in the form of graphs.
3. View Manual: This option links to the user manual for this excel model. The manual explains the background of the indicator framework, detailed methodology used for developing the framework, the scoring scheme, scoring parameters and detailed method for using this manual.
4. View Examples: this framework was applied on pilot basis to Mumbai and Pune. User can view results for this pilot application.
Figure 5-4 and Figure 5-5 show the Microsoft Excel Model.

Evaluation of Environmental Status Reports
Prepared by Maharashtra Pollution Control Board 49
Figure 5-4: Main Menu for the Microsoft Excel Model for scoring
Data Input
Data has to be entered referring the ESRs of the cities. Instructions for entering data for various data variables are given in the sheet. Certain data variables need to be calculated from data in ESRs. Methods for calculation and the score range defined for various data variables are given further in this chapter.
However not all the data is available in ESRs. Thus certain cells will remain vacant. Thus the excel model is developed in such a way that if a cell for any data variable is vacant then its weight is distributed amongst all the other data variables in the proportion of their own weight.

Evaluation of Environmental Status Reports
Prepared by Maharashtra Pollution Control Board 50
Figure 5-5: Data Input sheet for scoring
Output
The output will be in the form of score of EPI. The scores of more than one city can be compared. These scores can be viewed in graph form as well.

Evaluation of Environmental Status Reports
Prepared by Maharashtra Pollution Control Board 51
6 Application of the Indicator framework to the cities in Maharashtra
The Indicator Framework developed by EMC was applied to Pune and Mumbai on pilot basis. Result & the analysis of the result are presented further in this chapter. After the pilot application the framework was applied to 12 other cities in Maharashtra.
Arranging for ESRs of various cities was MPCB’s responsibility. Total 44 ESRs were received & reviewed. Figure 6-1 shows on map of Maharashtra, cities, ESRs of which were reviewed. Table 6-1 lists the total number of ESRs received and reviewed.
Ambarnath‐3
NaviMumbai‐ 2
Ulhas Nagar‐ 2
KalyanDombivali‐ 4
BhivandiNizampur‐2 Ahmednagar‐3
Nashik‐4
Jalgaon‐1
Bhusawal‐3
Aurangabad‐1
Mumbai‐ 5
Pune‐8
Malegaon‐4
Figure 6-1: ESRs reviewed
Table 6-1: ESRs Reviewed
City Number of ESRs reviewed
City Number of ESRs reviewed
1. Navi Mumbai 2 7. Malegaon 4
2. Bhivandi- Nizampur 2 8. Jalgaon 1

Evaluation of Environmental Status Reports
Prepared by Maharashtra Pollution Control Board 52
3. Kalyan- Dombivali 4 9. Bhusawal 3
4. Ambernath 3 10. Aurangabad 1
5. Ulhas Nagar 2 11. Ahmednagar 3
6. Nashik 4 12. Pimpri- Chinchwad 2
Total number of ESRs reviewed (Excluding Pune & Mumbai) 33
Total number of ESRs reviewed (Including Pune & Mumbai) 44
Too many data gaps were observed while applying the indicator framework, especially to all the cities excluding Pune and Mumbai. Thus for these cities data has been analysed in a checklist form to understand the data gaps. Since such unavailable data will cause a skewed score, EPI has been calculated only for Pune and Mumbai.
6.1 Pilot application for Pune and Mumbai Total Six ESRs of Pune (From year 2001-02 to 2006-07) and Five ESRs from Mumbai (Year 2002-02 to 2006-07) were reviewed.
In order to compare the scores of the two or more cities and of two or more years, it is necessary that the data available is of the same degree; only then the scores will be compatible to compare with each other.
Inconsistent data in case of pilot application of framework to Pune and Mumbai did not allow intercity temporal comparison of the scores. In order to compare the scores cities have to report at least a limited number of indicators consistently. These indicators have been listed as Core Indicators in Table 6-2.
Table 6-2: Core Indicators
Thematic Indicators Preliminary Indicators Data variables
Demographic growth (% 2001) Population growth rate
Economic growth Work participation ratio Growth of cities
Spatial growth (Decadal) Population density
Land Landuse State of natural resources
Air Ambient air quallity

Evaluation of Environmental Status Reports
Prepared by Maharashtra Pollution Control Board 53
Water quality- River
Per capita energy consumption Energy
Infant mortality rate
Net LPCD
% of households connected by service connection
% of population catered to by underground sewer network
Water Supply
% of untreated sewage
Total SW generated
Life of landfill site
Urban Services
Solid Waste Mgmt
% of population travelling by public transport
Instead of calculating the Index with available data, better approach would be collecting the data in the format required for calculating the Index. This will in turn standardize the data format.
Large variation in the scores of consecutive years shows the inconsistency in data. Inconsistency in data is illustrated in Table 6-3 and Table 6-4. Out of total 65 data variables data for only 6 data variables was available in ESRs of Mumbai for year 2002-2007. In case of Pune consistent data was available only for 3 data variables out of 65.
Table 6-3: Data Availability for Mumbai
2002-03 2003-04 2004-05 2005-06 2006-07
Population Growth Rate 20.1 20 20.6 20.6 20.6
% of slum population to total population 55 60 60 60 60
Population Density 27250 43583 43583 43583 43583
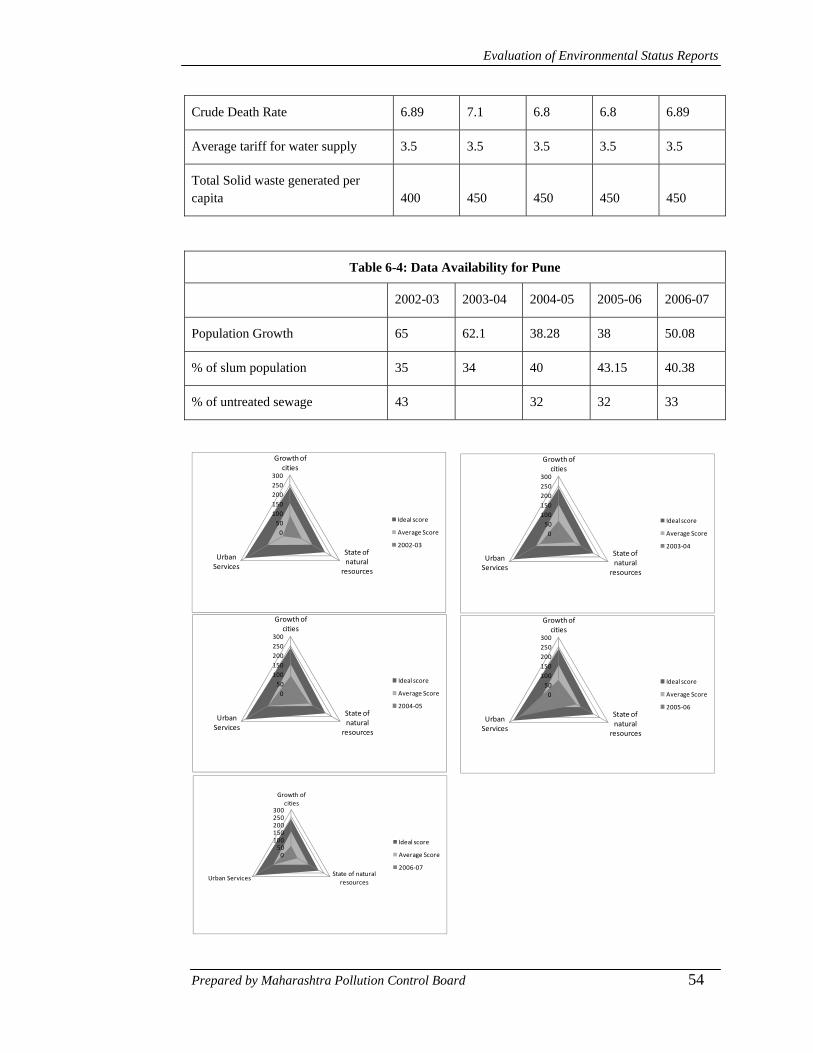
Evaluation of Environmental Status Reports
Prepared by Maharashtra Pollution Control Board 54
Crude Death Rate 6.89 7.1 6.8 6.8 6.89
Average tariff for water supply 3.5 3.5 3.5 3.5 3.5
Total Solid waste generated per capita 400 450 450 450 450
Table 6-4: Data Availability for Pune
2002-03 2003-04 2004-05 2005-06 2006-07
Population Growth 65 62.1 38.28 38 50.08
% of slum population 35 34 40 43.15 40.38
% of untreated sewage 43 32 32 33
050
100150200250300
Growth of cities
State of natural
resources
Urban Services
Ideal score
Average Score
2002‐03
050
100150200250300
Growth of cities
State of natural
resources
Urban Services
Ideal score
Average Score
2003‐04
050
100150200250300
Growth of cities
State of natural
resources
Urban Services
Ideal score
Average Score
2004‐05
050
100150200250300
Growth of cities
State of natural
resources
Urban Services
Ideal score
Average Score
2005‐06
050
100150200250300
Growth of cities
State of natural resources
Urban Services
Ideal score
Average Score
2006‐07

Evaluation of Environmental Status Reports
Prepared by Maharashtra Pollution Control Board 55
Figure 6-2: Star diagrams for the thematic indicators-Pune
Thematic scores with application of the indicator framework were calculated for Pune and Mumbai. As regards to the application of the theme on ‘Initiatives for improving city environment’, adequate data was not available in the ESRs. Hence this theme was not applied in the pilot application. Thematic scores for Pune and Mumbai are shown in the form of star diagrams in Figure 6-2 and Figure 6-3.
050
100150200250300
Growth of cities
State of natural resources
Urban Services
Ideal score
Average Score
2002‐03
050
100150200250300
Growth of cities
State of natural
resources
Urban Services
Ideal score
Average Score
2003‐04
050
100150200250300
Growth of cities
State of natural
resources
Urban Services
Ideal score
Average Score
2004‐05
050
100150200250300
Growth of cities
State of natural
resources
Urban Services
Ideal score
Average Score
2005‐06
050
100150200250300
Growth of cities
State of natural resources
Urban Services
Ideal score
Average Score
2006‐07
Figure 6-3: Star diagrams for the thematic indicators-Mumbai

Evaluation of Environmental Status Reports
Prepared by Maharashtra Pollution Control Board 56
6.2 Observations from analysis
As stated earlier because unavailability of the data, ESR of the cities other than Pune and Mumbai the indicator framework was applied in a checklist form.
In the process we came across many issues regarding the structure of the ESRs and the data presented. Given bellow is the observation while reviewing these ESRs.
6.2.1 Pune 1. Raw data presented in large tables. Though the standards are given along with
it, one easily gets lost in the numbers. Instead compared data can be presented in tables where the numbers crossing threshold limit can be highlighted.
E.g.
ESR 2004-05 Water Chapter gives data of drinking water analysis of Parvati Water supply centre along with table of standards. Mentioning results of comparison would make it easier to grasp.
2. Information presented without analysis.
E.g.
In ESR 2003-2004 landuse is providing a skewed picture data because of adding 23 fringe villages. It is not reflected.
3. Format of the ESR, kind of information presented differs every year. Thus it is difficult to do temporal comparison with inconsistent data.
E.g.
Table 6-5 shows sub heads in Solid waste chapter in ESR 2005-06 and 2006-07
Table 6-5: Solid waste chapter in ESR 2005-06 and 2006-07
ESR 2005-06 2006-07
Responsibilities of Municipal Authority under MSW Rules 200
Principles of solid waste management
Type of waste generated Initiatives by PMC
Waste segregation, Collection, Treatment , Disposal
Role of rag pickers
Food waste, construction waste, bio-medical waste, slaughterhouse waste,
Vermi culture, biomethanation/anaerobic digestion

Evaluation of Environmental Status Reports
Prepared by Maharashtra Pollution Control Board 57
domestic hazardous waste
Note on plastic ban Waste segregation, waste separation on ghantagadis, waste collection,
Biomedical waste management
Note on Chakachak toli
Projects coming up in near future
Setting up a decentralised waste processing facilities
4. Many details mentioned in data can not be used as indicator of any environmental component or urban service. Also many key details are not mentioned in the information.
E.g.
Solid Waste chapter of ESR 2005-06 mentions types and number of waste collecting vehicles but it does not mention the % of waste collected. It also gives the number of vehicles used for transportation but does not give any detail on how much of the total waste generated in the city goes to landfill site.
5. Incomplete data is presented which does not give clear idea about state of that environmental component or urban service.
E.g.
ESR 2006-07 Solid Waste chapter, Table 12.2 Approximate daily Ward wise generation of solid waste gives data of only 6 wards out of 15 wards
ESR 2005-06, air quality data of only Karve Road centre only for month of May 2006 is presented
ESR 2004-05 noise data for only one location given
6. Data not represented in maps makes it difficult to relate the problem to its location in the city, nearby affected areas etc.
E.g.
ESR 2006-07 Table 14.1 Air quality monitoring data can be represented on maps.
7. While giving data on same components the units of data differs which makes comparison of the data over the years difficult?
E.g.

Evaluation of Environmental Status Reports
Prepared by Maharashtra Pollution Control Board 58
Table 6-6 shows the inconsistency in the data because ESR 2005-06 mentions fuel consumption by transport sector, while ESR 2004-05 mentions annual fuel consumption
Table 6-6: Fuel consumption data from Pune ESR 2004-05 and 2005-06
Sr. No.
ESR 2004-05 ESR 2005-06
1. Petrol consumption of 2004-05
1124111 Petrol consumption of 2005-06
93744
2. Diesel consumption of 2004-05
1577701 Diesel consumption of 2005-06
10239
3. Natural Gas consumption of 2004-05
209595 Natural Gas consumption of 2005-06
1074
8. Adjectives like ‘nearly’, ‘almost’, ‘about’ used but precise number not mentioned.
9. Grammar and spelling mistakes are found
ESR of Pune for Year 2007-2008 has been prepared with 2 different sections. First section includes sustainable indicators for wards. These indicators have been adopted from CEROI which follow Agenda 21. The second section includes is an extension of the usual framework of data collection and interpretation as done from past several years. It is the first time that Sustainable Indicators are made a part of report.
After studying the report following are the observations made.
1. The indicators have been developed based on available data rather than the significance of the indicators. Thus the report does not lay a foundation for future format of data collection for developing other indicators.
2. Scoring scheme for the indicators needs better explanation.
3. Benchmark values for all the indicators for indicating whether the score is good or bad, are not defined. The whole purpose of indicators i.e. to assess the environmental performance is thus not served.
4. The two sections of the reports remain as two different compartments with little overlap between them.

Evaluation of Environmental Status Reports
Prepared by Maharashtra Pollution Control Board 59
5. The document does not emerge in action plan.
6. Recommendations made at the end are too generic.
7. Though effort of indicators is made, compartmentalised approach for analysis still prevails.
8. All indicators together fail to give a complete picture of city environment and bring out key issues.
6.2.2 BrihanMumbai
1. The ESR format and body of the content remains the same from 2002-03 to 2006-07 with minor additions.
E.g.
• Respiratory health data and mandating of rain water harvesting has been added from 2003-04 ESR onwards
• Details for future plans by BEST to reduce air pollution and land cover details have been added from 2004-05 ESR onwards
• Strategies for rain water harvesting has been added from 2005-06 ESR onwards
The data readings for air, water, noise quality, industries under red–orange category etc are the only factors that change between the subsequent documents. Figures for water supply service connections which could change over the year’s remains the same through all the five ESR’s.
2. The ESR’s descriptive details of undergoing projects in various sectors like sewerage, water supply rather than statistical details.
E.g.
‘Water quality at 1km line from shore has moderately improved and fishermen have expressed satisfaction over greater quantity and variety of fish’. Such statements do not give an idea of the level of improvement and cannot be used for comparing across ESR’s
‘Most of the garbage is disposed off at 3 dumping sites’ does not tell the percentage of waste disposed which is an important indicator.
This style of description is followed in every sector
3. The ESR gives contradicting status in some sectors.
E.g.

Evaluation of Environmental Status Reports
Prepared by Maharashtra Pollution Control Board 60
Under Biomedical Waste, the generation of waste by municipal and private medical institutions totals to 10 tonnes/day and also mentions the functioning of a centralized bio-medical waste treatment facility capable of handling 10 tonnes/day at GTB hospital. On the other hand it also mentions that the waste collected is 3.5 tonnes/day and disposed in the incinerator plant at Taloja due to closure of Sewree facility on account of emission problems.
In solid waste the text mentions that life of landfill at Gorai is over while the relevant table in the latter half of the document gives a remaining life span of 1-1.2 years
4. Some indicators important for determining the environmental status of the city like water supplied per capita per day, unaccounted water, vital details like toilet provision in slums, population served by sewerage connection have not been covered under their respective sectors.
5. The data from tables have been summarized and the actual tables have been provided at the end with references to them in the text.
6. The ESR includes data under various sectors which cannot be compared or used in analysis to give the status of environment.
E.g.
In sewage collection and disposal system ‘Colaba, Worli, Bandra, Versova, Malad, Ghatkopar and Bhandup having average dry weather flow capacities for the year 2005 at 41.10MLD, 756.90 MLD, 796.8 MLD, 131.30 MLD, 280.4 MLD, 386.1 MLD and 176.1 MLD respectively’ does not tell the reader whether such capacities are sufficient or there exists gap between sewage generation and treatment.
7. Towards the end, an attempt has been made to bring out the gaps in data due to which analysis of status was difficult which again remains the same through all the ESR’s
8. The report also includes a section on action planning which identifies the need for undertaking projects for improvement.
9. Salient features of Mumbai’s environment have been listed at the end of the report which also gives a status comparison to previous year data.
6.3 Application to other cities As stated earlier due to data gaps, ESRs of the cities other than Pune & Mumbai were reviewed in a checklist form. Data availability was approximately 25 to 30%. Figure 6-4 shows the statistics of the data availability. % of data availability about a particular data variable is shown in front of that data variable.
Given below are some general observations for all the ESRs. Other than Data Availability, rest of the observations are similar to that of Pune and Mumbai.

Evaluation of Environmental Status Reports
Prepared by Maharashtra Pollution Control Board 61
Looking at this enormous responsibility, the ESR has to elevate from being an environmental status report to being the trigger for positive environmental action plans in the State. This translation, more often than not, is the weakest in most ESRs. The crux of the ESR remains sparse and does not draw meaningful inferences from which policy makers can make positive decision responses. These are typical observations for all ESRs in India as well as abroad.
As far as the role that ESRs are playing in the decision making, on the basis of the observations so far, we can outline a few outstanding issues that are not being addressed by ESRs. As a result of these issues the ESRs are unable to get off the ground in the form of environmental action plans. The environmental considerations are still sidelined in important sectoral policies and plans, thereby giving little credibility to the exercise of ESRs. The outstanding ESR issues can be enumerated as follows:
Missing Data
Most of the ESRs do not report complete information on key themes and on a consistent basis. Sometimes, the sources of information are not available
E.g.
1) For Demographic growth, decadal population growth rate is given in all the ESRs but data about % of migrated population which is an important aspect of population growth is not given.
2) For water supply, net water supply by municipality to the city is given but details about % of population served with service connections, % of unaccounted for water is not given.
For theme Growth of Cities, data about economic growth & industrial growth of cities is least available in the ESRs. See Figure 6-4.
The % of data availability is subject to data availability in number of ESRs made available for analysis. This logic applies to all the graphs for data availability unless mentioned otherwise.

Evaluation of Environmental Status Reports
Prepared by Maharashtra Pollution Control Board 62
0 10 20 30 40 50 60 70 80 90 100
Demographic growth (% 2001)
Economic growth
Industrial growth
Spatial growth (Decadal)
Demographic growth (% 2001)
Economic growthIndustrial growthSpatial growth (Decadal)
% Data availability 285025
Unavailable data 729510075
Growth of Cities
Figure 6-4: Data availability- Growth of cities
For Theme State of Resources data about land, water and air is available but data of Energy consumption patterns and health impacts of the pollution is not given. See Figure 6-5
0 20 40 60 80 100
Land
Air
Water
Energy
Human
LandAirWaterEnergyHuman
% Data availability 30421520
Unavailable data 70588598100
State of Resources
Figure 6-5: Data availability- State of Resources
For theme Urban Services, data about the transportation is less available. Urban services like water supply, sewerage & sanitation and solid waste management is well covered. See Figure 6-6

Evaluation of Environmental Status Reports
Prepared by Maharashtra Pollution Control Board 63
0 10 20 30 40 50 60 70 80 90 100
Water Supply
Sewerage Sanitation
Solid Waste Mgmt
Transport
Water SupplySewerage Sanitation
Solid Waste MgmtTransport
% Data availability 138133
Unavailable data 87928797
Urban Services
Figure 6-6: Data availability- Urban Services
Figure 6-7 shows data availability for various Municipal Corporations. All the 12 Municipal Corporations have data availability bellow 50%.
Figure 6-7: City wise data availability
Data representation and analysis
There is no standard format of ESR. Sectors and issues covered in ESRs of different cities and ESR of consecutive years of the same city differs largely.
ESRs have largely remained a compilation of the data. This data is more often presented in statistical form. It is difficult to draw meaningful conclusion from such raw data.

Evaluation of Environmental Status Reports
Prepared by Maharashtra Pollution Control Board 64
Data is not analyzed and not compared with the standards thus it does not reveal whether the condition of a particular environmental component or urban service is good or bad.
Data is often presented in compartmentalized form. Relation of one sector with the other, overlaps between sectors do not surface hence it does not provide a clear picture of city environment.
Relative performance of cities against one another cannot be judged because the format differs largely.
Performance evaluation of the present state of resources & services
For state of resources as well as urban services, details of the proposed projects are elaborated but evaluation of the present status of resources as well as services is not done.
E.g.
Details of proposed STPs are given but performance of existing STPs; its relation to discharges of untreated sewage etc. is not evaluated.
Compartmentalized Reporting
Relation of one environmental aspect with another across themes is not analyzed. Weak analytical framework, hence logical and scientific translation of information to action plans becomes weak. The cause-effect relationship between the environmental components, economic scenario and social impacts is very rarely understood in its full complexity. Spatial distribution of environmental stresses, state, impact and responses is very often not represented, making the relationship between policy responses and environmental issues obscure.
E.g.
Growth of migrated population triggers growth in slum population which in turn puts pressure on urban services and gives rise to health issues.
Poor spatial representation of issues
There is very little use of maps to present the issues. Most of the information is presented in the form of tables and graphs. All the maps used are of poor quality. Spatial representation is a better way to communicate to a lay man since it is easier to grasp.
Recommendations often Generic
After studying the environment of the city, the recommendations which are made for the ULB, are often a diluted efforts. The recommendations are very generic without any technical inputs.

Evaluation of Environmental Status Reports
Prepared by Maharashtra Pollution Control Board 65
E.g.
Recommendations for Air Pollution:
• One way system must employ in some congested roads (ESR 2004-05, Jalgaon Municipal Corporation)
• Development of green belt along river, nallah and watershed area (ESR 2007-08, Bhusawal Municipal Corporation)
• Keeping control on the number of private vehicles and maintain a record of the same (ESR 2005, Nashik Municipal Corporation)
• Conducting survey of industrial air pollution (ESR 2003-04, Bhivandi- Nizampur Municipal Corporation)
No recommendations for the implementation
There are no recommendations for implementation of the actions recommended. Details like funding, implementing body, share of responsibilities are not worked out. This makes the ESR just another document without any role to play in action planning.
Mainstreaming of environmental considerations in the sectoral development remains outside the scope of the ESR, thus the recommendations made in the ESR remain unimplemented. The ESR framework, although compiles cross sectoral information and data, does not influence cross sectoral policies such as economic instruments (e.g. Tax rebates, incentives etc).
The ESR does not address the implications of recommended Environmental Action Plans in terms of budgetary allocations. Financial deficiencies and non-allocation of budgets for Action Plans remains as one of the constraints.
No focus on proactive policy making
ESRs have been focusing on reactive decision making rather than proactive policy making, for which the understanding of the cause-effect relationship become of utmost importance
No stakeholders’ participation
Lastly, the most important element of stakeholder participation remains weak in formulating ESRs and subsequent Action Plans. It is essential for Environmental Action Plans to evolve out of a consultative process, which does not figure in the ESR preparation and dissemination.

Evaluation of Environmental Status Reports
Prepared by Maharashtra Pollution Control Board 66
7 Conclusion & Recommendations After looking at the ESR in global context and reviewing City ESRs from Pune, Mumbai and other cities, it is evident that at present ESRs are playing little role in mainstreaming environment into policy making and action planning. They are unable to transform the ‘data’ regarding environmental issues into programmes and projects to address them. Presently ESRs are just presenting data and many a times incomplete data. They are just a document with little role to play in action planning. Their reach to citizens is very limited and they are not generating awareness among citizens which is a prime motive of publishing ESRs.
With enhanced performance ESR can become a key document for aligning developmental policies with environmental considerations and global environmental issues.
This chapter gives recommendations for improving quality of ESRs.
Presently the ESR preparation process starts at collecting the available data and stops at data analysis and recommendations. Implementation of the action plan and enabling the policy framework to support those, remain out of scope of ESRs. This process is not inclusive of all the stakeholders.
In order to enhance the quality and contribution of ESRs a more comprehensive ESR preparation process which is inclusive all the stakeholders has to be followed.
Figure 7-1 shows various stages involved in ESR preparation. These can broadly be grouped according to three important aspects.
1. Standardizing the ESR format
2. Stakeholders’ Involvement
3. Influence Policy, Plan, programme and Projects
Recommendations are grouped as per these aspects.

Evaluation of Environmental Status Reports
Prepared by Maharashtra Pollution Control Board 67
51
Data collection
Data structuring
Use of Indicators
Identifying and Prioritizing the Gaps
Preparing Action Plans through Stakeholder Consultation
Supporting Action Plans through
Enabling Policy Measures
Stakeholder involvement
Standardizing the format
Influence Policy Plan Programme and Projects
Figure 7-1: Interventions to improve ESR Performance
7.1 Standardization of ESR format Analysis of the ESR so far shows that there inconsistency of data is a major cause of poor output. Format of ESR differs each year for a city and it is not same for any two cities. This makes temporal comparison of data for a city and between cities impossible.
Thus first step towards improving the quality of ESR is to standardize the report formats, data collection, analyses and representation.
7.1.1 Follow standardized data flow and representation Data availability is a very crucial issue which ULBs face while preparing ESRs.
Presently first data is collected and then from whatever available data report is generated. To achieve consistency in the report first the ESR format has to be standardized and accordingly data collection has to be followed. Annexure-IX presents Model Table of Contents for a standard ESR.
Data of various types is used in ESRs. Table7-1 shows the type of data used and the parameters to be standardized.
Table 7-1: Data collection for ESRs
Type of data Precaution
Demographic data The elements of demographic data to be included in ESR e.g. population growth rate, mortality rate, literacy rate etc. should
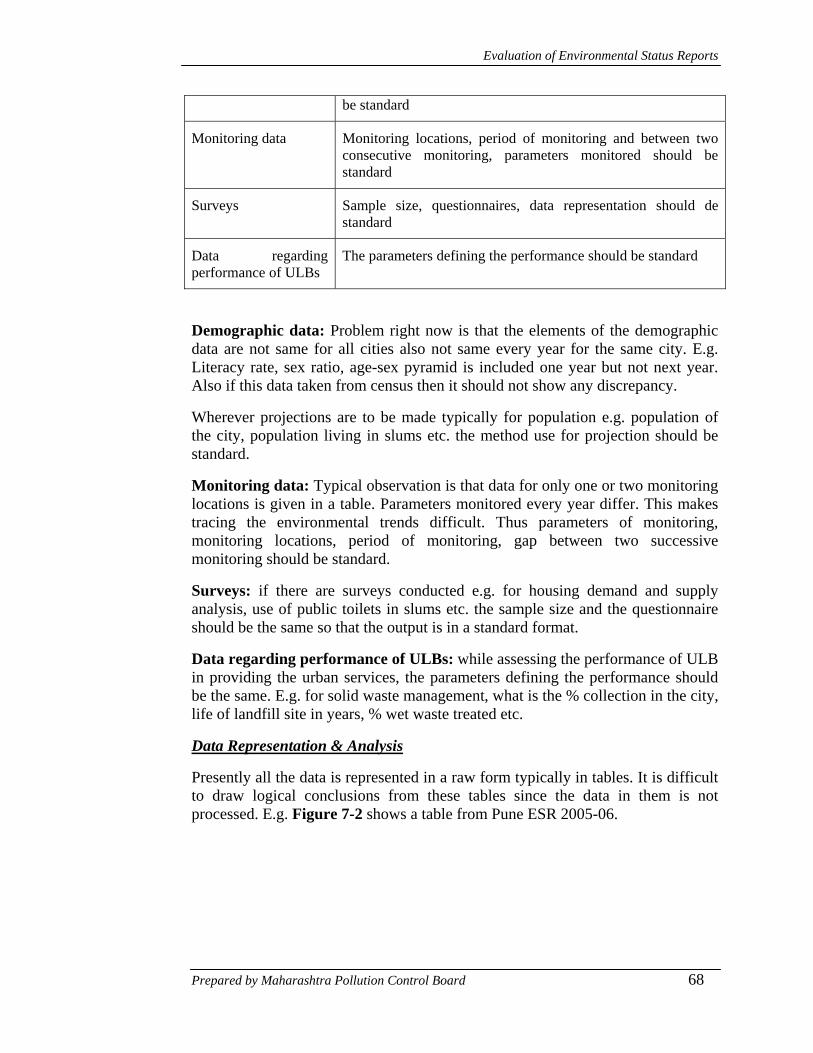
Evaluation of Environmental Status Reports
Prepared by Maharashtra Pollution Control Board 68
be standard
Monitoring data Monitoring locations, period of monitoring and between two consecutive monitoring, parameters monitored should be standard
Surveys Sample size, questionnaires, data representation should de standard
Data regarding performance of ULBs
The parameters defining the performance should be standard
Demographic data: Problem right now is that the elements of the demographic data are not same for all cities also not same every year for the same city. E.g. Literacy rate, sex ratio, age-sex pyramid is included one year but not next year. Also if this data taken from census then it should not show any discrepancy.
Wherever projections are to be made typically for population e.g. population of the city, population living in slums etc. the method use for projection should be standard.
Monitoring data: Typical observation is that data for only one or two monitoring locations is given in a table. Parameters monitored every year differ. This makes tracing the environmental trends difficult. Thus parameters of monitoring, monitoring locations, period of monitoring, gap between two successive monitoring should be standard.
Surveys: if there are surveys conducted e.g. for housing demand and supply analysis, use of public toilets in slums etc. the sample size and the questionnaire should be the same so that the output is in a standard format.
Data regarding performance of ULBs: while assessing the performance of ULB in providing the urban services, the parameters defining the performance should be the same. E.g. for solid waste management, what is the % collection in the city, life of landfill site in years, % wet waste treated etc.
Data Representation & Analysis
Presently all the data is represented in a raw form typically in tables. It is difficult to draw logical conclusions from these tables since the data in them is not processed. E.g. Figure 7-2 shows a table from Pune ESR 2005-06.

Evaluation of Environmental Status Reports
Prepared by Maharashtra Pollution Control Board 69
Figure 7-2: Data representation in ESRs
Many times bar charts or pie charts for the data are given however it does not define permissible limit or average or critical limit. This representation of data should be standardized. Value of permissible standards should be incorporated in the data representation.
7.1.2 Improve on spatial representation There is very little use of maps to present the issues. Most of the information is presented in the form of tables and graphs. All the maps used are of poor quality. Spatial representation of issues as well as responses is a better way to report. A GIS based data repository will be a better approach for organizing multi-attribute and spatial information of the ESRs. GIS can be effectively used as tool for decision making in relation to optimum gainful utilization of available resources. GIS would assist us in better linking of environmental, demographic and temporal factors with various issues to understand their causes.
Box 7-1 illustrates abstract of paper on GIS application in health care facility14.
Box 7-1: use of GIS developing health care facility
India is a developing nation, but it has tremendous potential in the field of healthcare and advanced medical care. The medical services are well established in the metropolises and now patients from neighboring countries as well as developed countries have been opting for medical treatment in India due to expertise of our doctors and relatively less expensive medical facilities. Yet, ironically, on the other hand these facilities are not available to our country men the less developed area of the country sides and lack of such facilities.
GIS can be effectively used as tool for decision making in relation to optimum gainful utilization of available medical resources in far flung areas. A correlation between populations effected by

Evaluation of Environmental Status Reports
Prepared by Maharashtra Pollution Control Board 70
different diseases, their areas, necessity and availability of medical resources to treat such patients, and establishment of existence geographic pattern, if any, can be worked out by application of GIS. Further, GIS would assist us in better linking of environmental, demographic and temporal factors with the health issues to understand causes for such health hazards.
The paper would focus on medical service management and provision of paper health care with optimum utilization of available sparse resources in remote areas, integration of multifarious data sets with spatial and statistical attribute to predict the affected areas and generate a disease control model, and create models for further research. It would enable us to understand current limitations of medical facilities and resources and lead us to a solution to overcome this contemporary data with aid of GIS. This would also enable us to combine contemporary data wit spatial data to provide better medical facilities to the needy people in rural and outstretched areas.
Figure 7-3: The digitized information of the Pune City and surroundings with Hospitals
labelled14
7.1.3 Use Indicator Framework Presently ESRs are a combination of Environmental media framework, environmental issues framework and sector framework. This has to be coupled with Environmental Indicators and their spatial representation. This will help ESRs to communicate to readers the state of environment in much effective way.
Indicator will play a key role in standardizing this data collection. Once the indicators are standardized automatically data will be collected in that format. These indicators can be divided into two parts. The core indicators which are mandatory for all the cities and for all the years and for which the data is easily
14http://www.gisdevelopment.net/proceedings/mapindia/2006/poster/mi06pos_157.htm

Evaluation of Environmental Status Reports
Prepared by Maharashtra Pollution Control Board 71
available and the desired indicators which add value to the environmental performance assessment of the cities but data availability for which is in question.
At least the core indicators listed earlier should be followed on a consistent basis. The core indicators have been listed in Table 6-2 of Chapter 6.
7.1.4 Use ESR to reflect on Global Issues – GHG Emissions Microclimate changes, flash floods and urban heat island effect are examples on the impacts of rapidly growing urban bodies on a local scale. These changes when cumulated lead to regional and global scale impacts.
Issues such as global warming are becoming of great concern today
Cities have an important share in global warming – given the intensive use of natural resources, energy consumption and releases of wastes/emissions
ESRs should include therefore key global indicators like GHG emissions.
Many cities have started reporting their carbon footprints as part of carbon disclosure. ESRs of Indian cities need to capture this aspect as a part of assessment and reporting.
This will be in line with GoI’s National Plan for Combating Climate Change.
7.1.5 Ensure Linkages to add Value, maintain Consistency and avoid duplication
These ESRs can be used for defining programmes and projects by the ULB aligning them with local as well as global environmental issues.
Only when ESRs emerge as a quality documents we can use them as inputs for environmental assessment for various project from multilateral agencies and for progress reporting of these projects. Annexure IX gives model ToC for future ESRs.
A Tiered Process of City ESR to National SoEs may be set up. MPCB can play a role in building Regional ESRs based on city ESRs.
National SoE
State SoE
Regional ESRs
City ESRs Figure 7-4: Aligning the environmental reporting initiatives

Evaluation of Environmental Status Reports
Prepared by Maharashtra Pollution Control Board 72
As stated earlier, MPCB publishes annual ESRs of all the regions. These ESRs consist of environmental data of the cities falling under that region. Presently these ESRs present data about air & water pollution, polluting industries, MSW, and hazardous waste.
It is observed that for cities with better quality of ESRs like Pune, Mumbai; there is little correlation between data in regional and city ESRs. City ESRs cover wider spectrum of issues.
Figure 7-4 explains how all the environmental initiatives can be aligned. Once they have a common agenda, national policies will be aligned with local issues and local action will be aligned with national policies.
7.2 Stakeholders’ Involvement
7.2.1 Follow a Stakeholder Consultative Process to Prepare and Share ESR The primary objective of the stakeholder consultation is to identify the city needs through consultations with a range of stakeholders. The process of consultations aims to bring the opinions of a range of stakeholders to a common platform that can be converted into tangible developments in the city.
It is important to involve stakeholders in ESR preparation process at various stages like compiling data, reporting its analyses to highlight gaps and develop action plans.
Presently ESRs are typically given to consultants for preparation.
The ESR preparation shall be driven and directed by an ESR committee set up by ULB. See Figure 7-5
ESR Team
Representatives from various departments of the ULB e.g. water supply dept., sanitation dept., building permissions dept., electricity dept., income tax dept., town planning dept. etc.
Private consultant
Citizen representatives, representatives from educational institutions, research institutions etc.
Figure 7-5: Team composition for preparation of ESR
These stakeholders in the committee can support in different ways as discussed bellow.
Representatives from various departments of ULB will be responsible for the data availability from their respective department. They will also look

Evaluation of Environmental Status Reports
Prepared by Maharashtra Pollution Control Board 73
after the implementation of projects emerged out of the action plan for their own department.
Private consultants will be responsible for analysis of the data, issues identification, and prioritization. They will prepare action plan, and the projects to be taken up to address the environmental issues. They will allocate the responsibilities, assess the financial feasibility of the projects, and define the time frame for implementation.
Representatives from citizens and educational and research institutions will help the consultant in data analysis and prioritization of the issues. This will help the ESR become more realistic.
ESR preparation process discussed in Figure 7-6 can be followed to ensure stakeholders’ involvement. ESR preparation process to be followed should be cited clearly in the Terms of Reference (TOR) for outsourcing the ESR preparation.
Form ESR committee
Review the previous ESRs and the implementation of the Action Plans
ESR Launch Workshop
Situation Analysis
Present the Situation analysis to the committee
Action Plan for next 3 years
Present the Draft ESR Report to the committee
Final ESR Report
Data collection
Data structuring and analysis
Application of the Indicator Framework
Formation of Vision, Mission, Goals and Objectives
Developing Policies, Plans, Programmes and Projects
Action Plan for next 3 years
Figure 7-6: ESR Preparation Process

Evaluation of Environmental Status Reports
Prepared by Maharashtra Pollution Control Board 74
7.2.2 Consider Internet as an Effective Platform for Building and Sharing of ESRs
Intercity comparison can be facilitated through online sharing of ESRs with other cities. This will increase the transparency in data sharing. Maharashtra has a website www.envis.maharashtra.gov.in . The ESRs can be shared on this website.
Use of tools like Ekovoices will be very useful. Ekovoices is a website launched to build a community of citizens who want to work towards a ‘Cleaner and Greener’ concept for the betterment of the Society.
Ekovoices utilizes a Google maps based engine where users can report location specific environmental issues and initiatives. Experts in the field of environment and urban infrastructure management can form their own networks on Ekovoices.
More details about the use of website are given in Annexure-IX.
7.3 Linking ESR preparation to Strategic Planning The actions must be rounded. Vision- Mission-Goals-Objectives-Targets should emerge based on the inputs from ESR. The schemes implemented will be input to ESRs and revised Vision will emerge from new ESR. See Figure 7-7.
The ESR should carry a blue print of Vision to Action.
The DPSIR Framework and the Strategic Planning Process should form two convoluting circles intersecting at Pressure and Response. The DPSIR Framework externally supports the Strategic Planning Process, drawing information from the SoE and feeding back into the SoE evolve the Response (Environmental Action Plans)
The Analytical Framework facilitates the translation of SoE (State & Impact Indicators) into Strategies, Tactics and Tasks to evolve Response.

Evaluation of Environmental Status Reports
Prepared by Maharashtra Pollution Control Board 75
DPSIRFRAMEWORK
P=Pressures
S=State
I=Impacts
R=Responses
Implementation
D=Driving forces
Vision Mission
Goals
Objectives
Targets
Schemes
Policy, Plan, Program, Project
Desired state of environment
Stimulated by situation analysis
STRATEGIC PLANNING
Figure 7-7: Linking ESR preparation to Strategic Planning
Vision Statement
A vision is a guiding image of success formed in terms of a contribution to society. A vision describes the future destination; it provides an image in words of what success would look like. It is built on reasonable assumptions about the future.
A vision statement is a conceptual description of the desired future state. It is a compelling picture or image that helps individuals understand the future direction and achievement of the organization's purpose. A strategic vision depends on an organization's ability to see and feel the desired state. It stimulates action and a yardstick for measuring progress. The vision statement thus requires organization's members to stretch their expectations, aspirations, and performance.
Mission Statement
A mission statement answers the questions: Why does our organization exist? What business are we in? What values will guide us?. A vision, however, is more encompassing. It answers the question, "What will success look like?" It is the pursuit of this image of success that really motivates people to work together.
The mission statement is thus a precise description of what an organization does. The mission statement reflects the overall purpose of the organization. When wording the mission statement, organization's products, services, markets, values, and concern for public image must be considered.

Evaluation of Environmental Status Reports
Prepared by Maharashtra Pollution Control Board 76
Goals
Goals basically translate the vision and mission into specific and discrete aims that need to be achieved to fulfill them.
Goals are broad statements of what the organization hopes to achieve in the next 5-10 years. Objectives are specific, concrete, measurable statements of what will be done to achieve a goal generally within a 2 to 3 year time frame. Targets are sometimes treated like sub-objectives and include “what will be accomplished” and “by when” and focus on results over 1 to 2 years.
Objective
An objective is a short-term, practical target related to a goal. Objectives are specific, measurable, attainable, realistic, and time-bound. Once the areas of change have been identified, it is important to ensure that the targets linked to Objectives are measurable.
Policy
A Policy is a definite course or method of action that guides and determines present and future decisions. It is the overall framework that embraces the general goals and procedures of an institution (in this case a government body). Policy is directed towards regulating
Plan
A Plan is defined as a detailed formulation of a programme of action. It can be described as intent to carry out an action. Plan is directed towards regulating
Programme
A Programme is a system of projects and services. Programme is directed towards regulating
Project
A Project is the most location specific response that may be planned under a programme. Project is directed towards changing
7.4 Key Action Points
Based on the deliberations above summing up of action points is presented below
• Arrive at DPSIR based Table of Contents for ESRs
• Conduct training of ESR “ coordinators”
• Apply Indicator Framework

Evaluation of Environmental Status Reports
Prepared by Maharashtra Pollution Control Board 77
• Follow consultative process in building ESR and platforms like ekovoices
• Maintain link between MPCB’s regional reports with ESRs and in turn with State SoE
• Integrate Strategic Planning Process in the preparation and use of ESRs
• Prepare a Model ESR on this basis under MPCB’s assistance
• Elevate ESRs to reflect on Global Issues such as reporting on Green House Gases (GHG) Emissions and evolving action plans to reduce the “carbon foot print”

Evaluation of Environmental Status Reports
Prepared by Maharashtra Pollution Control Board 78
Annex I. Indicators framework for this project
Core Indicators
Desired Indicators
Themes Theme_wt Parameter adjusted
wt Components Parameters Parameters_wt Adjustment
25 16.92 Population growth rate 12 2.03
Growth in migrated population (% Decadal) 12 2.03
Demographic growth (% 2001)
% of slum population to total population 12 2.03
Work participation ratio 6 1.02
% of people bellow poverty line. 12 2.03
Average annual per capita income 6 1.02
Economic growth
% of budget spent on Environmental Infrastructure 6 1.02
% share of industries in total electricity consumption 8 1.35
Industrial growth Number of polluting industries 6 1.02
Growth of cities
Spatial growth (Decadal) Population density 8 1.35

Evaluation of Environmental Status Reports
Prepared by Maharashtra Pollution Control Board 79
% of slum area to city area 12 2.03
100 16.92
30 21.54 Landuse 10 2.15
% of green area to the total city area 6 1.29
Land
Green area per person 4 0.86
Ambient air quallity 10 2.15
Air
Noise quality 10 2.15
Discharges of untreated industrial effluent 10 2.15
Water quality‐ Sea 4 0.86
Water quality‐ Lake 3 0.65
Water
Water quality‐ River 3 0.65
Per capita energy consumption 7 1.51
Share of renewable energy 7 1.51
Energy
Annual fuel consumption 6 1.29
Mortality rate 8 1.72
State of natural resources
Human
Infant mortality rate 12 2.58
100 21.54
25 30.77 Net LPCD 7 2.15 Urban Services
Water Supply % of households connected by service connection 7 2.15

Evaluation of Environmental Status Reports
Prepared by Maharashtra Pollution Control Board 80
Unaccounted for water 4 1.23
Average tariff 4 1.23
Staff per 1000 connections 3 0.92
Total sewage generated 6 1.85
% of population catered to by underground sewer network 6 1.85
Coverage of slum population by pay & use toilets 5 1.54
% of untreated sewage 5 1.54
Sewerage & Sanitation
Staff per 1000 connections 3 0.92
Total SW generated 4 1.23
Life of landfill site 3 0.92
% of waste disposed into landfill site to total waste generated 4 1.23
% of waste collected to total waste 4 1.23
Compliance with MSW Rules 3 0.92
Availability of bio medical waste treatment 4 1.23
Solid Waste Mgmt
Wet waste treatment at ward level 3 0.92
Transport
Road area as % of ward area 8 2.46

Evaluation of Environmental Status Reports
Prepared by Maharashtra Pollution Control Board 81
% of population travelling by public transport 9 2.77
% of public vehicles running on CNG 8 2.46
100 30.77
20
30.77 Environmental education
Are there any training programmes for teachers for Environmental education? 5 1.54
Are there any plantation schemes for schools? 5 1.54
Is there community participation for managing gardens of the city? 5 1.54
Waste Management
Is dry and wet waste collected separately? 5 1.54
Are there any waste to Energy Projects on the city landfil site? 5 1.54
Is there PPP in waste management for the city? 5 1.54
Is there Methane Gas Recovery Project at city landfill site? 5 1.54
Initiatives for improving city environment
Is there community participation for
5 1.54

Evaluation of Environmental Status Reports
Prepared by Maharashtra Pollution Control Board 82
storage, collection and disposal of waste?
Are there any funds allocated for Research and Development for Waste Management Technologies? 5 1.54
Slum Improvement
Is there PPP for management of public toilets? 5 1.54
Are there any public toilets managed by CBOs or NGOs? 5 1.54
Are there community centres provided for slums? 5 1.54
Are there any adult education schools or classess in slums run by ULB? 5 1.54
Has the ULB provided for Community Health Centres? 5 1.54
Traffic
Are there any paths dedicated to bicycle or pedestrian movement? 5 1.54
Is there allocation of Public Transport Fund? 5 1.54
Is there GPS‐based On Line Bus Tracking System for the city
5 1.54

Evaluation of Environmental Status Reports
Prepared by Maharashtra Pollution Control Board 83
transport?
Are there Microprocessor based ticket vending machines for busses 5 1.54
Is there Online ticket accounting system? 5 1.54
Is there RFID & GPS based Smart Card system for public transport? 5 1.54

Evaluation of Environmental Status Reports
Prepared by Maharashtra Pollution Control Board 84
Annex II. Urban Services Environmental Rating System (USERS)
Framework for comparative performance assessment
The overall comparative performance assessment is based on the combination of parameters linked to service delivery and financial performance.
The service delivery consisted of parameters such as service level, coverage, and service efficiency. The study covered the following functions of a local body.
a. Water supply
b. Sewerage and sanitation
c. Road and storm water drainage
d. Street lights
e. Solid waste management
A total of 41 indicators (15 financial, 17 service level and coverage, and 9 indicators for service efficiency) had been used for the comparative performance assessment.
Table-4 gives list of the indicators used
Table5. Urban Services Environmental Rating System (USERS)- Indicators
Financial indicators
Resource mobilization: general
1. Share of own resources in revenue income
2. Growth rate of own resources
3. Per capita income
4. Share of non-tax to own resources
Resource mobilization: property tax
5. Property tax rate
6. Per capita property tax demand
7. Average ratable value per property

Evaluation of Environmental Status Reports
Prepared by Maharashtra Pollution Control Board 85
8. Assessment as % of occupied residential houses
9. Collection performance
Expenditure management
10. Share of establishment expenditure
11. Operating ratio
12. Per capita expenditure
13. Property tax assessment per collection staff
Debt management
14. Outstanding loan per capita and overdue
15. Overdue liability as % of total outstanding
Service level and coverage indicators
Water supply
1. Daily per capita supply (litres)
2. Supply frequency
3. Number of hours of supply per day
Water supply – service coverage
4. Present supply as % of 2001 demand @90 lpcd
5. Distribution length to road length (%)
6. % assessment covered by house service connection
7. Slum population per standpost (persons)
Sewerage and sanitation level
8. Persons per unit of public convenience (no.)
Roads and storm water drains: levels
9. % roads surfaced
10. % roads with pucca drains

Evaluation of Environmental Status Reports
Prepared by Maharashtra Pollution Control Board 86
Service level and coverage indicators
Roads and storm water drains: coverage
11. Road density (km/sq. km)
12. O and M cost per km of road
Street lighting: levels
13. Street lighting spacing
Street lighting: coverage
14. O and M cost per light
Solid waste management: levels
15. Waste collected (%)
16. % vehicle capacity to waste generated
Solid waste management: coverage
17. Spacing between dustbins
Service efficiency indicators
Water supply
1. % cost recovered (including sewerage)
2. Cost per 1000 litres of water (rupees)
3. Staff per 1000 connections (no.)
Sewerage and sanitation
4. Staff per 10000 population
Roads and storm water drains
5. Road length per staff
Street lighting
6. No of lights per staff
7. Cost recovery (%)

Evaluation of Environmental Status Reports
Prepared by Maharashtra Pollution Control Board 87
Solid waste management
8. % cost recovered
9. Road length per conservancy staff
Annex III. UIPMP of City Managers’ Association–Gujarat Indicators
1 WATER SUPPLY
1.1 Service Level
1.1.1 Water supplied per capita per day
1.1.2 Average house supply per day
1.1.3 Number of supply days in a week
1.1.4 1.1.5Treatment plant capacity as percentage of water supply from
1.1.5 surface water resources
1.1.6 Storage Capacity Adequacy
1.2 Service Coverage
1.2.1 Ratio of Slum Population to Public Stand Post
1.2.2 Percentages HH Covered by Water Supply Connections
1.2.3 Percentages Pipe Length to Total Road Length
1.3 Service Cost and Efficiency
1.3.1 Cost of Supply
1.3.2 Establishment Cost Per Capita
1.3.3 Cost Recovery
1.3.4 Amount of Unaccounted for Water
1.3.5 Staff per MLD Supplied
2 SEWERAGE AND SANITATION
2.1 Service Level
2.1.1 % of Waste Water Treated

Evaluation of Environmental Status Reports
Prepared by Maharashtra Pollution Control Board 88
2.1.2 Slum Population Per Public Convenience
2.1.3 Ratio of Pay and Use Toilets to Total Public Toilets
2.2 Service Coverage
2.2.1 % of Population covered by Underground Drainage and Individual Septic Tanks System
2.2.2 % HH Covered by Sewerage Connection
2.2.3 Service Cost and Efficiency
2.2.4 Cost per Sewerage Connections
2.2.5 Cost Recover
2.2.6 Staff per 1000 Sewerage Connections
3 SOLID WASTE MANAGEMENT
3.1 Service Level and Coverage
3.1.1 % Waste Collection
3.1.2 % Vehicle to Waste Generated
3.1.3 Spacing of Waste Bins
3.1.4 % Capacity of Bins
3.1.5 Road Length Covered per Sweeper
3.2 Service Cost and Efficiency
3.2.1 Total Cost per Tonne of Waste Collected
3.2.2 Manpower per Tonne of Waste
3.2.3 Cost Recovery
3.2.4 ROADS AND STORM WATER DRAINAGE
3.3 Service Level
3.3.1 % of Roads Surfaced
3.3.2 % Road Length having Storm Water Drains
3.4 Service Coverage
3.4.1 Road Density

Evaluation of Environmental Status Reports
Prepared by Maharashtra Pollution Control Board 89
3.4.2 % City Area Covered by Storm Water Drains
3.4.3 Service Cost and Efficiency
3.4.4 Cost per km of Road Length
3.4.5 Staff per 10 km of Road Length
4 STREETLIGHTS
4.1 Service Level and Coverage
4.1.1 Street Light Service Coverage
4.2 Service Cost and Efficiency
4.2.1 Cost per Street Light
4.2.1 Staff per 1000 Streetlights
5 FINANCIAL INDICATORS
5.1 Resource Mobilization
5.1.1 Per Capita Revenue Income
5.1.2 Per Capita Tax Income
5.1.3 Per Capita Non-Tax Revenue
5.1.4 % of Own Resources in Revenue Income
5.1.5 % of Own Resource in Capital Income
5.1.6 % Growth in Per Capita Tax Income
5.1.7 % Growth in Per Capital Non-tax Income
5.1.8 % Growth of Own Resources in Revenue Income
5.1.9 % of Octroi in Revenue Income
5.1.10 % of Total Grants in Total Income
5.1.11 Per Capita Property Tax Income
5.1.12 Property Tax Collection Performance
5.1.13 Number of Properties Assessed per Staff
5.1.14 Property Tax Collection per Staff

Evaluation of Environmental Status Reports
Prepared by Maharashtra Pollution Control Board 90
5.1.15 Properties Assessed per sq km of City Area
5.1.16 % of Arrears in Total Demand
5.2 Expenditure Management
5.2.1 Per Capita Revenue Expenditure
5.2.2 Per Capital Expenditure on Water Supply and Sanitation
5.2.6 Per Capita Expenditure on Public Health
5.2.7 Per Capita Expenditure on Public Safety
5.2.8 Per Capita Expenditure on Public Works
5.2.9 Per Capita Expenditure on General Administration
5.2.10 % of Establishment Expenditure in Total Revenue Expenditure
5.2.11 Operating Ratio
5.2.12 Per Capita Expenditure on Capital Works
5.2.13 % of Expenditure on Discretionary Services
5.3 Debt Management
5.3.1 Debt Service Ratio to Income (Loan Repayment/Revenue
5.3.2 Income)
5.3.3 Debt Service Ratio to Expenditure (Loan Repayment/Revenue
5.3.4 Expenditure)
5.3.5 Outstanding Liabilities per Capita

Evaluation of Environmental Status Reports
Prepared by Maharashtra Pollution Control Board 91
Annex IV. Environmental Reporting across Globe
Global Level initiative
Environment Outlook:
Although this terminology is used for SoE at the global and regional scale, its underlying function is the same as that of a SoE. UNEP launched the Global Environment Outlook (GEO) Project in 1995.
A global environmental assessment process is the GEO Process that is cross-sectoral and participatory. It incorporates regional views and perceptions, and builds consensus on priority issues and actions through dialogue among policy-makers and scientists at regional and global levels.
GEO outputs are in printed and electronic formats, including the GEO Report series. This series makes periodic reviews of the state of the world's environment, and provides guidance
for decision-making processes such as formulation of environmental policies, action planning and resource allocation. Other outputs include technical reports, a website and a companion publication for young people. 15
Country level Environmental Reporting
World Bank Environment Monitors
The East Asia and Pacific Environment and Economic Monitor series were initiated in 1999 by the World Bank. Termed as the Environment Monitors, these
SoEs are compiled to assist decision makers, civil society, academicians, and the general public towards making informed and logical decisions based on environmental criteria. The distinguishing feature of Environment Monitors from ‘conventional’ SoEs is that they focus more on analyzing the trends of environmental change than just the current environmental scenario.
Environmental Atlas
15 GEO 2000 and the GEO Process http://www.unep.org/geo2000/ov-e/0001.htm accessed May 17 2005

Evaluation of Environmental Status Reports
Prepared by Maharashtra Pollution Control Board 92
The Environmental Atlas term for a SoE is mainly in use in Germany and allied countries. The Ecobase Environmental Atlas of Germany offers a complete environmental database on every location in Germany, including information on local water and air quality.16 The distinguishing feature offered by the Environmental Atlas is the representation of environmental data and information usually in the form of maps. Environmental Atlas of India is discussed in Chapter 3 of this report.
Country SoEs by UNEP
The UNEP Regional Resource Centre for Asia and the Pacific (RRC.AP) has initiated SoE Reporting to record the prevailing conditions of the region mainly from two perspectives, namely, bio-physical and socio-economic conditions and trends. Under this SoE reporting framework, the UNEP SoEs seek to address:
Emerging issues in the region and present environmental status and trends
Existing policy responses at national, sub-regional, and regional level
The future perspectives based on the different development patterns
Recommended policy actions.
City level ESRs
The last decade of the 20th century saw the emergence of cities and urban centres across the world as hub of economic development, thus attracting masses of populations to these centres. Apart from the drivers of economies, however, the cities turned into high stress and high resource consumption areas for the environment. As urbanization continued to grow at a rapid pace and economic development continued, the ecological footprint17 of the cities grew to encompass the hinterlands and the fringe areas, thus expanding to regional scales.
Box1. City of Sydney annual State of Environment Report
The City of Sydney annual State of Environment Report is prepared by Council of City of Sydney. It contains information about environmental issues, trends and programs within the Local Government Area.
The State of the Environment Report also provides a reporting mechanism to monitor their progress towards achieving the targets set within our Environmental Management Plan (EMP).
The report is in Pressure-State-Response framework with maximum emphasis given on communicating the efforts taken by Council to address various environmental issues.
Distinguishing feature of this report is that it gives citizens some guidelines on what action they can take to contribute in addressing the issues. Also some quick contacts are 16 ECOBASE Environmental Atlas, http://www.umweltbundesamt.de/uba-info-presse-e/presse-informationen-e/p1101e.htm accessed May 20, 2005 17 More information on Ecological Footprints, http://www.gdrc.org/uem/footprints/ accessed May 20, 2005

Evaluation of Environmental Status Reports
Prepared by Maharashtra Pollution Control Board 93
given if citizens need further information on tips for green living, various programmes on water saving, tree plantation etc. Citizens are also encouraged to report pollution, injured sick native animals etc.
Based on this mandate, cities publish annual statements of the city’s environment, often drawing recommendations from it. However, the ESRs often remain outside the city’s developmental agenda, the municipal authorities unable to mainstream the environmental considerations. Box 1 gives information about ESR of Sydney.
Community initiatives
Citizen Report Card18
The basic concept behind the Citizens Report Card CRC) is that citizens as users can provide useful information on the quality and adequacy of services and the problems they face with the service providers. They know better than anyone else how responsible or reliable an agency is or what are the costs attached to a service. Thus the Report Card is expected to “reflect the actual experience of people with a wide range of public services”. Such feedback will be valuable to judge the performance of a service provider and serve as an input to the government in policy making and reform. CRC uses individual household as a unit and data and feedback is generated through household survey.
Citizen Report Card of Bangalore is discussed in Chapter 3.
Citizen Score Card19
The community score card (CSC) process is a community based monitoring tool that is a hybrid of the techniques of social audit, community monitoring and citizen report cards. Like the citizen report card, the CSC process is an instrument to exact social and public accountability and responsiveness from service providers20. However, by including an interface meeting between service providers and the community that allows for immediate feedback, the process is also a strong instrument for empowerment as well.
The CSC process uses the “community” as its unit of analysis, and is focused on monitoring at the local/facility level. It can therefore facilitate the monitoring and performance evaluation of services, projects and even government administrative units (like
18 ECD WORKING PAPER SERIES - No. 12 JUNE 2004, An Assessment of the Impact of Bangalore Citizen Report Cards on the Performance of Public= Agencies, Adikeshavalu Ravindra, 19 A Short Note on the General Methodology for Implementation, Janmejay Singh and Parmesh Shah of the Social Development Department at the World Bank
http://info.worldbank.org/etools/library/latestversion.asp?238561, accessed on 23.09.08

Evaluation of Environmental Status Reports
Prepared by Maharashtra Pollution Control Board 94
district assemblies) by the community themselves. Since it is a grassroots process, it is also more likely to be of use in a rural setting
Community Based Performance Monitoring (CBPM)
Community Based Performance Monitoring (CBPM) was developed in The Gambia with support from the World Bank as one element in its efforts to help improve governance and enhance development outcomes through social accountability. Building on the Community Scorecard Process developed by CARE International in Malawi, CBPM incorporates enhanced focus group methodologies developed in Sierra Leone. CBPM was piloted in the Gambia, and has been being scaled up nationally to facilitate participatory monitoring of The Gambia’s Poverty Reduction Strategy, and has recently been introduced to Uganda.
Sustainability Report: Although different in its scope and presentation, Sustainability Reports are typically produced by corporates to assess the demand and supply of resources, risks of environmental degradation and the cost and benefits of environmental management. Although these cannot be formally categorized as SoEs per se, they still perform a similar function of guiding decision makers towards sound environmental management.

Evaluation of Environmental Status Reports
Prepared by Maharashtra Pollution Control Board 95
Annex V. Environment Reporting in India
State of Environment-India
State of Environment Report of India was prepared to be a part of Global State of the Environment Report in 2002 (GEO-3) for the 2002 Earth Summit i.e., Rio + 10, It was prepared by The Energy and Resources Institute (TERI) under the UNEP Regional Resource Centre for Asia and the Pacific (RRC.AP) SoE Reporting framework.
The Ministry of Environment and Forests (MoEF), Government of India, the national implementing agency in India, has played a very crucial role in carrying out this participatory assessment process in soliciting input from
various government sectoral agencies. Around 25 agencies and 60 individuals were involved in the process.
5 key issues were identified and analyzed using “pressure-state-impact- response” (PSIR) framework. The five key environmental issues identified for India are
1) Land degradation
2) Biodiversity,
3) Air pollution with special reference to vehicular pollution in cities,
4) Management of fresh water resources,
5) Hazardous waste management with special reference to municipal solid waste management.
This SoE Report for India provides a sound basis for the development of action plans, the next stage of the planning process, as we enter the new millennium. The report aims to provide concrete guidance for action planning, policy setting and resource allocation for the coming decades to improve the state of the environment of India and the welfare of her people.
SoE Report – State level
The report has been prepared by MPCB under funding from Ministry of Environment and Forest and Planning Commission, Government of India (GoI). The initial draft of the report was prepared by Indira Gandhi Institute for Developmental Research (IGIDR). It was subsequently reviewed through a series of consultative workshops. Overall responsibility of the co-ordination, guidance, capacity building and review has been carried out by TERI.

Evaluation of Environmental Status Reports
Prepared by Maharashtra Pollution Control Board 96
This report intends to help planners and decision makers in proper evaluation of environmental issues. Box 2 gives objectives of the report
Box2. Objectives of the SoER for Maharashtra 2007
1) Provide the public, government, non-governmental organizations and decision makers with information on conditions of the state’s environment
2) Provide early warning of the potential problems, as well as allowing for the evaluation of possible scenarios for the future
3) Report on the effectiveness of policies and programmes that are designed to respond to environmental change including progress towards achieving environmental standards and targets
4) Contribute to the assessment of a state’s progress towards achieving ecological sustainability
5) Create a mechanism for the integration of environmental, social and economic information with the goal of providing clear picture of the state environment
6) Identify gaps in the state’s knowledge of environmental conditions and trends and recommend strategies for research and monitoring to fill these gaps
7) Help decision makers make informed judgements
Environmental Atlas
About Environmental Atlas for India
India has undertaken the task of producing an Environmental Atlas through collaboration of Central Pollution Control Board (CPCB) and National Atlas and Thematic Mapping Organization (NATMO). See Box 321
The Environmental Atlas of India is a compilation of all the environmentally related information presented in the form of maps and text including statistical data. This Atlas is scheduled to be released during year 2000. The scale adopted is 1:12 million for general maps and 1:2 million for detailed maps.
State level and district level Environmental Atlas are also being prepared by CPCB and NATMO. The maps of the state environmental atlas will be in the scale of 1:1 million or 1:2 million or as appropriate as per the size of the State and scale of district environmental atlas will be 1:2, 50,000.
Box3. Outline of Environmental Atlas of India
1) General characteristics
I. Part-A
21Zoning Atlas: Programme Overview http://www.gisdevelopment.net/application/environment/pp/envp0003pf.htm accessed May 23, 2005

Evaluation of Environmental Status Reports
Prepared by Maharashtra Pollution Control Board 97
i. Administrative Divisions
ii. Settlement Location
iii. Major Road
iv. Climate
v. Landuse
vi. Soil
vii. Land Capability
viii. River Basin
II. Part-B
i. Earthquake Zone
ii. Natural Hazards
iii. Wasteland area
iv. Agricultural Land
2) Environmentally sensitive zones
I. Reserve Forest
II. Protected Forest
III. Forest cover in Tribal Districts
IV. National Parks
V. Wildlife Sanctuaries
VI. Elephant reserve area
VII. Drought Prone District
VIII. Forest Change (2001-2003)
IX. Forest Change (2003-2005)
X. Biogeographic Zones
3) Environmental quality
I. Air Quality
II. Groundwater Quality
III. Surface Water Quality (River basin wise)
IV. Surface Water Quality (River wise)
4) Socio economic profile
I. Demographic structure
II. Urban settlement
III. Quality of health
5) Pressure – State –Impact – Response (PSIR) Thematic Maps : Cause – Effect relationship
I. Land degradation
II. Bio diversity loss

Evaluation of Environmental Status Reports
Prepared by Maharashtra Pollution Control Board 98
III. Forest
IV. Water scarcity
V. Degrading water quality
VI. Air pollution
VII. Mining
VIII. Municipal solid waste ( m s w )
Regional level- MPCB Regional ESRs
Maharashtra Pollution Control Board has 11 regional offices all over Maharashtra. These offices publish ESRs every year. See Figure 15
Given bellow is the map of MPCB regions.
ESR is named after the regional head office. It typically covers all the districts within that region. E.G. ESR of Pune region covers Pune, Satara and Solapur districts.
The framework of ESR is mainly issue based. It focuses on pollution of air water and land. ESR of a region gives information about causes of pollution and actions taken for all the districts coming under it.
Figure15. Regions within Maharashtra Pollution Control Board

Evaluation of Environmental Status Reports
Prepared by Maharashtra Pollution Control Board 99
Some key observations are as given bellow
Very narrow spectrum of issues covered as compared to city ESRs. The Regional ESRs deal only with pollution of air, water and land. It does not bring out the linkages between various other components of the city like landuse, urban services etc. this makes it incomplete.
Data between regional and city ESR differs largely. Demographic figures which are supposed to remain constant from census differ from city and regional ESR.
E.g. ESR of Pune Region of MPCB states that as per the census 2001 population of Pune city is 2700,000 (27 lacks) and projected population upto 2005 will be 34,60,875. While ESR of Pune city states that the population of the city is 2540936 and the estimated population in 2005 is 3006036.
Pune Regional ESR states that the area of Pune Municipal Corporation (PMC) is 430 SqKM while Pune City ESR states that the area of PMC is 423.84 SqKM
Qualitative remarks are found more than quantitative data
Given in Box 4 is a paragraph from ESR of Pune Region 2004-05. There are no data evidences given for the performance of CETP. Only qualitative remarks are given.
Box4. Data description in Regional ESR 2004-05
PAPER UNITS :-
There are two paper units located in the Indapur and Bhor Taluka. The said units are using ready pulp for the process. Industry in Indapur taluka is M/s Ballarpur Paper Industry Ltd., formerly known as M/s Sinar Mas Paper. The industry has provided primary, secondary and tertiary facility to treat the effluent and the operation of ETP is fairly good. Industry in Bhor Taluka is M/s Indo Afrique Paper Industry Ltd. It has upgraded Effluent Treatment Facility from primary to secondary and tertiary. Its operation is also a fairly good.
Data given is not of quality which can be used as an input in action planning. Inadequate data and qualitative rather than quantitative data makes ESRs unfit for action planning.
Box 5 gives contents of ESR of Pune Region which includes Pune, Satara and Solapur districts.
Box5. Contents of ESR 2004-05 of Pune Region of MPCB

Evaluation of Environmental Status Reports
Prepared by Maharashtra Pollution Control Board 100
1) Introduction
2) River policy
3) Domestic pollution
4) Industrial pollution
5) River water pollution
6) Ground water pollution
7) Air pollution
8) Noise pollution
9) Municipal solid waste
10) Hazardous waste
11) Bio medical waste
12) Public awareness
Community level initiative: Citizen Report Card Bangalore22
As stated earlier, the basic concept behind the Citizens Report Card CRC) is that citizens as users can provide useful information on the quality and adequacy of services and the problems they face with the service providers.
In India such an initiative has been tried in Bangalore. The Bangalore Citizen Report Card (CRC) was pioneered by the Public Affairs Centre (PAC). It provides an assessment of the satisfaction levels of citizens with regard to public services in Bangalore and ranks public service agencies (dealing with water, power, municipal services, transport, housing, telephones, banks and hospitals) in terms of their service performance.
The Public Affairs Centre’s first two city level Report Cards on public services in Bangalore were completed in 1994 and 1999. Third was completed late in 2003.
In conducting its first CRC in 1994, PAC carried out a random sample survey of households to assess various dimensions of public satisfaction with respect to staff behavior, quality of service, information provided, and corruption (speed money).
The findings presented a generally pessimistic view. Some of the findings are given bellow
Levels of public satisfaction were low,
The public agencies were not citizen friendly 22 ECD WORKING PAPER SERIES - No. 12 JUNE 2004, An Assessment of the Impact of Bangalore Citizen Report Cards on the Performance of Public= Agencies, Adikeshavalu Ravindra,

Evaluation of Environmental Status Reports
Prepared by Maharashtra Pollution Control Board 101
They lacked customer orientation
Corruption was a serious problem, and the
People paid a heavy cost for the inefficiency of the public sector.

Evaluation of Environmental Status Reports
Prepared by Maharashtra Pollution Control Board 102
Annex VI. Indicator programmes of global reach
Indicator programme of global reach can be divided into 3 sub categories
A. Programs measuring progress toward global goals and declarations
B. Global rankings
C. Programme monitoring specific issues
D. Capacity building programmes
A. Programs measuring progress toward global goals and declarations
A number of indicator programs were established to monitor progress toward worldwide initiatives and goals such as the Millennium Development Goals, Habitat Agenda, and Local Agenda 21. These three initiatives established goals and targets for the world’s cities and countries to meet within specified timeframes. The goals and targets that arose out of the Millennium Declaration have become the framework for at least two global indicator programs: the Urban Indicators Programme administered by UN-HABITAT, and the Millennium Project, administered by the United Nations Statistics Division. While the previous two programs monitor the MDGs and Habitat Agenda, Cities Environment Reports on the Internet (CEROI) give cities a template for reporting the state of the environment pursuant to Local Agenda 21. Box 6 gives some details about these two programmes.
Box6. Global Indicator Programs measuring progress toward global goals and declarations
Urban Indicator Programme
The United Nations Human Settlements Programme (UN-HABITAT) began collecting urban indicators in 1991, with a focus on monitoring shelter performance. In order to address a larger number of global urban issues, UN-HABITAT created the Urban Indicators Programme in 1993. The purpose of the Urban Indicator Programme and its resulting databases is to provide a quantitative, comparative base for the condition of cities. The program is also intended to help cities monitor their progress toward the Habitat Agenda, adopted in 1996 to promote sustainable development in the world’s urban areas. UN-HABITAT uses “official” data (such as from the national census and UNICEF) to populate the indicators, but works with the data to apply data is generated through expert panels in individual cities.
UN-HABITAT uses the City Development Index (CDI) to rank cities along their levels

Evaluation of Environmental Status Reports
Prepared by Maharashtra Pollution Control Board 103
of development. The CDI serves as a baseline for cities and makes it possible to compare cities across indicators of urban conditions.
The CDI is based on the following five sub indices:
City Product: An estimate of the city level economic output, or essentially the gross national product GNP - of the city
Infrastructure: Water connections, sewerage, electricity, and telephone
Waste: Amount of wastewater treated and formal solid waste disposal
Health: Life expectancy and child mortality
Education: Literacy and combined enrollment
Millennium project
The Millennium Project also collects data to report on progress toward the Millennium Development Goals (MDGs) and Targets but on a country level. Indicators are collected for the world as a whole and for various country groupings. There are 48 indicators collected to help track global and regional progress towards the eight Millennium Development Goals and their 16 Targets.
City Environment Reports On the Internet
While the previous two programs monitor the MDGs and Habitat Agenda, Cities Environment Reports on the Internet (CEROI) give cities a template for reporting the state of the environment pursuant to Local Agenda 21, which was established at the United Nations Conference on Environment
and Development held in Rio de Janeiro in June, 1992. CEROI provides a template with standardized presentation of issues and indicators. SoEs report on 29 Core Indicators and 61 city-specific indicators. CEROI brings together a network of cities that want to make information about their environment available on the Internet in a standardized, comparable way. While this is a positive tool, SoEs are completely voluntary and to date only 39 cities have participated. Most cities only completed the report one time and most cities have not updated or filled out SoEs since between 1999 and 2002.
B. Global Rankings
Many indicator programs produce a composite score which is then used to compare cities around the globe in different categories such as “livability”, “quality of living”, or “best places to live”. These reports are often conducted by private companies, some on a fee basis. The Economist Intelligence Unit produced a report in 2002 to determine the best cities in the world for expatriates to locate. While results of this report are published publicly, methodologies and

Evaluation of Environmental Status Reports
Prepared by Maharashtra Pollution Control Board 104
sources of data are not readily available for public scrutiny since this group produces this report and others like it for a fee. Mercer Human Resource Consulting is another private, for fee, company that reports on quality of life worldwide through the use of surveys. Its “World-wide Quality of Living Survey” reports on 350 cities. Each survey assesses 39 criteria and cities are ranked against New York City which has an index score of 100 (City Mayors, 2006). Again, this for-fee company does not disclose the actual survey or its methodologies.
C. Programs monitoring specific issues
A number of indicator programs monitor trends in specific urban issues and create ways to compare one city to another on that specific issue. One example of this type is Globalization and Urban Performance (Leautier, 2006). This study focused on the fields of urban governance and globalization, and sought to test three hypotheses:
i. Governance matters;
ii. Globalization matters
iii. Globalization and governance interact positively.
Box 7 gives some more details about this program.
Box7. Global indicator programs monitoring specific issues
The authors selected indicators they thought were the best available to test their hypotheses. In doing this, they created a worldwide database for cities that contains variables and indicators of globalization (at the city and country level), city governance, and city performance (access and quality of service delivery). The database integrated existing data with new data collected by the researchers, which was then plugged into a formula to test the hypotheses. The results of the formula provided the authors with evidence that supported their hypothesis that governance matters. This study provides insight into the use of indicators to measure governance and city performance.
D. Capacity building programs
Many organizations throughout the world engage in capacity building exercises to help cities undertake the task of data collection in a meaningful and globally comparable way. These capacity building programs are not indicators in themselves, but are intended to enhance cities’ participation in global monitoring by improving how they collect data which can be used globally.
To this end UN-HABITAT has encouraged the establishment of Global, National and Local Urban Observatories throughout the world, to become the main data

Evaluation of Environmental Status Reports
Prepared by Maharashtra Pollution Control Board 105
collection center for countries and cities. To that end, Metropolis joined with UN-HABITAT on the Metropolis Commission 5 (C5). One of the main objectives of C5 was to support the establishment of metropolitan performance measurement systems in cities worldwide. C5 is intended to support cities in developing and collecting indicators that will measure progress toward Millennium Development Goal Target 11 (improvement in the lives of slum dwellers) and local and national development goals in participating cities.
Other organizations such as International Center for Local Environmental Initiatives (ICLEI), International City Managers’ Association (ICMA), and United Cities and Local Governments (UCLG) provide a network and venue for people interested in building indicator programs or becoming part of world-wide indicator programs.
Regional Indicator Programmes
Regional indicator programs are fewer in number than the global ones, but are of similar types. Regional programs address cities within specific regions, frequently within the same continent.
The regional programs are often only conducted once, making it impossible to compare trends over time, a major goal of many indicator programs.
Similar to Global Indicator Programmes, regional programmes broadly have following categories. Programmes which
A. Build capacity and develop methodology
B. Monitor urban issues
C. Rank the cities
A. Programme which build capacity and develop methodology
An example is the Cities Data Book (Villa and Westfall 2001), which focused on 18 cities in Asia and Australia. The ultimate goal for this program was to help cities build capacity and develop methodologies for measurement and evaluation of indicators. While the program developed many indicators with specific definitions and methodologies it has not been replicated. The book contains useful background information and discussion of theory.
B. Programmes which monitor urban issues
Some regional programs monitor urban issues and trends in cities across regions rather than across the globe. The European Commission’s European Common

Evaluation of Environmental Status Reports
Prepared by Maharashtra Pollution Control Board 106
Indicators is a set of 10 indicators focusing on monitoring environmental sustainability at the local level throughout Europe.
C. Programmes for ranking of cities
Some regional programs rank cities, usually based on quality of life measurements. Asia Week Magazine ranked 40 cities in Asia in 1998 for quality of life using 24 indicators. Similar to the global ranking reports, this report produced interesting results for those cities at the top of the list, but offered few useful insights to the others. Regional capacity building programs include the International Sustainability Indicators Network and the Community Indicators Consortium (both mostly North America).
National Indicator Programmes
National indicator programs present information for cities within a single country or for a region within a country. These programs have a data advantage over global and regional programs in that they can frequently make use of data and statistics collected by the national government. Much interesting and innovative work is being done at the national level, especially in Canada, Colombia, New Zealand, the United Kingdom, and the United States.
A. Quality of life
Many of these programs collect data and create indicators which measure the quality of life across cities within their respective countries. Some examples are given in Box-8 below.
Box8. National Indicator Programmes
Quality of Life Reporting System, Canada
The Federation of Canadian Municipalities’ (FCM) Quality of Life Reporting System (QOLRS) monitors the social, economic, and environmental health for 20 cities. Member cities pay a small fee to FCM ($4,500 in 2006, due to rise to $6,700), but then receive the QOLRS results annually. This gives member municipalities the ability to track their progress over time and among other member municipalities. QOLRS was published in 1999, 2001, and 2004.
Quality of Life Project, New Zealand
New Zealand’s Quality of Life Project is similar, and is based, in part on FCM’s QOLRS. This project has grown from six to 12 cities focused on social, economic and environmental indicators, and is used by decision makers throughout New Zealand. It is endorsed by the chief elected official of each city.
B. Specific urban issues

Evaluation of Environmental Status Reports
Prepared by Maharashtra Pollution Control Board 107
Some national indicator programs collect information regarding specific urban issues. Such country-specific issues give these programs a framework on which to develop indicators. An example is the Best Performing Cities Index produced by the Milken Institute, a publicly supported economic think tank in the United States. This report ranked 379 metropolitan areas in the United States based on their economic performance and ability to create and keep the greatest number of jobs (Milken Institute, 2006).
A number of other types of groups and organizations are active in city indicator work at the national level. Private companies such as Jones Lang LaSalle and SustainLane produce a variety of types of indicator reports – some for a fee and some as a service. SustainLane, for example, in 2006 measured the 50 largest cities in the US on quality-of-life and economic factors affecting personal sustainability.
Research organizations, foundations, and professional organizations are also important, again especially in North America. For example, the Alfred P. Sloan Foundation supports governments and nongovernmental organizations to make government performance measurement more widespread, and the Association of Government Accountants encourages the regular issuance of high-quality service efforts and accomplishments reports.
Individual city initiatives
Virtually all cities around the world collect data and statistics, and most use them to form indicators of some kind. Some of the most innovative work on indicators globally is being done at the individual city level, much of it focused on providing very detailed, locally-oriented information to elected officials, city managers, and citizens about city government performance and about conditions citywide and in neighborhoods.
Box-9 gives examples of innovation, creativity, and level of effort at the individual city level.
Box9. Individual City Indicator Initiatives
Belo Horizonte, Brasil
Belo Horizonte is the capital city of the state of Minas
Gerais. It is the third main urban center of the country, fifth in population, with approximately 2.3 million people. The Metropolitan Region of Belo Horizonte is third in economic and
demographic importance of Brazil, possessing approximately 5 million inhabitants. The city is also a place of intense cultural activity.
Belo Horizonte started selecting indicators to evaluate the municipal performance in the mid 1990s. Some of its programs are internationally recognized, such as its “Locating the

Evaluation of Environmental Status Reports
Prepared by Maharashtra Pollution Control Board 108
Millennium Development Goals” program that monitors the city efforts to achieve the Goals, and its social exclusion maps that demonstrate the exclusion to which part of the population of Belo Horizonte is exposed. Belo Horizonte has gone further than most cities in its use of its four major Indexes in the formal decision making process of city managers. Belo Horizonte’s process benefits from its transparency and methodological soundness.
Montréal, Canada
Montreal has consistently been a world and national
leading city in many areas, undertaking such major
international events as hosting the Expo 67, World’s
Fair, the 1976 Summer Olympics and the signing of the
Montreal Protocol in 1987.
Montreal collects a large number of indicators in support of a common vision for
the new city created in 2002 when the independent municipalities of the island of
Montreal was merged with the City of Montreal to create a unified City of Montreal.
Bogotá, Colombia
Bogotá is not only the capital of Colombia but also a considerably large and complex cosmopolitan city in continuous expansion. During the last decade, it has become the fastest growing metropolitan area, not only in Colombia
but also in whole South America.
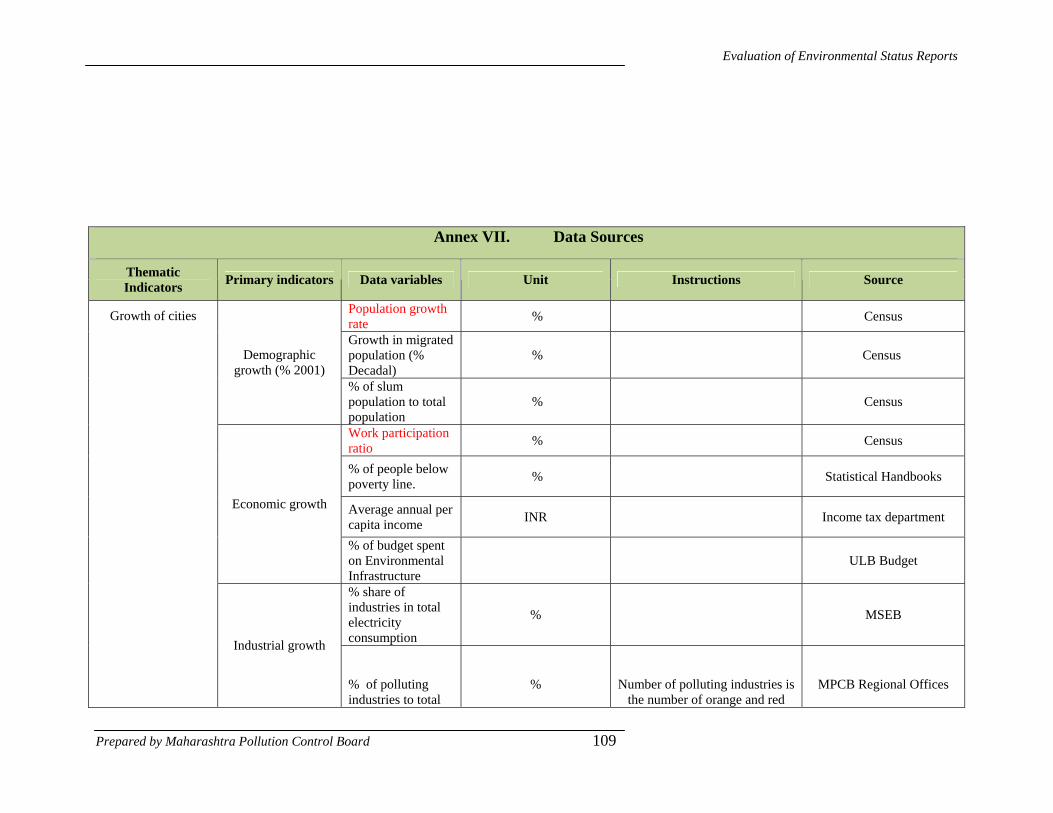
Evaluation of Environmental Status Reports
Prepared by Maharashtra Pollution Control Board 109
Annex VII. Data Sources
Thematic Indicators Primary indicators Data variables Unit Instructions Source
Population growth rate % Census
Growth in migrated population (% Decadal)
% Census Demographic growth (% 2001)
% of slum population to total population
% Census
Work participation ratio % Census
% of people below poverty line. % Statistical Handbooks
Average annual per capita income INR Income tax department
Economic growth
% of budget spent on Environmental Infrastructure
ULB Budget
% share of industries in total electricity consumption
% MSEB
Growth of cities
Industrial growth
% of polluting industries to total
% Number of polluting industries is the number of orange and red
MPCB Regional Offices

Evaluation of Environmental Status Reports
Prepared by Maharashtra Pollution Control Board 110
industries to be entered.
Population density Persons/sq Km Census Spatial growth
(Decadal) % of slum area to city area % Census
Landuse
Number of uses e.g residential, commercial
etc. complying with UDPFI guidelines
% for different land uses are given in ESRs. These have to be
compared with UDPFI Guidelines and the nuber of uses complying with guidelines to be
entered.
Town planning department
% of green area to the total city area % Town planning department
Land
Green area per 1000 persons Ha/person
To be calculated from total green area of the city and total population of the city.
Town planning department
State of resources
Air Ambient air quallity
Number of parameters e.g. Sox, Nox, CO etc. complying with CPCB
Guidelines
Ambient air quality given in ESRs to be compared to the
CPCB standards and number of parameters complying with
standards should be entered. In case of multiple readings,
compare the two readings with highest values.
MPCB Regional Offices

Evaluation of Environmental Status Reports
Prepared by Maharashtra Pollution Control Board 111
Noise % of critical junctions
not complying with noise standards
The data for noise quality is given for various junctions in
ESRs. These are compared with ambient noise standards and
number of junctions not complying with standards to be
entered. In case of multiple readings, compare the two
readings with highest values.
MPCB Regional Offices
% of untreated industrial effluent discharged
%
Water quality-Sea
Number of parameters e.g. pH, TDS, BOD
complying with MPCB Guidelines
MPCB Regional Offices
Water quality-River
Number of parameters e.g. pH, TDS, BOD
complying with MPCB Guidelines
MPCB Regional Offices
Water
Water quality-Lakes
Number of parameters e.g. pH, TDS, BOD
complying with MPCB Guidelines
Water quality given in ESRs to be compared to the CPCB standards and number of
parameters complying with standards should be entered. In
case of multiple readings, compare the two readings with
highest values. MPCB Regional Offices
Per capita energy consumption Kwh Annual for 2000-01 Maharashtra Energy
Development Agency Share of renewable energy % Maharashtra Energy
Development Agency Energy Annual fuel consumption- Petrol
Lakh Lts
Human Crude death rate % Census

Evaluation of Environmental Status Reports
Prepared by Maharashtra Pollution Control Board 112
Infant mortality rate % Census
Net LPCD lpcd
% of households connected by service connection
%
Unaccounted for water %
Average tariff Rs/cum
Water Supply
Staff per 1000 connections Persons
Water supply department
% of population catered to by underground sewer network
%
% area covered with collection to total city area
%
% of slum population served by pay & use toilets
%
% of untreated sewage %
Sewerage Sanitation
Staff per 1000 connections Persons
Sewerage Department
Total SW generated per capita
gm
Urban services
Solid Waste Mgmt
Life of landfill site Years
Solid Waste Management Dapartment

Evaluation of Environmental Status Reports
Prepared by Maharashtra Pollution Control Board 113
% of waste disposed into landfill site to total waste generated
%
% of waste collected to total waste
%
Compliance with MSW Rules
Score. Please refer the user manual to understand calculation of the score
Use this link to enter data
% biomedical waste treated to total BM waste
%
% of Wet waste treatment at ward level
%
Road area as % of ward area % Town Planning Department
% of population travelling by public transport
% Regional Transport Authority Transport
% of accidents in city to number of accidents in India
% Regional Transport Authority

Evaluation of Environmental Status Reports
Prepared by Maharashtra Pollution Control Board 114
Annex VIII. Ekovoices
(An eco-friendly Community)
Ekovoices is the attempt to connect all components of “City”. This has been developed for Mumbai city under MCGM governance. It has been developed by EMC and was launched in collaboration with Mumbai Festival.
It uses freely available Google maps as background.
It aims the betterment of the city by following means
Awareness towards environment It is important to get community involvement in identification of issues and initiatives Develop sense of Ownership towards City, its infrastructure, and overall environment Active participation of all (communities, experts, administration) in defining the Action
Plan for the City “Watch” on implementation with pro-activeness by all
Ekovoices as a tool
Ekovoices can be used as a tool to integrate all stakeholders for the City.
At present, ALMs are the nodes for people to get connected with the issues, initiatives and administration, but limited to some population
Web / internet is being used extensively in City by people in all strata Internet based tool will open up an opportunity to get connected with all on one platform
without any limitation of area, background, qualification, etc More people will involve and share, better will be City Environment

Evaluation of Environmental Status Reports
Prepared by Maharashtra Pollution Control Board 115
“Ekovoices” is developed aiming the strong connection with all at all levels of management, starting from understanding the issues to resolving them.
What is Ekovoices?
Aims to create Eco friendly Community Interactive channel to communicate, connect and build connections with different group
of people. To provide channel to citizens to report their concerns, share initiatives To form a network of like-minded people for action To form a pool of thematic expertise To share content and learn about Mumbai’s Environment Participation in discussion forums
Homepage
Adding Information about Issues and Initiatives –

Evaluation of Environmental Status Reports
Prepared by Maharashtra Pollution Control Board 116
Annex IX. Model Table of Contents
1. Executive Summary
2. Preamble to ESR
3. Background of ESRs
[What is ESR? Why do cities need to publish ESR? Role of ESR in improving the city environment]
4. ESR Preparation Process
[Details of the process that was followed for ESR preparation ad how it is different from past ESRs]
5. ESR Committee
[Details of the committee. Members, headed by, contribution of the committee in the ESR preparation]
6. Review of previous ESRs
7. Key issues the city has been facing
8. Environmental Trend
9. Action Plan
9.1. Vision Statement
9.2. Mission Statement
9.3. Goals & Objectives
10. Situation Analysis
10.1. Driving Forces
Population Growth
Driving forces for population growth
Population growth of city
Migration patterns in the city
Work participation
Literacy
Age sex pyramid
10.2. Economic Growth
Economic profile of the city
Economic drivers
Average annual income
% population below poverty line
10.3. Industrial Growth

Evaluation of Environmental Status Reports
Prepared by Maharashtra Pollution Control Board 117
Small and Medium scale industries
Pollution from industries
11. State of Resources
[Pressures‐State‐Impacts on resources]
11.1. Water
[Surface water & ground water]
Overview of city water resources
Water quality‐critically polluted areas
Causes of pollution
11.2. Land
Landuse of city
Change in landuse
Status of Green areas of the city
11.3. Air
Air quality
Causes of air pollution
11.4. Energy
[Overview of power supply of the city]
Sources
Break up of energy consumption as per use
Per capita energy consumption
11.5. Community
Health impacts of pollution
Mortality rate
Infant mortality rate
11.6. State of Urban services
[Assessment of service levels and service efficiency]
11.7. Water Supply
Water supply sources
Net water supply
Water consumption
Water tariff system
Water losses

Evaluation of Environmental Status Reports
Prepared by Maharashtra Pollution Control Board 118
11.8. Sewerage Sanitation
Present network (Area covered, population served, sewage collected etc.)
Status of Sewage treatment Plants (No. of Plants, Locations, Treatment capacities, plants in working condition etc.)
11.9. Solid Waste Management
Waste generation (Per capita waste generation,
Waste collection
Waste disposal (Landfill site, disposal of wet waste, Bio Medical Waste etc.)
11.10. Transportation
Status of public transport
12. Environmental performance of the City
[Application of the Indicator Framework to the data]
12.1. Introduction to the indicator framework
12.2. Environmental Performance Index for the city
12.3. Trend analysis
13. Action Plan 2009
13.1. Vision 2009
13.2. Vision statement
13.3. Mission statement
13.4. Goals
13.5. Objectives
14. Environmental Issues
[Root cause analysis of the issues. Identification and prioritization of gaps] For example Deteriorating Air Quality Areas of concern: Increasing amount of vehicles in the city Barriers: Lack of efficient public transport Response of various stakeholders Critically polluted nallahs and river stretches Areas of concern: Increasing amount of untreated sewage in the local nallahs and rivers Barriers: Lack of adequate sewage collection and treatment facilities Response of the stakeholders Proposed projects [Structure of Policy‐Programme‐Plan‐Projects and the Action Plan 2009]
15. Observations and conclusions
Top Related